Trends in Geographic Sensitivity of Marine Fishes Over Decades in the North Sea
 Chih-Wei Tu
 Yin-Zheng Lai
 Hsiao Chien Chen1
  Chi-Yun Kuo
 Chia-Ying Ko
- 1Institute of Fisheries Science, National Taiwan University, Taipei City, Taiwan
- 2Department of Biomedical Science and Environmental Biology, Kaohsiung Medical University, Kaohsiung City, Taiwan
- 3Institute of Ecology and Evolutionary Biology, National Taiwan University, Taipei City, Taiwan
- 4Department of Life Science, National Taiwan University, Taipei City, Taiwan
- 5Department of Biochemical Science and Technology, National Taiwan University, Taipei City, Taiwan
Accounting for biotic interactions is important for predicting species and ecosystem variation under changing climate but difficult to achieve in practice. The proportion of geographical overlap between species, called species geographical sensitivity (SGS), could be used to gauge the potential for species interactions. Species with increasingly high SGS could have the potential to experience more interactions with other species and vice versa, which might have important implications in ecological assessment, particularly at a community level, in the face of climate change. We compiled fish occurrences in the North Sea from 1983 to 2020 and calculated annual mean SGS (mSGS) to systematically evaluate their temporal changes and to estimate influences of species traits on the relative temporal changes in mSGS. The results showed that 36.3% of species significantly changed their mSGS over time, with high correlations between changes in species range size and overlap with other species. The species’ averaged mSGS before warming was highly correlated with the relative change in mSGS. Depth range, body length, and age at maturity together explained most variation in mSGS among these species. Contemporary climate change is expected to reorganize species distributions and interactions and substantially alter marine ecosystem functioning. Our assessment opens a new avenue for evaluating climate change impacts on species geographical interactions, and such geographical changes may be contingent on species traits.
Introduction
With understandings of climate change impacts on shifts in species distributions and community composition and structure, consideration of biotic interactions in ecological and conservation assessment processes, particularly at the macroecological scale, is necessary (Araújo and Luoto, 2007; Araújo et al., 2011). Accounting for biotic interactions is important for predicting responses of species and ecosystems to future climate conditions because it could distort expectations of species and ecosystem variation and need to rethink resource management and conservation goals to ultimately mitigate climate change (Dawson, 2011; Jones and Cheung, 2018). However, it usually exists difficulties to achieve directly. Patterns of co-occurrences between species have traditionally been used as a proxy for intensity of species interactions. One commonly used approach for gauging the potential for biotic interactions is proportion of geographical overlap between species, called species geographical sensitivity (SGS, Araújo et al., 2011; Griffith et al., 2018). Although a challenge for equating SGS values as the intensity of species interactions often exists, this index nevertheless hints at the potential for such interactions to occur (Araújo et al., 2011; Blanchet et al., 2020). Species with high geographical sensitivity could have the potential to experience more interactions with other species, which in turn might have important implications in the face of climate change (Araújo et al., 2011).
Species range size and overlap with other species are two main geographical characteristics that determine SGS and their joint gradient can offer a way to explain spatial contingency in geographical properties of biotic interactions among species in an ecosystem. Basically, a species with a high degree of overlap with other dependent species and a small individual range size should have high sensitivity, and vice versa (Figure 1). As a species shifts its range under warming, there are four simple scenarios regarding its spatial overlap with the other species: (1) although a species maintains its range size under climate change, its range shifts, leading to a decrease in overlap with the other dependent species; (2) a species expands its range size but remains in original areas that overlap with those of the other dependent species; (3) a species increases both its range size and degree of overlap with the other dependent species, while the former increases more than the latter; and (4) on the contrary, a species decreases both its range size and degree of overlap with the other dependent species, while the former decreases more than the latter. Although the changes in nature are more complicated than those in these examples, the finding that individual species’ geographical sensitivity responds to synergistic effects between species range size and overlap with other species may provide a new way to understand how different species may adapt to contemporary climate change.
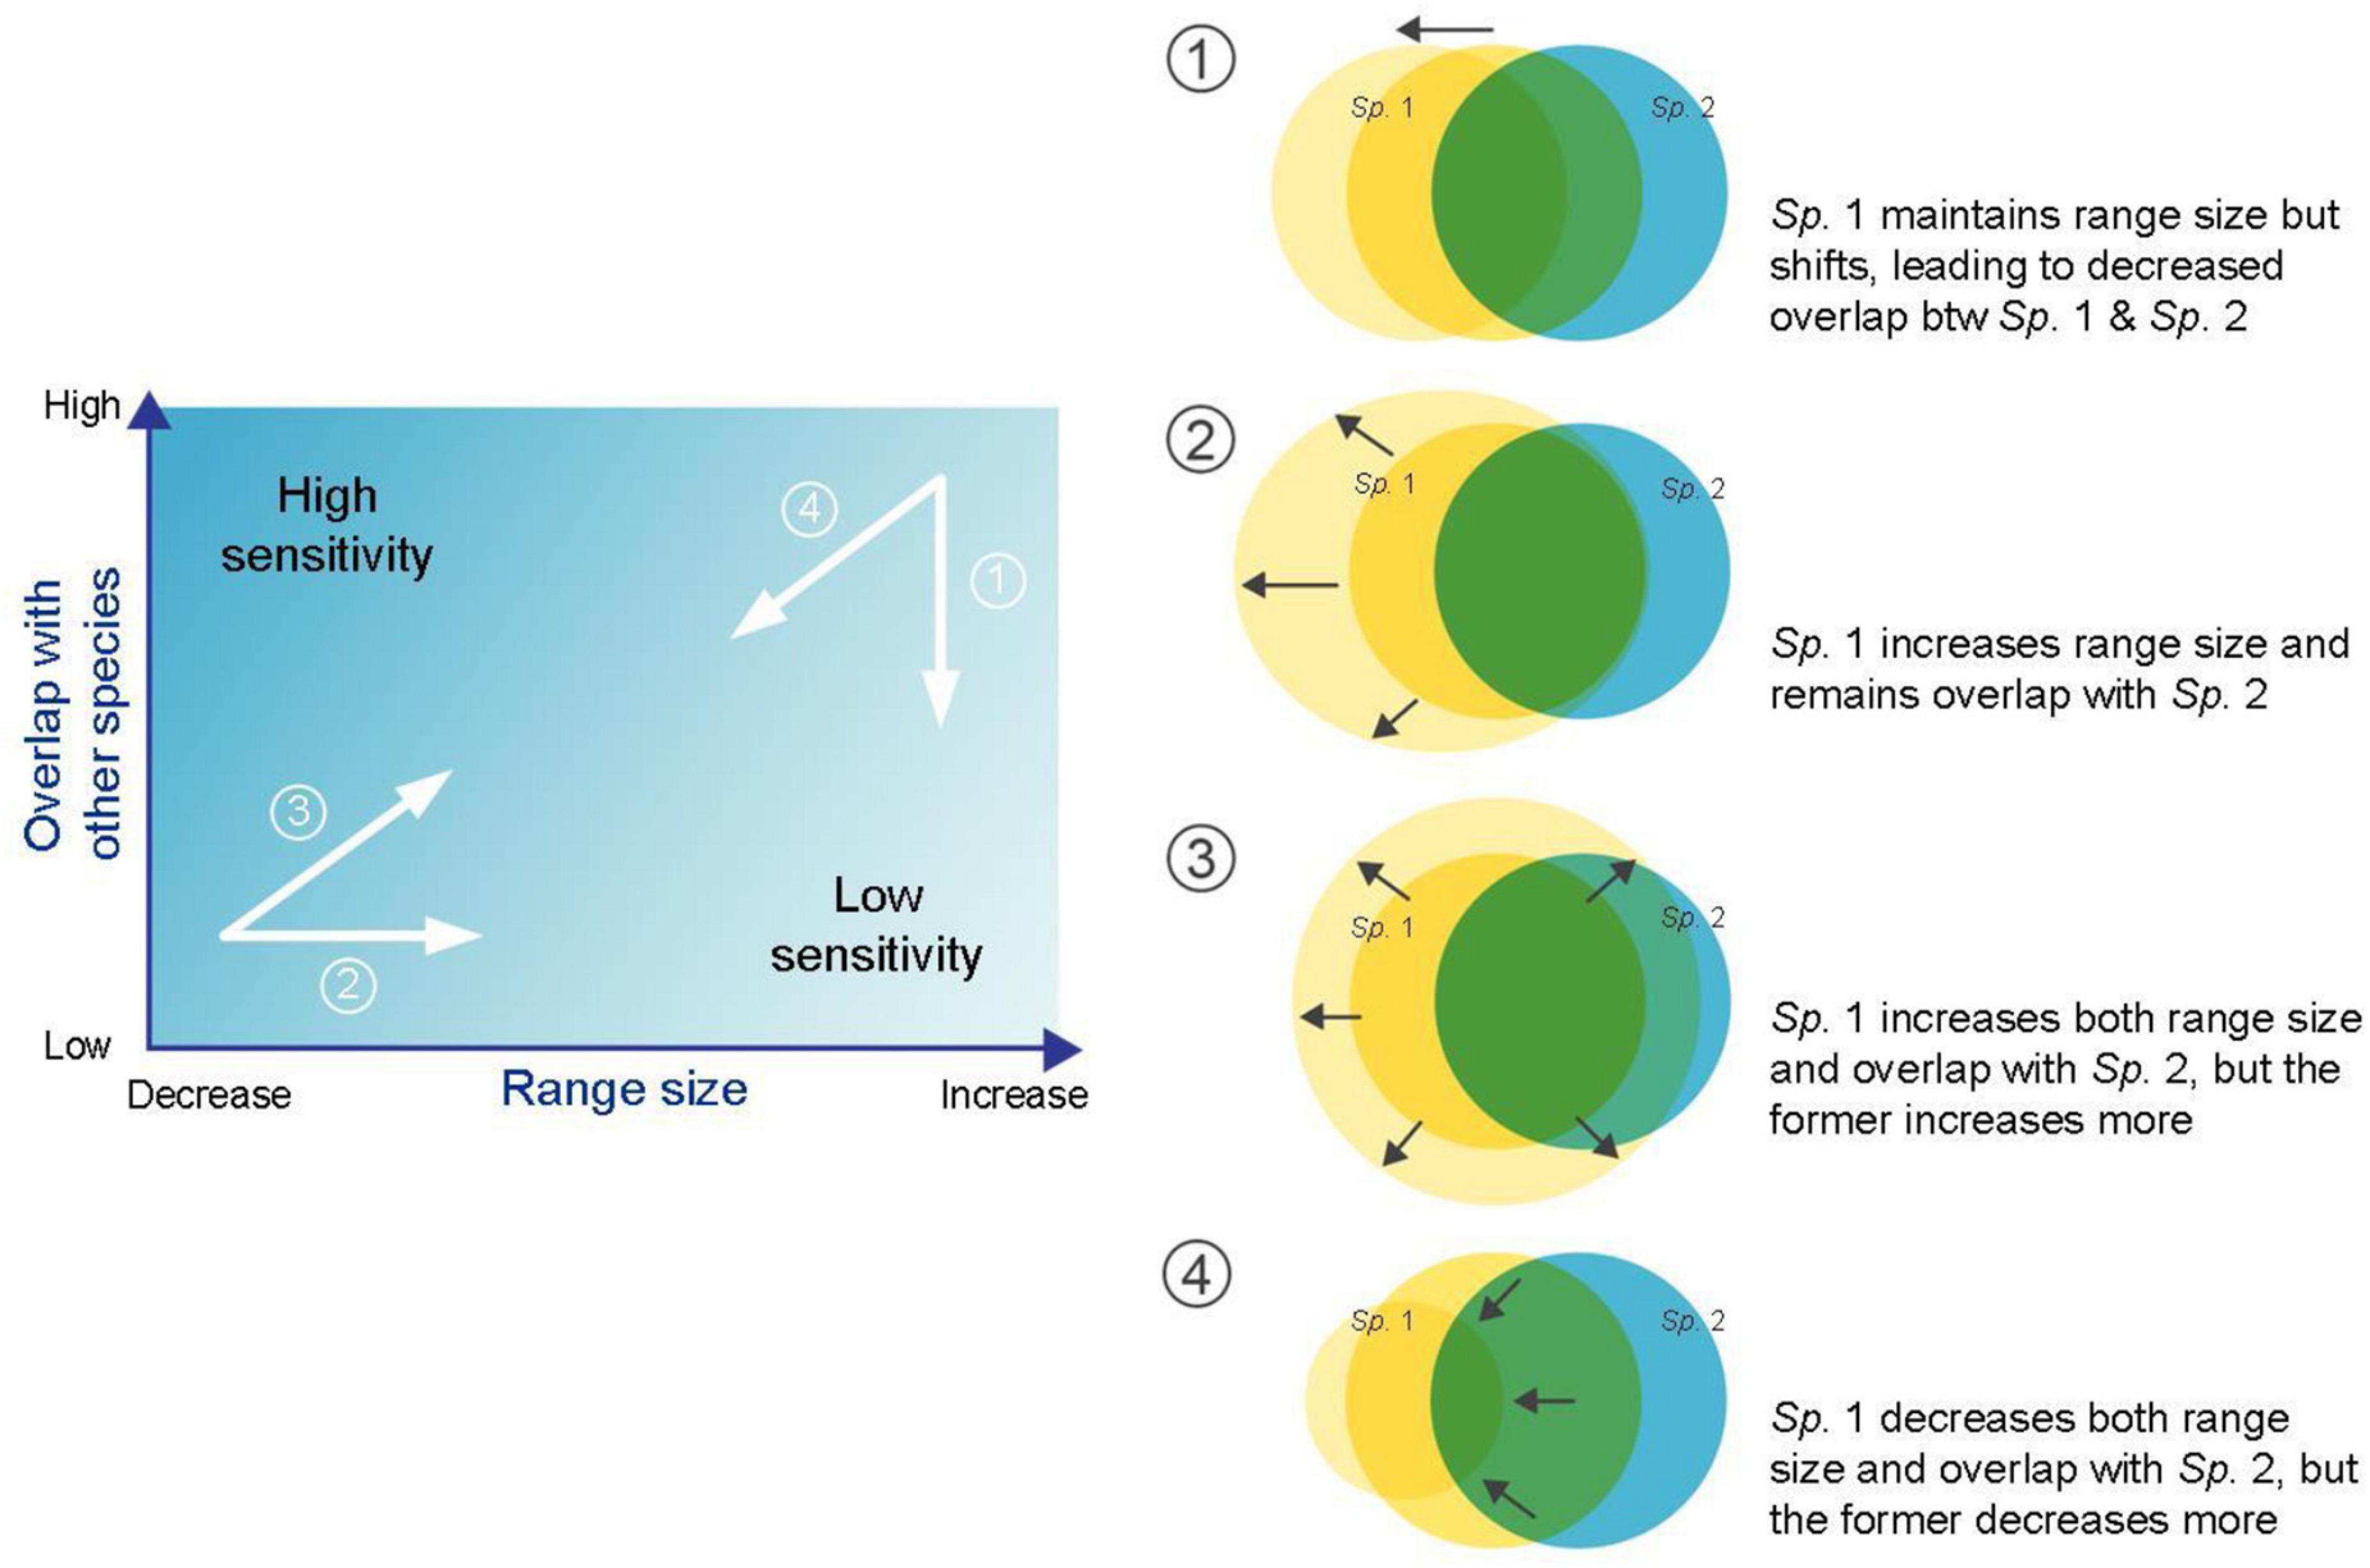
Figure 1. Schematic diagram representing two main geographical characteristics, i.e., species range size and overlap with other species, used to determine species geographical sensitivity. Four examples are shown when focusing on changes in Sp. 1.
Moreover, further exploring temporal changes in SGS may provide an additional opportunity for revealing the potential resistance of species to climate change disturbance. Species resistance to disturbance and consequent community resilience after disturbance, i.e., how individual species and ecosystems react to and recover from disturbances, can provide a basis for increasing the capacity of ecosystems to absorb, persist under, and adapt to inevitable and unpredictable changes such as climate change (Papaik and Canham, 2006; Curtin and Parker, 2014; Chambers et al., 2019) and for taking advantage of management opportunities to transform systems to more desirable states.
In addition, species’ traits, with renewed foci in recent years, are thought to be as species-specific adaptive capacities to mediate species move to more suitable locations (Dawson, 2011). Species traits are defined as characteristics of biological phenotypes related to species’ life history, morphology, physiology, behavior or phenology, and provide species opportunities to resist threats by changing feeding, growth, and reproduction (Garcia et al., 2014; Beukhof et al., 2019a,b). Considering species traits as additional factors influencing species’ geographic patterns not only provides stronger explanatory power than when merely using environmental variables (Sunday et al., 2015), but also enables a potential mechanistic explanation of species’ responses to disturbances, such as adaption in situ or distributional shifts (Garcia et al., 2014). For example, traits related to plasticity in physiology and behavior, such as high temperature tolerance and adapted growth and reproductive strategies, might affect species persistence in situ under unfavorable climate conditions (Lester et al., 2004; Estrada et al., 2016; MacLean and Beissinger, 2017). Moreover, traits corresponding to dispersal ability would enable species to colonize newly suitable environments (Guha et al., 2013; McCauley et al., 2015). Despite traits being valuable evidence-based tools for conservation and management (Estrada et al., 2016; MacLean and Beissinger, 2017; Sequeira et al., 2018; Polivka, 2020), empirical evidence on the links between species’ traits and long-term geographical interactions in specific areas remains limited.
Here, we used a spatially standardized dataset for marine fishes to understand how fish species responded to climate change when estimating through geographical interactions. Specifically, we assessed temporal changes in SGS not only as a proxy for geographical interactions among species but also with regard to the influence of the magnitude of relationships between species range size and overlap with other species over decades. The species traits were then associated with SGS dynamics to explore their contributions to patterns and processes in the geographical ranges of fish species and potential involvement in the ability of fish species to adapt to future climatic variation. We focused on the high-latitude North Sea, which has been observed to have higher increases in sea surface temperatures than the global average (Figure 2; Sündermann and Pohlmann, 2011; Hobday and Pecl, 2014; McLean et al., 2019). Previous studies have demonstrated species redistributions resulting from northward or deeper shifts and changes in richness and functional diversity, thus increasing the potential reorganization of species’ geographical interactions in the North Sea (Perry et al., 2005; Dulvy et al., 2008). This study provides a biogeographically informative assessment of marine fish species under warming during the past four decades.
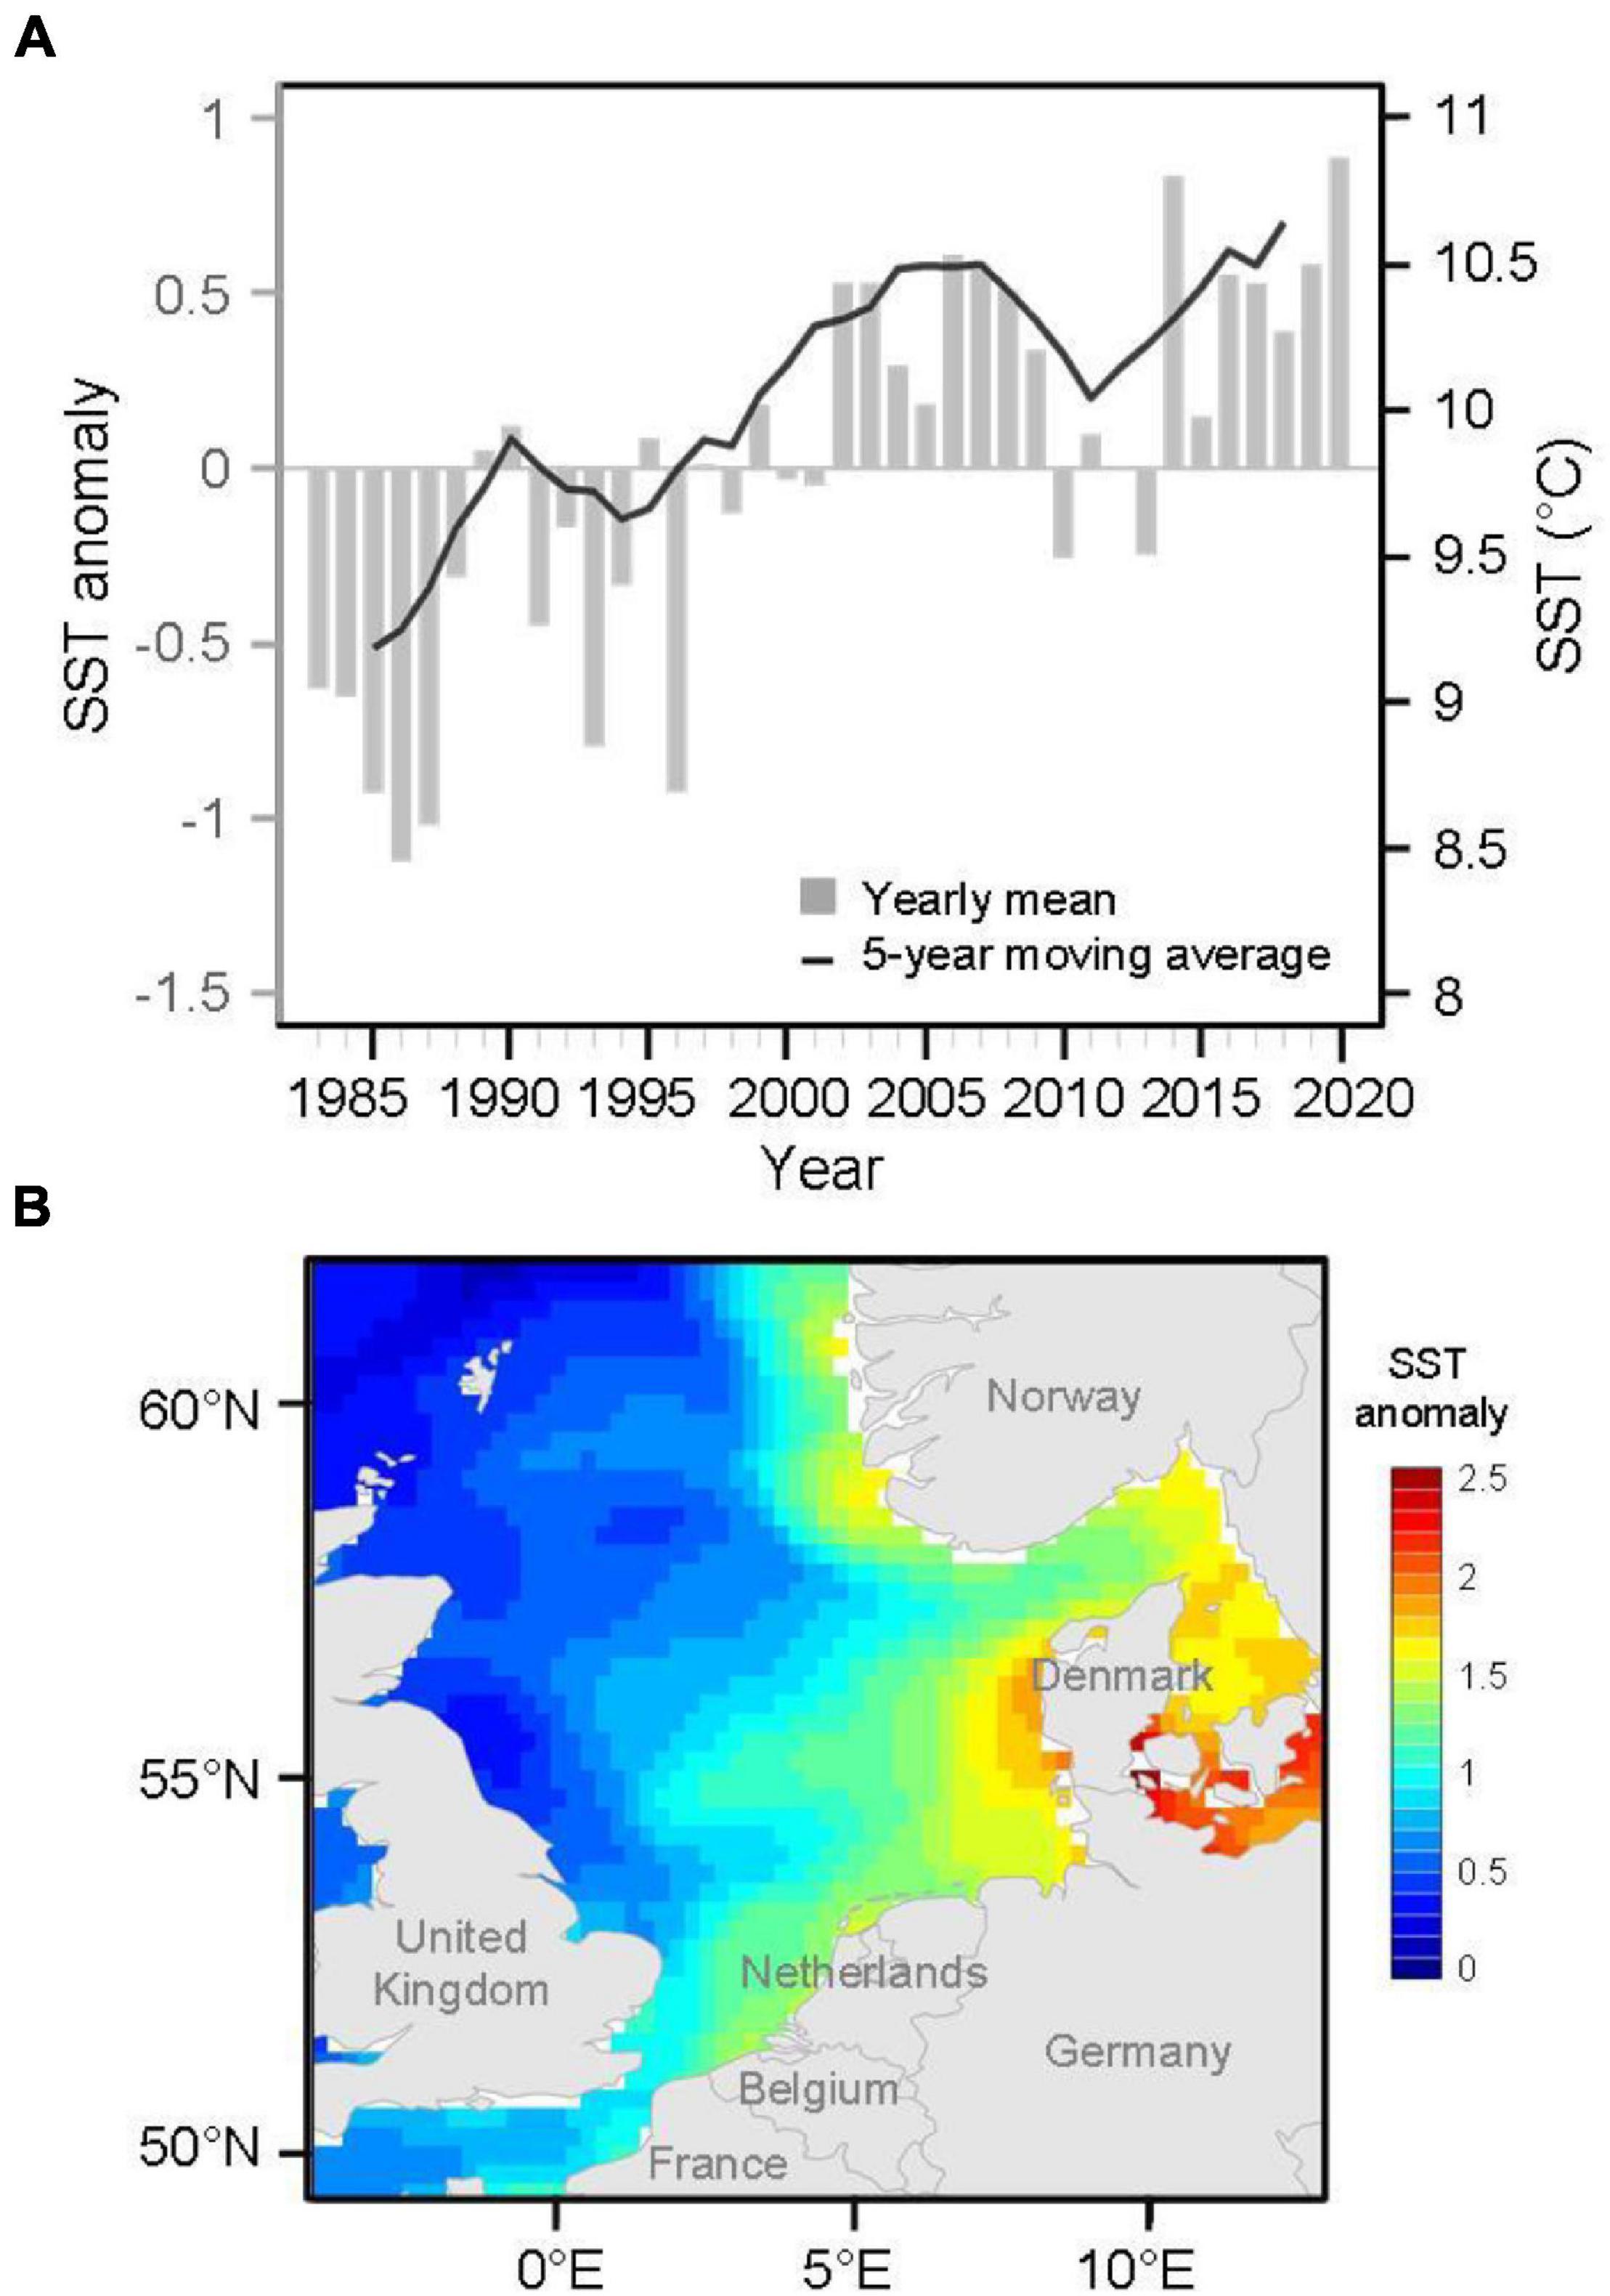
Figure 2. (A) Anomalies of annual mean sea surface temperature (SST) time series with a 5-year moving average and (B) spatial patterns of SST anomalies in 2020 in the North Sea. Annual SST anomalies were calculated with respect to 1983–2020 climatology.
Materials and Methods
Species Data
We compiled fish occurrence records in the first quarter from 1983 to 2020 based on the North Sea International Bottom Trawl Survey (NS-IBTS), which has regularly conducted bottom trawl surveys with standard gear types, i.e., a GOV trawl, a 30-min trawling duration, and depths from 10 to 200 m in rectangles of 0.5° latitude by 1° longitude in the first quarter of the year. The taxonomic classification of fish species based on the occurrence records was performed using both FishBase1 and the WoRMS match tool.2 A probabilistic model was applied to eliminate effects of accidental interactions between species during the study period (Veech and Peres-Neto, 2013). Species with a significant pairwise association higher than ± 0.05 in the model and without occurrences for at least 5 years were regarded as random species in the study area and removed. The range maps of individual species were first defined by connecting species’ occurrence records to create a convex polygon every year in ArcGIS Version 10.5. Species distribution grids for every year were then transformed into presence and absence data at a 0.5° spatial resolution based on their range maps. A total of 124 species occupying 352 of 376 grids in the North Sea (176°E to 12.75°W; 49.5°N to 61.75°N) were finally analyzed.
Species Geographical Sensitivity
The SGS was used to evaluate the strength of geographical interactions of a target species to the loss of potential interactions with all other species (Araújo et al., 2011; Griffith et al., 2018). To better assess and standardize species’ differences and to minimize effects of different numbers of interacting species, we further calculated mean SGS (mSGS) by summing proportions of overlapping area of species A with all other species B1…n divided by the number of species that the target species A interacts with, i.e., n:
where O(A, B) represented the overlapping area of species A with species B and was also regarded as species spatial co-occurrences. Here, mSGS could also represent the degree of independence when the target species A might lose interactions with other species. That was, high mSGS implied that a species was potentially highly dependent on another/other species and would be highly sensitive to disappearance of the other species.
Species Traits
Six species traits related to life history, habitat preference, morphology, and trophic level (TL) of each species, including age at maturity (AAM), habitat affinity (HA), depth range (DR), latitudinal range (LR), total body length (BL), and TL, were selected. The AAM affects growth rate and generation time and determines proliferation capability (Lester et al., 2004; Minte-Vera et al., 2016; Honsey et al., 2017). The HA influences species’ site (in) fidelity, mobility and habitat requirements and thus the emigration of species (Carrasco et al., 2017; Sequeira et al., 2018; Polivka, 2020). Species with larger DRs and LRs are expected to physiologically tolerate a wider range of climate variation, which ultimately aids in establishment and colonization (Sunday et al., 2011). The BL is positively correlated with fecundity, adult motility and dispersal potential (Guha et al., 2013; McCauley et al., 2015). The TL determines a species’ response to resource availability, and species at higher TLs are considered to be relative generalists, which facilitates finding resources in new areas (Kortsch et al., 2015; Hayden et al., 2019). Although multicollinearity among some species trait variables might exist, considering different ecological relevance of individual variables to fish species, all trait variables were finally used in the study.
The species trait data were collected from FishBase. The HA was originally categorized into seven groups: pelagic-oceanic, pelagic-neritic, demersal, benthopelagic, bathypelagic, bathydemersal, and reef-associated. Species belonging to the first two groups were classified as pelagic species, while those belonging to the following four groups were classified as demersal species. The species in the last group were classified as reef-associated species. Each species’ DR was derived from differences between maximum and minimum recorded depths. The LR was calculated as the north-to-south extent of the species.
Data Analyses
To understand species’ decadal changes in geographical interactions, associations of year with mSGS, range size and overlap with other species were quantified for each species using regression models. The Pearson correlation was used to determine the relationship between time-series mSGS and species’ averaged mSGS recorded before 1995, i.e. before warming, to understand whether initial species geographical features would influence subsequent species’ geographical interactions. The main drivers of relative change in mSGS, i.e. slopes of regressions of individual species, among the species traits was determined by generalized additive models (GAMs). Only species with all six traits and without trait features outside 1.5 times the interquartile trait range (above the upper quartile and below the lower quartile) were included in the GAMs to better explore relationships between species traits and relative change in mSGS. Non-parametric smoothing functions were implemented in the GAMs as linked functions to address these hypothesized non-linear and non-monotonic relationships. The best model was selected and explained on the basis of Akaike’s information criterion (AIC). All statistical analyses were performed using R v3.6.2 (R Core Team, 2019).
Results
Over the past decades, approximately 36.3% of fish species in the North Sea showed clear trends in mSGS with time (36 demersal and 9 pelagic species out of 124 species, relative change in mSGS varying from −0.011 to 0.008), with 36 species (28 demersal and 8 pelagic) showing significant declines in mSGS, implying their greater geographical independence compared with that of other species under a warming climate in the North Sea, whereas nine species (eight demersal and one pelagic) showed increases (Figure 3A). The species’ averaged mSGS before 1995, before warming, was highly correlated with the relative change in mSGS (r = −0.32, p < 0.001), particularly the species with significant decreases in the relative change in mSGS (r = −0.72, p < 0.001). The results indicated that species with large mSGS before warming decreased more in mSGS over decades and shifted their geographical interactions from dependence to independence under warming (Figure 3B).
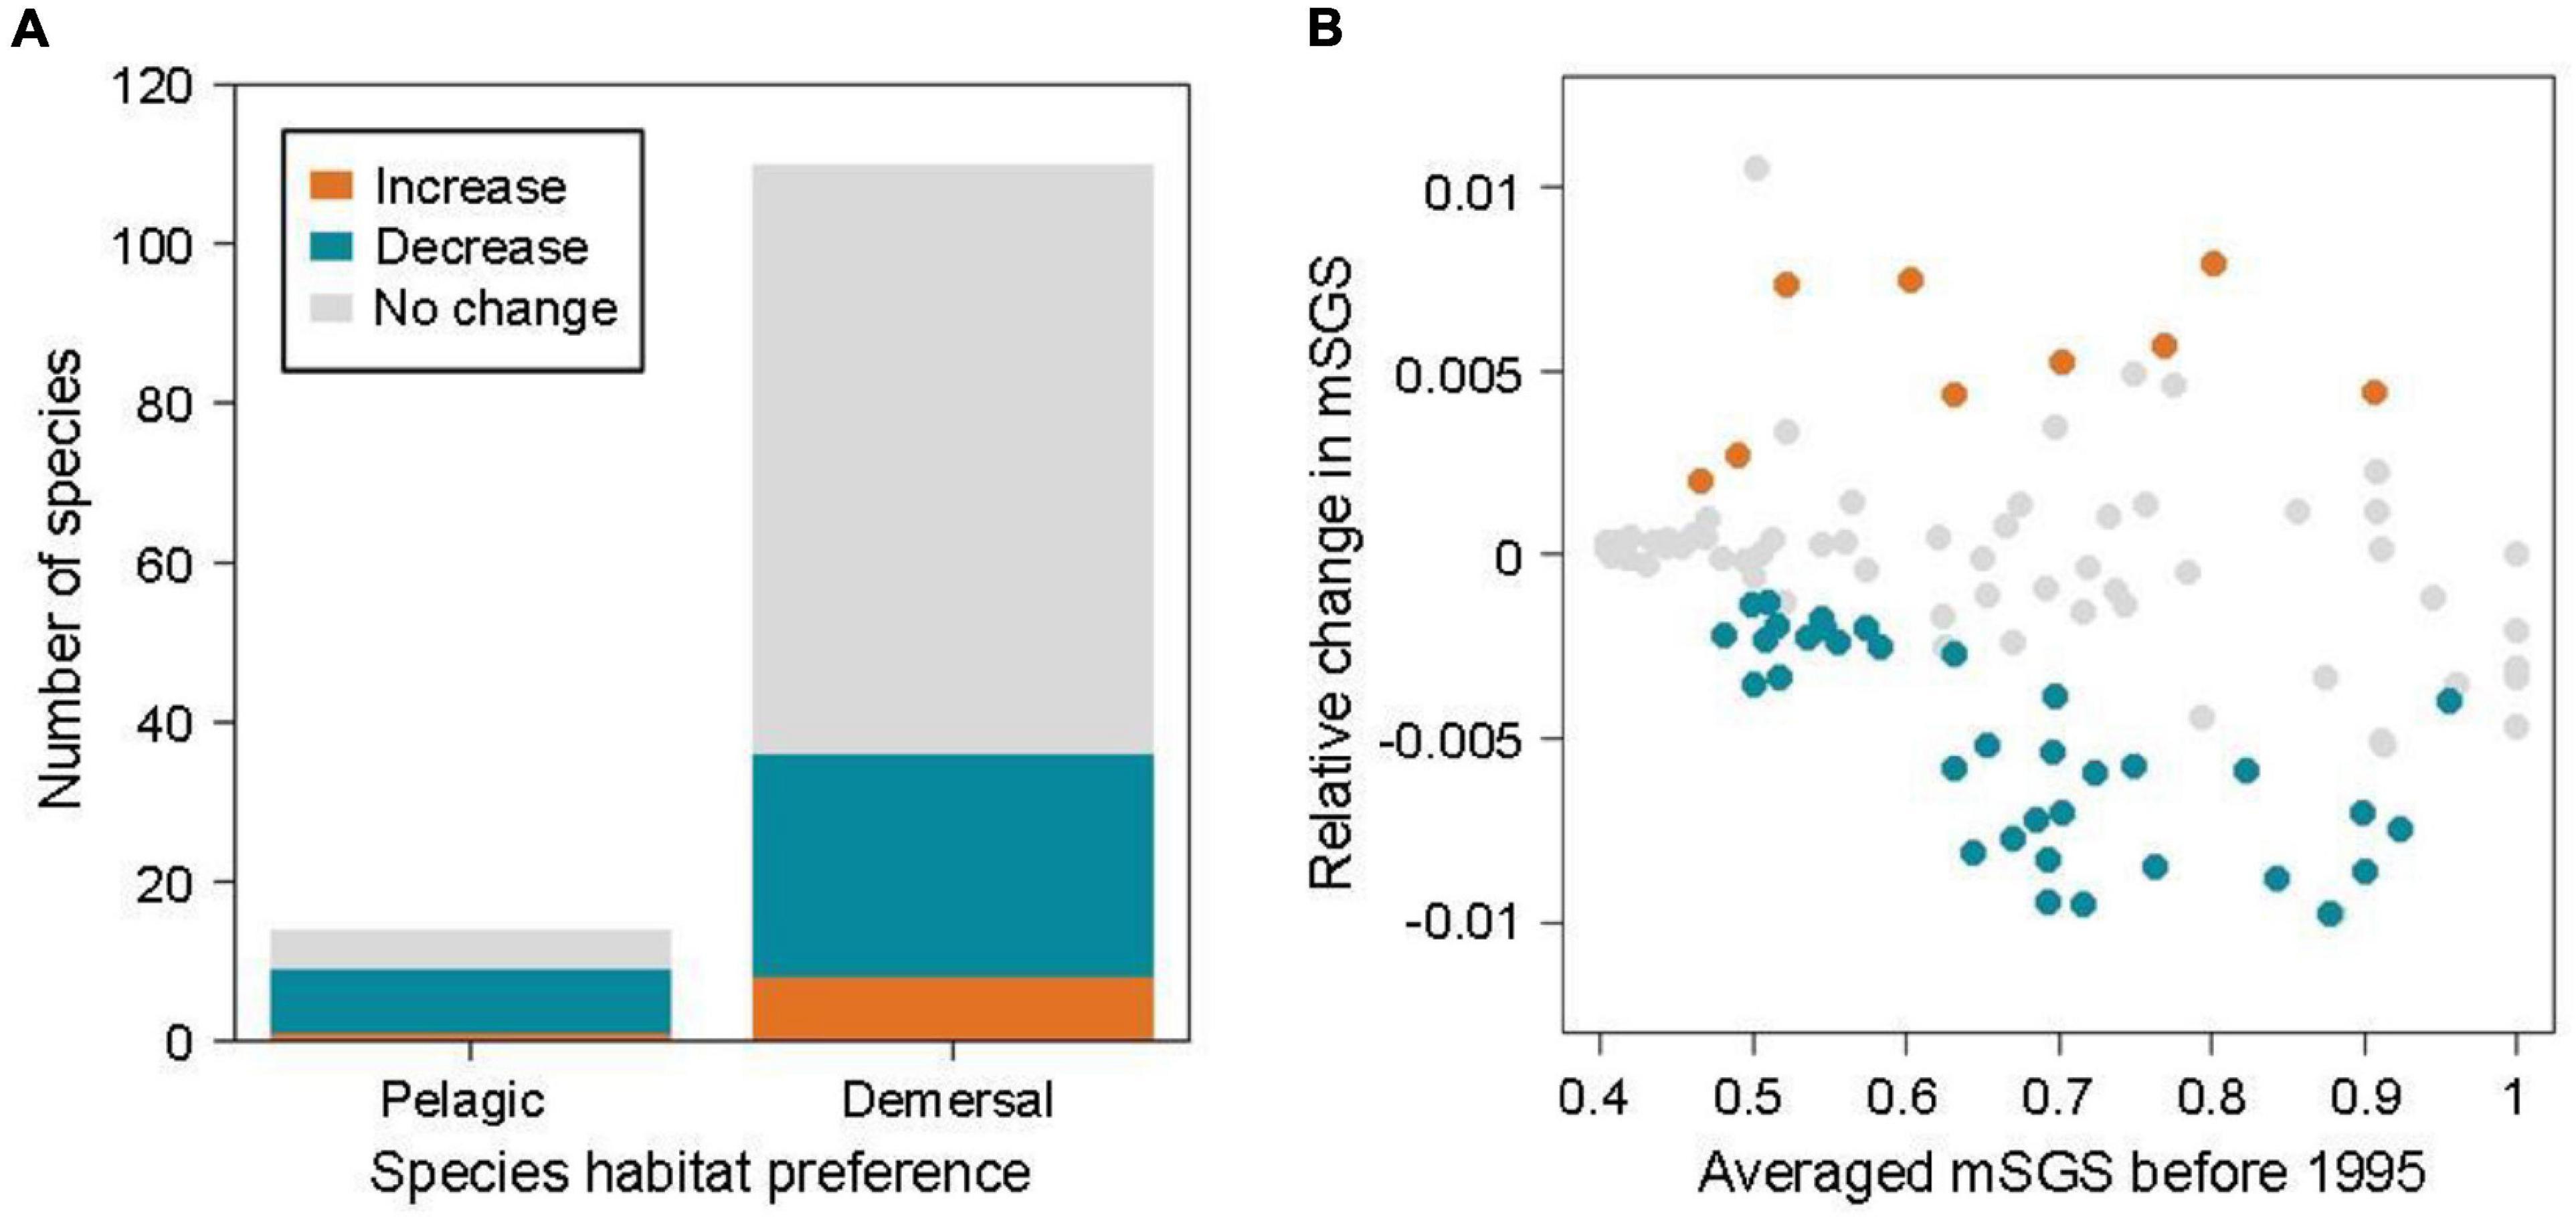
Figure 3. (A) Patterns of relative change in mean species geographic sensitivity (mSGS, orange: increase; blue: decrease; gray: no change) according to species habitat preference. (B) Relationship between relative change in mSGS and species’ averaged mSGS before 1995, i.e. before warming.
The species with significant relative change in mSGS were distributed closer to the coastal areas, but inconsistent directions and magnitudes of distributional preferences were observed, indicating unexpected limited latitudinal shifts in the area (Figure 4A and Supplementary Figure 1). Regarding the direct effects of species range size and overlap with other species on the relative change in mSGS, a highly positive correlation between relative change in species range size and overlap with other species over the study period was found (r = 0.983, p < 0.001; Figure 4B and Supplementary Table 1). Interestingly, most species (35/45) showed increases, with all experiencing greater increases in range size than in overlap with other species, as described in the third hypothesized condition. Ten species, including two pelagic and eight demersal species, experienced decreases in both range size and overlap with other species, and Atlantic wolfish (Anarhichas lupus) showing the greatest decreases.
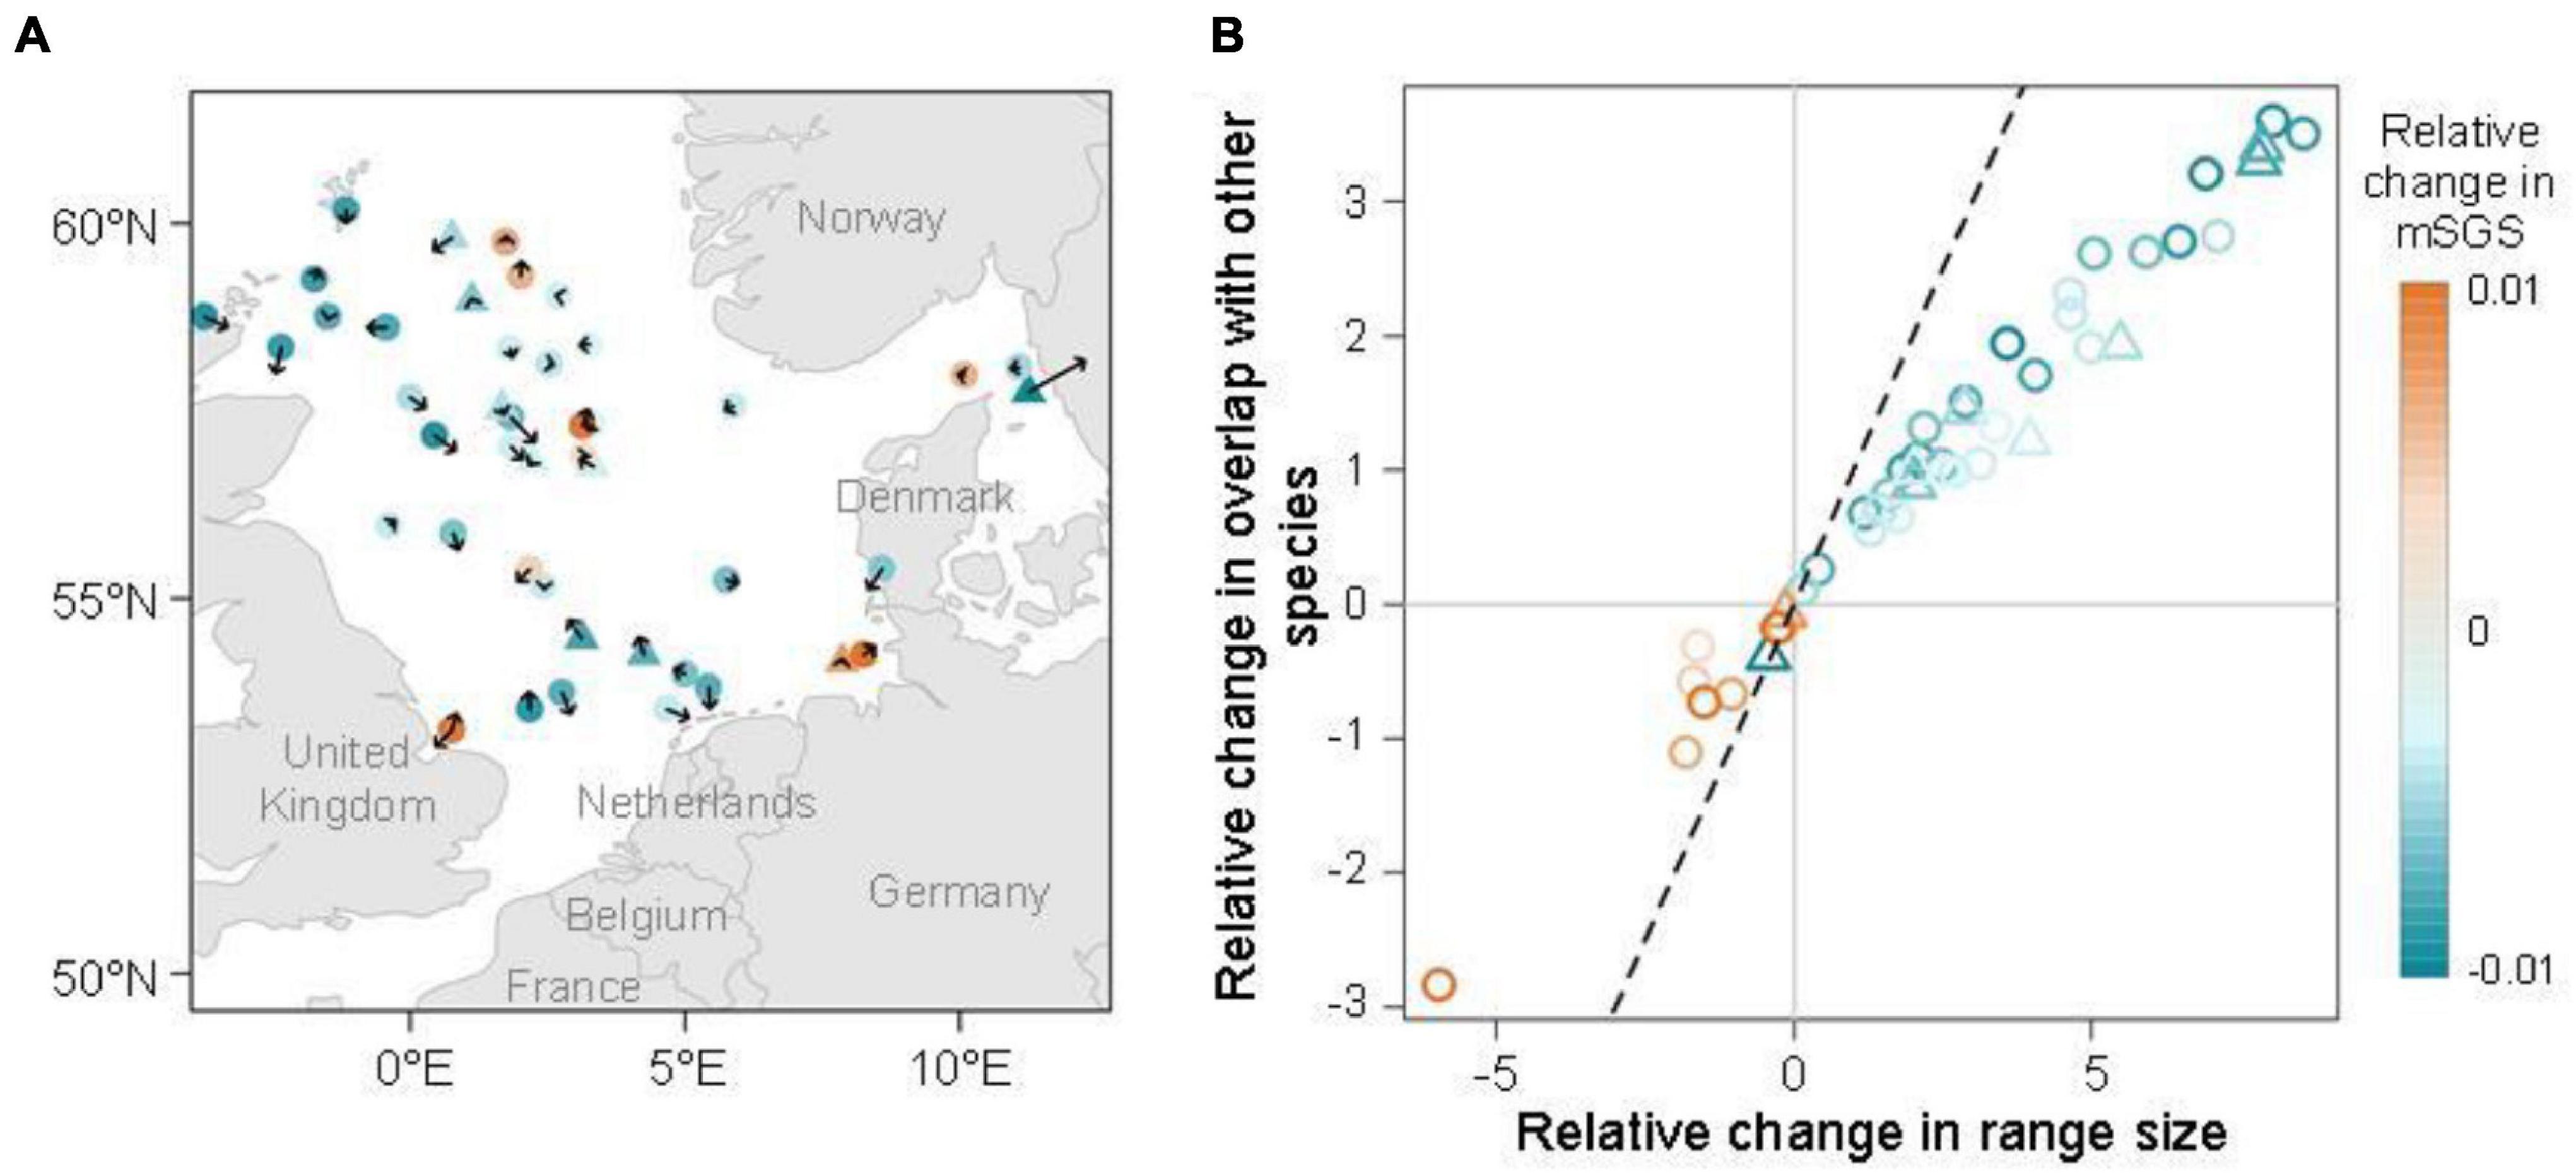
Figure 4. (A) Direction and magnitude of range shifts of the species with significant changes in the relative change in mean species geographical sensitivity (mSGS, orange: increase; blue: decrease). Circles and triangles represent demersal and pelagic species, respectively. Arrow length represents the five-time shifting strength and direction arrows indicate the potential directions of species shifts. (B) Effects of species range size and degree of overlap with other species on the species with significant changes in the relative change in mSGS. The 1:1 relationship is represented by a dashed black line.
In the best trait-based GAM, DR, BL, and AAM together explained 39.2% (R2adj = 0.392) of the variation in the relative change in mSGS (Figure 5 and Table 1). The DR showed the greatest contribution in the model, which predicted that the relative change in mSGS would increase with a rise in DR, peaking at 800 m, but decrease at DRs shallower than 400 m and deeper than 800 m. The relative change in mSGS was, on average, positively related to BL, meaning that small-bodied fish species tended to have fewer geographical interactions with other species in the North Sea, whereas larger fish species tended to have more interactions. In addition, the relative change in mSGS increased slightly up to an AAM of 3.7 years before decreasing.
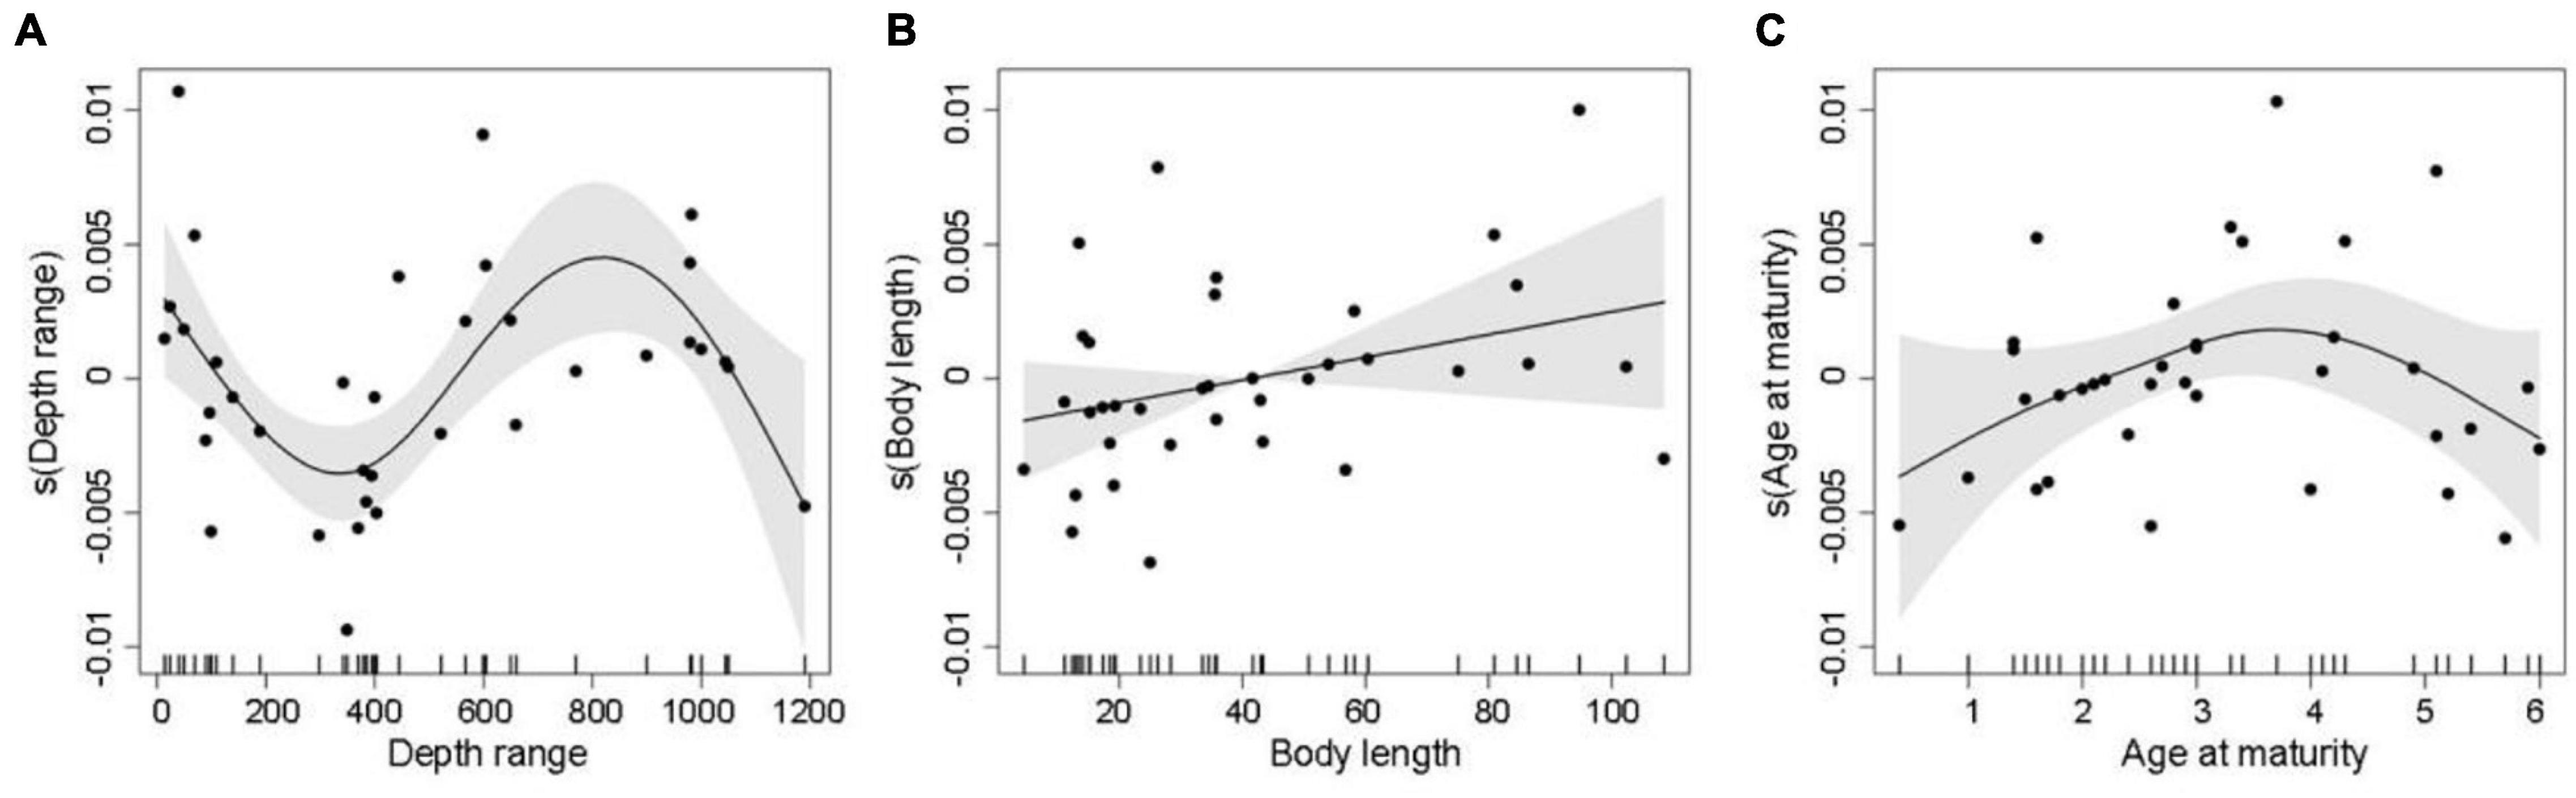
Figure 5. Generalized additive model plots showing partial effects of important explanatory variables, including (A) depth range, (B) total body length, and (C) age at maturity, on decadal changes in mean species geographic sensitivity, where solid lines are smoothed estimates of covariates from the model. The shaded gray areas represent 95% confidence intervals of the smoothed lines, and the vertical dashes at the bottom of the plots show distributions of data points included in the model.
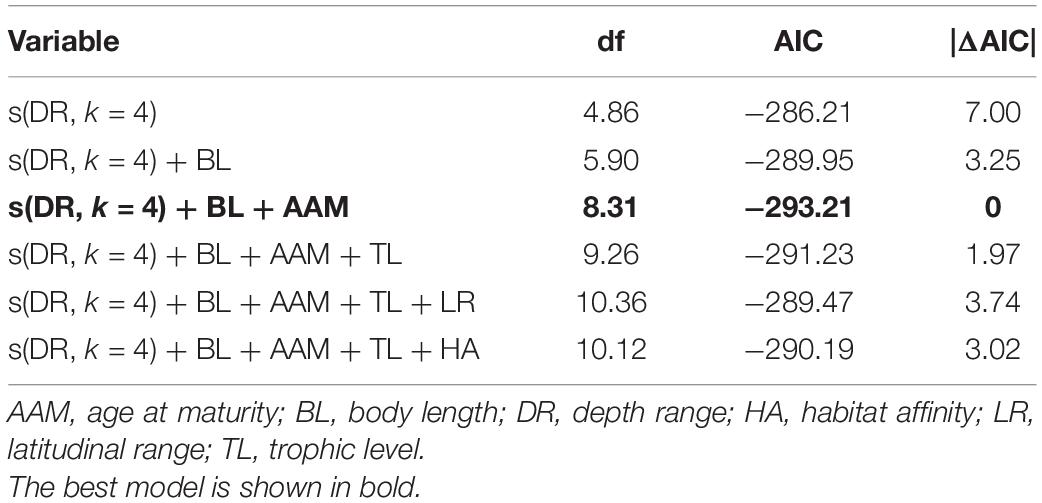
Table 1. Results of generalized additive models (GAMs) of the relationships between decadal changes in mean species geographic sensitivity and trait-based predictor variables.
Discussion
With long-term, spatially explicit survey data, we documented that species were gradually changing their geographical interactions with other species over approximately 40 years, mostly by expanding their range and degree of overlap with other species, although many species still displayed varying geographical independence. In our study, due to short-term cooling events during 2010–2013 possibly related to the North Atlantic Oscillation (NAO; Wang et al., 2004; Høyer and Karagali, 2016), we directly linked time series with species’ geographical interactions to better represent the temporal effect involving warming. To date, changes in species interactions under climate change have been debated and only involved certain species receiving much attention or belonging to certain functional groups (Milazzo et al., 2013; Howell and Filin, 2014; Bates et al., 2017), such that the effects of entire community on ecosystem structure as mediated by individual species have remained unclear. We suggest that species showing the greatest responses of geographical sensitivity to warming over time can serve as useful indicators for biological vigilance under climate change and for additional studies to understand underlying drivers, such as the greater contribution of range size than of overlap with other species, DR, BL, and AAM. Future work is needed to disentangle multiple ecological mechanisms and environmental stressors at play, as well as potential feedbacks. For example, how do continuous changes in species’ geographical interactions influence ecosystem function in an area? How might warming-driven changes in spatial relationships between species translate to future community adaptation under continuously changing climate?
Examination of the geographical sensitivity of individual fish species in the North Sea revealed spatial independence of common species, i.e. species being frequently observed in this area. Most species with significant trends showed negative relative change in geographical sensitivity, indicating poor connectance or low distributional overlap, which might make the networks that the species belong to more robust to climate change because the distributions of species in the network are unlikely to be strongly associated (Araújo et al., 2011). Indeed, patterns of species co-occurrences at coarse geographical scales have been shown in some cases to exhibit strong signals of interspecific interactions and community assembly, although these comparisons may be biased toward interspecific interactions, especially prey-predator relationships (Bell et al., 2010; Gotelli et al., 2010; Meier et al., 2010). Regarding taxonomic groups, our results were consistent with findings from demersal fish species of the East Australian marine ecosystem, which had decreasing geographical sensitivity but not fluctuating patterns (Griffith et al., 2018). Most pelagic species, whether having significant or non-significant relative change in mSGS, also exhibited decreasing geographical sensitivity in this study. The robust patterns of demersal fish species illustrated potential structural changes in deep-water marine ecosystems under climate change, whereas differences in surface marine ecosystems that may be caused by latitudinal effects under climate change or that reflect changing patterns in nature need to be further explored.
The unequal increases in species range size and overlap with other species resulting in a decrease in the relative change in mSGS suggest that species range size may be a dominant factor determining whether species are sensitive to climate change from the perspective of geographical interactions. However, unlike previous studies predicting that species range size would decrease systematically with spatial and temporal variation in climate (Yamano et al., 2011; Poloczanska et al., 2013; Burrows et al., 2014; Grieveet et al., 2016), our study showed that species dramatically increase their range size. Previous studies had explored factors attributing species range expansion, such as species’ diverse diets for enhancing abilities to persist across depths and substrates and temperate areas as refugia for tropical coral reef species (Yamano et al., 2011; Grieveet et al., 2016). On the other hand, increasing overlap with other species could increase potentials for competition because species track suitable thermal niches in response to warming environments (Poloczanska et al., 2013; Burrows et al., 2014). We found that the fish species increased overlaps with other species, particularly in the center of the North Sea. The NAO, having predominantly positive values from 1982 to 2011, strengthened the warm current inflowing to the North Sea and thus caused the thermal gradient, while the greater depths in the northeast North Sea near Norway counteracted the effects of currents and resulted in the center of the North Sea having suitable thermal conditions for species (Pingree, 2005; Hjøllo et al., 2009).
Species’ traits are important for understanding climate change impacts on species in terms of rapid responses, including range shifts and adaptive responses (MacLean and Beissinger, 2017). Our results suggested that the species with the smallest DRs are consistently confined to the shallow end of depth gradients, also called Rapoport’s rule (Stevens, 1996; Smith and Brown, 2002), while the species with larger DRs may have broader habitats and more food resources, leading to less dependency on other species (Barbini et al., 2018). Body size usually reflects species’ sensitivity to temperatures (Baudron et al., 2014), which explains the linear relationship between the relative change in mSGS and BL in this study. Fish species may evolve smaller body sizes, i.e. shorter BL, to adapt naturally to climate change, leading to additional changes to species geographical overlap and interactions. Moreover, according to Beukhof et al.’s studies (2019a,b) study, a higher temperature may cause a younger AAM and a shorter period for fish to become mature. When warming accelerates growth and development of fish, they might have another opportunity to adapt to environmental and climatic changes. However, many species showed limited relative change in mSGS in this study, which could be because phenotypic plasticity and intraspecific trait variation exist to buffer the necessity of drastic range shifts under warming (Turcotte and Levine, 2016; MacLean and Beissinger, 2017). Notably, it is still necessary to pay more attention to species’ geographical dynamics because the fish species did vary in mSGS over time in our study.
Besides, our additional estimation revealed that the relative change in mSGS still varied among pelagic and demersal fish communities, although statistically significant changes were not observed yet (Supplementary Figure 2). Linear relationships were observed for most of these species (39/79), followed by either a peak or bottom values in the time-series trends of relative change in mSGS (27/79, 11 with an inverted U-shaped unimodal distribution and 16 with a U-shaped unimodal distribution). There were 15.2 % of species with a bimodal (6) or multimodal (6) distribution, potentially implying a better ability to display the original geographical sensitivity with other species under climate change because of rapid recovery progression. The ray-finned fish (Coryphaenoides rupestris) was an exception, with a consistent yearly mSGS and no change over time. In the field of climate change impacts on natural ecosystems, there is a major ongoing debate between the two opposing views that species will respond to change individualistically or as community assemblages (Araújo et al., 2011; Griffith et al., 2018). Our results showed that species seem to respond as a cohort with certain direction of changes in geographical interactions but underlying features within grouping species are unclear and still need to be further explored.
In conclusion, our study based on independent examinations of species’ geographical interactions, indicates that reorganization of the complex distributional overlap between species may have already occurred in the high-latitude North Sea marine ecosystem. Over one-third of fish species experienced significant changes in mSGS, while among them, most showed decreased trends, indicating a greater potential geographic independency for species and robustness for the ecosystem in the North Sea under warming climate. In addition, DR, BL, and AAM contributed the most to mSGS variation, implying their importance as useful indices of species traits to assess impacts of warming climate on marine fish species. Our results provide a way to incorporate geographical changes in multispecies distributions to assess species and ecosystem responses to climate change.
Data Availability Statement
The original contributions presented in the study are included in the article/Supplementary Material, further inquiries can be directed to the corresponding author.
Author Contributions
C-WT, Y-ZL, and C-YiK conceived of the presented idea. C-WT developed the research framework and performed the computations. Y-ZL, HCC, C-YuK, P-FL, and C-YiK verified the analytical methods. All authors discussed the results and contributed to the final manuscript.
Funding
This work was provided by the Taiwan Ministry of Science and Technology (MOST) grant 108-2636-B-002-006 and 109-2636-B-002-006. C-YiK was supported by the MOST grant for the Columbus Program.
Conflict of Interest
The authors declare that the research was conducted in the absence of any commercial or financial relationships that could be construed as a potential conflict of interest.
Publisher’s Note
All claims expressed in this article are solely those of the authors and do not necessarily represent those of their affiliated organizations, or those of the publisher, the editors and the reviewers. Any product that may be evaluated in this article, or claim that may be made by its manufacturer, is not guaranteed or endorsed by the publisher.
Acknowledgments
We thank I.-C. Chen, M.-N. Tuanmu, and C.-h. Hsieh for helpful feedback on earlier versions of this manuscript. We thank anonymous reviewers for their helpful suggestions.
Supplementary Material
The Supplementary Material for this article can be found online at: https://www.frontiersin.org/articles/10.3389/fmars.2021.748278/full#supplementary-material
Footnotes
References
Araújo, M. B., and Luoto, M. (2007). The importance of biotic interactions for modelling species distributions under climate change. Glob. Ecol. Biogeogr. 16, 743–753. doi: 10.1111/j.1466-8238.2007.00359.x
Araújo, M. B., Rozenfeld, A., Rahbek, C., and Marquet, P. A. (2011). Using species co-occurrence networks to assess the impacts of climate change. Ecography 34, 897–908. doi: 10.1111/j.1600-0587.2011.06919.x
Barbini, S. A., Sabadin, D. E., and Lucifora, L. O. (2018). Comparative analysis of feeding habits and dietary niche breadth in skates: the importance of body size, snout length, and depth. Rev. Fish Biol. Fish. 28, 625–636. doi: 10.1007/s11160-018-9522-5
Bates, A. E., Stuart-Smith, R. D., Barrett, N. S., and Edgar, G. J. (2017). Biological interactions both facilitate and resist climate-related functional change in temperate reef communities. Proc. R. Soc. B Biol. Sci. 284:20170484. doi: 10.1098/rspb.2017.0484
Baudron, A. R., Needle, C. L., Rijnsdorp, A. D., and Marshall, T. C. (2014). Warming temperatures and smaller body sizes: synchronous changes in growth of North Sea fishes. Glob. Change Biol. 20, 1023–1031. doi: 10.1111/gcb.12514
Bell, J. R., King, R. A., Bohan, D. A., and Symondson, W. O. C. (2010). Spatial co-occurrence networks predict feeding histories of polyphagous arthropod predators at field scales. Ecography 33, 64–72. doi: 10.1111/j.1600-0587.2009.06046.x
Beukhof, E., Dencker, T. S., Pecuchet, L., and Lindegren, M. (2019a). Spatio-temporal variation in marine fish traits reveals community-wide responses to environmental change. Mar. Ecol. Prog. Ser. 610, 205–222. doi: 10.3354/meps12826
Beukhof, E., Frelat, R., Pecuchet, L., Maureaud, A., Dencker, T. S., Sólmundsson, J., et al. (2019b). Marine fish traits follow fast-slow continuum across oceans. Sci. Rep. 9:17878. doi: 10.1038/s41598-019-53998-2
Blanchet, F. G., Cazelles, K., and Gravel, D. (2020). Co-occurrence is not evidence of ecological interactions. Ecol. Lett. 23, 1050–1063. doi: 10.1111/ele.13525
Burrows, M. T., Schoeman, D. S., Richardson, A. J., Molinos, J. G., Hoffmann, A., Buckley, L. B., et al. (2014). Geographical limits to species-range shifts are suggested by climate velocity. Nature 507, 492–495. doi: 10.1038/nature12976
Carrasco, L., Toquenaga, Y., and Mashiko, M. (2017). Balance between site fidelity and habitat preferences in colony site selection by herons and egrets. J. Avian Biol. 48, 965–975. doi: 10.1111/jav.01255
Chambers, J. C., Allen, C. R., and Cushman, S. A. (2019). Operationalizing ecological resilience concepts for managing species and ecosystems at risk. Front. Ecol. Evol. 7:241. doi: 10.3389/fevo.2019.00241
Curtin, C. G., and Parker, J. P. (2014). Foundations of resilience thinking. Conserv. Biol. 28, 912–923. doi: 10.1111/cobi.12321
Dawson, T. P. (2011). Beyond predictions: biodiversity conservation in a changing climate (vol 332, pg 53, 2011). Science 332, 664–664.
Dulvy, N. K., Rogers, S. I., Jennings, S., Stelzenmller, V., Dye, S. R., and Skjoldal, H. R. (2008). Climate change and deepening of the North Sea fish assemblage: a biotic indicator of warming seas. J. Appl. Ecol. 45, 1029–1039. doi: 10.1111/j.1365-2664.2008.01488.x
Estrada, A., Morales-Castilla, I., Caplat, P., and Early, R. (2016). Usefulness of species traits in predicting range shifts. Trends Ecol. Evol. 31, 190–203. doi: 10.1016/j.tree.2015.12.014
Garcia, R. A., Araujo, M. B., Burgess, N. D., Foden, W. B., Gutsche, A., Rahbek, C., et al. (2014). Matching species traits to projected threats and opportunities from climate change. J. Biogeogr. 41, 724–735. doi: 10.1111/jbi.12257
Gotelli, N. J., Graves, G. R., and Rahbek, C. (2010). Macroecological signals of species interactions in the Danish avifauna. Proc. Natl. Acad. Sci. U.S.A. 107, 5030–5035. doi: 10.1073/pnas.0914089107
Grieveet, B. D., Curchitser, E. N., and Rykaczewski, R. R. (2016). Range expansion of the invasive lionfish in the Northwest Atlantic with climate change. Mar. Ecol. Prog. Ser. 546, 225–237. doi: 10.3354/meps11638
Griffith, G. P., Strutton, P. G., and Semmens, J. M. (2018). Climate change alters stability and species potential interactions in a large marine ecosystem. Glob. Change Biol. 24, e90–e100. doi: 10.1111/gcb.13891
Guha, A., Aditya, G., and Saha, S. K. (2013). Correlation between body size and fecundity in fish louse Argulus bengalensis Ramakrishna, 1951 (Crustacea: Branchiura). J. Parasitic Dis. 37, 118–124. doi: 10.1007/s12639-012-0144-x
Hayden, B., Palomares, M. L. D., Smith, B. E., and Poelen, J. H. (2019). Biological and environmental drivers of trophic ecology in marine fishes - a global perspective. Sci. Rep. 9:11415. doi: 10.1038/s41598-019-47618-2
Hjøllo, S. S., Skogen, M. D., and Svendsen, E. (2009). Exploring currents and heat within the North Sea using a numerical model. J. Mar. Syst. 78, 180–192. doi: 10.1016/j.jmarsys.2009.06.001
Hobday, A. J., and Pecl, G. T. (2014). Identification of global marine hotspots: sentinels for change and vanguards for adaptation action. Rev. Fish Biol. Fish. 24, 415–425. doi: 10.1007/s11160-013-9326-6
Honsey, A. E., Staples, D. F., and Venturelli, P. A. (2017). Accurate estimates of age at maturity from the growth trajectories of fishes and other ectotherms. Ecol. Appl. 27, 182–192. doi: 10.1002/eap.1421
Howell, D., and Filin, A. A. (2014). Modelling the likely impacts of climate-driven changes in cod-capelin overlap in the Barents Sea. ICES J. Mar. Sci. 71, 72–80. doi: 10.1093/icesjms/fst172
Høyer, J. L., and Karagali, I. (2016). Sea surface temperature climate data record for the North Sea and Baltic Sea. J. Clim. 29, 2529–2541. doi: 10.1175/JCLI-D-15-0663.1
Jones, M. C., and Cheung, W. W. L. (2018). Using fuzzy logic to determine the vulnerability of marine species to climate change. Glob. Change Biol. 24, E719–E731. doi: 10.1111/gcb.13869
Kortsch, S., Primicerio, R., Fossheim, M., Dolgov, A. V., and Aschan, M. (2015). Climate change alters the structure of arctic marine food webs due to poleward shifts of boreal generalists. Proc. R. Soc. B Biol. Sci. 282:20151546. doi: 10.1098/rspb.2015.1546
Lester, N. P., Shuter, B. J., and Abrams, P. A. (2004). Interpreting the von Bertalanffy model of somatic growth in fishes: the cost of reproduction. Proc. Biol. Sci. 271, 1625–1631. doi: 10.1098/rspb.2004.2778
MacLean, S. A., and Beissinger, S. R. (2017). Species’ traits as predictors of range shifts under contemporary climate change: a review and meta-analysis. Glob. Change Biol. 23, 4094–4105. doi: 10.1111/gcb.13736
McCauley, D. J., Pinsky, M. L., Palumbi, S. R., Estes, J. A., Joyce, F. H., and Warner, R. R. (2015). Marine defaunation: animal loss in the global ocean. Science 347:1255641. doi: 10.1126/science.1255641
McLean, M., Mouillot, D., Lindegren, M., Villeger, S., Engelhard, G., Murgier, J., et al. (2019). Fish communities diverge in species but converge in traits over three decades of warming. Glob. Change Biol. 25, 3972–3984. doi: 10.1111/gcb.14785
Meier, E. S., Kienast, F., Pearman, P. B., Svenning, J.-C., Thuiller, W., Araújo, M. B., et al. (2010). Biotic and abiotic variables show little redundancy in explaining tree species distributions. Ecography 33, 1038–1048. doi: 10.1111/j.1600-0587.2010.06229.x
Milazzo, M., Mirto, S., Domenici, P., and Gristina, M. (2013). Climate change exacerbates interspecific interactions in sympatric coastal fishes. J. Anim. Ecol. 82, 468–477. doi: 10.1111/j.1365-2656.2012.02034.x
Minte-Vera, C. V., Maunder, M. N., Casselman, J. M., and Campana, S. E. (2016). Growth functions that incorporate the cost of reproduction. Fish. Res. 180, 31–44. doi: 10.1016/j.fishres.2015.10.023
Papaik, M. J., and Canham, C. D. (2006). Species resistance and community response to wind disturbance regimes in northern temperate forests. J. Ecol. 94, 1011–1026. doi: 10.1111/j.1365-2745.2006.01153.x
Perry, A. L., Low, P. J., Ellis, J. R., and Reynolds, J. D. (2005). Climate change and distribution shifts in marine fishes. Science 308, 1912–1915. doi: 10.1126/science.1111322
Pingree, R. (2005). North Atlantic and North sea climate change: curl up, shut down, NAO and ocean colour. J. Mar. Biol. Assoc. U.K. 85, 1301–1315. doi: 10.1017/S0025315405012488
Polivka, C. M. (2020). Habitat affinity and density-dependent movement as indicators of fish habitat restoration efficacy. Ecosphere 11:e03166. doi: 10.1002/ecs2.3166
Poloczanska, E. S., Brown, C. J., Sydeman, W. J., Kiessling, W., Schoeman, D. S., Moore, P. J., et al. (2013). Global imprint of climate change on marine life. Nat. Clim. Change 3, 919–925. doi: 10.1038/nclimate1958
R Core Team (2019). R: A Language and Environment for Statistical Computing. Vienna: R Foundation for Statistical Computing.
Sequeira, A. M. M., Rodríguez, J. P., Eguíluz, V. M., Harcourt, R., Hindell, M., Sims, D. W., et al. (2018). Convergence of marine megafauna movement patterns in coastal and open oceans. Proc. Natl. Acad. Sci. U.S.A. 115:3072. doi: 10.1073/pnas.1716137115
Smith, K. F., and Brown, J. H. (2002). Patterns of diversity, depth range and body size among pelagic fishes along a gradient of depth. Glob. Ecol. Biogeogr. 11, 313–322. doi: 10.1046/j.1466-822X.2002.00286.x
Stevens, G. (1996). Extending Rapoport’s rule to Pacific marine fishes. J. Biogeogr. 23, 149–154. doi: 10.1046/j.1365-2699.1996.00977.x
Sunday, J. M., Bates, A. E., and Dulvy, N. K. (2011). Global analysis of thermal tolerance and latitude in ectotherms. Proc. R. Soc. B Biol. Sci. 278, 1823–1830. doi: 10.1098/rspb.2010.1295
Sunday, J. M., Pecl, G. T., Frusher, S., Hobday, A. J., Hill, N., Holbrook, N. J., et al. (2015). Species traits and climate velocity explain geographic range shifts in an ocean-warming hotspot. Ecol. Lett. 18, 944–953. doi: 10.1111/ele.12474
Sündermann, J., and Pohlmann, T. (2011). A brief analysis of North Sea physics. Oceanologia 53, 663–689. doi: 10.5697/oc.53-3.663
Turcotte, M. M., and Levine, J. M. (2016). Phenotypic plasticity and species coexistence. Trends Ecol. Evol. 31, 803–813. doi: 10.1016/j.tree.2016.07.013
Veech, J. A., and Peres-Neto, P. (2013). A probabilistic model for analysing species co-occurrence. Glob. Ecol. Biogeogr. 22, 252–260. doi: 10.1111/j.1466-8238.2012.00789.x
Wang, W., Anderson, B. T., Kaufmann, R. K., and Myneni, R. B. (2004). The relation between the North Atlantic oscillation and SSTs in the North Atlantic basin. J. Clim. 17, 4752–4759. doi: 10.1175/JCLI-3186.1
Keywords: geographical interaction, geographical sensitivity, species co-occurrence, climate change, marine fish
Citation: Tu C-W, Lai Y-Z, Chen HC, Kuo C-Y, Lee P-F and Ko C-Y (2022) Trends in Geographic Sensitivity of Marine Fishes Over Decades in the North Sea. Front. Mar. Sci. 8:748278. doi: 10.3389/fmars.2021.748278
Received: 27 July 2021; Accepted: 14 December 2021;
Published: 07 February 2022.
Edited by:
Cristina Porcu, University of Cagliari, ItalyReviewed by:
Cui Liang, Institute of Oceanology, Chinese Academy of Sciences (CAS), ChinaAnil Mohapatra, Zoological Survey of India, Estuarine Biology Regional Centre, India
Copyright © 2022 Tu, Lai, Chen, Kuo, Lee and Ko. This is an open-access article distributed under the terms of the Creative Commons Attribution License (CC BY). The use, distribution or reproduction in other forums is permitted, provided the original author(s) and the copyright owner(s) are credited and that the original publication in this journal is cited, in accordance with accepted academic practice. No use, distribution or reproduction is permitted which does not comply with these terms.
*Correspondence: Pei-Fen Lee, leepf@ntu.edu.tw; Chia-Ying Ko, cyko235@ntu.edu.tw
†These authors have contributed equally to this work