Diel to Seasonal Variation of Picoplankton in the Tropical South China Sea
 Tzong-Yueh Chen
 Chao-Chen Lai
 Jen-Hua Tai
 Chia-Ying Ko
 Fuh-Kwo Shiah
- 1Institute of Marine Environment and Ecology, National Taiwan Ocean University, Keelung, Taiwan
- 2Center of Excellence for the Oceans, National Taiwan Ocean University, Keelung, Taiwan
- 3Research Center for Environmental Changes, Academia Sinica, Taipei, Taiwan
- 4Institute of Fisheries Science, National Taiwan University, Taipei, Taiwan
- 5Institute of Oceanography, National Taiwan University, Taipei, Taiwan
Eight diel surveys on picoplankton (Prochlorococcus, Synechococcus, picoeukaryotes, and heterotrophic bacteria) abundance at the South East Asian Time-Series Station (SEATS; 18°N; 116°E) were conducted during the period of 2010 to 2014. The results indicated that Prochlorococcus and picoeukaryotes showed a subsurface maximum in warm seasons (spring, summer, and fall) and were abundant at the surface in the cold season (winter). Synechococcus and heterotrophic bacteria exhibited higher cell numbers at the surface and decreased with depth throughout the year. Although not all, some clear diel patterns for picoplankton were observed. Picophytoplankton usually peaked in the nighttime; picoeukaryotes peaked at ~7 to 8 p.m., followed by Synechococcus (peaking at 1 a.m.) and Prochlorococcus (peaking at 2 a.m.). Unlike these picoautotrophs, heterotrophic bacteria could peak either at dusk (i.e., 7 p.m.) or at noon. Seasonally, Prochlorococcus was more abundant in the warm than the cold seasons, while Synechococcus and picoeukaryotes showed blooms in the winter of 2013 and 2011, respectively. Heterotrophic bacteria showed no significant seasonality. Regression analysis indicated that ~73% of the diel-to-seasonal variation of the euphotic zone depth-integrated picophytoplankton biomass (i.e., PicoBeu) could be explained by the changes of the mixed-layer depth (MLD), and this suggested that inorganic nutrient supply could be the major controlling factor in their growth. The strong linear relationship (coefficient of determination, R2 of 0.83, p < 0.01) between sea surface temperature (SST) and PicoBeu implied, for the first time, a potential of using satellite-based SST to trace the biomass of picophytoplankton in the pelagic areas of the northern South China Sea.
Introduction
Marine picoplankton, 0.2 to 2 μm in size, consists of autotrophic and heterotrophic unicellular microorganisms. These tiny microbes play crucial roles in global biogeochemical cycles (Azam et al., 1983; Azam and Malfatti, 2007; Richardson, 2017). Picoautotrophs, including Prochlorococcus (Pro), Synechococcus (Syn), and picoeukaryotes (Peuk) contribute a substantial fraction to both total phytoplankton biomass and production in marine ecosystems, especially in oligotrophic waters (Li et al., 1983; Campbell et al., 1994; Buitenhuis et al., 2012), while picoheterotrophs, mostly bacteria, consume photosynthetically fixed carbon and drive the microbial loop (Azam and Malfatti, 2007; Chen et al., 2020). Because of its significance to pelagic food webs, picoplankton community structure has been widely investigated in the world's oceans, such as the Atlantic Ocean (Zubkov et al., 1998; Durand et al., 2001), Pacific Ocean (Blanchot et al., 1997; Vaulot and Marie, 1999), Indian Ocean (Garrison et al., 2000), marginal seas of the Mediterranean Sea (Jacquet et al., 1998), and South China Sea (SCS; Liu et al., 2007).
Prochlorococcus is usually more abundant than Synechococcus in stratified, low-nutrient waters (e.g., Vaulot and Marie, 1999; Durand et al., 2001). Picoeukaryotes are less abundant than autotrophic cyanobacteria, especially in tropical and subtropical oceans (e.g., Vaulot and Marie, 1999; Durand et al., 2001). Seasonal variations in picoplankton abundance are well understood in temperate (e.g., Morán, 2007) and polar regions (e.g., Iversen and Seuthe, 2011). However, the seasonal variability in picoplankton in tropical and subtropical oceans is more complicated. For example, the maximum abundance of Synechococcus occurs during spring blooms in the subtropical Atlantic Ocean (Durand et al., 2001) but in the winter in the North Pacific Subtropical Gyre (Campbell et al., 1997). One of the objectives of this study is to present the seasonal variability in picoplankton in the tropical SCS.
Many oceanic phenomena exhibit a diel (i.e., a 24-h periodicity) cycle. The Earth's rotation leads to a rhythm of light and darkness, which is probably the most obvious diel setting in the world. The daily cycle of solar heating induces a temporary thermocline in the equatorial Pacific, which disappears at night (Moum et al., 1989). Solar insolation could affect not only diel ocean physics but also subsequent biogeochemical processes. A clear diel pattern of in vivo chlorophyll fluorescence has been observed in the equatorial Pacific (Dandonneau and Neveux, 1997). The diel variation in chlorophyll, then, may affect the diel pattern of zooplankton grazing rates (Neveux et al., 2003). Marked diel variability in picoplankton was observed in the equatorial Pacific (Vaulot and Marie, 1999) and the Mediterranean Sea (Jacquet et al., 1998). However, there is a lack of studies on the diel cycles of picophytoplankton in the SCS. In addition to a study of variable fluorescence (Xie et al., 2018), the only report of diel pattern in heterotrophic bacteria was to investigate the effect of nutrient pulses on heterotrophic bacterial growth in the SCS (Chen et al., 2016). The second objective of this study is to, for the first time, present the diel variability in picophytoplankton in the SCS.
The SCS is one of the largest marginal seas in the world, with an area of 3.5 × 10⁶ km2 and a volume of 4.7 × 10⁶ km3 (Wong et al., 2007). The SCS is a tropical semi-enclosed basin lying in a northeast-southwest direction from 23°N to 3°S and 102°E to 121°E (Figure 1). Most of the major rivers, including the Pearl River and Mekong River, discharge nutrient-rich freshwater into the northwestern boundary of the SCS. Although major rivers bring large amounts of terrestrial material to the SCS, basin-wide circulations effectively isolate the SCS from the influence of high amounts of runoff, ensuring the SCS remains similar to major oligotrophic oceans (Wong et al., 2007). In terms of climate, the SCS is strongly affected by the East Asian Monsoon (Shaw and Chao, 1994) and is also recognized to have frequent internal waves propagating westward from the Luzon Strait (Alford et al., 2010). On the one hand, the SCS is large and deep enough to have characteristics similar to those of major ocean basins; on the other hand, it is relatively confined to specific climatic and oceanic events. Therefore, research in the SCS has long been the focus of scientific interest. A multidisciplinary multi-institutional time-series project, the SouthEast Asian Time-Series Study (SEATS), was initiated in 1998. The primary station is located at 18°N, 116°E in the tropical northern South China Sea, more than 450 km away from land. The SEATS station has been routinely investigated for more than 20 years. In this study, we performed eight diel surveys of picoplankton abundance and environmental variables during the four seasons. With such sampling strategies, we were able to show the distribution of picoplankton on two timescales of diel and seasonal variability and the controlling factors.
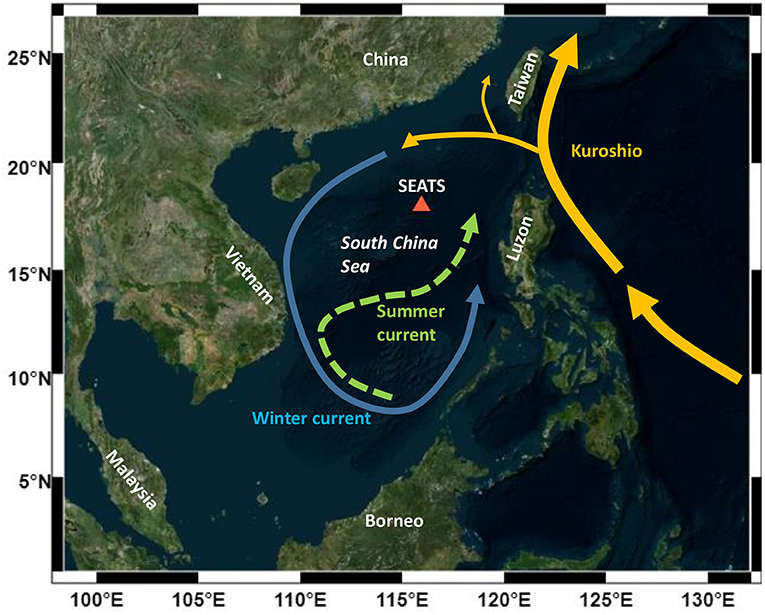
Figure 1. A sampling site of the SEATS station (116°E, 18°N) in the South China Sea. The blue solid line represents the winter counterclockwise current, while the green dashed line represents the summer clockwise current (adapted from Wong et al., 2007).
Materials and Methods
Study Area and Sampling
From 2010 to 2014, eight anchored diel studies were conducted at the SEATS station (18°N, 116°E; Figure 1) in the northern SCS. Eight diel studies were categorized as representatives of the four seasons (Table 1). Seawater was collected from 4 to 8 depths within the upper 100 m every 3–6 h (see Supplementary Figures for detailed sampling information) for at least 24 h using a rosette sampler with 20-L Teflon-coated X-Niskin bottles (General Oceanics, Miami, FL, USA) and a mounted CTD (Seabird, Bellevue, WA, USA). In addition to temperature and salinity, depth profiles of underwater PAR (Chelsea Technologies, UK), fluorescence, and transmission were also recorded. The mixed layer depth (MLD) was defined at which a density (sigma-t) change of 0.125 kg m−3 from the surface occurred (Vaulot and Marie, 1999).
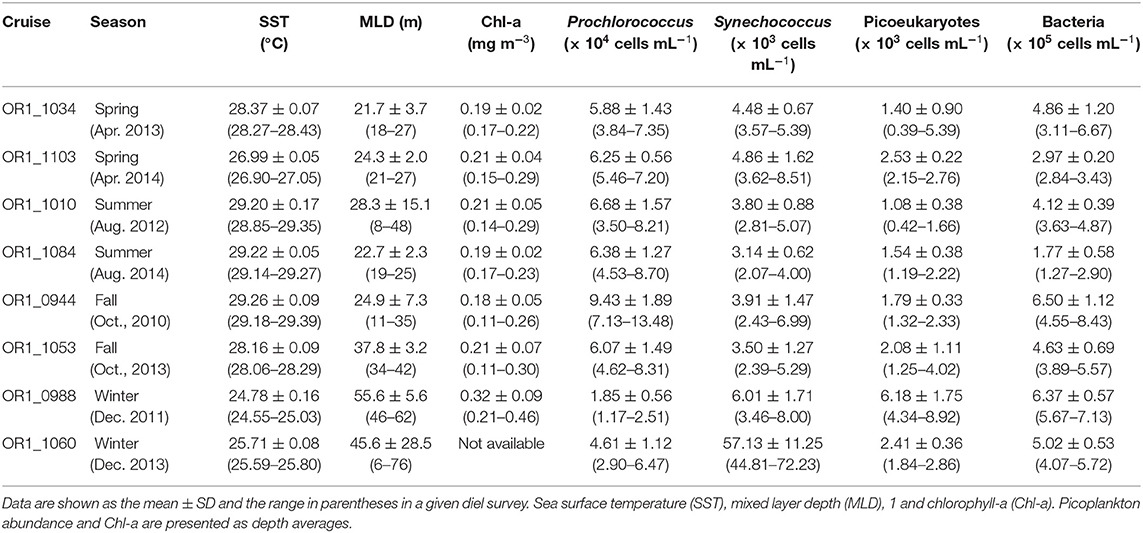
Table 1. Picoplankton abundance and hydrological parameters.
Chemical Determinations
Nutrient (nitrate, nitrite, phosphate, and silicate) samples were collected in acid-washed polypropylene bottles, immediately frozen in liquid nitrogen on board, transferred, and kept at −20°C in the laboratory until analysis. Nitrate was reduced to nitrite using cadmium-copper filings, and concentrations were determined by the diazo-pink method (Parsons et al., 1984). Nitrite concentrations were determined the same way as nitrate concentration but excluding the reduction process. Phosphate concentrations were determined by the molybdenum-blue method (Parsons et al., 1984), and silicate concentrations were determined by the molybdate-blue method (Parsons et al., 1984). The dissolved organic carbon (DOC) concentrations were determined by the high-temperature catalytic oxidation (HTCO) method on a Shimadzu TOC-V (Japan) analyzer (Wurl, 2009). Samples (2 L) for chlorophyll-a (Chl-a) were collected on GF/F filters (Whatman, Marlborough, MA, USA) and kept at −20°C until analysis. Chl-a was extracted with 90% acetone, and concentrations were determined using a fluorometer (Turner Designs, San Jose, CA, USA) (Parsons et al., 1984).
Biological Determinations
Picoplankton abundance was determined by flow cytometric counting. Subsamples of 2 ml for flow cytometry were preserved with paraformaldehyde (0.2%, final concentration), placed in liquid nitrogen, and stored at −80°C until analysis (Campbell et al., 1997). A flow cytometer (PARTEC, Germany) equipped with a 488-nm laser was used to count picoplankton (Marie et al., 1999). Forward and side light scatters and green, red, and orange fluorescence were collected and analyzed using FlowMax software to identify three major groups of picophytoplankton (Prochlorococcus, Synechococcus, and picoeukaryotes) and heterotrophic bacteria. Fluoresbrite yellow-green beads (1 μm; Polysciences, Warrington, PA, USA) were used as internal standards. Heterotrophic bacteria were counted in separate subsamples stained with SYBR Green I (Molecular Probes, Eugene, OR, USA) (Marie et al., 1999). Carbon conversion factors were adopted from previous studies. The carbon conversion factors for Prochlorococcus, Synechococcus, and picoeukaryotes were 32, 100, and 1,500 fg C cell−1 (Zubkov et al., 1998), respectively, while a cellular carbon content of 20 fg C cell−1 was used for heterotrophic bacteria (Lee and Fuhrman, 1987).
Data Analysis
JMP software (SAS Institute, USA) was used for statistical analysis. Unless otherwise indicated, variation around each mean is presented as +/– one standard deviation. All depth averages were calculated as the integrations down to 100 m divided by 100.
Results
Hydrological Parameters
The sea surface temperature (SST) and the mixed layer depth (MLD) are presented in Table 1. The SST showed obvious seasonal differences with small diel changes (Table 1; Supplementary Figure 1). The SSTs of 24.78 ± 0.16 and 25.71 ± 0.08°C in the winter (December 2011 and 2013, respectively) were significantly lower than those in the other seasons (mean SST ranged from 26.99 to 29.26°C) with very small diel variations (coefficient of variance, CV%, ranging from 0.2 to 0.7%). On the other hand, the seawater temperature at a depth of 100 m had a relatively narrow range (see Supplementary Figure 1; mean temperature ranged from 18.34 to 21.62°C) with a diel CV% of 1.2 to 4.4%. The MLD displayed a similar pattern to that of SST but with larger diel variations (Table 1; Supplementary Figure 1). The MLD values of 55.6 ± 5.6 and 45.6 ± 28.5 m in the winter (December 2011 and 2013, respectively) were deeper than those in the other seasons (mean MLD ranged from 21.7 to 37.8 m) with relatively large diel variations (CV% ranged from 8.2 to 62.4% and a maximum/minimum factor of 1.29 to 12.7). The large diel variability in the MLD indicated a dynamic physical environment in the interior of the water column during a 24-h period. Nitrate concentrations were homogeneous under the detection limit in the upper ocean (see Supplementary Figure 2) and were high at depths of 100 m (>5 μm). Nitracline depth (defined as the depth where nitrate concentration equals 1 μm) was fairly consistent at depths of ~60 m (see Supplementary Figure 2). Phosphate and silicate concentrations exhibited vertical and temporal distributions similar to those of nitrate, showing depleted or low concentrations at the surface (Supplementary Figures 3, 4). Dissolved organic carbon (DOC) concentrations exhibited typical vertical distributions in the open ocean, ranging from 70 to 100 μm at the surface and decreased to 50–60 μm at a depth of 100 m (Supplementary Figure 5).
The Chl-a concentration generally displayed a subsurface chlorophyll maximum (SCM) except in the winter of 2011 (see Supplementary Figure 6). The SCM was consistently located at a depth of ~50 m except in the spring of 2013 (~80 m). In the winter of 2011, Chl-a appeared high at the surface and decreased with depth. Generally, Chl-a concentration was <0.7 mg m−3. For seasonal variation, the depth-averaged Chl-a concentration showed high values of 0.32 ± 0.09 mg m−3 in the winter and a range of 0.18 to 0.21 mg m−3 in the other seasons (Table 1). The CV% of Chl-a diel variability ranged from 9.7 to 32.1% with an average of 22 ± 9%, while the maximum/minimum factor ranged from 1.3 to 2.6 with an average of 2 ± 0.5.
Vertical Distribution of Picoplankton
Prochlorococcus abundance was generally low at the surface and displayed a subsurface maximum in warm seasons (spring, summer, and fall; see Supplementary Figure 7), ranging from 3.1 to 9.9 × 10⁴ cells ml−1 at the surface and reaching up to 13.9 × 10⁴ cells ml−1 in the mid-layer except in the fall of 2010. Prochlorococcus was the most abundant in the fall of 2010, with 24.1 × 10⁴ cells ml−1 as the subsurface maximum. The subsurface maximum of Prochlorococcus disappeared in the winter with decreasing depth-averaged cell numbers (1.8 ± 0.6 and 4.6 ± 1.1 × 10⁴ cells ml−1 in the winter of 2011 and 2013, respectively). Synechococcus abundance was generally high at the surface and decreased with depth (see Supplementary Figure 8). The depth-averaged abundance of Synechococcus in the upper 50 m ranging from 4.2 to 8.4 × 10³ cells ml−1 was higher than those of 1.8 to 3.6 × 10³ cells ml−1 in the depth between 50 and 100 m except in the winter of 2013. Synechococcus abundance in the winter of 2013 was 10 times more abundant than that of other investigated seasons, at 90.9 ± 17.3 × 10³ cells ml−1 in the upper 50 m of the ocean. The vertical distribution of picoeukaryotes was similar to that of Prochlorococcus, which displayed a subsurface maximum in the warm seasons and was relatively homogeneous in the winter (see Supplementary Figure 9). Generally, the subsurface maximum of picoeukaryotes ranged between 4 and 8 × 10³ cells ml−1, located mostly at depths of 40 to 60 m. In the winter of 2011, picoeukaryotes abundance was approximately double that of the other seasons and reached 13.9 × 10³ cells ml−1.
Heterotrophic bacteria accounted for the major component of the picoplankton community. Heterotrophic bacteria were ubiquitous in the water column and slightly more abundant at the surface (see Supplementary Figure 10). The heterotrophic bacterial abundance ranged from 1.2 to 11 × 105 cells ml−1 at the surface and from 0.7 to 3.9 × 10⁵ cells ml−1 at a depth of 100 m.
Seasonal Variability in Picoplankton
Despite the existence of the vertical variability in picoplankton, depth-averaged abundance better described the seasonal variability. Prochlorococcus occurred at high-abundance levels in the warm seasons (i.e., spring, summer, and fall; ranging from 5.88 to 9.43 × 10⁴ cells ml−1) and at low-abundance levels of 1.85 ± 0.56 and 4.61 ± 1.12 × 10⁴ cells ml−1 in the winter of 2011 and 2013, respectively (Table 1). Synechococcus, by contrast, occurred at low-abundance levels in the warm seasons (ranging from 3.14 to 4.86 × 10³ cells ml−1) and at high-abundance levels of 6.01 ± 1.71 × 10³ cells ml−1 and an extremely high abundance of 57.13 ± 11.25 × 10³ cells ml−1 in the winter of 2011 and 2013, respectively (Table 1), at approximately an orderly less abundant than that of Prochlorococcus in terms of cell numbers. Similar to Synechococcus, the seasonal pattern of picoeukaryotes showed low values of 1.08 to 2.53 × 10³ cells ml−1 in the warm seasons and high values of 6.18 ± 1.75 and 2.41 ± 0.36 × 10³ cells ml−1 in the winters of 2011 and 2013, respectively (Table 1). Prochlorococcus was the most abundant autotrophic picoplankton in the warm seasons, accounting for 92.1 ± 1.8% of the total picophytoplankton cell numbers. The picophytoplankton community structure substantially changed in the winters. In the winter of 2011, Prochlorococcus was still the most abundant with a smaller fraction of 59.8 ± 6.3%, followed by picoeukaryotes (20.2 ± 2.1%) and Synechococcus (20 ± 5.1%). In the winter of 2013, Synechococcus became the most abundant picophytoplankton (54.1 ± 9.8%), followed by Prochlorococcus (43.6 ± 9.8%) and picoeukaryotes (2.3 ± 0.3%).
Integrated autotrophic picoplankton carbon biomass in the upper 100 m showed high values in the winter (1.046 ± 0.289 and 1.080 ± 0.114 g m−2 for 2011 and 2013, respectively) and ranged from 0.414 to 0.628 gm−2 in the warm seasons (Figure 2). Picoeukaryotes and Prochlorococcus were the major components of autotrophic picoplankton biomass in the warm seasons, accounting for 48.7 ± 8.6 and 43.3 ± 7.7% of the biomass, respectively. However, contributions to picophytoplankton carbon biomass were variable in the winter. In the winter of 2011, picoeukaryotes dominated the autotrophic picoplankton biomass (accounting for 88.5 ± 1.2%), followed by Synechococcus (5.8 ± 1.3%) and Prochlorococcus (5.7 ± 1.3%). In the winter of 2013, Synechococcus became the dominant group of picophytoplankton (contributing 52.6 ± 6.7%), followed by picoeukaryotes (33.5 ± 3.9%) and Prochlorococcus (13.9 ± 4.2%).
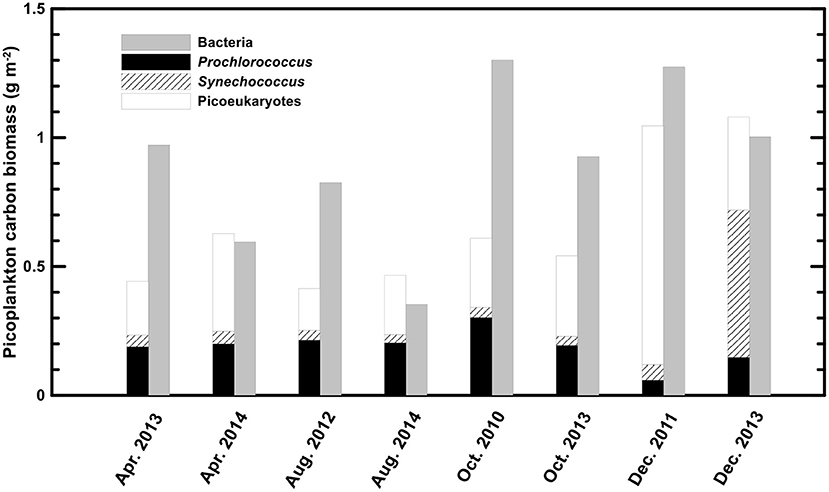
Figure 2. Integrated picoplankton carbon biomass at the SEATS station.
Heterotrophic bacteria were the major component of the picoplankton community in terms of both abundance and biomass. Heterotrophic bacterial abundance ranged from 1.77 to 6.37 × 10⁵ cells ml−1, showing an insignificant seasonality (Table 1). Heterotrophic bacterial biomass generally exceeded or equaled the total picophytoplankton biomass, ranging from 0.353 to 1.300 gm−2 in warm seasons and 1.274 ± 0.113 and 1.003 ± 0.106 gm−2 in the winters of 2011 and 2013, respectively (Figure 2).
Diel Variability in Picoplankton
Picoplankton abundance in some investigations showed clear diel cycles (Figure 3; see more detail in Section 4.3). Synechococcus abundance (data from OR1_1103, OR1_944, and OR1_1053) peaked at 1 a.m. (Figure 3B), followed by Prochlorococcus (peaking at 2 a.m.) based on data from OR1_944, OR1_1053, and OR1_1060 (Figure 3A). Picoeukaryotes peaked at ~7 to 8 p.m. based on data from OR1_1034, OR1_1010, OR1_944, and OR1_988 (Figure 3C). Diel variation occurred in two types for heterotrophic bacteria: the night-peak group, including OR1_944 and OR1_1053, which peaked at 7 p.m. (Figure 3D), and the day-peak group, including OR1_1034, OR1_1010, OR1_1084, and OR1_1060, which peaked at noon (Figure 3E). In addition to diel patterns, the results also showed large variations among frequent samplings (Table 1). The CV% of depth-averaged Prochlorococcus abundance ranged from 9 to 30.3% with an average of 22 ± 6.2%, while the maximum/minimum factor ranged from 1.3 to 2.3 with an average of 1.9 ± 0.3. Diel variation in Synechococcus abundance was larger than that in Prochlorococcus abundance. The CV% of Synechococcus ranged from 14.9 to 37.6% with an average of 26.6 ± 8.5%, while the factor ranged from 1.5 to 2.9 with an average of 2.1 ± 0.4. Picoeukaryotes showed the largest diel variation in abundance. The CV% of picoeukaryotes ranged from 8.8 to 64.5% with an average of 30.9 ± 19.2%, while its factor ranged from 1.3 to 6.6 with an average of 2.8 ± 1.8. Heterotrophic bacteria seemed to have the least diel variation. The CV% of heterotrophic bacterial abundance ranged from 6.6 to 33% with an average of 15.7 ± 9%, while the factor ranged from 1.2 to 2.3 with an average of 1.6 ± 0.4.
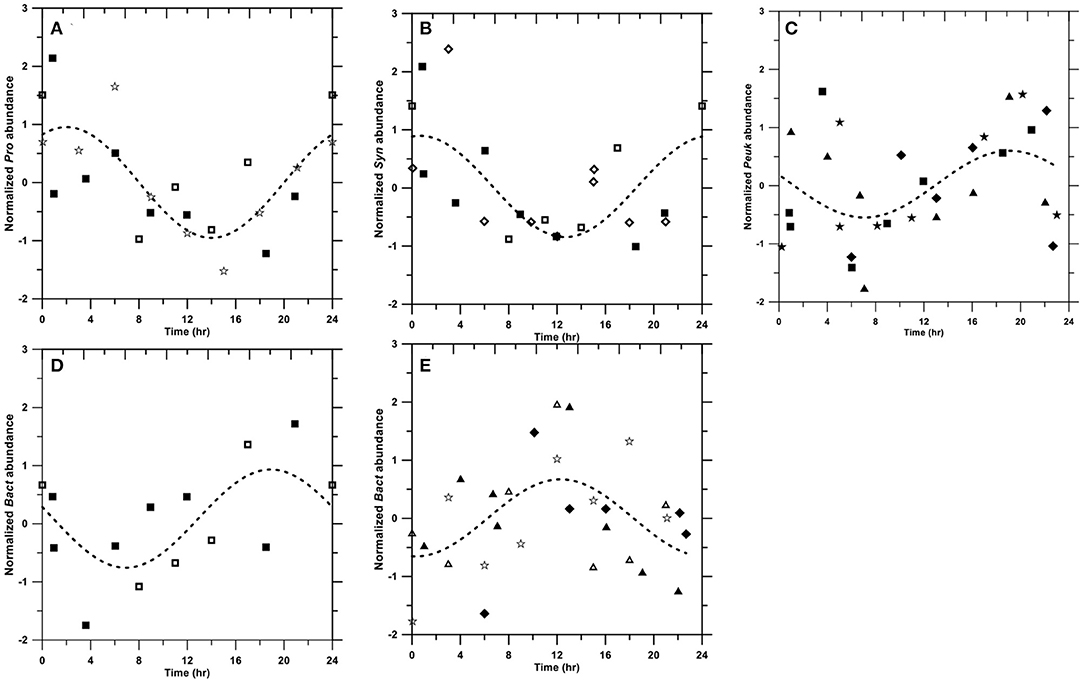
Figure 3. Diel patterns of Prochlorococcus (A), Synechococcus (B), picoeukaryotes (C), heterotrophic bacterial night-peak type (D), and heterotrophic bacterial day-peak type (E). Symbols: OR1_1034 (◆); OR1_1103 (◇); OR1_1010 (▴); OR1_1084 (Δ); OR1_944 (■); OR1_1053 (□); OR1_988 (★); and OR1_1060 (☆). The dashed line denotes the fitting curve as .
Discussion
Vertical Distribution in Picoplankton
Picophytoplankton was mostly observed within the upper 100 m and had insignificant numbers below a depth of 150 m at SEATS station in the South China Sea (Liu et al., 2007). Prochlorococcus and picoeukaryotes tended to accumulate at subsurface depths of mostly ca. 40 to 60 m in the warm seasons (Supplementary Figures 7, 9), while Synechococcus tended to peak at the surface (Supplementary Figure 8). Such a difference in vertical distribution between Prochlorococcus and Synechococcus is well recognized (Campbell et al., 1997; Durand et al., 2001), indicating different light adaptation strategies (Ting et al., 2002). Prochlorococcus seemed to be well adapted to low light (Partensky et al., 1993) and had higher absorption efficiency for blue light, which is predominant in deep waters (Morel et al., 1993), favoring the formation of subsurface maxima. Moreover, Prochlorococcus was also ultraviolet sensitive, which could induce DNA damage (Boelen et al., 2000) and, therefore, restrict Prochlorococcus growth at the surface. On the other hand, Synechococcus developed a phycobilisome antenna system, which contained phycobiliproteins (for example, phycoerythrin and phycocyanin) and had a high capability for light-harvesting at the surface (Biller et al., 2015). Boelen et al. (2000) also found that, in comparison to Prochlorococcus, Synechococcus was more resistant to UVB damage. These factors helped to form the difference in the vertical distributions between Prochlorococcus and Synechococcus. Picoeukaryotes peaked at subsurface depths in the warm seasons along with the subsurface chlorophyll maximum. The subsurface maximum of Prochlorococcus, picoeukaryotes, and Chl-a disappeared during the winter, which was also observed in Liu et al. (2007). Winter mixing broke water column stability and the subsurface maximum. After strong mixing, the stratification and then the subsurface maximum were reestablished in the following warm seasons (Olson et al., 1990; Li, 1995). The vertical distribution of heterotrophic bacterial abundance appeared high at the surface and gradually decreased with depth (Supplementary Figure 10), corresponding to the DOC concentrations (Supplementary Figure 5). Heterotrophic bacteria accompanied with total DOC were also reported in the Mediterranean Sea, indicating a tight coupling with photosynthetically released DOC (Gasol et al., 1998). Overall, the vertical distributions of picoplankton were affected by the depths associated with surrounding environmental parameters (including light, temperature, and substrate/nutrient supply).
Seasonal Variability in Picoplankton
Seasonal variation in picophytoplankton communities has been recorded in tropical and subtropical oceans (Campbell et al., 1997; Durand et al., 2001; Liu et al., 2007). Our results showed that Prochlorococcus abundance appeared low in the winter and higher with insignificant differences among the warm seasons. Synechococcus abundance peaked in the winter and decreased but was relatively constant in the warm seasons. Picoeukaryotes abundance did not have a clear seasonal pattern with exceptionally high values in the winter of 2011. These observations were slightly different from those in the report at the subtropical Bermuda Atlantic Time-Series Study (BATS) station, where Prochlorococcus abundance peaked in the summer and fall and had low cell numbers in the winter, while Synechococcus and picoeukaryotes abundance peaked during the spring bloom and decreased in the summer (Durand et al., 2001). Compared to a previous survey at the SEATS station, Liu et al. (2007) observed similar seasonal patterns as those of BATS, showing that Prochlorococcus peaked in the summer and appeared low in the winter, whereas Synechococcus and picoeukaryotes peaked in the winter and decreased in the summer. However, more complicated seasonal patterns were observed at the Hawaiian Ocean Time-Series (HOT) station ALOHA (Campbell et al., 1997). At the HOT station, Prochlorococcus showed a minimum abundance in the winter but an unclear seasonal pattern in the warm seasons. Synechococcus and picoeukaryotes usually peaked in the winter and early spring. However, such peaks did not appear every year. In this study, we found that the seasonal variation in picophytoplankton at the SEATS station was more similar to that at the HOT station than to previous observations. In summary, picophytoplankton at the SEATS station could be distinguished between warm and cold seasons. This phenomenon could be partially explained by Bunse and Pinhassi (2017), who suggest that the seasonality of picoplankton could become less obvious when approaching the equator. However, the different results from those of previous observations at the SEATS station indicated that the seasonal succession dynamics of the picoplankton community structure in the South China Sea might be more complicated than previously thought.
Heterotrophic bacterial abundance was high in the winter and spring based on a previous study at the SEATS station (Liu et al., 2007). However, we observed an unclear seasonal pattern of heterotrophic bacterial abundance (Table 1). Heterotrophic bacterial abundance has been reported to peak in the summer at the BATS station (Carlson and Ducklow, 1996), while high abundance appeared in summer and fall at the HOT station (Campbell et al., 1997). However, undetectable seasonality in heterotrophic bacterial abundance has also been reported in the subtropical Red Sea (Al-Otaibi et al., 2020).
In terms of cell numbers, Prochlorococcus was the most abundant picophytoplankton. Our Prochlorococcus abundance (depth-averaged mean ranging from 1.85 to 9.43 × 10⁴ cells ml−1) was at the lower end of the tropical and subtropical reports, at 18.3 ± 11.1 × 10⁴ cells ml−1 in the North Atlantic Ocean (Buck et al., 1996) and 17.6 × 10⁴ cells ml−1 at the HOT station (Table 2, Campbell et al., 1997). Synechococcus abundance (depth-averaged mean ranging from 3.14 to 6.01 × 10³ cells ml−1), on the other hand, was comparable to 9.3 ± 13 × 103 and 1.4 × 10³ cells ml−1 in the North Atlantic and the North Pacific Subtropical Gyre, respectively (Table 2, Buck et al., 1996; Campbell et al., 1997). Mann et al. (2002) found that Prochlorococcus is inhibited by free copper, whereas Synechococcus is resistant to copper. However, whether the low abundance of Prochlorococcus at the SEATS station is due to copper toxicity needs further investigation. The abundance of picoeukaryotes (depth-averaged mean ranging from 1.08 to 6.18 × 10³ cells ml−1) was at the higher end of the global subtropical and tropical values (1.7 ± 0.1 × 10³ cells ml−1; Table 2) (Agusti et al., 2019). The different picophytoplankton community structures reflected biomass carbon composition at the SEATS station.
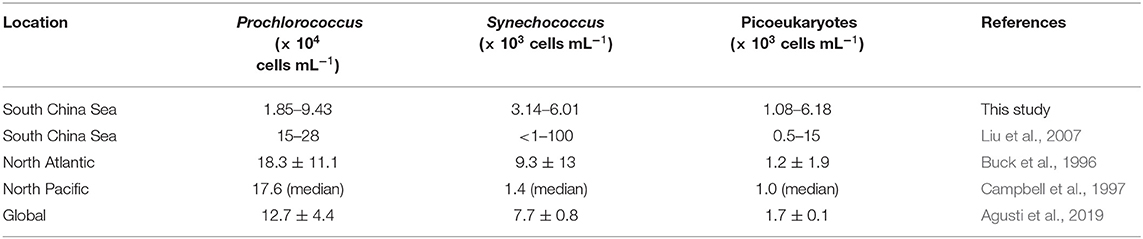
Table 2. Comparison of picophytoplankton abundance in major tropical and subtropical oceans.
The integrated biomass of total picophytoplankton ranged from 0.414 to 1.080 g C m−2 in this study, which is comparable to previous investigations (Liu et al., 2007). However, the contributions from the three picophytoplankton groups were quite different from the previous study from the same station and other subtropical reports. Prochlorococcus has been recognized as the major component of biomass in tropical and subtropical regions. At the HOT station, Prochlorococcus accounted for 72.6 ± 16.6% of the total picophytoplankton biomass, followed by picoeukaryotes (24.2 ± 11.5%) and Synechococcus (3.2 ± 1.9%) (Campbell et al., 1997). In the investigation at the STEATS station by Liu et al. (2007), Prochlorococcus constituted 70 to 80% of the picophytoplankton biomass in the summer and fall and decreased to less than 40% in the winter, whereas Synechococcus became more important in the winter. In our results, picoeukaryotes and Prochlorococcus displayed equal importance in the warm seasons (accounting for 48.7 ± 8.6% and 43.3 ± 7.7% of the total picophytoplankton biomass, respectively). Picophytoplankton community dynamics during the winter in the SCS appear complicated. Liu et al. (2007) found a “winter bloom” of Synechococcus and picoeukaryotes in 2001 and 2002, respectively. Similar phenomena appeared in this study, with a “winter picoeukaryotes bloom” (88.5 ± 1.2% of picophytoplankton biomass) in 2011 and a “winter Synechococcus bloom” (52.6 ± 6.7% of picophytoplankton biomass) in 2013, while Prochlorococcus decreased to less than 15% of the total picophytoplankton biomass. The strong winter mixing (deeper MLD) accompanied by more available nutrients could possibly drive the winter bloom of relatively larger-sized groups of picoeukaryotes and Synechococcus.
Heterotrophic bacteria had undetectable seasonality in this study. Their abundance of 1.77 to 6.50 × 10⁵ cells ml−1 was slightly less but still comparable to that in the North Atlantic Ocean (6.59 ± 3.42 × 10⁵ cells ml−1) (Buck et al., 1996), the HOT station (7.10 ± 0.16 × 10⁵ cells ml−1) (Campbell et al., 1997), and the previous SEATS station (2.5 to 12 × 105 cells ml−1) (Liu et al., 2007). The integrated biomass of heterotrophic bacteria generally exceeded that of autotrophic picoplankton (six out of eight; Figure 2), ranging from 0.353 to 1.300 g m−2. In contrast, autotrophic picoplankton-exceeding heterotrophic bacteria have been previously reported at the SEATS station (Liu et al., 2007). This was basically due to the choice of bacterial carbon conversion factors. The cellular carbon content of 11 fg cell−1 in Liu et al. (2007) led to approximately a half of bacterial biomass compared with a commonly used estimate of 20 fg cell−1. In fact, heterotrophic bacteria are more important in terms of biomass in tropical and subtropical oceans than in other oceans. For example, a basin-wide investigation from the equator to 20°N in the North Atlantic Ocean suggested that the overall integrated biomass of heterotrophic bacteria slightly surpassed that of autotrophic picoplankton (Buck et al., 1996).
Diel Variability in Picoplankton
During the eight diel surveys, diel patterns of picoplankton were not clear from an individual data set. Therefore, we transformed the depth-averaged abundance as follows and superimposed it on a 24-h scale.
where An,t and At denote the normalized and original depth-averaged abundance at the time t during a given cruise, respectively; denotes the arithmetic mean of the depth-averaged abundance during the given cruise; and σ(At) denotes the standard deviation of the depth-averaged abundance during the given cruise. After normalization, a non-linear fitting was conducted.
where X and Y denote the time in 24 h and the predicted An,t, respectively. A0, A1, and A2 denote fitting coefficients. The results showed that three out of eight cruises for Synechococcus peaked at 1 a.m. (Figure 3B), followed by Prochlorococcus (also three out of eight cruises), peaking at ~2 a.m. (Figure 3A). These diel patterns were similar to those in the equatorial Pacific, where Synechococcus peaked at 12 a.m., followed by Prochlorococcus peaking at 2 a.m. (Vaulot and Marie, 1999). Our picoeukaryotes (four out of eight cruises), on the other hand, peaked at ~7 to 8 p.m., which was similar to observations in the equatorial Pacific (Blanchot et al., 1997). In fact, the timing of division from various strains in a given picophytoplankton group could be variable (Jacquet et al., 2001). Generally, phytoplankton tends to photosynthesize and grow during the daytime, followed by division during the night (Durand and Olson, 1998). In addition to intrinsic genetics (Jacquet et al., 2001), the phasing of cell division in natural environments could be regulated by light intensities (Vaulot et al., 1995) and nutrient conditions (Vaulot et al., 1996), possibly causing different diel patterns.
Heterotrophic bacteria exhibited two different diel patterns. The night-peak type had a high abundance at 7 p.m. (Figure 3D), whereas the day-peak type exhibited a high abundance at noon (Figure 3E). These two opposite diel patterns were also observed in the Mediterranean Sea (Gasol et al., 1998). Bacteria peaking during the daytime are usually subjected to high-bacterial production associated with the release of photosynthetically fixed carbon (Gasol et al., 1998). On the other hand, bacterial abundance peaking at night usually corresponds with picophytoplankton increases (e.g., Lefort and Gasol, 2014).
Although we expected to see diel patterns in picoplankton, many of the cruises in this study did not present a clear 24-h periodicity. Previous studies have also shown a lack of diel periodicity in picoplankton (Jacquet et al., 1998; Lefort and Gasol, 2014). In fact, cell abundance tightly reflects the combination of gain and loss terms. Cell division, as the major gain term, usually exhibits its intrinsic “biological clock”(Johnson et al., 1996). However, the lost terms, including viral lysis, predator grazing, and physical processes, such as disturbance or advection, could play an important role in shaping the diel patterns. Viral lysis may account for daily losses of up to 20% of picoplankton (Suttle, 1994; Mojica et al., 2016), while grazing could be equivalent or more important than cell lysis (Pernthaler, 2005). Sherr et al. (1992) found preferential protozoa grazing on dividing prokaryotes. Peters (1994) further estimated that the protozoan ingestion rate increases by ~70% when prey is divided at 100%. Moreover, the diel pattern of heterotrophic nanoflagellates (HNF) directly affects picoplankton diel cycles. HNF has been observed as high-grazing rates during either day (Ng and Liu, 2016) or night (Christoffersen, 1994). Physical processes could have both positive and negative effects on picoplankton abundance, essentially due to the mixing of different water masses. Generally, mixing and turbulence increase nutrient fluxes for picoplankton growth. However, Peters and Gross (1994) observed that turbulence enhanced protozoan grazing rates on picoplankton-sized particles. Lefort and Gasol (2014) further suggested that a climate event with increased turbulence potentially disrupts the diel pattern of picoplankton. All loss terms may shape, weaken, or even dissipate the diel patterns.
Whether picoplankton displayed diel patterns, large diel variabilities were clearly observed. Picoeukaryotes had the largest CV% at 30.9 ± 19.2%, followed by Synechococcus (26.6 ± 8.5%), Prochlorococcus (22. ± 6.2%), and heterotrophic bacteria (15.7 ± 9.1%). The results were similar to, although slightly higher than, those in the Mediterranean, which also showed the highest CV% of picoeukaryotes (30%), followed by Synechococcus (16.5%), Prochlorococcus (16.5%), and heterotrophic bacteria (10.5%) (Lefort and Gasol, 2014). However, the maximum/minimum factor for picophytoplankton, ranging from 1.9 to 2.8, is apparently larger than that of ~1.5 in the equatorial Pacific (André et al., 1999).
Environmental Controls on Picoplankton Community Structure
Prochlorococcus has usually been observed in high temperature and low-nutrient waters, while Synechococcus and picoeukaryotes are frequently dominant in relatively low-temperature waters with higher nutrient concentrations (Partensky et al., 1999). Among the factors that may regulate picoplankton distribution, temperature and nutrient concentration have been recognized to potentially affect picoplankton community size structure (Morán et al., 2010; Marañón et al., 2012). Morán et al. (2010) suggested that a temperature rise could lead to a shift toward smaller primary producers. From a geographical point of view, the contribution of picophytoplankton to total phytoplankton biomass increases when moving from temperate regions to the equator (Marañón et al., 2001). However, Marañón et al. (2012) suggested that temperature is independent of the picoplankton community structure. On the other hand, nutrient availability controls the partitioning of biomass between different picoplankton groups. A geographical distribution where a higher fraction of picoplankton biomass appeared in oligotrophic oceans than in coastal-nutrient-replete waters supports the resource control hypothesis (Marañón et al., 2001). We found that the contribution of picophytoplankton to total phytoplankton biomass appeared to not be significantly affected by temperature or nutrient supply (represented as the MLD). The MLD has long been considered an indicator of the nutrient supply and was used for the estimate of phytoplankton growth (e.g., Sverdrup, 1953; Yentsch, 1990). Although temperature and nutrient supply hypotheses were rejected in this study, we observed that the sea surface temperature (SST) and the MLD could both well predict the seasonal fluctuations in picophytoplankton biomass (Table 3), with better correlations with SST (Table 3; Figure 4). Unfortunately, none of the SST or MLD presented suitable predictions for heterotrophic bacterial biomass. Prochlorococcus biomass was positively correlated with SST (p < 0.01) and negatively correlated with MLD (p < 0.05). On the other hand, Synechococcus biomass was negatively correlated with SST (p < 0.01). Picoeukaryotes were similar to Synechococcus, showing a negative correlation with SST and a positive correlation with MLD (both p < 0.05). Total picophytoplankton biomass behaved as larger-size groups of picoeukaryotes and Synechococcus, showing a negative correlation with SST and a positive correlation with MLD (both p < 0.01). The positive correlation with temperature and negative correlation with nutrient supply in Prochlorococcus biomass were consistent with global regressions in tropical and subtropical oceans (Agusti et al., 2019). However, the negative correlation between temperature and Synechococcus (and picoeukaryotes) was opposite to the projection by Agusti et al. (2019). In fact, the temperature usually changes concurrently with nutrient availability. The higher temperature, the less nutrients are available. Boyd et al. (2010) summarized that nutrient supply is likely to be the most important factor controlling the abundance and distribution of Synechococcus. In this study, the SST here in the regression possibly reflected the index of nutrient supply rather than the temperature effect itself. In brief, inorganic nutrient supply and temperature (for Prochlorococcus) were the major factors controlling picophytoplankton distribution at the SEATS station in the South China Sea. Since the nutrient supply is likely the controlling factor in the distribution of picophytoplankton biomass, other sources of nutrients should be considered. Previous studies showed that large-scale eddies and internal waves could bring extra nutrients to the surface and enhance phytoplankton growth in the SCS (Li et al., 2018; Shih et al., 2020). The SST and the MLD were both demonstrated to appropriately predict the distribution of picophytoplankton. This is the first time showing a good relationship between SST and the depth-integrated picophytoplankton biomass in the South China Sea (coefficient of determination, R2 = 0.83). The models projected that Prochlorococcus became dominant when the SST reaches 28.8°C or more, while picoeukaryotes dominated in the rest of the temperature regimes (Figure 4). It is widely known that picophytoplankton contributes a significant fraction of primary production and carbon exports in the open ocean (Richardson and Jackson, 2007). In the future warmer SCS, Prochlorococcus could become more and more important regulating the carbon cycles. With small diel variabilities and ease to obtain from the satellite, the SST was a powerful parameter to quickly predict picophytoplankton biomass, as well as the abundance, at the SEATS station in the South China Sea.
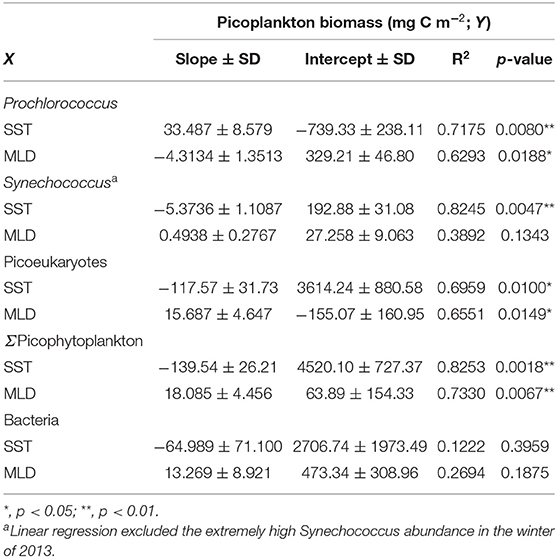
Table 3. A linear relationship between picoplankton biomass and environmental variables of sea surface temperature (SST) and mixed layer depth (MLD).
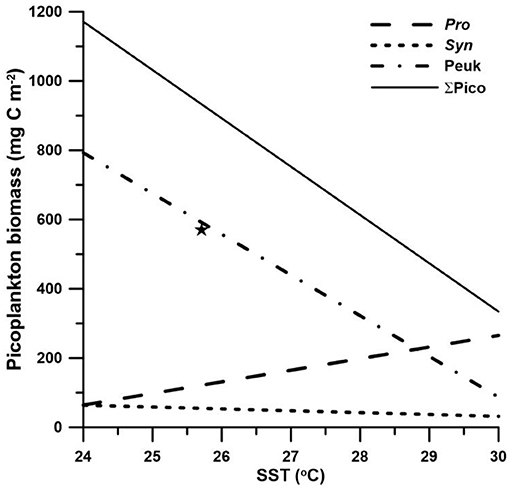
Figure 4. Linear regressions between the sea surface temperature (SST) and picoplankton biomass. The star (★) denoted the winter bloom of Synechococcus in 2013, which is excluded from the linear regression model.
Conclusion
Through eight diel surveys in all four seasons, we improved knowledge of the diel and seasonal variability, as well as vertical distribution, in the picoplankton community at the SEATS station in the South China Sea. The results displayed different vertical distributions in the picoplanktonic groups. Prochlorococcus and picoeukaryotes tended to accumulate at subsurface depths in the warm seasons, while Synechococcus and heterotrophic bacteria were abundant at the surface and decreased with depth. Vertical segregation in the warm seasons was broken in the winter, showing high cell numbers at the surface for all picoplanktonic groups. Light, substrate, and physical mixing seemed to jointly regulate the vertical distribution of picoplankton. Although not all 24-h periodicities were observed in this study, we did observe some clear diel cycles in picoplankton abundance. These observed diel variabilities showed that picoeukaryotes peaked at ~7 to 8 p.m., followed by Synechococcus (1 a.m.) and Prochlorococcus (2 a.m.). Heterotrophic bacteria exhibited two types of diel cycles. The night-peak group peaked at 7 p.m., while the day-peak group peaked at noon. Seasonality in picophytoplankton was also clearly observed. Prochlorococcus abundance was low in the winter, while Synechococcus and picoeukaryotes abundance peaked in the winter. However, seasonality in heterotrophic bacteria was undetectable. The inorganic nutrient supply seemed to be the major controlling factor in picophytoplankton biomass. The sea surface temperature (SST) and mixed layer depth (MLD) both demonstrated good predictions of the variation in picophytoplankton biomass, as well as abundance. The regression model predicted that picoeukaryotes would be generally the most abundant picophytoplankton in terms of biomass. Once the temperature reached 28.8°C, Prochlorococcus would become the dominant picoautotrophs. In the future warmer ocean, Prochlorococcus could become more and more important in regulating carbon exports. The strong correlation between the SST and picophytoplankton biomass indicated the potential use of the satellite SST to trace the pelagic picophytoplankton biomass in the northern South China Sea. Our picoplankton abundance results showed, to some extent, differences from those in a previous report (Liu et al., 2007), indicating that picoplankton community dynamics at the SEATS station might be more complicated than we previously thought, and further continuous investigations will improve our understanding of the tropical South China Sea.
Data Availability Statement
Data used in this study are available upon the request to corresponding authors.
Author Contributions
F-KS designed and managed the project. T-YC wrote the manuscript. T-YC, C-CL, J-HT, and C-YK analyzed data. All authors reviewed and approved the final manuscript.
Funding
Funding was provided by the Ministry of Science and Technology of Taiwan (Grants #109-2611-M-019-012-) awarded to T-YC.
Conflict of Interest
The authors declare that the research was conducted in the absence of any commercial or financial relationships that could be construed as a potential conflict of interest.
Publisher's Note
All claims expressed in this article are solely those of the authors and do not necessarily represent those of their affiliated organizations, or those of the publisher, the editors and the reviewers. Any product that may be evaluated in this article, or claim that may be made by its manufacturer, is not guaranteed or endorsed by the publisher.
Acknowledgments
We deeply thank the crew of the R/V Ocean Researcher I for shipboard operations and water sampling.
Supplementary Material
The Supplementary Material for this article can be found online at: https://www.frontiersin.org/articles/10.3389/fmars.2021.732017/full#supplementary-material
References
Agusti, S., Lubián, L. M., Moreno-Ostos, E., Estrada, M., and Duarte, C. M. (2019). Projected changes in photosynthetic picoplankton in a warmer subtropical ocean. Front. Mar. Sci. 5:506. doi: 10.3389/fmars.2018.00506
Alford, M. H., Lien, R.-C., Simmons, H., Klymak, J., Ramo, S., Yang, Y. J., et al. (2010). Speed and evolution of non-linear internal waves transiting the South China Sea. J. Phys. Oceanogr. 40, 1338–1355. doi: 10.1175/2010JPO4388.1
Al-Otaibi, N., Huete-Stauffer, T. M., Calleja, M. L., Irigoien, X., and Morán, X. (2020). Seasonal variability and vertical distribution of autotrophic and heterotrophic picoplankton in the Central Red Sea. PeerJ. 8:e8612. doi: 10.7717/peerj.8612
André, J.-M., Navarette, C., Blanchot, J., and Radenac, M.-H. (1999). Picophytoplankton dynamics in the equatorial Pacific: growth and grazing rates from cytometric counts. J. Geophys. Res. 104, 3369–3380. doi: 10.1029/1998JC900005
Azam, F., Fenchel, T., Field, J. G., Gray, J. S., Mayer-Reil, L. A., and Thingstad, F. (1983). The ecological role of water-columnmicrobes in the sea. Mar. Ecol. Prog. Ser. 10, 257–263. doi: 10.3354/meps010257
Azam, F., and Malfatti, F. (2007). Microbial structuring of marine ecosystems. Nat. Rev. Microbiol. 5, 782–791. doi: 10.1038/nrmicro1747
Biller, S. J., Berube, P. M., Lindell, D., and Chisholm, S. W. (2015). Prochlorococcus: the structure and function of collective diversity. Nat. Rev. Microbiol. 13, 13–27. doi: 10.1038/nrmicro3378
Blanchot, J., Andrb, J.-M., Navarette, C., and Neveux, J. (1997). Picophytoplankton dynamics in the equatorial Pacific: diel cycling from flow-cytometer observations. C. R. Acad. Sci. 320, 925–931. doi: 10.1016/S0764-4469(97)80878-5
Boelen, P., De Boer, M. K., Kraay, G. W., Veldhuis, M. J. W., and Buma, A. G. J. (2000). UVBR-induced DNA damage in natural marine picoplankton assemblages in the tropical Atlantic Ocean. Mar. Ecol. Prog. Ser. 193, 1–9. doi: 10.3354/meps193001
Boyd, P. W., Strzepek, R., Fu, F., and Hutchins, D. A. (2010). Environmental control of open-ocean phytoplankton groups: now and in the future. Limnol. Oceanogr. 55, 1353–1376. doi: 10.4319/lo.2010.55.3.1353
Buck, K. R., Chavez, F. P., and Campbell, L. (1996). Basin-wide distributions of living carbon components and the inverted trophic pyramid of the central gyre of the North Atlantic Ocean, summer 1993. Aquat. Microb. Ecol. 10, 283–298. doi: 10.3354/ame010283
Buitenhuis, E. T., Li, W. K. W., Vaulot, D., Lomas, M. W., Landry, M. R., Partensky, F., et al. (2012). Picophytoplankton biomass distribution in the global ocean. Earth Syst. Sci. Data 4, 37–46. doi: 10.5194/essd-4-37-2012
Bunse, C., and Pinhassi, J. (2017). Marine bacterioplankton seasonal succession dynamics. Trends Microbiol. 25, 494–505. doi: 10.1016/j.tim.2016.12.013
Campbell, L., Liu, H., Nolla, H. A., and Vaulot, D. (1997). Annual variability of phytoplankton and bacteria in the subtropical North Pacific Ocean at Station ALOHA during the 1991-1994 ENSO event. Deep-Sea Res. I 44, 167–192. doi: 10.1016/S0967-0637(96)00102-1
Campbell, L., Nolla, H. A., and Vaulot, D. (1994). The importance of Prochlorococcus to community structure in the central North Pacific Ocean. Limnol. Oceanogr. 39, 954–961. doi: 10.4319/lo.1994.39.4.0954
Carlson, C. A., and Ducklow, H. W. (1996). Growth of bacterioplankton and consumption of dissolved organic ncarbon in the Sargasso Sea. Aquat. Microb. Ecol. 10, 69–85. doi: 10.3354/ame010069
Chen, T.-Y., Lai, C.-C., Shiah, F.-K., and Gong, G.-C. (2020). Dissolved and particulate primary production and subsequent bacterial C consumption in the southern East China Sea. Front. Mar. Sci. 7:713. doi: 10.3389/fmars.2020.00713
Chen, T.-Y., Tai, J.-H., Ko, C.-Y., Hsieh, C.-H., Chen, C.-C., Jiao, N., et al. (2016). Nutrient pulses driven by internal solitary waves enhance heterotrophic bacterial growth in the South China Sea. Environ. Microbiol. 18, 4312–4323. doi: 10.1111/1462-2920.13273
Christoffersen, K. (1994). Variations of feeding activities of heterotrophic nanoflagellates on picoplankton. Mar. Microb. Food Webs 8, 111–123.
Dandonneau, Y., and Neveux, J. (1997). Diel variations of in vivo fluorescence in the eastern equatorial Pacific: an unvarying pattern. Deep-Sea Res. II 44, 1869–1880. doi: 10.1016/S0967-0645(97)00020-9
Durand, M. D., and Olson, R. J. (1998). Diel patterns in optical properties of the chlorophyte Nannochloris sp.: relating individual-cell to bulk measurements. Limnol. Oceanogr. 43, 1107–1118. doi: 10.4319/lo.1998.43.6.1107
Durand, M. D., Olson, R. J., and Chisholm, S. W. (2001). Phytoplankton population dynamics at the Bermuda Atlantic Time-series station in the Sargasso Sea. Deep-Sea Res. II 48, 1983–2003. doi: 10.1016/S0967-0645(00)00166-1
Garrison, D. L., Gowing, M. M., Hughes, M. P., Campbell, L., Caron, D. A., Dennett, M. R., et al. (2000). Microbial food web structure in the Arabian Sea: a US JGOFS study. Deep-Sea Res. II 47, 1387–1422. doi: 10.1016/S0967-0645(99)00148-4
Gasol, J. M., Doval, M. D., Pinhassi, J., Calderón-Paz, J. I., Guixa-Boixareu, N., Vaqu,é, D., et al. (1998). Diel variations in bacterial heterotrophic activity and growth in the northwestern Mediterranean Sea. Mar. Ecol. Prog. Ser. 164, 107–124. doi: 10.3354/meps164107
Iversen, K. R., and Seuthe, L. (2011). Seasonal microbial processes in a high-latitude fjord (Kongsfjorden, Svalbard): I. Heterotrophic bacteria, picoplankton and nanoflagellates. Polar Biol. 34, 731–749. doi: 10.1007/s00300-010-0929-2
Jacquet, S., Lennon, J.-F., Marie, D., and Vaulot, D. (1998). Picoplankton population dynamics in coastal waters of the northwestern Mediterranean Sea. Limnol. Oceanogr. 43, 1916–1931. doi: 10.4319/lo.1998.43.8.1916
Jacquet, S., Partensky, F., Lennon, J.-F., and Vaulot, D. (2001). Diel patterns of growth and division in marine picoplankton in culture. J. Phycol. 37, 357–369. doi: 10.1046/j.1529-8817.2001.037003357.x
Johnson, C. H., Golden, S. S., Ishiura, M., and Kondo, T. (1996). Circadian clocks in prokaryotes. Mol. Microbiol. 21, 5–11. doi: 10.1046/j.1365-2958.1996.00613.x
Lee, S., and Fuhrman, J. A. (1987). Relationships between biovolume and biomass of naturally derived marine bacterioplankton. Appl. Environ. Microb. 53, 1298–1303. doi: 10.1128/aem.53.6.1298-1303.1987
Lefort, T., and Gasol, J. M. (2014). Short-time scale coupling of picoplankton community structure and single-cell heterotrophic activity in winter in coastal NW Mediterranean Sea waters. J. Plankton Res. 36, 243–258. doi: 10.1093/plankt/fbt073
Li, D., Chou, W.-C., Shih, Y.-Y., Chen, G.-Y., Chang, Y., Chow, C. H., et al. (2018). Elevated particulate organic carbon export flux induced by internal waves in the oligotrophic northern South China Sea. Sci. Rep. 8:2042. doi: 10.1038/s41598-018-20184-9
Li, W. K. W. (1995). Composition of ultraphytoplankton in the central North Atlantic. Mar. Ecol. Prog. Ser. 122, 1–8. doi: 10.3354/meps122001
Li, W. K. W., Subba Rao, D. V., Harrison, W. G., Smith, J. C., Cullen, J. J., Irwin, B., et al. (1983). Autotrophic picoplankton in the tropical ocean. Science 219, 292–295. doi: 10.1126/science.219.4582.292
Liu, H., Chang, J., Tseng, C.-M., Wen, L.-S., and Liu, K.-K. (2007). Seasonal variability of picoplankton in the Northern South China Sea at the SEATS station. Deep-Sea Res. II 54, 1602–1616. doi: 10.1016/j.dsr2.2007.05.004
Mann, E. L., Ahlgren, N., Moffett, J. W., and Chisholm, S. W. (2002). Copper toxicity and cyanobacteria ecology in the Sargasso Sea. Limnol. Oceanogr. 47, 976–988. doi: 10.4319/lo.2002.47.4.0976
Marañón, E., Cermeño, P., Latasa, M., and Tadonlék,é, R. D. (2012). Temperature, resources, and phytoplankton size structure in the ocean. Limnol. Oceanogr. 57, 1266–1278. doi: 10.4319/lo.2012.57.5.1266
Marañón, E., Holligan, P. M., Barciela, R., González, N., Mouriño, B., Paz,ó, M. J., et al. (2001). Patterns of phytoplankton size structure and productivity in contrasting open-ocean environments. Mar. Ecol. Prog. Ser. 216, 43–56. doi: 10.3354/meps216043
Marie, D., Partensky, F., Vaulot, D., and Brussaard, C. (1999). Enumeration of phytoplankton, bacteria, and viruses in marine samples. Curr. Protocols Cytometr. 10:1111s10. doi: 10.1002/0471142956.cy1111s10
Mojica, K. D. A., Huisman, J., Wilhelm, S. W., and Brussaard, C. P. D. (2016). Latitudinal variation in virus-induced mortality of phytoplankton across the North Atlantic Ocean. ISME J. 10, 500–513. doi: 10.1038/ismej.2015.130
Morán, X. (2007). Annual cycle of picophytoplankton photosynthesis and growth rates in a temperate coastal ecosystem: a major contribution to carbon fluxes. Aquat. Microb. Ecol. 49, 267–279. doi: 10.3354/ame01151
Morán, X.,a,.G., López-Urrutia, A., Calvo-Díaz, A., and Li, W.K.W. (2010). Increasing importance of small phytoplankton in a warmer ocean. Global Change Biol. 16, 1137–1144. doi: 10.1111/j.1365-2486.2009.01960.x
Morel, A., Ahn, Y.-H., Partensky, F., Vaulot, D., and Claustre, H. (1993). Prochlorococcus and Synechococcus: a comparative study of their optical properties in relation to their size and pigmentation. J. Mar. Res. 51, 617–649. doi: 10.1357/0022240933223963
Moum, J., Caldwell, D. R., and Paulson, C. A. (1989). Mixing in the equatorial surface layer and thermocline. J. Geophys. Res. 94, 2005–2021. doi: 10.1029/JC094iC02p02005
Neveux, J., Dupouy, C., Blanchot, J., Le Bouteiller, A., Landry, M. R., and Brown, S. L. (2003). Diel dynamics of chlorophylls in high-nutrient, low-chlorophyll waters of the equatorial Pacific (180°): interactions of growth, grazing, physiological responses, and mixing. J. Geophys. Res. 108:8140. doi: 10.1029/2000JC000747
Ng, W. H., and Liu, H. (2016). Diel periodicity of grazing by heterotrophic nanoflagellates influenced by prey cell properties and intrinsic grazing rhythm. J. Plankton Res. 38, 636–651. doi: 10.1093/plankt/fbw014
Olson, R. J., Chisholm, S. W., Zettler, E. R., Altabet, M. A., and Dusenberry, J. A. (1990). Spatial and temporal distributions of prochlorophyte picoplankton in the North Atlantic Ocean. Deep-Sea Res. 37, 1033–1051. doi: 10.1016/0198-0149(90)90109-9
Parsons, T. R., Maita, Y., and Lalli, C. M. (1984). A Manual of Chemical and Biological Methods for Seawater Analysis. New York, NY: Pergamon Press.
Partensky, F., Blanchot, J., and Vaulot, D. (1999). Differential distribution and ecology of Prochlorococcus and Synechococcus in oceanic waters: a review. Bull. Inst. Oceanogr. 19, 457–475.
Partensky, F., Hoepffner, N., Li, W. K. W., Ulloa, O., and Vaulot, D. (1993). Photoacclimation of Prochlorococcus sp. (Prochlorophyta) strains isolated from the North Atlantic and the Mediterranean Sea. Plant Physiol. 101, 285–296. doi: 10.1104/pp.101.1.285
Pernthaler, J. (2005). Predation on prokaryotes in the water column and its ecological implications. Nat. Rev. Microbiol. 3, 537–546. doi: 10.1038/nrmicro1180
Peters, F. (1994). Prediction of planktonic protistan grazing rates. Limnol. Oceanogr. 39, 195–206. doi: 10.4319/lo.1994.39.1.0195
Peters, F., and Gross, T. (1994). Increased grazing rates of microplankton in response to small-scale turbulence. Mar. Ecol. Prog. Ser. 115, 299–307. doi: 10.3354/meps115299
Richardson, T. L. (2017). Mechanisms and pathways of small-phytoplankton export from the surface ocean. Ann. Rev. Mar. Sci. 11:18. doi: 10.1146/annurev-marine-121916-063627
Richardson, T. L., and Jackson, G. A. (2007). Small phytoplankton and carbon export from the surface ocean. Science 315, 838–840. doi: 10.1126/science.1133471
Shaw, P.-T., and Chao, S.-Y. (1994). Surface circulation in the South China Sea. Deep-Sea Res. I 41, 1663–1683. doi: 10.1016/0967-0637(94)90067-1
Sherr, B. F., Sherr, E. B., and Mcdaniel, J. (1992). Effect of protistan grazing on the frequency of dividing cells in bacterioplankton assemblages. Appl. Environ. Microb. 58, 2381–2385. doi: 10.1128/aem.58.8.2381-2385.1992
Shih, Y.-Y., Chin-Chang, H., Tuo, S.-H., Shao, H.-J., Chow, C. H., Muller, F. L. L., et al. (2020). The impact of eddies on nutrient supply, diatom biomass and carbon export in the northern South China Sea. Front. Earth Sci. 8:537332. doi: 10.3389/feart.2020.537332
Suttle, C. A. (1994). The significance of viruses to mortality in aquatic microbial communities. Microbial Ecol. 28, 237–243. doi: 10.1007/BF00166813
Sverdrup, H. U. (1953). On conditions for the vernal blooming of phytoplankton. ICES J. Mar. Sci. 18, 287–295. doi: 10.1093/icesjms/18.3.287
Ting, C. S., Rocap, G., King, J., and Chisholm, S. W. (2002). Cyanobacterial photosynthesis in the oceans: the origins and significance of divergent light-harvesting strategies. Trends Microbiol. 10, 134–142. doi: 10.1016/S0966-842X(02)02319-3
Vaulot, D., Lebot, N., Marie, D., and Fukai, E. (1996). Effect of phosphorus on the Synechococcus cell cycle in surface Mediterranean waters during summer. Appl. Environ. Microb. 62, 2527–2533. doi: 10.1128/aem.62.7.2527-2533.1996
Vaulot, D., and Marie, D. (1999). Diel variability of photosynthetic picoplankton in the equatorial Pacific. J. Geophys. Res. 104, 3297–3310. doi: 10.1029/98JC01333
Vaulot, D., Marie, D., Olson, R. J., and Chisholm, S. W. (1995). Growth of Prochlorococcus, a photosynthetic prokaryote, in the equatorial Pacific Ocean. Science 268, 1480–1482. doi: 10.1126/science.268.5216.1480
Wong, G. T. F., Ku, T.-L., Mulholland, M., Tseng, C.-M., and Wang, D.-P. (2007). The SouthEast Asian Time-series Study (SEATS) and the biogeochemistry of the South China Sea—an overview. Deep-Sea Res. II 54, 1434–1447. doi: 10.1016/j.dsr2.2007.05.012
Xie, Y., Laws, E., Yang, L., and Huang, B. (2018). Diel patterns of variable fluorescence and carbon fixation of picocyanobacteria Prochlorococcus-dominated phytoplankton in the South China Sea basin. Front. Mar. Sci. 9:1589. doi: 10.3389/fmicb.2018.01589
Yentsch, C. S. (1990). Estimates of 'new production' in the Mid-North Atlantic. J. Plankton Res. 12, 717–734. doi: 10.1093/plankt/12.4.717
Keywords: picoplankton, Prochlorococcus, Synechococcus, picoeukaryotes, heterotrophic bacteria, SEATS, South China Sea
Citation: Chen T-Y, Lai C-C, Tai J-H, Ko C-Y and Shiah F-K (2021) Diel to Seasonal Variation of Picoplankton in the Tropical South China Sea. Front. Mar. Sci. 8:732017. doi: 10.3389/fmars.2021.732017
Received: 28 June 2021; Accepted: 17 September 2021;
Published: 21 October 2021.
Edited by:
Chin-Chang Hung, National Sun Yat-sen University, TaiwanReviewed by:
Jun Sun, China University of Geosciences Wuhan, ChinaSarat Chandra Tripathy, National Center for Polar and Ocean Research (NCPOR), India
Copyright © 2021 Chen, Lai, Tai, Ko and Shiah. This is an open-access article distributed under the terms of the Creative Commons Attribution License (CC BY). The use, distribution or reproduction in other forums is permitted, provided the original author(s) and the copyright owner(s) are credited and that the original publication in this journal is cited, in accordance with accepted academic practice. No use, distribution or reproduction is permitted which does not comply with these terms.
*Correspondence: Tzong-Yueh Chen, tzongyueh.chen@gmail.com; Fuh-Kwo Shiah, fkshiah@rcec.sinica.edu.tw