Ocean Time Series Observations of Changing Marine Ecosystems: An Era of Integration, Synthesis, and Societal Applications
 Heather M. Benway1*
  Laura Lorenzoni2,3
  Angelicque E. White4
  Björn Fiedler5
  Naomi M. Levine6
  David P. Nicholson1
  Michael D. DeGrandpre7
  Heidi M. Sosik1
  Matthew J. Church8
  Todd D. O’Brien9
  Margaret Leinen10
  Robert A. Weller1
  David M. Karl4
  Stephanie A. Henson11
  Ricardo M. Letelier12
- 1Woods Hole Oceanographic Institution, Woods Hole, MA, United States
- 2National Aeronautics and Space Administration, Washington, DC, United States
- 3College of Marine Science, University of South Florida, St. Petersburg, FL, United States
- 4School of Ocean and Earth Science and Technology, University of Hawai‘i at Mānoa, Honolulu, HI, United States
- 5GEOMAR Helmholtz Centre for Ocean Research, Kiel, Germany
- 6Dana and David Dornsife College of Letters, Arts and Sciences, University of Southern California, Los Angeles, CA, United States
- 7Department of Chemistry and Biochemistry, University of Montana, Missoula, MT, United States
- 8Flathead Lake Bio Station, University of Montana, Missoula, MT, United States
- 9National Oceanic and Atmospheric Administration, Silver Spring, MD, United States
- 10Scripps Institution of Oceanography, La Jolla, CA, United States
- 11National Oceanography Centre, Southampton, United Kingdom
- 12College of Earth, Ocean, and Atmospheric Sciences, Oregon State University, Corvallis, OR, United States
Sustained ocean time series are critical for characterizing marine ecosystem shifts in a time of accelerating, and at times unpredictable, changes. They represent the only means to distinguish between natural and anthropogenic forcings, and are the best tools to explore causal links and implications for human communities that depend on ocean resources. Since the inception of sustained ocean observations, ocean time series have withstood many challenges, most prominently availability of uninterrupted funding and retention of trained personnel. This OceanObs’19 review article provides an overarching vision for sustained ocean time series observations for the next decade, focusing on the growing challenges of maintaining sustained ocean time series, including ship-based and autonomous coastal and open-ocean platforms, as well as remote sensing. In addition to increased diversification of funding sources to include the private sector, NGOs, and other groups, more effective engagement of stakeholders and other end-users will be critical to ensure the sustainability of ocean time series programs. Building a cohesive international time series network will require dedicated capacity to coordinate across observing programs and leverage existing infrastructure and platforms of opportunity. This review article outlines near-term observing priorities and technology needs; explores potential mechanisms to broaden ocean time series data applications and end-user communities; and describes current tools and future requirements for managing increasingly complex multi-platform data streams and developing synthesis products that support science and society. The actionable recommendations outlined herein ultimately form the basis for a robust, sustainable, fit-for-purpose time series network that will foster a predictive understanding of changing ocean systems for the benefit of society.
Introduction
Humans depend on the ocean for many goods and services, including fisheries and aquaculture production, natural products, water purification, shoreline protection, transportation, and recreation. Oceanic processes affecting these services vary over a range of time and space scales (Figure 1), with anthropogenic forcing contributing an added layer of complexity. In a growing effort to distinguish between natural and human-induced changes, which statistically requires several decades of sustained measurements (Henson et al., 2016), ocean time series from ships, autonomous surface and underwater vehicles, and satellite-based platforms have taken on a greater importance. Long-term ocean observations have already provided unprecedented insights into how marine ecosystems function and how they are changing over a range of temporal and spatial scales.
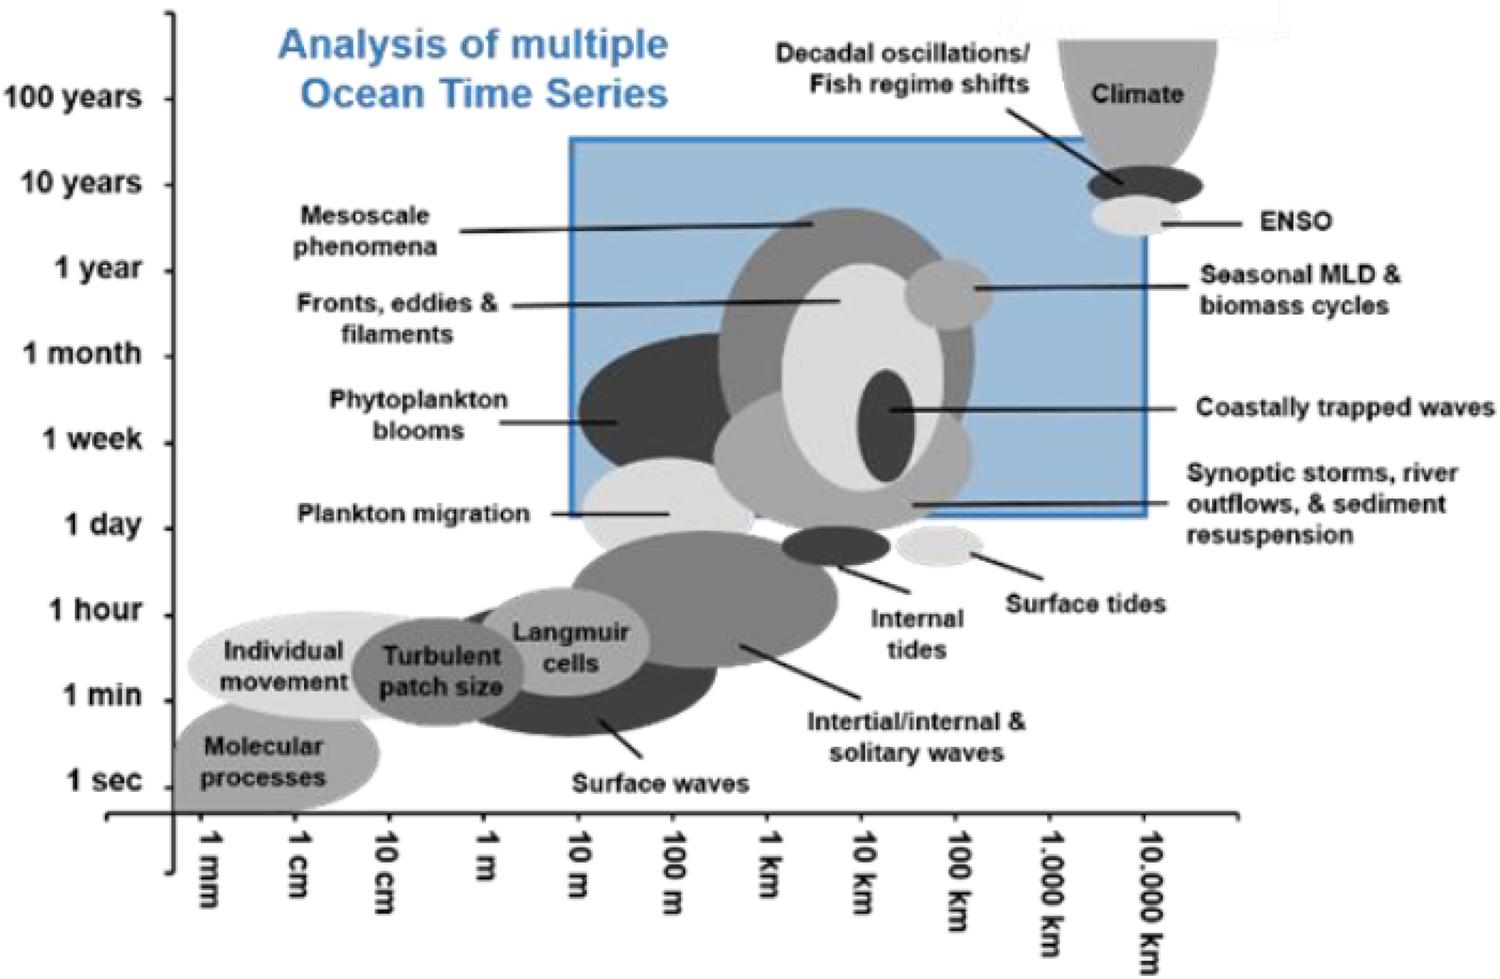
Figure 1. Temporal and spatial scales of a range of ocean processes. The blue square highlights the range of space and time scales that can be addressed by ship-based time series measurements (from Valdés and Lomas, 2017).
Sustained time series observations come at a cost, as they require lasting investments in trained personnel, institutions, and infrastructure that facilitate repeat measurements of physical, atmospheric, biological, and biogeochemical variables. However, the payoffs on these investments are significant, as ocean time series data help characterize natural patterns of ocean system variability and associated links to regional climate indices, as well as long-term anthropogenic impacts on marine ecosystems (Neuer et al., 2017). The resulting long-term data sets also provide the mechanistic and observational knowledge of ocean structure and function that form the conceptual basis of Earth System Models, which are in turn critical to forecasting marine ecosystem changes and informing management and policy development (Karl, 2010; Valdés and Lomas, 2017). These data sets also directly support calibration/validation of autonomous in situ and remote (satellite, airborne) sensors. In addition to monitoring changes in marine ecosystems, time series programs benefit the oceanographic community by providing data sets to support the scientific goals of countless ancillary projects. Furthermore, ship-based time series, in particular, have long served as invaluable training sites for scientists of all career stages, as testbeds for new technology and methods, and as incubators for interdisciplinary scientific inquiry.
As part of the Global Ocean Observing System (GOOS), the Framework for Ocean Observing (Lindstrom et al., 2012) outlined a strategy for establishing universally accepted sets of Essential Ocean Variables (EOVs), advancing technology, particularly for biological and biogeochemical variables, and integrating across observing programs and platforms to develop products that support science and society. However, it is noteworthy that there is a striking discrepancy between these EOV sets and the core variables that have been measured by keystone ocean time series for over 30 years. Lampitt et al. (2010) highlighted the importance of Eulerian observatories and the need for regional to global arrays in monitoring long-term ocean change. Since then, some of this vision has been realized through the development of networks that integrate observing assets across time and space scales. However, increased international coordination and attention to sustained funding mechanisms are needed to develop a more cohesive ocean time series network and ensure more routine incorporation of ocean time series in products that support science and society. Building on lessons learned and recommendations put forth by Lampitt et al. (2010) and Karl (2010), this OceanObs’19 review article brings much needed attention to the growing challenges of maintaining sustained ocean time series (coastal and open ocean, in situ, and remote) and outlines near-term observing priorities and technology development, mechanisms to broaden end-user communities, tools for dealing with increasingly complex multi-platform data streams, and synthesis products as part of an overarching vision for sustained ocean time series. In this paper, we highlight four major themes we view as important areas for development over the coming decade:
(1) Strengthen marine ecological observing capacity through enhancement of shipboard, autonomous, and satellite-based observing assets.
(2) Promote greater integration of ocean time series data and Earth System Models to better understand processes underlying ocean change and improve predictive capacity.
(3) Broaden applications and end-users of ocean time series data.
(4) Foster global collaboration and networking to advance science, expand and improve measurements, and optimize data access.
The Current Ocean Time Series Model: Insights and Challenges
Since the early to mid-20th century, sustained repeat measurements of ocean physics, biology, and biogeochemistry have provided insights into marine ecosystem function and patterns of variability in the ocean. The earliest examples of such observatories include Station E1 of the Western Channel Observatory in the English Channel (1903), Station M in the Norwegian Sea (1948), the California Cooperative Oceanic Fisheries Investigations (CalCOFI) in the California Current System (1949), Ocean Station Papa in the northeast Pacific (1947), Hydrostation S in the Sargasso Sea (1954), and the Boknis Eck Time Series Station in the Baltic Sea (1957). The Joint Global Ocean Flux Study (JGOFS) era saw the establishment of seven new time series programs, including the Bermuda Atlantic Time-series Study (BATS), European Station for Time series in the Ocean, Canary Islands (ESTOC), DYnamique des Flux Atmosphériques en MEDiterranée (DYFAMED), Hawaii Ocean Time-series (HOT), Kerguelen Point Fixe (KERFIX), Kyodo Northwest Pacific Ocean Time-series (KNOT), and South East Asia Time-Series Station (SEATS), each with its own scientific drivers but all motivated by a common overarching set of JGOFS objectives and implementation procedures, including standard core measurements and protocols, offering ample opportunities for comparative analyses of marine ecosystem state and function (e.g., Karl et al., 2003). Today, ocean time series are operating throughout the global ocean and across multiple platforms, including ship- and shore-based programs, autonomous assets (stationary moorings, free-floating floats, guided gliders, autonomous surface ships, etc.), satellites, and formalized single- and multi-platform observing networks such as the Argo and Biogeochemical-Argo (BGC-Argo) Programs, the Ocean Observatories Initiative (OOI), OceanSITES, the Marine Biodiversity Observation Network (MBON), and the Long-Term Ecological Research (LTER) Program. The aforementioned time series platforms and networks collectively span the broad range of time and space scales needed to query the biological, physical, and chemical states of the ocean and examine links to local, regional, and global-scale processes. Ship-based ocean time series have also increasingly served as test beds for the development of new sensors, methodologies, and calibration/validation sites. They have provided valuable seagoing and hands-on training opportunities for the next generation of ocean scientists, as well as a forum for international collaboration and capacity building.
Insights From Sustained Ocean Time Series Observations
Marine ecosystems are experiencing unprecedented rates of change associated with rising atmospheric carbon dioxide (CO2) levels and climate change, including concurrent shifts in temperature, circulation, stratification, nutrient input, oxygen (O2) content, and ocean acidification. Marine food webs comprise a delicate balance among primary producers, intermediate consumers, and top predators. Sustained repeat ocean time series measurements across multiple platforms have documented changes in marine ecosystems over a range of time and space scales in both open ocean and coastal systems.
Changing Ocean Chemistry
The ocean has absorbed 25–30% of the anthropogenic CO2 emitted since the preindustrial era (Sabine et al., 2004; Gruber et al., 2019). Recent analyses of ocean partial pressure of CO2 (pCO2) across multiple independent open ocean shipboard ocean time series sites (Figure 2) show increasing acidity across ocean basins over the past 2–3 decades (Bates et al., 2014; Tanhua et al., 2015), demonstrating the global extent of this phenomenon and the importance of high-resolution data sets to remove seasonality and elucidate longer-term trends. In addition to increasing acidity, warming, increased stratification, and circulation changes have reduced O2 levels, particularly in eastern boundary upwelling systems off southern California, South America, and West Africa (Stramma et al., 2008) (Figure 3). The CalCOFI ocean time series has documented a decline in O2 levels and a shoaling of the oxygen minimum layer over the past 2–3 decades that is likely to affect organisms living in the water column and on the seafloor (Bograd et al., 2008). Two to three decades of time series observations across the tropical and subtropical North Atlantic have recorded decadal-scale changes in the O2 content of the subtropical underwater that are likely driven by ventilation changes tied to the Atlantic Multidecadal Oscillation (AMO) (Montes et al., 2016). The Candolim Time Series (CATS) off western India has documented an intensification of the O2-deficient zone of the Arabian Sea, presumably in response to increases in land-derived nutrient inputs (Naqvi, 2006).
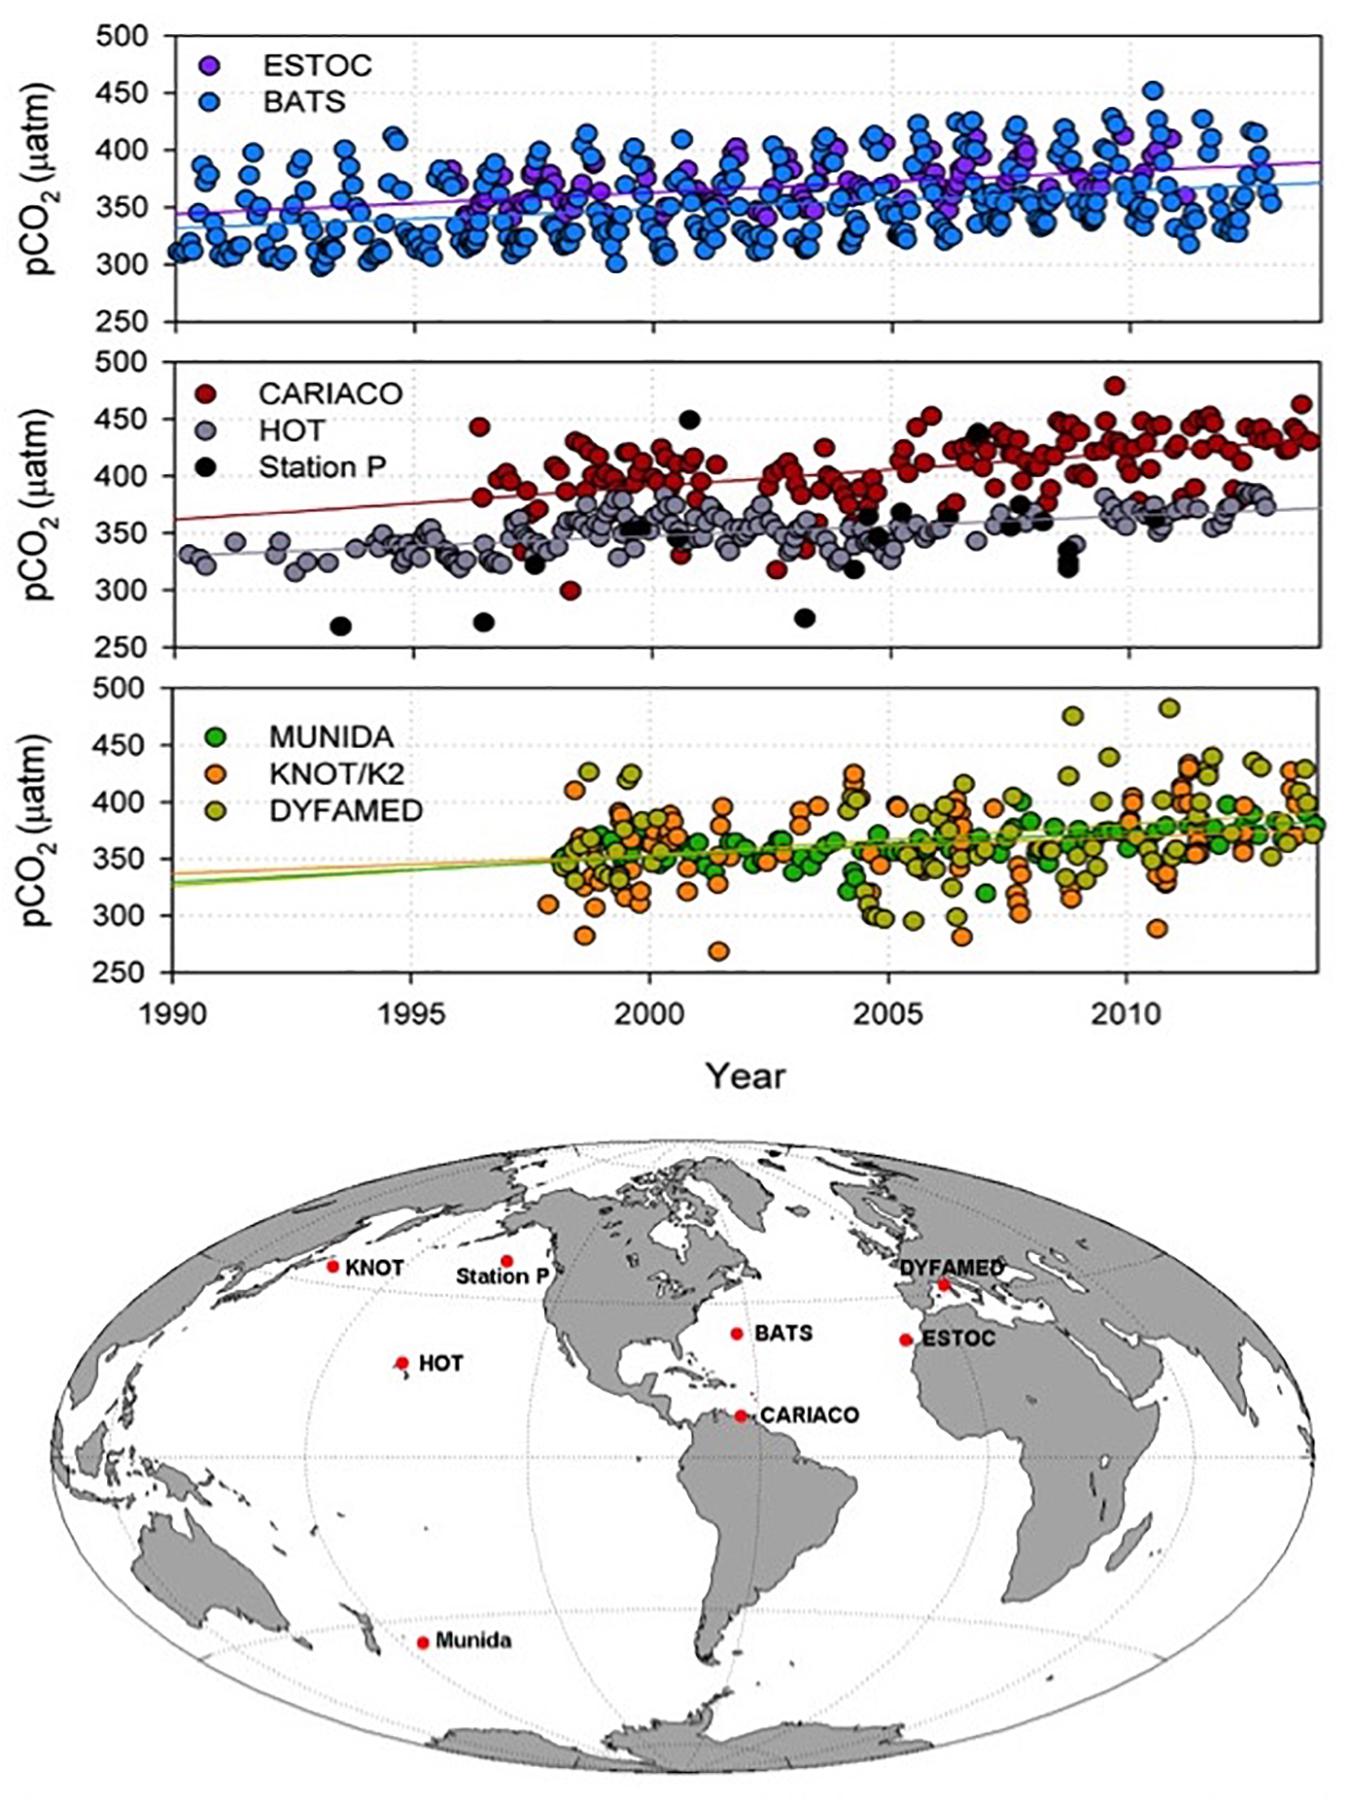
Figure 2. Top: Time series observations of pCO2 normalized for seasonal variations. Bottom: Locations of the time series stations. The increasing trend in pCO2 observed over several decades at the time series stations is indicative of the increasing uptake of anthropogenic CO2 by the ocean, which leads to rising ocean acidity. DYFAMED, DYnamique des Flux Atmosphériques en MEDiterranée; KNOT, Kyodo North west Pacific Ocean Time-series/K2. Figure modified from Tanhua et al. (2015).
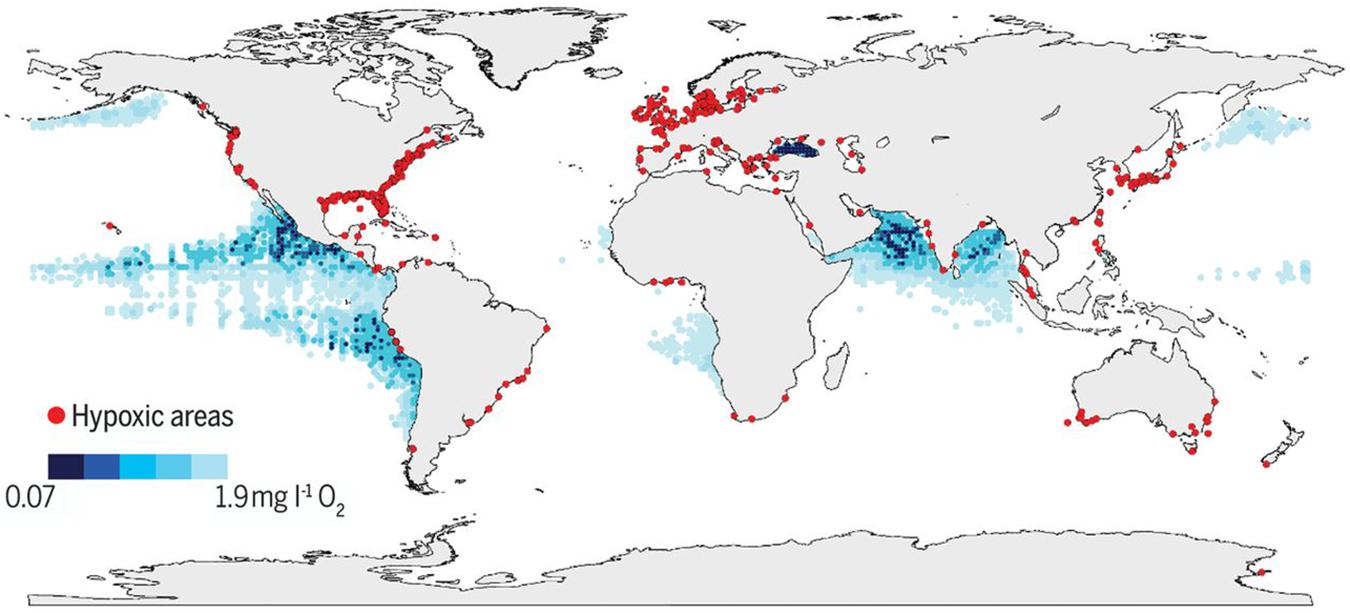
Figure 3. Global map of low and declining O2 levels in the open ocean and coastal waters from Breitburg et al. (2018). The global map indicates coastal sites where anthropogenic nutrients have exacerbated or caused O2 declines to <2 mg L–1 (<63 μmol L–1) (red dots), as well as ocean O2 minimum zones at 300 m (blue shaded regions). Figure permissions granted through AAAS license # 4578800750164 (accompanying documentation provided).
Biological Rates and Carbon Export
Long-term biogeochemical and ecological time series observations have yielded fundamental insights into processes controlling carbon exchange between the air and sea, rates of carbon transformation throughout the marine food web, and fluxes of carbon into the ocean’s interior. For example, in subtropical gyres, annual net community production (NCP) and air–sea exchange of CO2 dominate the flow of carbon near the ocean surface (Quay and Stutsman, 2003). NCP reflects the ocean’s capacity to biologically sequester atmospheric CO2 for periods of months to millennia by exporting organic carbon to the deep sea. Quantifying NCP with high confidence and reproducibility represents a key challenge for the oceanographic community. Ocean time series programs have provided seasonal observations for quantifying NCP by geochemical approaches (e.g., Neuer et al., 2007), and more recently have helped to facilitate development of a new suite of ocean productivity measurements that supplement shipboard observations with autonomous and remote sensing platforms and sensors (Church et al., 2013). The use of new platforms for measurement of ocean NCP have broadened our understanding of the factors that drive changes in NCP over a range of space and time scales. As an example, measurements of upper ocean chemical mass balances of O2 and dissolved inorganic carbon (DIC) made with a profiling float and a surface mooring at Ocean Station Papa have helped document the impact of the recent subarctic northeast Pacific warm sea surface temperature (SST) anomaly (“the Blob” – Bond et al., 2015) on annual NCP (Yang et al., 2018). Systematic comparison of different measurement- and platform-based NCP estimates is critical for identifying pathways that regulate carbon fluxes and testing assumptions and uncertainties underlying productivity measurements and models.
Marine Ecosystem Shifts and Species Distribution
Ocean time series observations have documented prominent marine ecosystem shifts associated with well known interannual- to decadal-scale climate cycles such as the El Niño-Southern Oscillation (ENSO) and the AMO. For example, in the coastal Pacific Ocean, ENSO has been shown to affect primary productivity in surface waters (IMARPE time series stations, Peru and MBARI, CA) (Chavez et al., 2011), while in the oligotrophic Pacific (HOT), a shift in the phytoplankton community was linked to changes in the North Pacific climate system (Karl et al., 2001; Corno et al., 2007). The CARIACO Ocean Time Series in the Cariaco Basin off the northern coast of Venezuela documented similarly important climate and ecosystem changes in the tropical Atlantic. In 2004, the phytoplankton community in this region underwent a marked shift from mostly diatoms to much smaller phytoplankton, accompanied by increased phytoplankton diversity and zooplankton biomass, and declining primary productivity. These changes reflected adjustments in regional circulation and biogeochemistry that were attributed to both natural shifts and human pressures, with severe negative impacts on local ecosystem services (Taylor et al., 2012). Regrettably, the CARIACO time series program was terminated in 2017.
Ocean time series have provided important insights regarding the impacts of anthropogenic change on individual species and communities of phytoplankton, which support the entire marine food web and are key players in global biogeochemical cycles. These data sets not only document ecological response but they provide the baseline knowledge needed to develop predictive capacity. Using historical data from the Continuous Plankton Recorder (CPR) time series in the North Atlantic, Barton et al. (2016) mapped the biogeography of prominent North Atlantic phytoplankton taxa and then used a model to project future changes in biogeography and community composition. While temperature is an important driver, this study also demonstrated the importance of ocean circulation and surface conditions that influence mixed layer depth (light, salinity, macronutrients). Similarly, an analysis of a long-term phytoplankton time series from the English Channel (Edwards et al., 2013) revealed highly predictable relationships between key functional traits easily measured in the laboratory (light utilization, nitrate uptake, growth rate) and seasonal environmental variations, providing the necessary basis for the use of trait-based modeling approaches to predict phytoplankton response to environmental change.
Management of Marine Resources
Ocean time series observations of marine ecosystems have the capacity to inform management of marine resources such as commercial fisheries and prediction of harmful algal blooms (HABs) and associated human health risks. Marine food webs are inextricably linked to human communities, particularly in coastal waters that are home to keystone commercial fisheries. Ocean time series observations off the United States east (Martha’s Vineyard Coastal Observatory, MVCO) and west (CalCOFI) coasts have recently documented warming-related phenological changes in organisms at lower trophic levels. Such climate-driven shifts in bloom phenology affect the function of marine food webs and, ultimately, alter the ocean’s capacity to provide food and sequester carbon. High-resolution flow cytometer measurements from an ocean time series in New England coastal waters revealed phenological changes in Synechococcus, with spring blooms occurring earlier in response to warmer water temperatures (Hunter-Cevera et al., 2016). Data from the CalCOFI time series (Asch, 2015) also showed shifts in the phenology of larval fishes tied to earlier surface ocean warming in the California Current ecosystem, a productive commercial fishery. A study from the northern California Current (McKibben et al., 2017) documented an increased incidence of shellfish containing domoic acid associated with warm SST anomalies during the upwelling season over the past 20 years. This warm water could be tied to the warm phases of the Pacific Decadal Oscillation (PDO) and ENSO. A risk assessment model based on this connection of climatic and local events can predict domoic acid outbreaks along the United States west coast and other eastern boundary current systems worldwide (Figure 4).
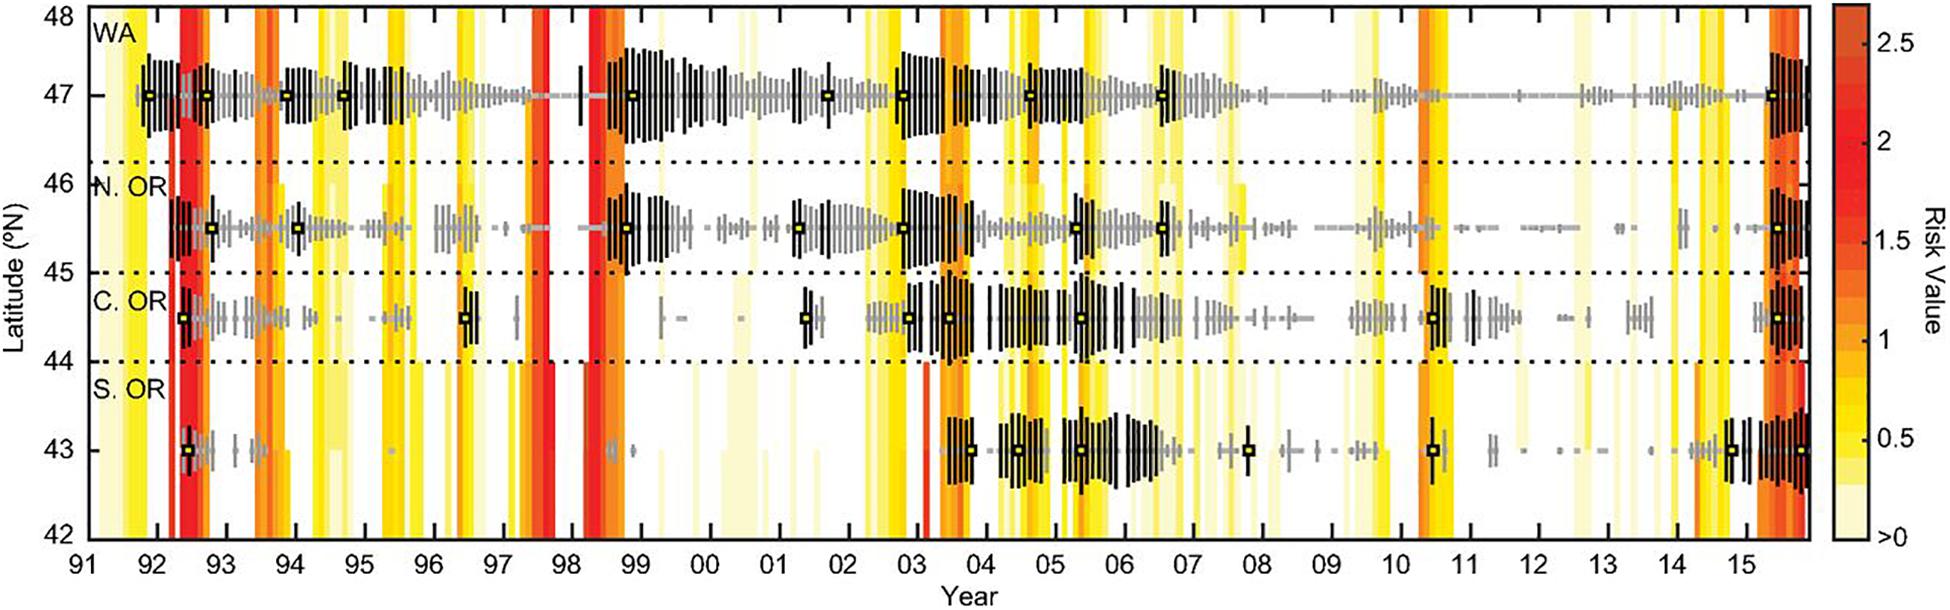
Figure 4. Domoic Acid (DA) risk analysis model output (yellow to red) and DA levels in Oregon (OR) and Washington (WA) razor clams (vertical bars) from 1992 to 2015. Model values indicate increased risk of elevated DA based on proxies of warm ocean parameters; model values are only calculated during upwelling season, when concentrations of phytoplankton are likely to be greatest each year. White regions indicate that elevated DA is least likely, as the model equals zero and/or it is downwelling season. From top to bottom, monthly maximum DA values (vertical bars) are latitudinally binned as follows: WA (46.3°N to 48°N), northern OR (45°N to 46.3°N), central OR (44°N to 45°N), and southern OR (42°N to 44°N). Bar length is proportional to the monthly maximum DA value. Color indicates DA ≥ 20 ppm (black lines), from 1 to < 20 ppm (gray lines), or not detected (gray squares). An absence of points indicates no DA data available. Annual DA maxima used in model evaluation are highlighted with yellow squares. Figure from McKibben et al. (2017).
Challenges of Sustained Ocean Time Series Observations
Despite the well-established benefits of sustained marine ecosystem observations, ocean time series programs face many challenges, including:
• availability of sustained funding;
• varying levels of access to analytical facilities, instrumentation, and technology;
• lack of standardized sampling and analytical approaches across time series, all of which hinder comparability of data sets across sites (Lorenzoni and Benway, 2013);
• varying levels of data access with no community guidelines for data citation to ensure proper crediting of time series data providers (Neuer et al., 2017); and
• multiple disconnected databases and interfaces for accessing time series data without a universal set of data and metadata reporting guidelines.
In a funding environment that typically prioritizes innovative, curiosity-driven science and supports projects on 3- to 5-year timelines, it is a challenge to maintain long-term uninterrupted funding for ocean time series programs, which can result in data gaps, changes in sampling methodology and frequency, and high personnel turnover that can compromise data quality and scientific utility of the data sets. Additionally, long-term time series observations often rely on the availability of major infrastructure such as ships, which requires advance planning, scheduling, and attention to maintenance to support smooth operations. Thus, many time series operate on a shoestring budget or as add-ons to other existing sampling programs of opportunity, which are not necessarily sustainable. The fate of many time series programs is determined by the availability of resources and shifting priorities of public or private funding sources.
Data sharing and discoverability are still major issues in the ocean time series community. While some funding agencies require that time series data sets be made accessible to the broader community on a reasonable timeline, other time series data may have limited access with significant time lags or be fully proprietary, which presents a challenge to conducting science across time series sites. When a time series scientist’s productivity is evaluated based on research and publications, there is limited incentive to invest time in sharing data that have been collected with a great deal of effort. Issues of time series data accessibility were recently broached via a survey of time series data contributors to the International Group for Marine Ecological Time Series (IGMETS) study, an effort led by the Intergovernmental Oceanographic Commission (IOC)-UNESCO, the International Ocean Carbon Coordination Project (IOCCP), and the Ocean Carbon and Biogeochemistry (OCB) Program (O’Brien et al., 2017). Based on survey responses (Figure 5), the top two reasons for limiting and/or delaying data access were: (1) to have sufficient time to QA/QC the data and research and publish new findings from their data collection efforts, and (2) to monitor community data usage as a means to justify continued support for the program(s). In addition, the oceanographic community has seen a proliferation of ocean databases with a broad range of overlapping scientific and programmatic drivers. Funding of these database-only initiatives not only takes away from support for oceanographic sampling efforts themselves (e.g., time series), but a continued lack of connectivity and interoperability among databases translates to a great deal of duplicative effort. The lack of synergy among databases also makes it more challenging for end-users to find comparable data sets of interest from within and across regions.
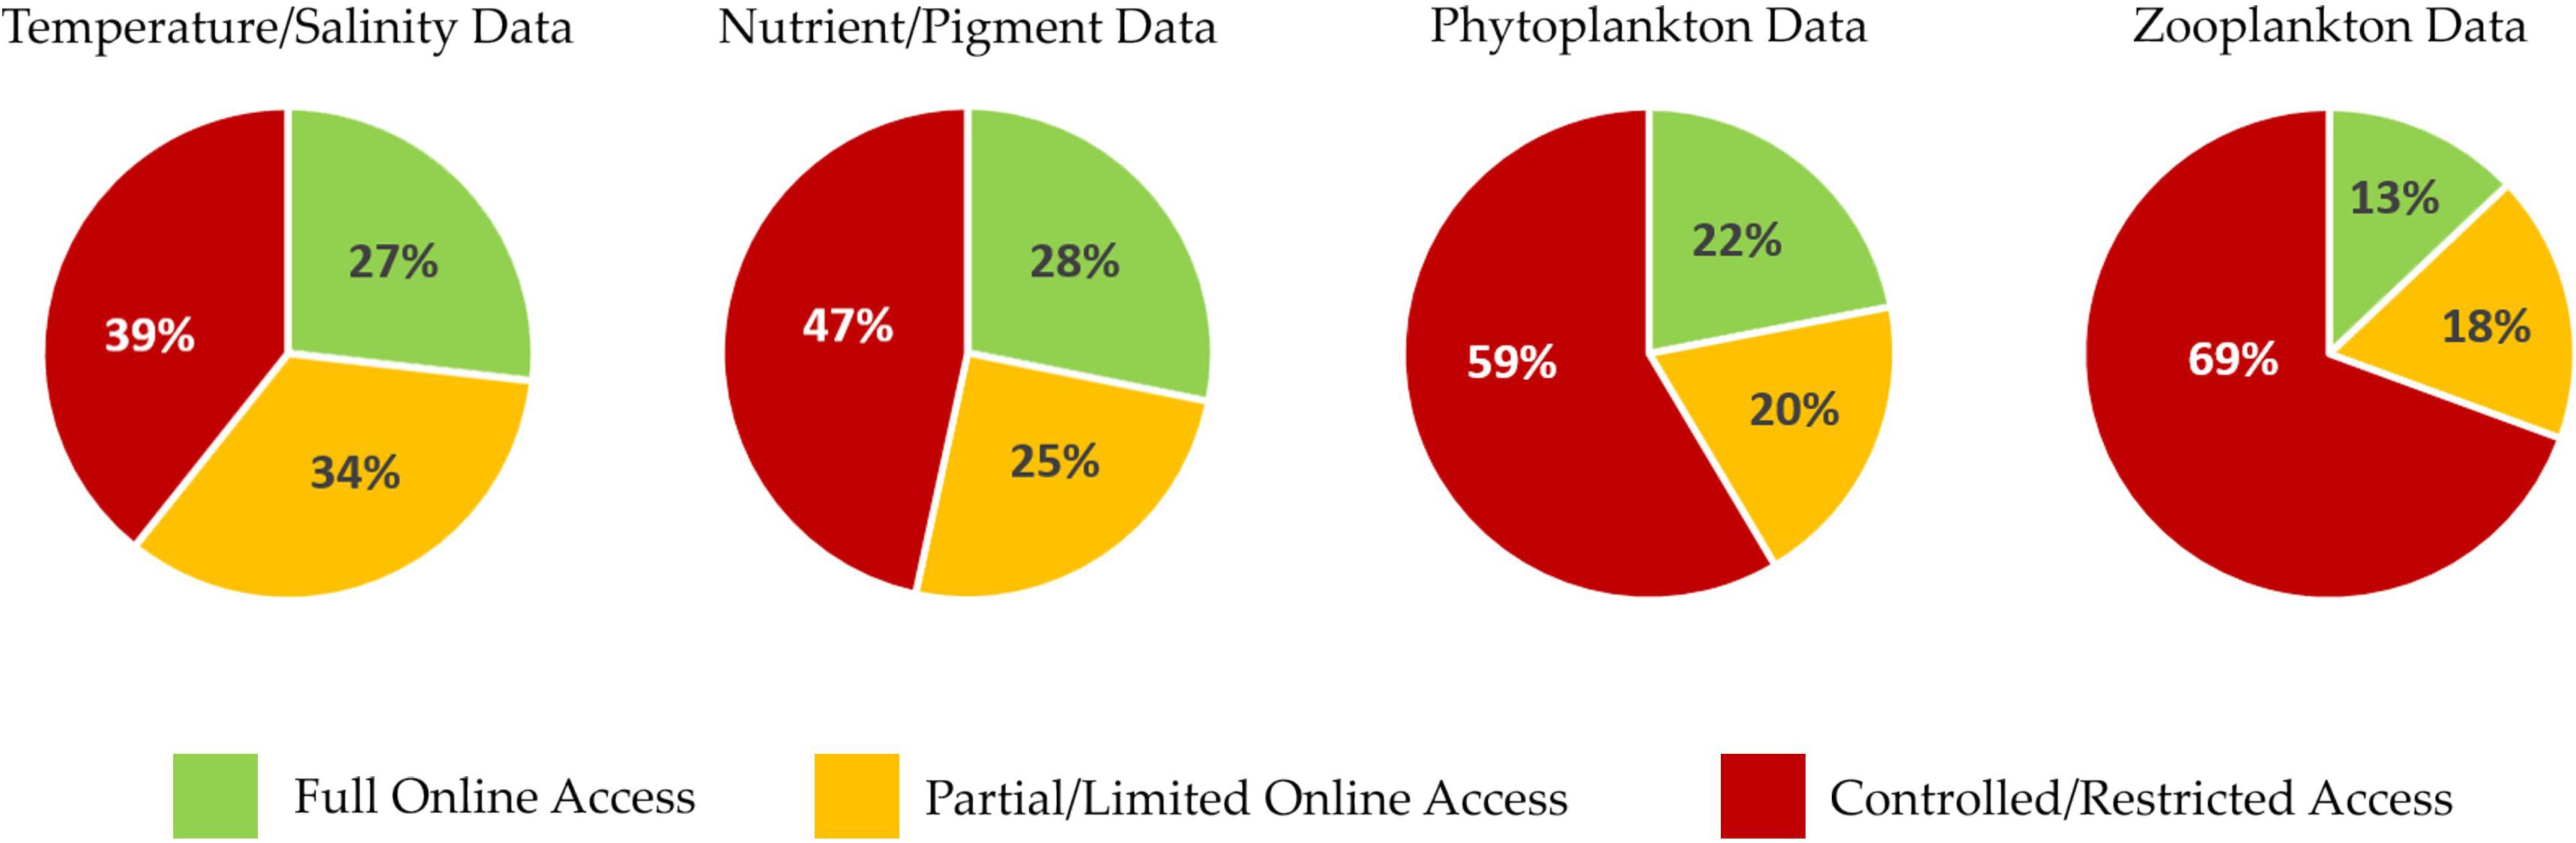
Figure 5. Results of an anonymous survey sent out to all scientists who participated in the International Group for Marine Ecological Time Series (IGMETS) study indicating level of data accessibility by major variable groupings. Green indicates full/free online access to all of the data. Yellow/orange indicates that data are online but have intentional time delays of 2 years or subsetted/incomplete variable sets, requiring users to contact person/institute for the most up-to-date and complete data. Red indicates that none of the data are online and are only available by contacting the data collector or institutional data manager. Compared with physical and biogeochemical data, the percentage of freely available biological data is lower, with a relatively large fraction of zooplankton and phytoplankton data being protected. This likely reflects the amount of time and expertise that is required to collect biological data sets. Training a full species-level microscope plankton taxonomist takes years. Unrestricted and freely available plankton time series tend to be government-run programs with consistent funding that are often tied into legal mandates or water quality monitoring.
Addressing these issues will require a more unified and standardized approach for how time series data are managed and accessed in order to maximize the return on investment and enable ready access to end-users. Additionally, developing mechanisms to incentivize data sharing would go a long way toward addressing this problem. For example, collaborative time series science activities such as IGMETS and the International Council for the Exploration of the Sea (ICES) working groups on microbial, phytoplankton, and zooplankton ecology found that while many time series scientists were not willing to submit their data to a free-access public database, they were willing to loan their data to the working group’s protected cooperative data pool to support comparative analysis and scientific products for broad distribution (Mackas et al., 2012; O’Brien et al., 2012, 2013, 2017; Paerl et al., 2015). This protected pool limits data access to working group participants and ensures that they receive proper citation, credit, and acknowledgment in any scientific product or paper that includes their data. While perhaps not an ideal solution, this model has been effective for supporting the development of topically focused scientific products that utilize time series data. These types of guarantees and controls are not typically available in a public database. IGMETS may have found an acceptable middle-ground, in which it will be creating a (optional-participation) data journal publication in conjunction with its next report, slated to be released in 2020. Data publications assign both a citation and a DOI to the contributed data, and have strong interest from the current IGMETS data-contributing participants. This concept has also been applied successfully for data submission to the Surface Ocean CO2 Atlas (SOCAT). Ultimately, it is a high priority to identify solutions that reduce the lag time between data collection and provision, streamline data access, improve interoperability between data systems, and properly cite data providers.
Ocean Time Series of the Future
Building Biological and Ecological Monitoring Capacity
Monitoring and diagnosing marine ecosystem change requires physiological and molecular measurements of individuals, as well as measurements at different ecosystem scales to explore changes in community structure, trophic dynamics, biodiversity, and biogeographic distribution. Currently, there is limited capacity to measure biological populations and processes remotely (autonomous and satellite-based platforms). Shipboard measurements and incubation experiments are constrained in their spatiotemporal representation, and there is still discrepancy across different methods and approaches, making it difficult to compare observations across multiple time series. While the oceanographic community has made great strides over the past couple of decades in developing physical and biogeochemical observing capacity, a more holistic understanding of marine ecosystem function and change is still needed. The oceanographic community is now developing sensors, instruments, platforms, and systems that could make large-scale and long-term ocean biological observation possible in the future. Advances in imaging, acoustic measurement, and genomic sensing show great promise for the future. Although each approach is in a different stage of maturity, there is great enthusiasm within the communities for investment to develop these capabilities. These observations of life in the sea complement and integrate with physical and biogeochemical observations, and together will provide a more comprehensive understanding of the ocean. Critical to this development is the involvement of private industry, and cooperative, fruitful partnerships between the scientific community and instrument developers to ensure that new technologies address observational needs in different oceanic regimes.
Shipboard and Autonomous Observations
A key scientific driver of many time series, particularly those from the JGOFS era, is the need to quantify the role of the ocean in the global carbon cycle, specifically the relationship between carbon export and biological productivity. Carbon export is frequently modeled as a function of primary production; however, analyses of primary production and export measurements from several ocean time series programs have revealed unexpected relationships between these processes (e.g., Helmke et al., 2010; Maiti et al., 2013). This may reflect methodological issues, undersampling of both production and export in time and space, and/or incomplete understanding of the pathways catalyzing carbon transformation through the oceanic food web. In many cases, time series programs have relied on the use of 14C-bicarbonate assimilation as a proxy measurement of net primary production, with export derived from sediment trap estimates of sinking particle flux. Although both of these methodological approaches have received criticism, their consistent application at time series sites continues to provide insight into factors regulating temporal variability in upper ocean biology. More recently, measurements of NCP, including several approaches amenable to autonomous sensing, have been used with increasing frequency to further constrain productivity and carbon export. Among the most popular of these approaches are those leveraging high-frequency autonomous measurements of O2 or bio-optical measurements of particle concentrations in the upper ocean (Juranek and Quay, 2013; Estapa et al., 2017). More routine integration of such measurements into existing time series programs will provide new insights into processes controlling time-varying relationships between productivity and export. Moreover, leveraging of such autonomous sensing methodologies with shipboard time series programs offers the potential for robust intercomparison across methods and new data to test our understanding of the connectivity between production and export.
Time-varying changes in plankton community structure are known to have direct influences on key ecosystem properties, including regulating the balance between productivity and respiration (i.e., NCP), governing rates of particulate matter export from the upper ocean to the interior waters, and altering the stoichiometry of nutrient availability and supply. State-of-the-art methodologies for assessing spatiotemporal dynamics in plankton biomass and community composition generally rely on: (1) microscopic visualization for quantification of plankton abundance, size, and diversity; (2) bio-optical characterization of plankton light harvesting pigments and/or estimates of bulk particulate material from absorption and scattering of light; and (3) nucleic acid- or protein-based analyses of plankton diversity, abundances, and metabolic function. Automated instruments that can enumerate and characterize individual plankton are an important class of technologies that have demonstrated capability to advance biological and ecological time series. In some cases, existing methodologies integrate one or more of these approaches; for example, development of an imaging flow cytometer couples the identification of plankton based on pigmentation to microscopic visualization of individual cells (Olson and Sosik, 2007; Sosik and Olson, 2007). Scanning flow cytometers (Dubelaar and Gerritzen, 2000), underway flow cytometers (Swalwell et al., 2011), and imaging-in-flow cytometers (Olson and Sosik, 2007) are now producing multi-month to multi-year time series of picocyanobacteria (Sosik et al., 2003; Hunter-Cevera et al., 2016), diatoms (Sosik and Olson, 2007; Peacock et al., 2014), dinoflagellates (Campbell et al., 2010, 2013; Dugenne et al., 2014), microzooplankton (Brownlee et al., 2016), and cytometrically defined subpopulations of phytoplankton (Thyssen et al., 2008). Notably, in many cases with these approaches, genus- to species-level resolution can be achieved, along with temporal resolution of hours to days. Time series capabilities have also been demonstrated for non-cytometric imaging instruments that are especially effective at characterizing relatively large colonial and chain-forming phytoplankton, mesozooplankton, marine snow, and other particles (e.g., Scripps Plankton Camera, Underwater Vision Profiler, Continuous Particle Imaging and Classification System, various holographic camera systems – e.g., Bochdansky et al., 2016). Such technologies are amenable to field-based deployment, permitting detailed spatiotemporal analyses of plankton community dynamics. While these technologies are providing unprecedented scales of observation, much of the focus has been on examining dynamics underlying stocks of plankton in the upper ocean. The development of new observational tools aimed at characterizing taxa that are actively contributing to export is needed to further elucidate linkages between plankton food webs and material and energy export.
Multi-frequency acoustic systems have more commonly been used in shipboard applications to help constrain distribution and biomass of zooplankton and fish but they can also be deployed via autonomous platforms (Benoit-Bird and Lawson, 2016), providing access to a broad range of spatial and temporal scales. Ship-based acoustic measurements have proven to be promising tools for estimating biomass and identifying small-scale physical features that affect nutrient availability and productivity (e.g., Lavery et al., 2010). Recent acoustic measurements of mesopelagic fish, which play a major role in marine food webs and carbon export, suggest that previous abundances have been significantly underestimated (Irigoien et al., 2014; Davison et al., 2015). More routine incorporation of acoustic technology across different platforms in ocean time series programs represents an important opportunity to monitor the health and status of marine ecosystems and their response to climate and environmental change, including ecological and biophysical interactions (Karstensen et al., 2015), animal physiology, biodiversity, biogeographic shifts, and contributions of different trophic levels to carbon export (Benoit-Bird and Lawson, 2016).
Several OceanObs’09 reviews (e.g., Borges et al., 2010; Byrne et al., 2010; Claustre et al., 2010) highlighted the need for new autonomous biogeochemical sensors and systems, in particular, sensors to quantify DIC and total alkalinity (TA). Either of these in situ systems, combined with available pCO2 or pH sensors, can be used to quantify the inorganic carbon system. These measurements, e.g., on a BATS mooring, could help understand the imbalance between NCP and export production, a longstanding conundrum that highlights the challenges of ship-based time series (Michaels et al., 1994), as discussed above. In fact, since OceanObs’09, new DIC and TA instruments have been successfully developed and their potential demonstrated with short deployments (Liu et al., 2013; Spaulding et al., 2014; Fassbender et al., 2015; Wang et al., 2015). These instruments are not widely used, however, because of their cost, complexity, power requirements, and reagent consumption. Slow but steady improvements are being made, but the timeline from initial concept to commercialization for in situ analyzers is typically >10 years. Public competitions such as the XPRIZE can provide the funding and community momentum needed to overcome such barriers and push the technology forward (e.g., Wendy Schmidt Ocean Health XPRIZE on pH sensor development to study ocean acidification, Okazaki et al., 2017). There is new technology similar to that used for O2 optodes that could lead to simplified inorganic carbon sensors (Clarke et al., 2015, 2017). A variety of inexpensive and low-power infrared CO2 sensors are also now being used for marine sensing applications (Fietzek et al., 2014; Bastviken et al., 2015; Hunt et al., 2017).
There has been a striking lack of sensor technologies able to overcome the challenges inherent in automated biological sampling in the ocean. As a result, these types of data sets have lagged behind those associated with physical, and to a certain extent, biogeochemical characterization. However, advances in recent years have poised the ocean observing community to overcome this challenge (e.g., Boss et al., 2018). Sophisticated autonomous bio-analytical systems have been developed that can characterize and quantify microbial populations through automated flow cytometry (Thyssen et al., 2014; Hunter-Cevera et al., 2016) and in situ genetic analysis (McQuillan and Robidart, 2017). These instruments have revealed unexpected diel microbial cycles (Ottesen et al., 2014) and provided new insight into the timing of spring blooms (Hunter-Cevera et al., 2016), as discussed above. Advances in in situ sampling and associated molecular-level characterization highlight another exciting path for future prospects that complement and extend other types of biological measurement capabilities. The Environmental Sample Processor (ESP; Scholin et al., 2017) is a noteworthy technological advance that has already provided time series observations with applications including quantification of biologically produced toxins (Doucette et al., 2009) and use of in situ hybridization to species-specific probes for sensitive detection of HAB species (Greenfield et al., 2006), zooplankton (Harvey et al., 2011), and bacteria (Robidart et al., 2012; Ussler et al., 2013). Emerging technologies and continuing developments promise to expand these applications and pave the way toward instrument systems that are smaller, require less power, and enable larger numbers of samples per deployment.
In the future, biogeochemistry and biological processes may be more intensively studied at time series sites by using multiple platforms, as is becoming commonplace in the physical oceanography community. For example, in the Salinity Processes in the Upper-ocean Regional Study (SPURS) (Lindstrom et al., 2017), sea surface salinity variability was studied by simultaneously using Eulerian (moorings) and Lagrangian (surface drifters, subsurface floats) platforms, 3-D mapping using surface and subsurface gliders and ships with a further broadscale view from satellites. Pioneering field programs such as EXport Processes in the Ocean from RemoTe Sensing (EXPORTS) (Figure 6) that extensively use in situ sensor technology centered on an established time series location (in this case Ocean Station Papa in the northeast Pacific Ocean), perhaps portend a multi-platform future for marine biogeochemical time series research.
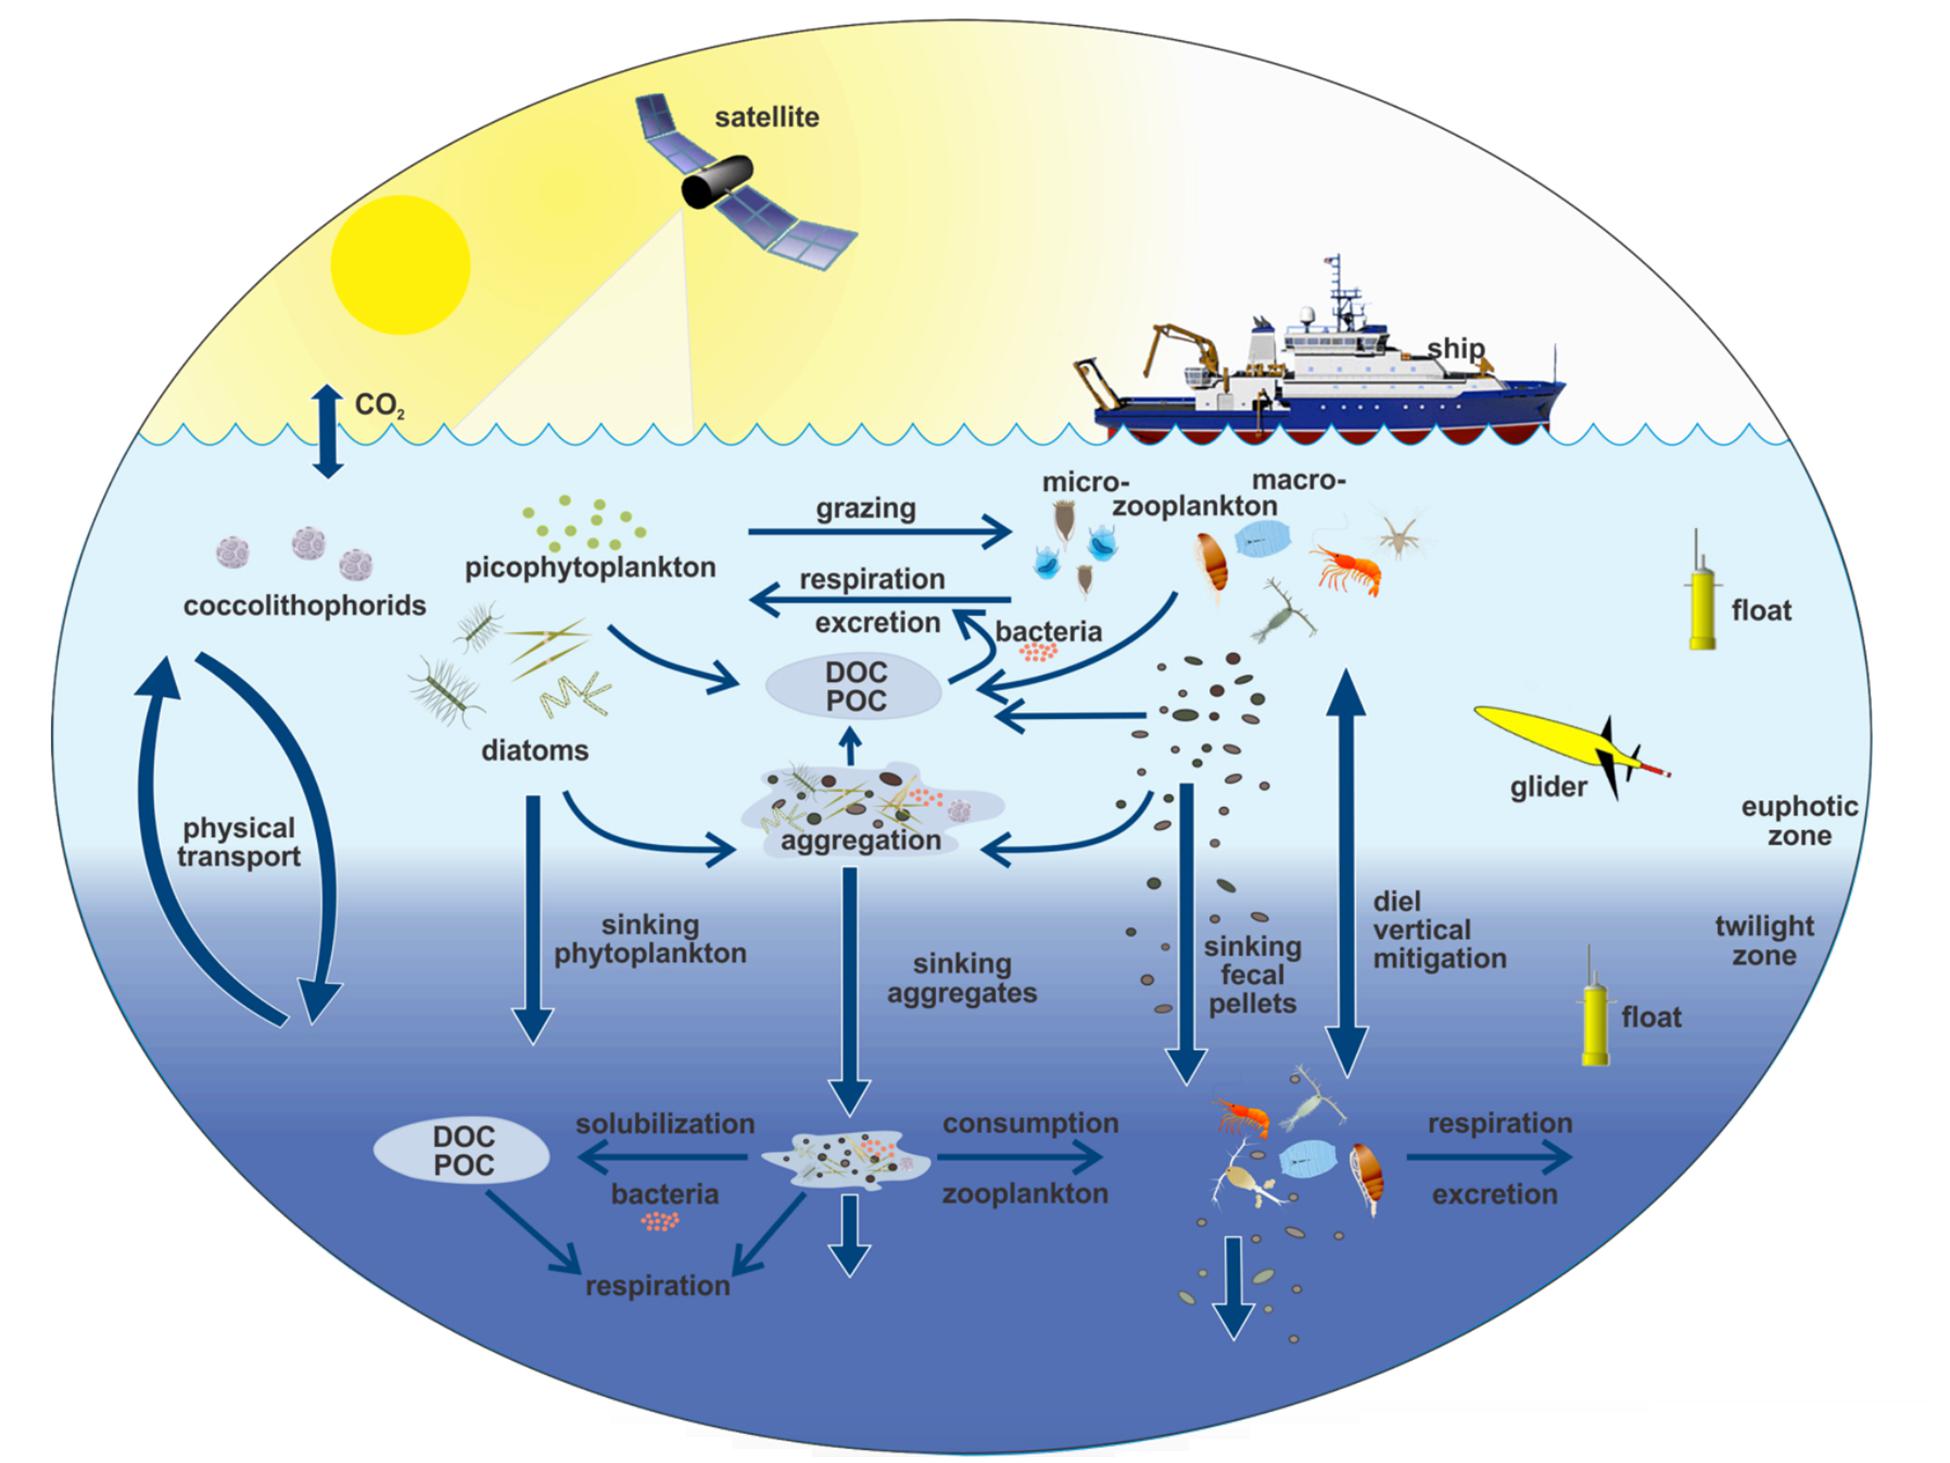
Figure 6. Schematic of EXport Processes in the Ocean from Remote Sensing (EXPORTS) sampling campaign that includes ships, moorings, floats, gliders, sediment traps, and satellite observations. EXPORTS is a large-scale NASA-led field campaign that is leveraging existing ocean time series and other ocean observing assets to provide critical information for quantifying the export and fate of upper ocean net primary production (NPP) using satellite observations and state of the art ocean technologies. Figure from Siegel et al. (2016).
Satellite Observations
To more effectively manage marine resources (e.g., fisheries, wetland systems, coral reef systems, etc.) and assess human health risks (e.g., HABs) in densely populated coastal regions, increased spatial and temporal resolution will be necessary. Remote sensing products have been fundamental tools for providing critical data in coastal regions and monitoring and understanding how marine ecosystems across the globe are responding to climate variability and change. Passive satellite ocean color measurements, as well as active remote sensing with Light Detection And Ranging (LiDAR), have proven to be essential for supporting science and applications related to ocean biogeochemistry and ecology. Remote sensing platforms provide some of the most fundamental global observations currently in existence, and the need for sustained space-based ocean observations has been highlighted at a global level [Schmitt, 2018; National Academies of Sciences, Engineering, and Medicine, 2017; Committee on Earth Observation Satellites (CEOS)].
In the coming decade, new advances in passive ocean color measurements such as the hyperspectral radiometer on the Plankton, Aerosol, Cloud, ocean Ecosystem (PACE) mission will yield higher-resolution ocean color measurements that will enable diagnosis of key marine ecosystem parameters from space, such as phytoplankton community composition (Cetinić et al., 2018). Further development of active remote sensing tools such as LiDAR for ocean applications will provide critical information on the vertical distribution of plankton, and enable measurements in areas of high cloud cover or very high latitudes, where periods of winter darkness preclude complete annual coverage of phytoplankton biomass (Behrenfeld et al., 2017). LiDAR systems remotely measure the vertical distributions of optical properties and particles in the upper ocean. Continued development of compact LiDAR systems for deployment on ships and autonomous platforms has the potential to greatly improve the quality and scope of a variety of oceanographic investigations, as demonstrated on recent deployments on passenger ferries as part of the Gulf of Maine North Atlantic Time Series (GNATS) program (Collister et al., 2018). More routine use of this technology will greatly improve our ability to investigate the role of particles in physical and biogeochemical oceanographic processes (see also Jamet et al., 2019).
Given the cost, infrastructure, and planning efforts involved, support for satellite missions typically happens at the national and international levels. With national science budgets either decreasing or remaining flat, it is essential that advocacy for ocean-focused, space-based missions remains high. International partnerships (e.g., CEOS) coupled with advancement of measurement technologies with planned missions remain at the forefront of all space agencies. Leveraging the rapidly growing small satellite and CubeSat industries will also be fundamental to advancing and expanding space-based ocean observations to better meet the measurement requirements needed to address scientific priorities. Over the past decade, small satellite and CubeSat instrumentation have seen a leap forward in technological development. These platforms will continue to expand over the next decade, increasing the potential for significant advancements in Earth system research through dramatically increased observational capabilities (e.g., Schueler and Holmes, 2016). In a review of the current state of the scientific and technological potential of CubeSats, the National Academies concluded that the technological innovation being developed through CubeSats has rendered access to space more affordable (National Academies of Sciences, Engineering, and Medicine, 2016); this in turn allows for the design of missions that could meet the observational requirements needed to study marine ecosystem structure and function, biogeochemical fluxes, phenology and biodiversity. CubeSats and small satellites also have the capacity to achieve higher spatial resolution (submesoscale) than standard satellite systems (Schueler and Holmes, 2016). CubeSat observations can complement observations from larger spacecrafts, increasing the scientific gains of a mission and establishing satellite constellations. As with any new technology, CubeSats and small satellites will require further testing and advancement to achieve climate-quality observations. Sensor performance, stability and reliability must be carefully evaluated prior to routine and widespread deployment of these platforms. Private industry and non-traditional vendors have interest in developing these technologies as well, and partnerships with scientists should be further explored and encouraged for the benefit of all.
Integration
Time series measurements made from different platforms (e.g., ships, autonomous platforms, and satellites) collectively provide the necessary spatiotemporal breadth required to monitor and study marine ecosystem function. When multiple time series are combined, a basin-wide and even global picture of variability can emerge. To better support science and management needs and fully realize the value of ocean time series programs, it is imperative that we invest in the development of numerical tools and approaches for bringing data sets together across different sites and platforms.
Data Integration
Large spatial-scale analyses using multiple time series enable the detection and interpretation of linkages between marine ecosystem function (e.g., food web dynamics, biogeochemistry, biodiversity, etc.) and climate variability and change (e.g., O’Brien et al., 2017). However, thus far, bringing together data sets across ocean time series in support of broader synthesis product development has met obstacles such as heterogeneity in sampling frequency and methodologies, as well as variable competing objectives and levels of data access across time series programs. While observations of physical parameters and associated data processing and quality control procedures are well established, biogeochemical parameters, particularly biological and ecological measurements, are less mature (Lindstrom et al., 2012). This represents a major frontier for data integration innovation across multidisciplinary time series sites, particularly shipboard platforms, that could initially focus on the most mature EOVs in order to achieve a higher degree of intercomparability. This is crucial for end-users who are interested in long-term marine changes such as ocean deoxygenation or ocean acidification that yield only small signal-to-noise ratios on shorter time scales. In addition, metadata reporting standards are lacking, particularly for novel technologies that are just now being integrated across time series (Lorenzoni and Benway, 2013).
An investment in data coordination across the time series community and with data management centers is needed to build a more sustainable and cost-effective data management model. Rather than investing in additional data management centers and portals, there is a much greater need for improved interoperability among existing centers that serve time series data. The community needs more opportunities (workshops, working groups, etc.) to work together to standardize data and metadata documentation and reporting protocols across platforms and variables to improve data discoverability and intercomparability. Data management centers and data portals also need improvement, as time series data formatting is often awkward, difficult to manipulate, and not standardized even within a single time series. Carefully curated data products with user-friendly interfaces and several different output formats would significantly improve usability of time series data.
Working Across Platforms
Targeted process studies and field campaigns have recently demonstrated great success using multi-platform measurements to study bloom dynamics (Fennel et al., 2011), carbon export (Cetinić et al., 2012; Omand et al., 2015; Siegel et al., 2016), and the role of mesoscale eddies in O2 and nutrient availability (e.g., Mahadevan et al., 2012; Fiedler et al., 2016; Honda et al., 2018).
Autonomous sensors expand the observational footprint of ocean time series by capturing variability on shorter time scales. High-frequency measurements from stationary platforms such as moorings capture episodic events that contribute significantly to annual biogeochemical budgets and net ecosystem state (Jonsson and Salisbury, 2016). Platforms such as gliders can expand the observational footprint of a ship, providing the broader context needed to understand spatial variability in key marine ecosystem characteristics. Time series sites, especially those regularly accessed by ships, serve an important role both for sensor testing and the science conducted with sensors. Nearby oceanographic facilities and research vessels make it possible to deploy sensors on various platforms and recover after short periods (e.g., using gliders). For long-term deployments on moorings or free-drifting subsurface floats, shipboard time series can provide the necessary calibration data to quality-control and interpret the more limited sensor data (Johnson et al., 2010; Plant et al., 2016). For example, shipboard biogeochemical time series stations will play a critical role for groundtruthing data from emerging mobile autonomous observation networks such as the growing BGC-Argo program (Biogeochemical-Argo Planning Group, 2016).
Satellite observations provide the broader synoptic backdrop against which we can evaluate local and regional variability and trends (e.g., O’Brien et al., 2017). Among other services, sustained in situ time series serve a critical and necessary role in the vicarious calibration of satellite sensors and validation of remote sensing products. As remote sensing platforms have grown from a small number of satellites in the early years of ocean color observations (Barale and Schlittenhardt., 1993; Hooker et al., 1993) to the current international fleet of geostationary and Earth-orbiting ocean observing satellites, climate-quality in situ time series have become increasingly indispensable for calibration and validation of land, ocean, and atmospheric remote sensing products. Because satellites measure emitted and reflected radiation from the ocean surface as proxies for physical and biogeochemical parameters, in situ time series are critical in the development, testing, and refinement of remote sensing algorithms (e.g., Zibordi et al., 2015; Silsbe et al., 2016). As the next generation of satellite missions, including NASA’s upcoming PACE mission and the Surface Biology and Geology Designated Observable identified in the recent Decadal Survey for Earth Science (National Academies of Sciences, Engineering, and Medicine, 2018), push the boundaries of what is currently possible with remote sensing to support biological research from space, in situ time series will be even more critical for the development and validation of remote sensing algorithms and products.
Combining observations across platforms must become more routine and straightforward; this powerful multifocal approach for investigating the interplay between the different components of the ocean-atmosphere-climate system will yield improved understanding of the Earth system. Ocean measurements across scales are required to effectively identify large-scale marine ecosystem changes such as gyre expansion (Polovina et al., 2008) and changes in sea ice extent (Grebmeier et al., 2006), and evaluate their impacts on regional physics, biology, and biogeochemistry. Promoting and conducting multi-scale observations will also support improved forecasting and early warnings of public health threats such as HABs (Pitcher et al., 2010), changes in air quality, and evaluation of spatiotemporal distribution of pollutants, including aerosols and oil spills.
Time Series Network
Monitoring ocean change requires a sustained, globally distributed network of observatories that integrates shipboard, autonomous, and remote sensing platforms. There is tremendous value in community initiatives that combine data across sites, as they bring the ocean observing community together, working across individual time series programs, across nations, across disciplines, and across platforms to discuss and strategize effective solutions to challenges such as varied sampling intervals, data gaps, and developing common guidelines for data and metadata reporting. This also represents an important opportunity to build synergies among different observing networks and programs, and develop tools and numerical methods to facilitate more routine data integration.
A robust network of sustained ocean time series with common core sets of observations and compatible methodologies is essential for monitoring and understanding ecosystem-related changes. For example, OceanSITES is a global network of long-term, predominantly autonomous deepwater (open-ocean) reference stations measuring dozens of variables and monitoring the full depth of the ocean, from air-sea interactions down to 5,000 m. The mission of OceanSITES is to collect, deliver, and promote the use of high-quality data from long-term, high frequency observations at fixed locations in the open ocean. The global OceanSITES network (Figure 7A) is maintained by investigators from many countries that are collaborating to establish a global set of core oceanographic measurements being taken at OceanSITES stations. For historical reasons, this network has had a clear focus on physical parameters, but more recently, OceanSITES is starting to facilitate collection of biogeochemical measurements. Each of the moorings seeks its own support and schedules recovery and redeployment. If there was agreement among investigators on a common set of core observations and if a pool of instruments could be funded, provision of these instruments to site operators would initiate a core measurement program. An important precedent for this was when as part of the Deep Ocean Observing Strategy1, OceanSITES took on the challenge of adding deep temperature (T)/salinity (S) time series to existing sites, raised funds to purchase a pool of deep T/S instruments, and now maintains a deep T/S observing array. Operators at many sites are willing to work with other investigators and programs to add sampling, as long as instruments meet mechanical and electrical requirements and do not compromise the existing mission of the mooring. For example, O2 sensors have been added every other year to the Stratus surface mooring off northern Chile. Improved coordination between OceanSITES network sites and nearby or co-located shipboard time series programs (e.g., bottle samples to facilitate sensor calibration and testing) could greatly enhance the biogeochemical and biological measurement capacity of the OceanSITES network. An analogous global network does not formally exist for coastal ocean time series sites, where ecosystems typically experience a more dynamic range of variability and direct connections to, and impacts from, humans. In the United States, coordination through existing networks such as the National Association of Marine Laboratories (NAML) has been proposed as a means of developing a common scientific and logistical framework for monitoring and characterizing coastal marine ecosystems, informing management of marine resources, and providing ready access to engage and educate the public (Feller and Karl, 1996).
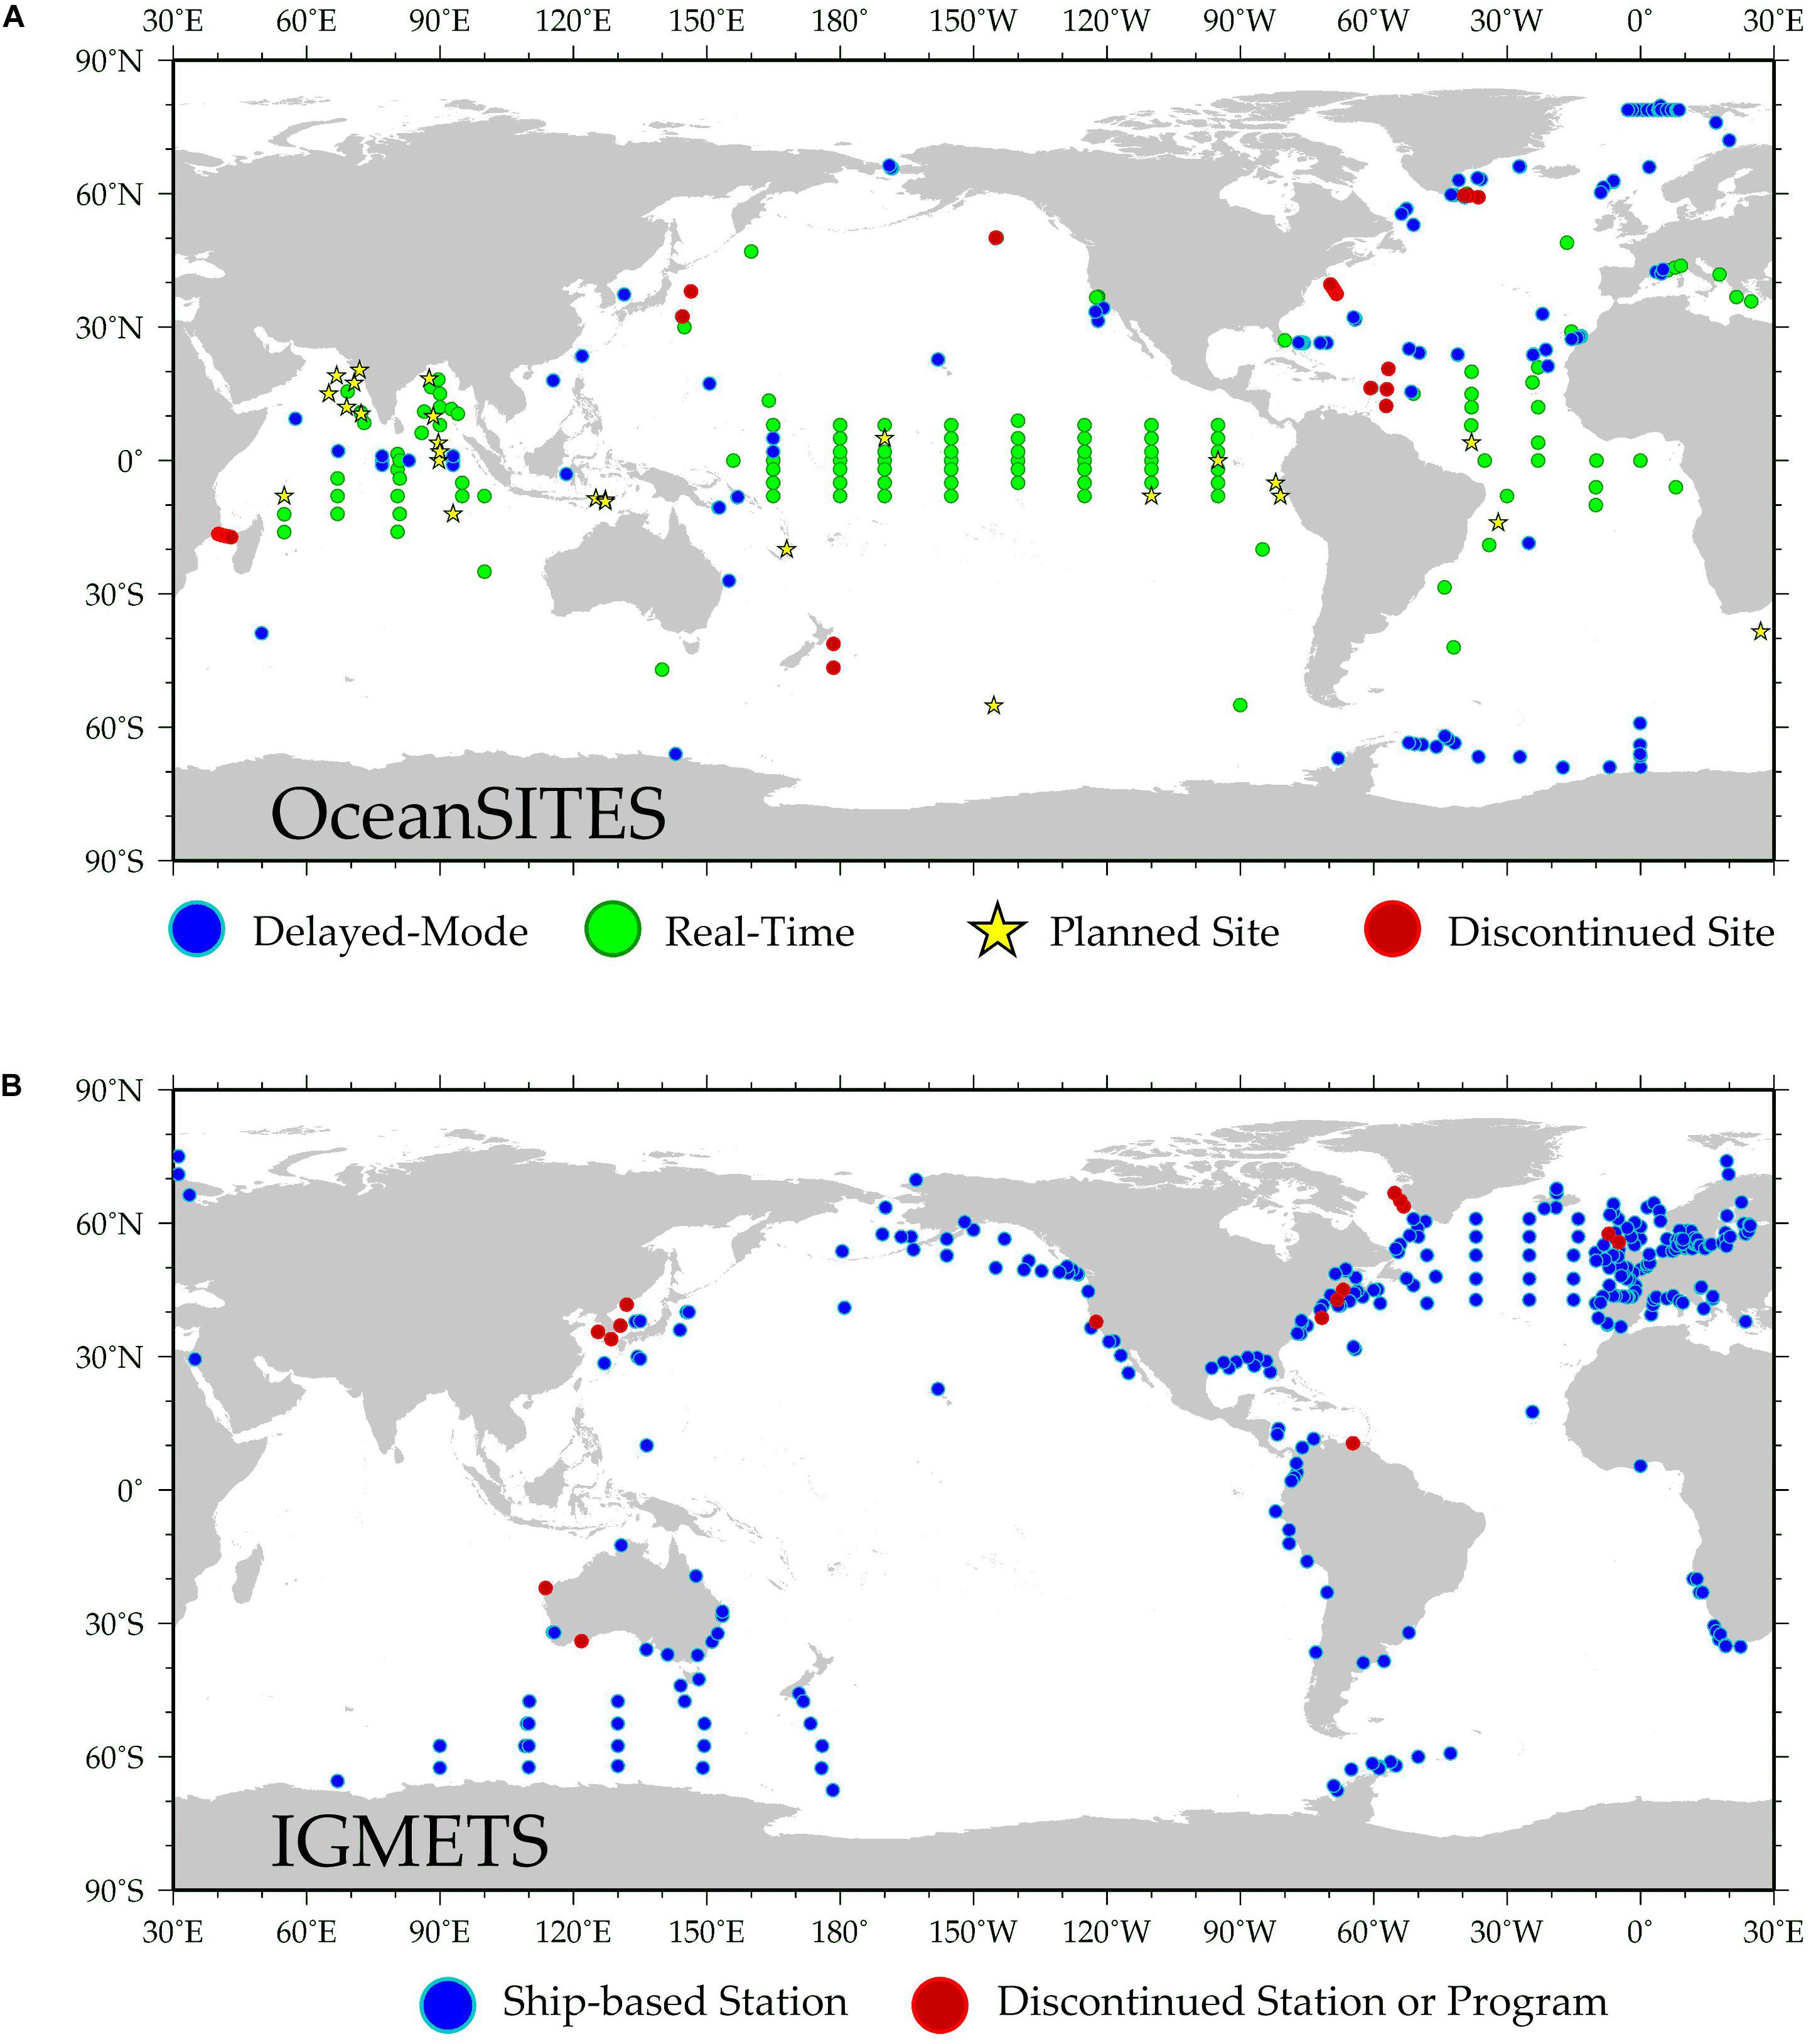
Figure 7. (A) Map of predominantly autonomous ocean observing assets that make up the OceanSITES network (http://www.oceansites.org/). OceanSITES is a worldwide system of long-term, open-ocean reference stations measuring dozens of variables and monitoring the full depth of the ocean from air-sea interactions down to the seafloor. (B) Map of shipboard ocean time series programs that make up the IGMETS network (https://igmets.net/). IGMETS is an activity of IOC-UNESCO that seeks to integrate in situ biogeochemical variables from time series stations, together with satellite-derived information, to look at holistic changes within different ocean regions.
Fledgling efforts such as an international time series methods workshop in 2012 (Lorenzoni and Benway, 2013) provided the initial framework for a comparable global shipboard time series network that has since expanded via the work of IGMETS (O’Brien et al., 2017) to include >300 time series programs (Figure 7B). Despite their importance, several challenges have prevented shipboard time series from becoming a more formalized component of the GOOS. Shipboard data sets have primarily been used to support the goals of individual stations and ancillary projects, and apart from IGMETS, have thus far lacked a systematic effort aimed at regional to global data synthesis and development of continually updated products that are useful to the broader community, such as the Global Ocean Data Analysis Project (GLODAP) and the SOCAT. This represents an important opportunity and challenge for the ocean time series community in the coming decade. Developing a cohesive and vibrant international network of time series scientists will require high-level international coordination and leadership that is guided by a common set of objectives and a unifying framework for data collection, analysis, and reporting. This leadership body and the network that it supports will contribute to the cohesion of global time series platforms and the development of data products that address the needs of different end-users, and participate in regular activities that address key challenges such as standardizing methodological approaches to improve data intercomparability (e.g., Lorenzoni and Benway, 2013); streamlining time series data access and developing mechanisms to incentivize data sharing (e.g., DOI assignments and data reports to increase citation of data sets); building partnerships with regional stakeholders to broaden the use of time series data sets; and increasing visibility and applicability of time series through advisory services, public outreach, and education (e.g., Milliman, 1996). Planning and investing in a regular (every 3–4 years) international time series community science workshop or symposium, perhaps comparable to the LTER Network’s All Scientists’ Meeting, to bring together time series scientists to share new results would greatly improve scientific exchange, collaboration, and coordination across time series programs.
Broadening the Ocean Time Series End-User Community
Ocean time series data currently serve a wide range of scientists studying ocean ecology, biogeochemical cycles, as well as physical and atmospheric dynamics. To bolster continued investment in these programs, we must broaden the community of time series data end-users. These sustained observations are highly valuable assets that enable important and often transformative discoveries and directly support applied research, advisory services (e.g., ecosystem-based management and policy), education, and technology development. Facilitating an ongoing dialogue with a broader end-user community and documenting outcomes of these exchanges is necessary to optimize the regional and global knowledge gained from sustained time series measurements. Strengthening ties to modelers, educators, and decision makers will form the basis for new networks and products to support capacity building, climate prediction, and policy, which will greatly increase the return on investment in these observing programs. To help refine and inform time series sampling efforts and identify opportunities for leveraging, add-ons, and product development, we need more effective mechanisms of collaborating and communicating with different time series data end-users. Ultimately, a robust network of sustained time series observations can be an effective avenue to facilitate collaborations between research and management communities.
Modelers and Time Series Data
Ecological processes are complex, and may involve time lags, environmental feedbacks, and complex interactions that are not easily discernible. Numerical models are important tools for synthesizing knowledge and generating and testing hypotheses, and, in particular, critical for disentangling complex dynamics and understanding large-scale processes such as energy budgets, carbon cycling, and ecosystem dynamics. Thus, it is important for time series data to be assimilated into modeling frameworks that may elucidate cause and effect scenarios not easily perceived through simple statistical analyses. Models can then be used to generate new hypotheses on underlying mechanisms, test the sensitivity of the system to perturbations, and make predictions of how a system might change in the future. In turn, time series measurements can become keystone observational datasets that enable modelers to assess the degree of confidence (or lack thereof) they have in their model’s predictions. Indeed, models are only as good as the understanding and assumptions used to build them, and they require robust datasets to calibrate and validate model dynamics. As such, many models have relied on time series observations for validating the predicted dynamics in the model. Long-term time series provide a constraint on seasonal to decadal variability in physical, biological, and chemical parameters.
Yet, despite the apparent natural symbiosis between time series and models, several hurdles prevent widespread assimilation and use of time series data in models. Foremost are the challenges of measurement consistency across time series and data discovery. Different time series were started and have evolved to address specific regional ecosystem questions. Hence, there are discrepancies among core parameter sets being measured to study the forcings that drive regional ecosystem variability and long-term trends. Outside keystone time series such as HOT, CARIACO, and BATS, many modelers may be unaware of the range of observational programs producing time series data. Also, there is no standardization in the formatting of time series data such that post-processing (e.g., standardization and gridding) is required before models and data can be integrated. Often, formatting can change within a time series, making high-throughput post-processing challenging. Furthermore, there are often discontinuities such that some variables are not available throughout the duration of a time series. In the case of autonomous platforms such as moorings, data sets can be complicated by successive, unmerged mooring deployments; subsurface moorings that incline in response to currents, resulting in variable observing depths; disparate sampling rates among moored instruments, etc. Finally, sampling and measurement protocols are often not standardized between time series sites (or even over the historical period of a single site), and so time-consuming (and expensive) cross-site comparisons and validation may be necessary. In response to request from modelers, moored time series should be, where possible, merged into continuous, gap-free data with common sampling intervals. Clear documentation and metadata reporting should accompany time series data to provide clarity about how variables were measured – e.g., a variable as seemingly straightforward as SST may have different meanings for different communities and disciplines (skin temperature, temperature at 1 m on the surface buoy, bulk mixed layer temperature, etc.). Often, these challenges are tackled by individual research groups independently developing post-processing pipelines that may not be reproducible, robust or usable by others.
To facilitate increased use of time series data by the modeling community and improve communication and exchanges between observationalists and modelers, the use of shared repositories such as GitHub and services like CodeOcean can stimulate the development of community-driven, open source code for extracting, quality-controlling, and gridding time series data. Simply creating shared post-processing scripts that can be tailored for each individual modelers’ needs will significantly decrease duplicative efforts, increase access to time series data, and ensure better validation of numerical models. Critically, experimentalists with expertise in observational methods, not numerical modelers, should be curating datasets prior to usage in models. Standardization across time series will also assist in the integration of time series data and models by creating intercomparable data products from many different regions of the globe. Finally, shared repositories will encourage the use of time series data for model validation, which will improve model quality. Targeted workshops that bring time series PIs and numerical modelers together would also be beneficial, in order to develop a system for setting up and sharing time series data. Such workshops could seed the development of communities centered on commonly used programming languages such as Python, MATLAB, and R. The activities would require modest effort and funding but have the potential to kickstart broader access to time series data that then could continue to grow organically. In addition, opening lines of communication will help support time series data managers to best serve the community by identifying issues with the current data portals. Connecting modelers who are accessing these datasets will build community and enhance knowledge sharing.
Supporting the Needs of Decision Makers
Sustained ocean time series data sets represent a unique opportunity to monitor marine ecosystem disturbances that directly affect human communities such as coastal and open ocean acidification, deoxygenation, HAB outbreaks, commercial fishery losses, and declining marine biodiversity. Indeed, monitoring and quantifying changes in marine ecosystems have already been important influences on policy at the local, national, and international levels. For example, the National Oceanic and Atmospheric Administration (NOAA) monitoring of fish stocks have been essential to the development of regional fisheries management policy in the United States (Methot, and Wetzel, 2013). Observations of pH and other carbon system parameters related to ocean acidification strongly influenced international policy deliberations of the International Maritime Organization (IMO) associated with injection of CO2 into wells in the North Sea (Purdy, 2006). Mounting evidence of ocean warming emerging from Argo float observations was part of the rationale to establish the new United Nations (UN) Decade of Ocean Science for Sustainable Development (2021–2030).
As the oceans change and increasingly impact ecosystem services, information on biological and biogeochemical parameters will become more important in the future. A high priority is to facilitate expanded incorporation of marine ecological time series data into regional decision-making and policy-making. Biological observations of Marine Protected Areas (MPAs) have been called for as critical management tools for these relatively new features (Pomeroy et al., 2005). For example, management of California MPAs has required repeat measurement of the abundance of specific fish species (Gleason et al., 2010). Coastal managers are still working to identify key biological or biogeochemical variables that can be monitored to enable prediction of HABs, which are threats to human health and result in substantial losses in tourism revenues.
Initiating and sustaining a dialogue among time series scientists, stakeholders, and decision makers to co-generate knowledge and develop targeted products, activities, and visualization tools to inform decision-making is an essential first step in building lasting regional partnerships to address these challenges (e.g., Schubel, 1997; Dilling et al., 2006). To address emerging threats such as ocean acidification to coastal resources in the United States, several regional coastal acidification networks are fostering these important partnerships to plan and develop observing infrastructure and decision support products and tools. Thus far, these regional networks have served as an effective model for addressing targeted marine ecosystem threats such as acidification (e.g., Barton et al., 2015), warming, and hypoxia (e.g., Bograd et al., 2008).
As our ability to provide reliable biological and biogeochemical monitoring increases, we expect that the use of these measurements to expand understanding of how ecosystem services may be changing will increase. For example, rapid growth of open ocean aquaculture driven by demand for seafood protein will also result in increased need for monitoring the nearby waters, and as our use of ocean waters increases in the coming decades, the need for evaluation of our impact on the ocean will increase. As OceanObs’19 sets the stage for scientific and societal needs of ocean observations for the next decade, it is anticipated that the upcoming UN Decade of Ocean Science for Sustainable Development will further encourage the implementation of these recommendations and ensure that we have the scientific tools to evaluate those impacts.
Building Capacity Through Training and Education
Fostering a greater connection to and appreciation of the importance of the ocean in our daily lives (e.g., celebrations such as World Ocean Day) is an urgent priority to improve the scientific literacy of our public. Training opportunities and entities to help scientists more effectively communicate important findings to a broad audience will also help educate the public and inform decision-making.
Time series data sets support scientific inquiry from a range of end-users, including educators from grade schools and higher institutes of learning, as well as the general public. Despite the importance of education and outreach in raising public awareness and funding for time series programs, dedicated funding for outreach in particular is often minimal. This paradox (high payoff – low investment) necessitates strategic and creative approaches that leverage existing programs and networks and encourage open sharing and exchange of educational/outreach content to increase visibility of time series worldwide. For example, we must find new ways to educate and engage students (e.g., STEM-based curricula and modules to get classrooms working with time series data streams) and the general public (e.g., content development for informal learning centers, radio interviews, newspapers, and other popular media). For example, regularly sharing the current state of atmospheric (e.g., Keeling curve) and oceanic CO2 in social and print media can help raise public awareness about this problem and simultaneously highlight the importance of sustained observations for monitoring and addressing the problem. Autonomous programs such as Argo and OOI provide near real-time data streams that can be readily incorporated into classroom curricula and even serve as the basis for courses in data management, data visualization, and ocean sciences in general.
Hosting immersive open house experiences for schools, media, and other formal and informal education centers would provide a firsthand look at the importance of sustained repeat observations for monitoring the state of our planet. Typically, very few citizens will have stepped onto an oceanographic research vessel, touched or handled ocean research equipment such as floats and gliders (or even a CTD), or seen plankton through a microscope. These experiences can be illuminating, if not transformative, for many. Some time series programs already have extensive outreach programs that include classroom activities, outreach workshops, and online tools to engage users of all ages. Seagoing programs provide a natural platform for experiential learning at the undergraduate and graduate levels. They generate contextual data for research and an interdisciplinary scope that can broaden a student’s knowledge base. Shipboard platforms are also increasingly incorporating teacher-at-sea programs, virtual classrooms, blogs, and social media to engage the public in these shared investments.
Several established ocean time series sites around the globe possess both the technical infrastructure and scientific expertise to facilitate the necessary training, capacity building, and technology transfer to build a truly global time series network. Ongoing initiatives such as the Nippon Foundation – POGO Alumni Network for Oceans (NANO) represent important opportunities to build capacity and support collaboration, education, and communication across the international ocean sciences community. Global distribution of shipboard biogeochemical time series sites shows major gaps in less developed parts of the world such as Africa. This is not only caused by reduced financial and technical resources in these regions, but also by a lack of human capacity. A training program such as the POGO-led Ocean Training Partnership could be expanded to include ocean time series programs and provide scientists from less developed countries access to shipboard biogeochemical time series sites, where they could actively participate and gain expertise via a Training-Through-Research approach (TTR). This would foster an expansion of a truly global ocean time series network that is inclusive of both developed and developing nations. Routine exchange programs across time series enable scientists of all career stages to engage in important intercomparison activities (calibration, methodological testing, development and testing of standards and reference materials, etc.), share knowledge, and develop new collaborations.
Expanding and investing in initiatives that go beyond individual training to build communities of practice is a high priority requiring partnerships that extend beyond scientific funding entities. Indeed, time series are multidisciplinary programs, so access to training, capacity building, and outreach opportunities must extend beyond traditional oceanographic disciplines. Engaging groups such as statisticians, mathematicians, data librarians, programmers, etc. brings critical expertise to the table that lays the foundation for time series data analysis, synthesis, and product development to expand the reach of time series programs and benefit the community-at-large.
Data Products to Support Science and Society
In order for shipboard biogeochemical time series sites to become an operational component of GOOS, well-defined protocols for uniform data processing and flow need to be developed. This is an essential step in closing the value chain and making these data more routinely available to a broader set of end-users, including stakeholders and decision makers. For instance, time series sites with their high-temporal-resolution data sets could provide annual updates on the state of local-regional marine ecosystems and associated biogeochemical processes affecting the global oceans (e.g., ocean deoxygenation, acidification). Such a mechanism would greatly enhance the visibility of individual sites and also help achieve the United Nations (UN) Sustainable Development Goal (SDG) target 14.3 “minimize and address the impacts of ocean acidification.” Another example hails from the international voluntary observing ship (VOS) network, which has developed the data synthesis product SOCAT (Bakker et al., 2016). This data synthesis product is being updated annually with the most recent quality-controlled data, made immediately available for international end-users. Subsequently, these data are being integrated into the calculation of a global carbon budget (Le Quéré et al., 2018). The Global Carbon Project (GCP) releases the budget on an annual basis and communicates the scientific results up to the policymaker level.
The shipboard biogeochemical time series network holds the scientific capacity to also report on the state of global biogeochemical processes (e.g., a marine “Keeling” curve for the global oceans). For example, IGMETS investigators have synthesized data and analyzed trends in in situ biogeochemical variables from >300 globally distributed time series stations. Together with satellite-derived ocean temperature and chlorophyll, the objective of the first IGMETS study (O’Brien et al., 2017) was to identify holistic changes in marine ecosystems within different ocean regions over the past one to three decades, to explore plausible connections at a global level, and to highlight regions of the ocean that are undergoing especially large biogeochemical and ecological changes. With the development of basic time series data interfaces and explorers that enabled the visualization of trends over different time periods (Figure 8), the first IGMETS study just scratched the surface of what is possible for time series synthesis products. The next IGMETS study, due out in 2020, will continue to improve these tools and data fields, and engage the modeling community with the aim of producing a data journal publication featuring the data of participating time series.
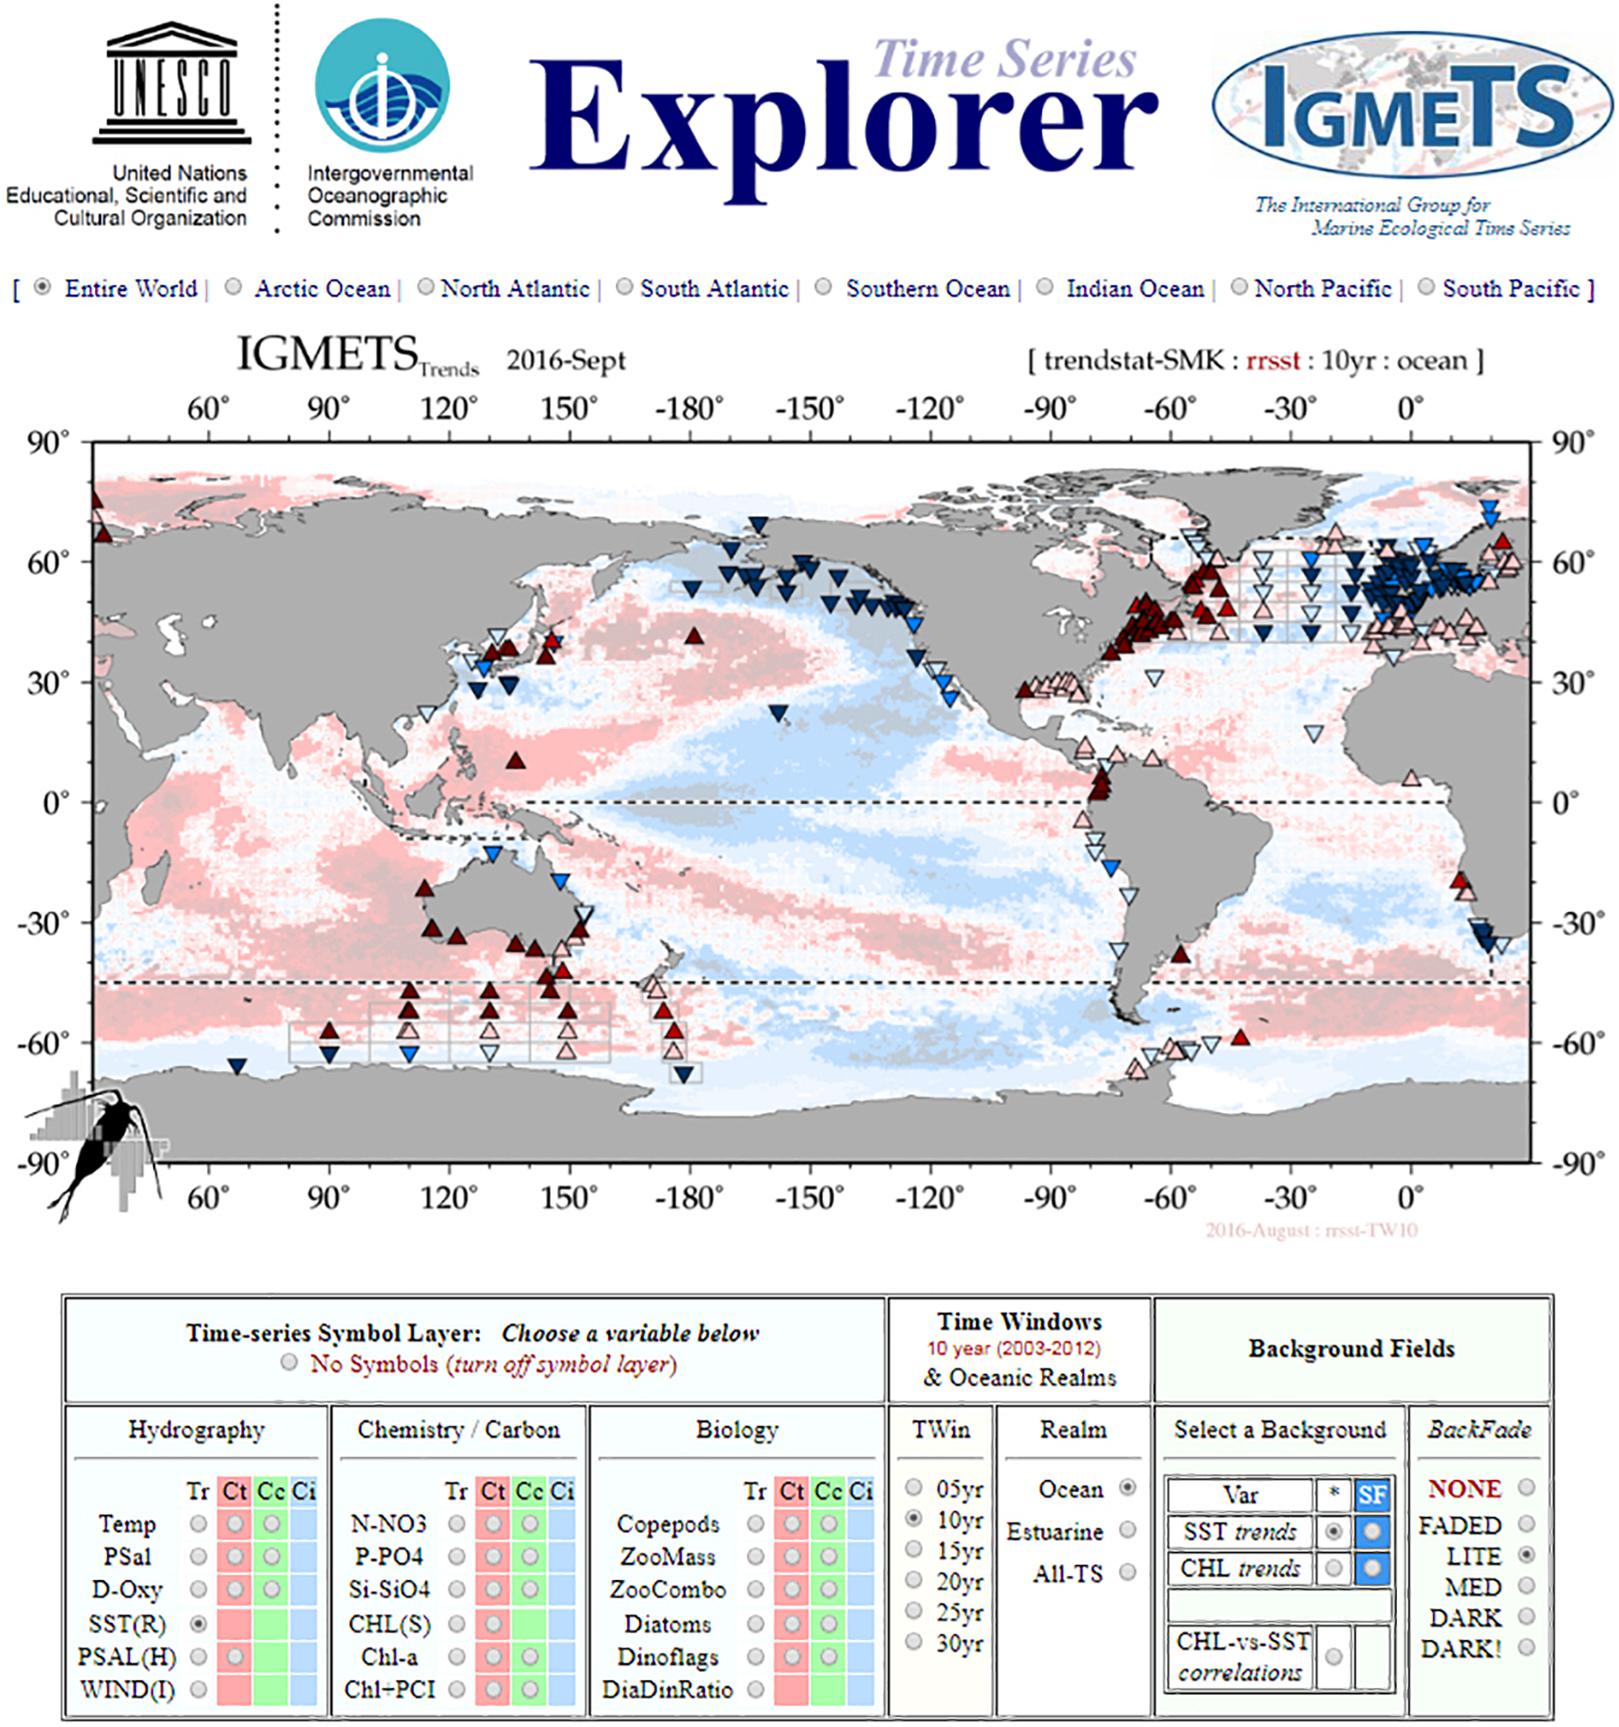
Figure 8. Product highlights from the first International Group for Marine Ecological Time Series (IGMETS) study (O’Brien et al., 2017), which split the time series into the Explorer, which illustrates trends in different variables over time, and the Metabase, an interactive time series information and discovery tool. The next generation of IGMETS will combine Explorer and Metabase into a single tool that enables the user to find time series and preview their variables, trends, and background fields using a single interface rather than having to switch between two different systems.
While the oceanographic community has made great strides over the past couple of decades integrating measurements across platforms, there are still challenges in bringing data together, calling for the development of consistent methodologies and data reporting guidelines. There is a lack of a dedicated data synthesis mechanism and dedicated funding to support these efforts. Developing such a data synthesis product does not require us to start from scratch. A substantial amount of data infrastructure has already been developed under several SOCAT iterations, and protocols exist for handling shipboard biogeochemical data under the GLODAP. However, major tasks are: (1) to develop quality control protocols that are tailored to fixed-point biogeochemical time series sites in order to ensure best possible intercomparability across sites; and (2) to secure resources for such an effort.
It is fundamental that time series data be used for more than just scientific inquiry and research. As time series bridge the gap between science and society, and scientific information from these platforms flows to managers and policy makers in a more transparent manner, more tuned applications and research questions geared toward society will be able to emerge. These “fit-for-purpose” time series data products will not only be able to inform specific decision making, but will also help ensure support for basic research conducted by the time series.
Summary and Actionable Recommendations
The ocean is a prominent fixture of our global economy and our global health, providing a range of services to society, the first and foremost of which is food security. More than 3 billion people currently rely on the ocean as their primary protein source (UN SDG 14). IPCC findings have clearly documented climate-driven changes in ocean temperature, chemistry, phenology, and biogeographic distributions of organisms, which will have lasting effects on marine ecosystems (Pörtner et al., 2014). In a time of accelerating changes, sustained repeat measurements from ocean time series will become an even more fundamental component of our GOOS, since these data sets represent the most effective means available to characterize marine ecosystem shifts and explore causal links and implications for human communities. Ocean time series have withstood many challenges, and over the past decade, at least half a dozen ship-based time series, some older than a decade or more, have been discontinued due to a lack of funding or personnel. The fate of many time series programs is subject to availability of resources, and shifting priorities of public funding sources endangers their sustainability. Developing partnerships with the private sector, philanthropic foundations, local and state governments, NGOs, and other groups offers the potential to diversify time series funding sources and more effectively engage interested stakeholders (Baker et al., 2019).
Effective monitoring of marine ecosystems requires sustained regional networks of physical, biological, and biogeochemical time series observations that integrate shipboard, autonomous, and remote sensing platforms. In order to effectively address the challenges before us, we propose a new vision (Figure 9) for the coordination, collection, synthesis, and broader applications of ocean time series measurements that includes the following components:
(1) Strengthen marine ecological observing capacity through enhancement of shipboard, autonomous, and satellite-based observing assets.
• Leverage platforms of opportunity (e.g., container ships, fishing vessels, etc.) and augment existing observing infrastructure and arrays with new biogeochemical and biological measurements.
• Incorporate existing and emerging technology to enhance time series programs, including plankton and particle imaging systems; automated flow cytometry, in situ genetic sample collection and analysis (eDNA); shipboard and autonomous acoustic and LiDAR systems; new inorganic CO2 system sensors; and satellite-based passive and active technology such as multispectral and hyperspectral radiometers (e.g., NASA PACE), space-based LiDARs, and CubeSats.
• Work across shipboard, autonomous, and satellite platforms to maximize opportunities for calibration, validation, sensor testing, and algorithm development.
• Develop new biological sensor technology (beyond fluorescence, scattering, etc.).
• Enhance capacity (available observing assets, funding) to deploy individual time series programs and ocean observing system (-OOS) networks for adaptive, rapid-response sampling of anomalous ocean/climate events (blooms, marine heat waves, etc.).
(2) Promote greater integration of time series data and models to better understand processes underlying ocean change and improve predictive capacity.
• Establish repositories for modelers to share code for extracting and gridding time series data to avoid duplicative effort.
• Coordinate activities to increase dialogue between time series data generators and modelers to build capacity (programming languages, data analysis, numerical methods, etc.) and streamline data access and processing.
(3) Broaden applications and end-users of time series data.
• Build partnerships (networks, publications, proposals, etc.) among scientists, managers, and stakeholders to utilize ocean time series observations in monitoring and managing ocean challenges like acidification, warming, fisheries decline, HABs, etc. and assessing efficacy of management approaches.
• Incorporate time series data into educational modules and curricula, informal learning exhibits, and popular media outlets to instill the value of sustained long-term marine ecosystem monitoring.
• Use time series platforms to provide immersive oceanographic learning and research experiences for students, educators, and the public.
• Invest in training opportunities (e.g., Ocean Training Partnership) to transfer knowledge and facilitate collaboration across career stages and between developed and developing nations.
• Establish standardized data processing protocols to support use of time series data in products that can inform decision-making (e.g., ecosystem health indices, gridded synthesis products, local/regional/global trend visualizers, etc.).
(4) Foster global collaboration and networking to advance science, expand and improve measurements, and optimize data access.
• Identify mechanisms to incentivize data sharing and credit data providers (e.g., protected data pools, DOI assignments, etc.).
• Standardize data and metadata reporting protocols for different platforms and variables.
• Regularly assess and compare methodologies within and across time series (e.g., Lorenzoni and Benway, 2013).
• Improve data discoverability and interoperability across data centers and portals and support more flexible output formats to serve a broader range of applications and end-users.
• Bring together members of the international time series community on a regular basis to share scientific findings (e.g., “all-scientist meetings,” special sessions at international meetings, etc.).
• Build numerical and statistical capacity through courses, tutorials, etc. for working with large multi-platform data streams.
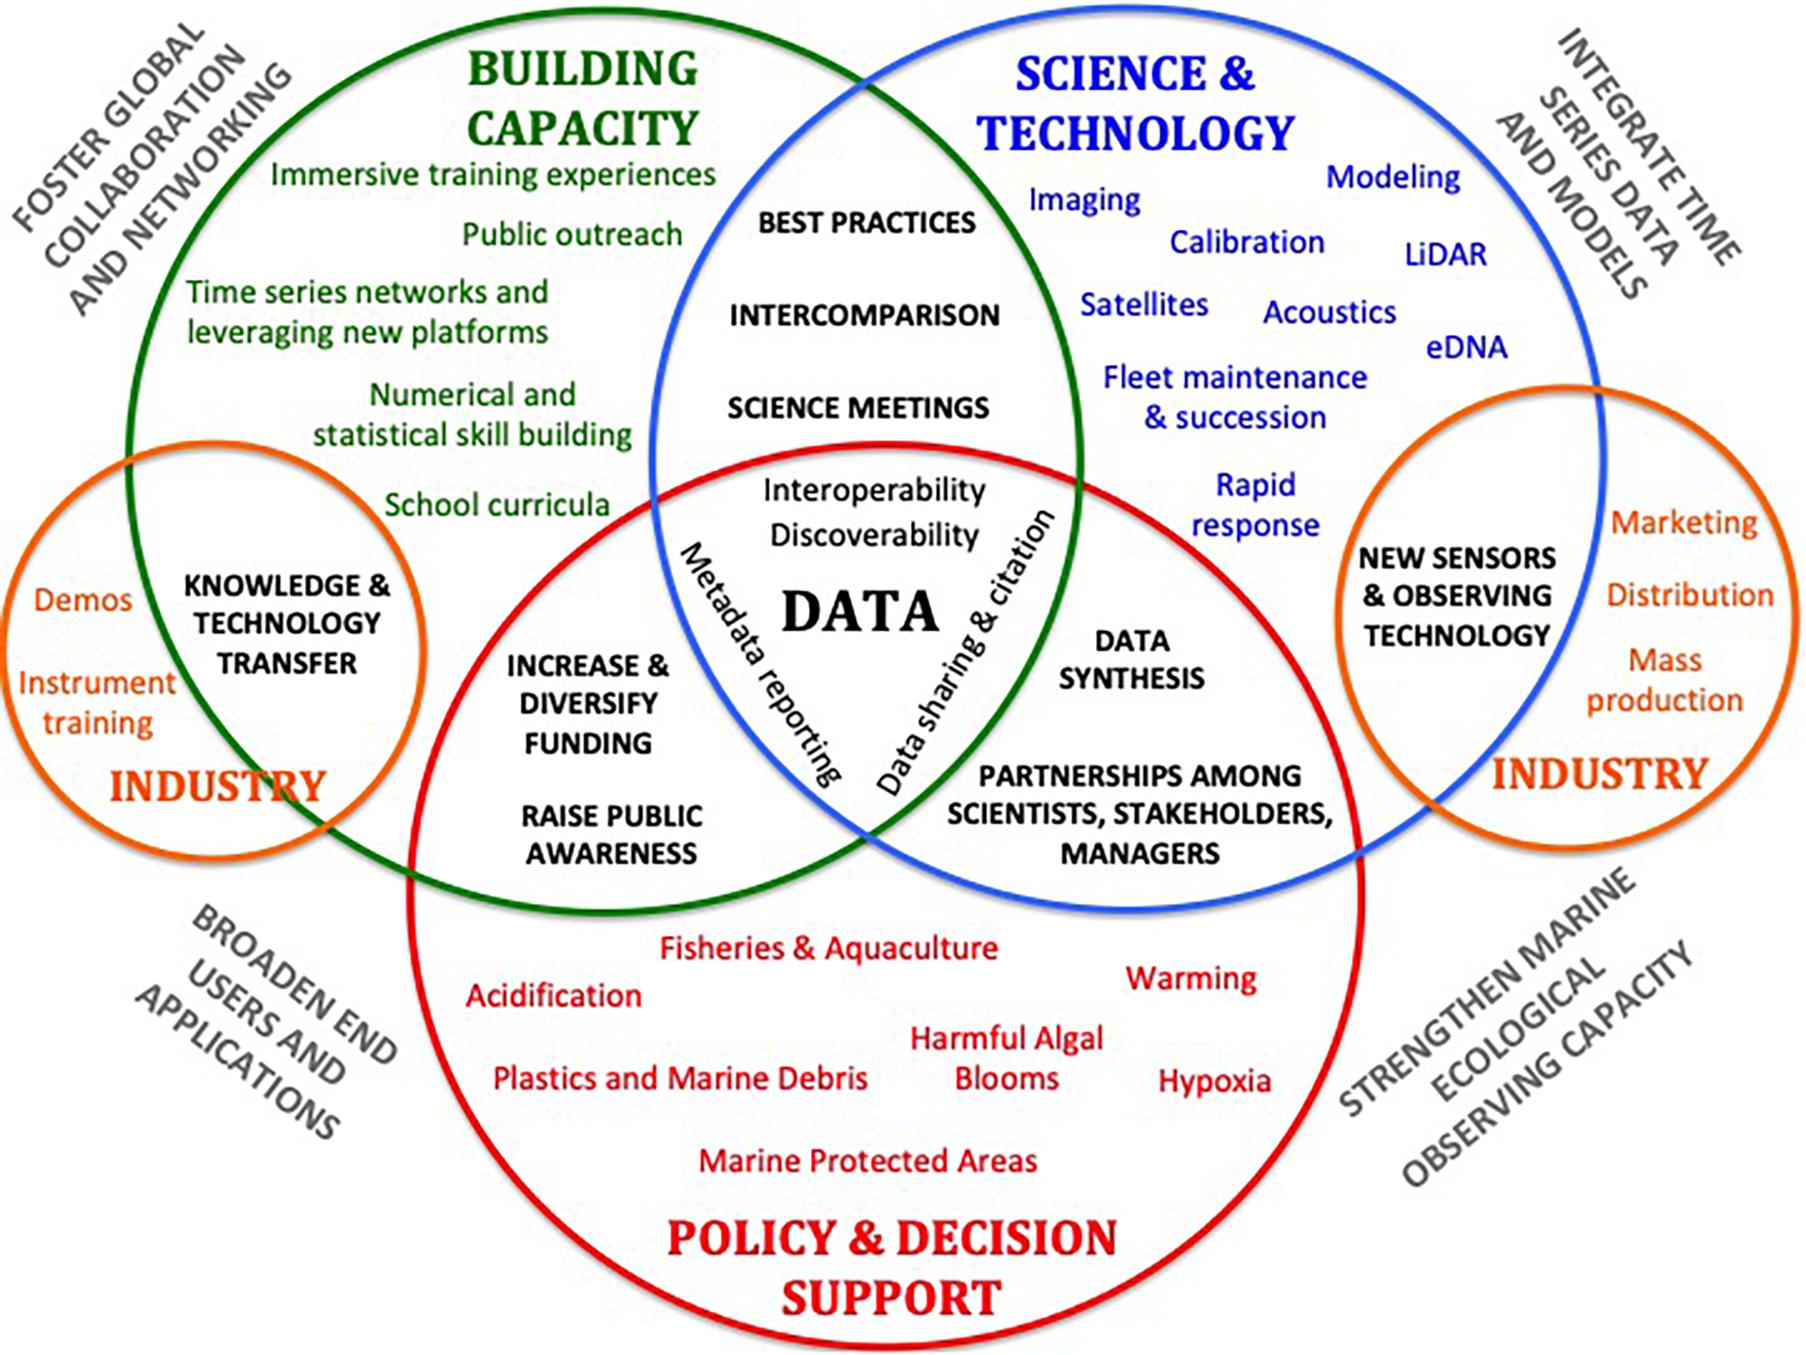
Figure 9. Venn diagram illustration of proposed themes and implementation mechanisms for marine ecological time series of the future.
Author Contributions
HB and LL provided vision and leadership in the conceptualization and writing of this manuscript. All authors contributed sections of the text, as well as editing, feedback, and discussion throughout the development of this manuscript.
Funding
This work was led by HB in the Ocean Carbon and Biogeochemistry (OCB) Project Office, which is supported by the NSF OCE (1558412) and the NASA (NNX17AB17G).
Conflict of Interest Statement
The authors declare that the research was conducted in the absence of any commercial or financial relationships that could be construed as a potential conflict of interest.
Acknowledgments
We thank the organizers of OceanObs’19 for the opportunity to submit this manuscript and to the many funding entities who support ocean time series programs around the world, including but not limited to the United States National Science Foundation, the National Aeronautics and Space Administration (NASA), and the National Oceanic and Atmospheric Administration (NOAA).
Footnotes
References
Asch, R. (2015). Climate change and decadal shifts in the phenology of larval fishes in the California Current ecosystem. Proc. Natl. Acad. Sci. U.S.A. 112, 4065–4074. doi: 10.1073/pnas.1421946112
Baker, D. J., Glackin, M., Roberts, S., Schmitt, R. W., Twigg, E., Vimont, D., et al. (2019). The challenge of sustained ocean observations. Front. Mar. Sci. 6:105. doi: 10.3389/fmars.2019.00105
Bakker, D. C. E., Pfeil, B., Landa, C. S., Metzl, N., O’Brien, K. M., and Olsen, A. (2016). A multi-decade record of high-quality fCO2 data in version 3 of the Surface Ocean CO2 Atlas (SOCAT). Earth Syst. Sci. Data 8, 383–413. doi: 10.5194/essd-8-383-2016
Barale, V., and Schlittenhardt, P. M. (eds). (1993). Ocean Colour: Theory and Applications in a Decade of CZCS Experience. Dordrecht: Kluwer Acadamic, 367
Barton, A., Waldbusser, G. G., Feely, R. A., Weisberg, S. B., Newton, J. A., and Hales, B. (2015). Impacts of coastal acidification on the Pacific Northwest shellfish industry and adaptation strategies implemented in response. Oceanography 28, 146–159. doi: 10.5670/oceanog.2015.38
Barton, A. D., Irwin, A. J., Finkel, Z. V., and Stock, C. A. (2016). Anthropogenic climate change drives shift and shuffle in North Atlantic phytoplankton communities. Proc. Natl. Acad. Sci. U.S.A. 113, 2964–2969. doi: 10.1073/pnas.1519080113
Bastviken, D., Sundgren, I., Natchimuthu, S., Reyier, H., and Gålfalk, M. (2015). Technical note: cost-efficient approaches to measure carbon dioxide (CO2) fluxes and concentrations in terrestrial and aquatic environments using mini loggers. Biogeosciences 12, 3849–3859. doi: 10.5194/bg-12-3849-2015
Bates, N. R., Astor, Y. M., Church, M. J., Currie, K., Dore, J. E., and González-Dávila, M. (2014). A time series view of changing ocean chemistry due to ocean uptake of anthropogenic CO2 and ocean acidification. Oceanography 27, 126–141. doi: 10.5670/oceanog.2014.16
Behrenfeld, M. J., Hu, Y., O’Malley, R. T., Boss, E. S., Hostetler, C. A., and Siegel, D. A. (2017). Annual boom-bust cycles of polar phytoplankton biomass revealed by space-based lidar. Nat. Geosci. 10, 118–122. doi: 10.1038/ngeo2861
Benoit-Bird, K. J., and Lawson, G. L. (2016). Ecological insights from pelagic habitats acquired using active acoustic techniques. Ann. Rev. Mar. Sci 8, 463–490. doi: 10.1146/annurev-marine-122414-034001
Biogeochemical-Argo Planning Group (2016). The Scientific Rationale, Design and Implementation Plan for a Biogeochemical-Argo Float Array. Issy-les-Moulineaux: Ifremer.
Bochdansky, A. B., Clouse, M. A., and Herndl, G. J. (2016). Dragon kings of the deep sea: marine particles deviate markedly from the common number-size spectrum. Sci. Rep. 6:22633. doi: 10.1038/srep22633
Bograd, S. J., Castro, C. G., Di Lorenzo, E., Palacios, D. M., Bailey, H., Gilly, W., et al. (2008). Oxygen declines and the shoaling of the hypoxic boundary in the California Current. Geophys. Res. Lett. 35:L12607. doi: 10.1029/2008GL034185
Bond, N. A., Cronin, M. F., and Freeland, H. (2015). The Blob: an extreme warm anomaly in the northeast Pacific. In state of the climate in 2014 global oceans. Bull. Am. Meteorol. Soc. 96, S62–S63.
Borges, A., Alin, S., Chavez, F., Vlahos, P., Johnson, K., Holt, J., et al. (2010). “A global sea surface carbon observing system: inorganic and organic carbon dynamics in coastal oceans,” in Proceedings of the OceanObs’09: Sustained Ocean Observations and Information for Society, Vol. 2, eds J. Hall, D. E. Harrison, and D. Stammer (Venice: ESA Publication), 21–25. doi: 10.5270/OceanObs09.cwp.07
Boss, E., Waite, A., Muller-Karger, F., Yamazaki, H., Wanninkhof, R., and Sosik, H. (2018). Beyond chlorophyll fluorescence: the time is right to expand biological measurements in ocean observing programs. Limnol. Oceanogr. Bull. 27, 89–90. doi: 10.1002/lob.10243
Breitburg, D., Levin, L. A., Oschlies, A., Gregoire, M., Chavez, F. P., and Conley, D. J. (2018). Declining oxygen in the global ocean and coastal waters. Science 359:eaam7240. doi: 10.1126/science.aam7240
Brownlee, E. F., Olson, R. J., and Sosik, H. M. (2016). Microzooplankton community structure investigated with imaging flow cytometry and automated live-cell staining. Mar. Ecol. Prog. Ser. 550, 65–81. doi: 10.3354/meps11687
Byrne, R., DeGrandpre, M., Short, R., Martz, T., Merlivat, L., and McNeil, C. (2010). “Sensors and systems for in situ observations of marine carbon dioxide system variables,” in Proceedings of the OceanObs’09: Sustained Ocean Observations and Information for Society, Vol. 2, eds J. Hall, D. E. Harrison, and D. Stammer (Venice: ESA Publication), 21–25. doi: 10.5270/OceanObs09.cwp.13
Campbell, L., Henrichs, D. W., Olson, R. J., and Sosik, H. M. (2013). Continuous automated imaging-in-flow cytometry for detection and early warning of Karenia brevis blooms in the Gulf of Mexico. Environ. Sci. Pollut. Res. 20, 6896–6902. doi: 10.1007/s11356-012-1437-4
Campbell, L., Olson, R. J., Sosik, H. M., Abraham, A., Henrichs, D. W., and Hyatt, C. J. (2010). First harmful Dinophysis (Dinophyceae, Dinophysiales) bloom in the U.S is revealed by automated imaging flow cytometry. J. Phycol. 46, 66–75. doi: 10.1111/j.1529-8817.2009.00791.x
Cetinić, I., McClain, C. R., and Werdell, P. J. (2018). Pre-aerosol, Clouds, and ocean Ecosystem (PACE) Mission Science Definition Team Report. NASA PACE Technical Report Series vol. 2. Washington, DC: NASA.
Cetinić, I., Perry, M. J., Briggs, N. T., Kallin, E., D’Asaro, E. A., and Lee, C. M. (2012). Particulate organic carbon and inherent optical properties during 2008 North Atlantic Bloom Experiment. J. Geophys. Res 117:C06028. doi: 10.1029/2011JC007771
Chavez, F. P., Messié, M., and Pennington, J. T. (2011). Marine primary production in relation to climate variability and change. Ann. Rev. Mar. Sci. 2011. 3, 227–260. doi: 10.1146/annurev.marine.010908.163917
Church, M. J., Lomas, M. W., and Muller-Karger, F. (2013). Sea change: charting the course for biogeochemical ocean time-series research in a new millennium. Deep Sea Res. Part 2 Top. Stud. Oceanogr. 93, 2–15. doi: 10.1016/j.dsr2.2013.01.035
Clarke, J. S., Achterberg, E. P., Connelly, D. P., Schuster, U., and Mowlem, M. (2017). Developments in marine pCO2 measurement technology; towards sustained in situ observations. Trends Anal. Chem. 88, 53–61. doi: 10.1016/j.trac.2016.12.008
Clarke, J. S., Achterberg, E. P., Rérolle, V. M. C., Abi Kaed Bey, S., Floquet, C. F. A., and Mowlem, M. C. (2015). Characterisation and deployment of an immobilised pH sensor spot towards surface ocean pH measurements. Anal. Chim. Acta 897, 69–80. doi: 10.1016/j.aca.2015.09.026
Claustre, H., Bishop, J., Boss, E., Stewart, B., Berthon, J. F., and Coatanoan, C. (2010). “Bio-Optical profiling floats as new observational tools for biogeochemical and ecosystem studies: potential synergies with ocean color remote sensing,” in Proceedings of OceanObs’09: Sustained Ocean Observations and Information for Society, Vol. 2, eds J. Hall, D. E. Harrison, and D. Stammer (Venice: ESA Publication), 21–25. doi: 10.5270/OceanObs09.cwp.17
Collister, B. L., Zimmerman, R. C., Sukenik, C. I., Hill, V. J., and Balch, W. M. (2018). Remote sensing of optical characteristics and particle distributions of the upper ocean using shipboard lidar. Remote Sens. Environ. 215, 85–96. doi: 10.1016/j.rse.2018.05.032
Corno, G., Karl, D. M., Church, M. J., Letelier, R. M., Lukas, R., Bidigare, R. R., et al. (2007). Impact of climate forcing on ecosystem processes in the North Pacific Subtropical Gyre. J. Geophys. Res. 112:C04021. doi: 10.1029/2006JC003730
Davison, P. C., Koslow, J. A., and Kloser, R. J. (2015). Acoustic biomass estimation of mesopelagic fish: backscattering from individuals, populations, and communities. ICES J. Mar. Sci. 72, 1413–1424. doi: 10.1093/icesjms/fsv023
Dilling, L., Mitchell, R., Fairman, D., Lahsen, M., Mohser, S., and Patt, A. (2006). “How can we improve the usefulness of carbon science for decision-making,” in Proceedings of the First State of the Carbon Cycle Report (SOCCR): The North American Carbon Budget and Implications for the Global Carbon Cycle Climate Change Science Program CCSP Product 2.2, Washington, DC.
Doucette, G. J., Mikulski, C. M., Jones, K. L., King, K. L., Greenfield, D. I., Marin, R., et al. (2009). Remote, subsurface detection of the algal toxin domoic acid onboard the Environmental Sample Processor: assay development and initial field trials. Harmful Algae 8, 880–888. doi: 10.1016/j.hal.2009.04.006
Dubelaar, G., and Gerritzen, P. (2000). CytoBuoy: a step forward towards using flow cytometry in operational oceanography. Sci. Mar. 64, 255–265. doi: 10.3989/scimar.2000.64n2255
Dugenne, M., Thyssen, M., Nerini, D., Mante, C., Poggiale, J.-C., and Garcia, N. (2014). Consequence of a sudden wind event on the dynamics of a coastal phytoplankton community: an insight into specific population growth rates using a single cell high frequency approach. Front. Microbiol. 5:485. doi: 10.3389/fmicb.2014.00485
Edwards, K. F., Litchman, E., and Klausmeier, C. A. (2013). Functional traits explain phytoplankton community structure and seasonal dynamics in a marine ecosystem. Ecol. Lett. 16, 56–63. doi: 10.1111/ele.12012
Estapa, M., Durkin, C., Buesseler, K., Johnson, R., and Feen, M. (2017). Carbon flux from bio-optical profiling floats: calibrating transmissometers for use as optical sediment traps. Deep Sea Res. Part 1 Oceanogr. Res. Papers 120, 100–111. doi: 10.1016/j.dsr.2016.12.003
Fassbender, A. J., Sabine, C. L., Lawrence-Slavas, N., De Carlo, E. H., Meinig, C., and Maenner Jones, S. (2015). Robust sensor for extended autonomous measurements of surface ocean dissolved inorganic carbon. Environ. Sci. Technol. 49, 3628–3635. doi: 10.1021/es5047183
Feller, R. J., and Karl, D. M. (1996). The National Association of Marine Laboratories: a connected web for studying long-term changes in U.S. coastal and marine waters. Biol. Bull. 190, 269–277. doi: 10.2307/1542549
Fennel, K., Cetinić, I., D’Asaro, E., Lee, C., and Perry, M. J. (2011). Autonomous data describe North Atlantic spring bloom. Eos Trans. AGU 92:465. doi: 10.1029/2011eo500002
Fiedler, B., Grundle, D. S., Schütte, F., Karstensen, J., Löscher, C. R., and Hauss, H. (2016). Oxygen utilization and downward carbon flux in an oxygen-depleted eddy in the eastern tropical North Atlantic. Biogeosciences 13, 5633–5647. doi: 10.5194/bg-13-5633-2016
Fietzek, P., Fiedler, B., Steinhoff, T., and Körtzinger, A. (2014). In situ quality assessment of a novel underwater pCO2 sensor based on membrane equilibration and NDIR Spectrometry. J. Atmos. Ocean. Technol. 31, 181–196. doi: 10.1175/JTECH-D-13-00083.1
Gleason, M., McCreary, S., Miller-Henson, M., Ugoretz, J., Fox, E., and Merrifield, M. (2010). Science-based and stakeholder-driven marine protected area network planning: a successful case study from north central California. Ocean Coast. Manag. 53, 52–68. doi: 10.1016/j.ocecoaman.2009.12.001
Grebmeier, J. M., Overland, J. E., Moore, S. E., Farley, E. V., Carmack, E. C., and Cooper, L. W. (2006). A major ecosystem shift in the northern Bering Sea. Science 311, 1461–1464. doi: 10.1126/science.1121365
Greenfield, D. I., Marin, R. III, Jensen, S., Massion, E., Roman, B., and Feldman, J. (2006). Application of the Environmental Sample Processor (ESP) methodology for quantifying Pseudo-nitzschia australis using ribosomal RNA-targeted probes in sandwich and fluorescent in situ hybridization. Limnol. Oceanogr. Methods 4, 426–435. doi: 10.4319/lom.2006.4.426
Gruber, N., Clement, D., Carter, B. R., Feely, R. A., van Heuven, S., and Hoppema, M. (2019). The oceanic sink for anthropogenic CO2 from 1994 to 2007. Science 363, 1193–1199. doi: 10.1126/science.aau5153
Harvey, J. B. J., Ryan, J. P., Marin, R. III, Preston, C., Alvarado, N., Scholin, C. A., et al. (2011). Robotic sampling, in situ monitoring, and molecular detection of marine zooplankton. J. Exp. Mar. Biol. Ecol. 413, 60–70. doi: 10.1016/j.jembe.2011.11.02
Helmke, P., Neuer, S., Lomas, M. W., Conte, M., and Freudenthal, T. (2010). Cross-basin differences in particulate organic carbon export and flux attenuation in the subtropical North Atlantic gyre. Deep Sea Res. Part 1 57, 213–227. doi: 10.1016/j.dsr.2009.11.001
Henson, S. A., Beaulieu, C., and Lampitt, R. (2016). Observing climate change trends in ocean biogeochemistry: when and where. Glob. Change Biol. 22, 1561–1571. doi: 10.1111/gcb.13152
Honda, M. C., Sasai, Y., Siswanto, E., Kuwano-Yoshida, A., Aiki, H., and Cronin, M. F. (2018). Impact of cyclonic eddies and typhoons on biogeochemistry in the oligotrophic ocean based on biogeochemical/physical/meteorological time series at station KEO. Prog. Earth Planet. Sci. 5:42. doi: 10.1186/s40645-018-0196-193
Hooker, S. B., McClain, C. R., and Holmes, A. (1993). Ocean color imaging: CZCS to SeaWiFS. MTS J. 27, 3–15.
Hunt, C. W., Snyder, L., Salisbury, J. E., Vandemark, D., and McDowell, W. H. (2017). SIPCO2: a simple, inexpensive surface water pCO2 sensor. Limnol. Oceanogr. Methods 15, 291–301. doi: 10.1002/lom3.10157
Hunter-Cevera, K. R., Neubert, M. G., Olson, R. J., Solow, A. R., Shalapyonok, A., and Sosik, H. M. (2016). Physiological and ecological drivers of early spring blooms of a coastal phytoplankter. Science 354, 326–329. doi: 10.1126/science.aaf8536
Irigoien, X., Klevjer, T. A., Røstad, A., Martinez, U., Boyra, G., Acuña, J. L., et al. (2014). Large mesopelagic fishes biomass and trophic efficiency in the open ocean. Nat. Commun. 5:3271. doi: 10.1038/ncomms4271
Jamet, C., Ibrahim, A., Ahmad, Z., Angelini, F., Babin, M., Behrenfeld, M. J., et al. (2019). Going beyond standard ocean color observations: polarimetry and LiDAR. Front. Mar. Sci. 6:251. doi: 10.3389/fmars.2019.00251
Johnson, K. S., Riser, S. C., and Karl, D. M. (2010). Nitrate supply from deep to near-surface waters of the North Pacific subtropical gyre. Nature 465, 1062–1065. doi: 10.1038/nature09170
Jonsson, B. F., and Salisbury, J. E. (2016). Episodicity in phytoplankton dynamics in a coastal region. Geophys. Res. Lett. 43, 5821–5828. doi: 10.1002/2016GL068683
Juranek, L. W., and Quay, P. D. (2013). Using triple isotopes of dissolved oxygen to evaluate global primary productivity. Ann. Rev. Mar. Sci. 5, 503–524. doi: 10.1146/annurev-marine-121211-172430
Karl, D. M. (2010). Oceanic ecosystem time series programs: ten lessons learned. Oceanography 23, 104–125. doi: 10.5670/oceanog.2010.27
Karl, D. M., Bates, N. R., Emerson, S., Harrison, P. J., Jeandal, C., and Llinas, O. (2003). “Temporal studies of biogeochemical processes determined from ocean time series obsevations during the JGOFS era,” in Ocean Biogeochemistry: The Role of the Ocean Carbon Cycle in Global Change, ed. M. J. R. Fasham (New York, NY: Springer), 239–267. doi: 10.1007/978-3-642-55844-3_11
Karl, D. M., Bidigare, R., and Letelier, R. (2001). Long-term changes in plankton community structure and productivity in the North Pacific Subtropical Gyre: the domain shift hypothesis. Deep Sea Res. Part 2 Top. Stud. Oceanogr. 48, 1449–1470. doi: 10.1016/S0967-0645(00)00149-141
Karstensen, J., Fiedler, B., Schütte, F., Brandt, P., Körtzinger, A., and Fischer, G. (2015). Open ocean dead zones in the tropical North Atlantic Ocean. Biogeosciences 12, 2597–2605. doi: 10.5194/bg-12-2597-2015
Lampitt, R. S., Favali, P., Barnes, C. R., Church, M. J., Cronin, M. F., and Hill, K. L. (2010). “In situ sustained Eulerian observatories,” in Proceedings of the OceanObs09: Sustained Ocean Observations and Information for Society, Vol. 1, eds J. Hall, D. E. Harrison, and D. Stammer (Venice: ESA Publication), 21–25. doi: 10.5270/OceanObs09.pp.27
Lavery, A. C., Chu, D., and Moum, J. N. (2010). Measurements of acoustic scattering from zooplankton and oceanic microstructure using a broadband echosounder. ICES J. Mar. Sci. 67, 379–394. doi: 10.1093/icesjms/fsp242
Le Quéré, C., Andrew, R. M., Friedlingstein, P., Sitch, S., Pongratz, J., Manning, A. C., et al. (2018). Global Carbon Budget 2017. Earth Syst. Sci. Data 10:2018. doi: 10.5194/essd-10-405-2018
Lindstrom, E., Gunn, J., Fischer, A., McCurdy, L. K., and Glover, A. (2012). A Framework for Ocean Observing. IOC Information Document. Paris: UNESCO, doi: 10.5270/OceanObs09-FOO
Lindstrom, E. J., Shcherbina, A. Y., Rainville, L., Farrar, J. T., Centurioni, L. R., and Dong, S. (2017). Autonomous multi-platform observations during the Salinity Processes in the Upper-ocean Regional Study. Oceanography 30, 38–48. doi: 10.5670/oceanog.2017.218
Liu, X., Byrne, R. H., Adornato, L., Yates, K. K., Kaltenbacher, E., Ding, X., et al. (2013). In situ spectrophotometric measurement of dissolved inorganic carbon in seawater. Environ. Sci. Technol. 2013, 11106–11114. doi: 10.1021/es4014807
Lorenzoni, L., and Benway, H. M. (eds). (2013). “Report of Global intercomparability in a changing ocean,” in Proceedings of the international time series methods workshop, 2012, Ocean Carbon and Biogeochemistry (OCB) Program and International Ocean Carbon Coordination Project (IOCCP), (St. George’s: Bermuda Institute of Ocean Sciences), 61.
Mackas, D. L., Pepin, P., and Verheye, H. (2012). Interannual variability of marine zooplankton and their environments: within- and between-region comparisons. Prog. Oceanogr. 97–100, 1–14. doi: 10.1016/j.pocean.2011.11.002
Mahadevan, A., D’Asaro, E., Lee, C., and Perry, M. J. (2012). Eddy-driven stratification initiates North Atlantic spring phytoplankton blooms. Science 337, 54–58. doi: 10.1126/science.1218740
Maiti, K., Charette, M. A., Buesseler, K. O., and Kahru, M. (2013). An inverse relationship between production and export efficiency in the Southern Ocean. Geophys. Res. Lett. 40, 1557–1561. doi: 10.1002/grl.50219
McKibben, S. M., Peterson, W., Wood, A. M., Trainer, V. L., Hunter, M., and White, A. E. (2017). Climatic regulation of the neurotoxin domoic acid. Proc. Nat. Acad. Sci. 114, 239–244. doi: 10.1073/pnas.1606798114
McQuillan, J. S., and Robidart, J. C. (2017). Molecular-biological sensing in aquatic environments: recent developments and emerging capabilities. Curr. Opin. Bio Technol. 45, 43–50. doi: 10.1016/j.copbio.2016.11.022
Methot, R. D. Jr., and Wetzel, C. R. (2013). Stock synthesis: a biological and statistical framework for fish stock assessment and fishery management. Fish. Res. 142, 86–99. doi: 10.1016/j.fishres.2012.10.012
Michaels, A. F., Bates, N. R., Buesseler, K. O., Carlson, C. A., and Knap, A. H. (1994). Carbon-cycle imbalances in the Sargasso Sea. Nature 372, 537–540. doi: 10.1038/372537a0
Milliman, J. D. (1996). Integrating research and education with public outreach at coastal laboratories. Biol. Bull. 190, 278–285. doi: 10.2307/1542550
Montes, E., Muller-Karger, F. E., Lorenzoni, L., Cianca, A., Lomas, M., and Habtes, S. (2016). Decadal variability in the oxygen inventory of North Atlantic subtropical underwater captured by sustained, long-term oceanographic time series observations. Glob. Biogeochem. Cycles 30, 460–478. doi: 10.1002/2015GB005183
Naqvi, S. W. A. (2006). Oxygen deficiency in the north Indian Ocean. Gayana 70(Suppl.1), 53–58. doi: 10.4067/S0717-65382006000300011
National Academies of Sciences, Engineering, and Medicine (2016). Achieving Science with CubeSats: Thinking Inside the Box. Washington, DC: The National Academies Press, doi: 10.17226/23503
National Academies of Sciences, Engineering, and Medicine (2017). Sustaining Ocean Observations to Understand Future Changes in Earth’s Climate. Washington, DC: The National Academies Press, doi: 10.17226/24919
National Academies of Sciences, Engineering, and Medicine (2018). Thriving on Our Changing Planet: A Decadal Strategy for Earth Observation from Space. Washington, DC: The National Academies Press, doi: 10.17226/24938
Neuer, S., Benway, H., Bates, N., Carlson, C., Church, M., and DeGrandpre, M. (2017). Monitoring ocean change in the 21st Century. Eos 98, doi: 10.1029/2017EO080045
Neuer, S., Cianca, A., Helmke, P., Freudenthal, T., Davenport, R., and Meggers, H. (2007). Biogeochemistry and hydrography in the eastern subtropical North Atlantic gyre: results from the European time-series station ESTOC. Prog. Oceanogr. 72, 1–29. doi: 10.1016/j.pocean.2006.08.001
O’Brien, T. D., Li, W. K. W., and Morán, X. A. G. (eds). (2012). ICES Phytoplankton and Microbial Plankton Status Report 2009/2010. ICES Cooperative Research Report No. 313. Copenhagen: ICES, 196.
O’Brien, T. D., Lorenzoni, L., Isensee, K., and Valdés, L. (eds). (2017). What are Marine Ecological Time Series telling us about the ocean? A status report. IOC-UNESCO, IOC Technical Series, No. 129: 297. Paris: IOC-UNESCO.
O’Brien, T. D., Wiebe, P. H., and Falkenhaug, T. (eds). (2013). ICES Zooplankton Status Report 2010/2011. ICES Cooperative Research Report No. 318. Copenhagen: ICES, 208.
Okazaki, R. R., Sutton, A. J., Feely, R. A., Dickson, A. G., Alin, S. R., Sabine, C. L., et al. (2017). Evaluation of marine pH sensors under controlled and natural conditions for the Wendy Schmidt ocean health XPRIZE. Limnol. Oceanogr. Methods 15, 586–600. doi: 10.1002/lom3.10189
Olson, R. M., and Sosik, H. M. (2007). A submersible imaging-in-flow instrument to analyze nano- and microplankton: imaging FlowCytobot. Limnol. Oceanogr. Methods 5, 195–203. doi: 10.4319/lom.2007.5.195
Omand, M. M., D’Asaro, E. A., Lee, C. M., Perry, M. J., Briggs, N., Cetinić, I., et al. (2015). Eddy-driven subduction exports particulate organic carbon from the spring bloom. Science 348, 222–225. doi: 10.1126/science.1260062
Ottesen, E. A., Young, C. R., Gifford, S. M., Eppley, J. M., Marin, R., and Schuster, S. C. (2014). Multispecies diel transcriptional oscillations in open ocean heterotrophic bacterial assemblages. Science 345:207. doi: 10.1126/science.1252476
Paerl, H. W., Yin, K., and O’Brien, T. D. (2015). SCOR Working Group 137: “Global Patterns of Phytoplankton Dynamics in Coastal Ecosystems”: an introduction to the special issue of Estuarine, Coastal and Shelf Science. Estuarine Coast. Shelf Sci. 162, 1–3. doi: 10.1016/j.ecss.2015.07.011
Peacock, E. E., Olson, R. J., and Sosik, H. M. (2014). Parasitic infection of the diatom Guinardia delicatula, a recurrent and ecologically important phenomenon on the New England Shelf. Mar. Ecol. Prog. Ser. 503, 1–10. doi: 10.3354/meps10784
Pitcher, G. C., Jiménez, A. B., Kudela, R. M., and Reguera, B. (2010). Harmful algal blooms in eastern boundary upwelling systems. Oceanography 30, 22–35. doi: 10.5670/oceanog.2017.107
Plant, J. R., Johnson, K. S., Sakamoto, C. M., Jannasch, H. W., Coletti, L. J., and Riser, S. C. (2016). Net community production at Ocean Station Papa observed with nitrate and oxygen sensors on profiling floats. Glob. Biogeochem. Cycles 30, 859–879. doi: 10.1002/2015gb005349
Polovina, J. J., Howell, E. A., and Abecassis, M. (2008). Ocean’s least productive waters are expanding. Geophys. Res. Lett 35:L03618. doi: 10.1029/2007GL031745
Pomeroy, R. S., Cid, G. A., Parks, J. E., and Watson, L. M. (2005). How is your MPA doing? A methodology for evaluating the management effectiveness of marine protected areas. Ocean Coast. Manag. 48, 485–502. doi: 10.1016/j.ocecoaman.2005.05.004
Pörtner, H.-O., Karl, D. M., Boyd, P. W., Cheung, W. W. L., Lluch-Cota, S. E., and Nojiri, Y. (2014). “Ocean systems,” in Climate Change 2014: Impacts, Adaptation, and Vulnerability. Part A: Global and Sectoral Aspects. Contribution of Working Group II to the Fifth Assessment Report of the Intergovernmental Panel on Climate Change, eds C. B. Field, V. R. Barros, D. J. Dokken, K. J. Mach, M. D. Mastrandrea, T. E. Bilir, et al. (Cambridge: Cambridge University Press), 411–484.
Purdy, R. (2006). The legal implications of carbon capture and storage under the sea. Sustainable Dev.Law Policy 7, 22–26.
Quay, P., and Stutsman, J. (2003). Surface layer carbon budget for the subtropical N. Pacific: δ13C constraints at station ALOHA. Deep Sea Res. Part 1 50, 1045–1061. doi: 10.1016/S0967-0637(03)00116-X
Robidart, J. C., Preston, C. M., Paerl, R. W., Turk, K. A., Mosier, A. C., and Francis, C. A. (2012). Seasonal dynamics of Synechococcus and Thaumarchaeal microbial populations in Monterey Bay resolved in real time with remote in situ instrumentation. ISME J. 6, 513–523. doi: 10.1038/ismej.2011.127
Sabine, C. L., Feely, R. A., Gruber, N., Key, R. M., Lee, K., and Bullister, J. L. (2004). The oceanic sink for anthropogenic CO2. Science 305, 367–371. doi: 10.1126/science.1097403
Schmitt, R. W. (2018). The ocean’s role in climate. Oceanography 31, 32–40. doi: 10.5670/oceanog.2018.225
Scholin, C. A., Birch, J., Jensen, S., Marin, R. III, Massion, E., and Pargett, D. (2017). The quest to develop ecogenomic sensors: a 25-year history of the Environmental Sample Processor (ESP) as a case study. Oceanography 30, 100–113. doi: 10.5670/oceanog.2017.427
Schueler, C., and Holmes, A. (2016). Hawkeye: CubeSat SeaWiFS update. Proc. SPIE 9978, doi: 10.1117/12.2237374
Siegel, D. A., Buesseler, K. O., Behrenfeld, M. J., Benitez-Nelson, C. R., Boss, E., Brzezinski, M. A., et al. (2016). Prediction of the export and fate of global ocean net primary production: the exports science plan. Front. Mar. Sci. 3:22. doi: 10.3389/fmars.2016.00022
Silsbe, G. M., Behrenfeld, M. J., Halsey, K. H., Milligan, A. J., and Westberry, T. K. (2016). The CAFE model: a net production model for global ocean phytoplankton. Glob. Biogeochem. Cycles 30, 1756–1777. doi: 10.1002/2016gb005521
Sosik, H. M., and Olson, R. J. (2007). Automated taxonomic classification of phytoplankton sampled with imaging-in-flow cytometry. Limnol. Oceanogr. Methods 5, 204–216. doi: 10.4319/lom.2007.5.204
Sosik, H. M., Olson, R. J., Neubert, M. G., Shalapyonok, A., and Solow, A. R. (2003). Growth rates of coastal phytoplankton from time series measurements with a submersible flow cytometer. Limnol. Oceanogr. 48, 1756–1765.. doi: 10.4319/lo.2003.48.5.1756
Spaulding, R. S., DeGrandpre, M. D., Beck, J. C., Hart, R. D., Peterson, B., and DeCarlo, E. H. (2014). Autonomous in situ measurements of seawater alkalinity. Env. Sci. Technol. 48, 9573–9581. doi: 10.1021/es501615x
Stramma, L., Johnson, G. C., Sprintall, J., and Mohrholz, V. (2008). Expanding oxygen-minimum zones in the tropical oceans. Science 320, 655–658. doi: 10.1126/science.1153847
Swalwell, J. E., Ribalet, F., and Armbrust, E. V. (2011). SeaFlow: a novel underway flow-cytometer for continuous observations of phytoplankton in the ocean. Limnol. Oceanogr. Methods 9, 466–477. doi: 10.4319/lom.2011.9.466
Tanhua, T., Orr, J. C., Lorenzoni, L., and Hansson, L. (2015). Increasing ocean carbon and ocean acidification. WMO Bull. 64, 48–51.
Taylor, G. T., Muller-Karger, F. E., Thunell, R. C., Scranton, M. I., Astor, Y., and Troccoli, L. (2012). Ecosystem responses in the southern Caribbean Sea to global climate change. Proc. Natl. Acad. Sci. U.S.A. 109, 19315–19320. doi: 10.1073/pnas.1207514109
Thyssen, M., Grégori, G. J., Grisoni, J. M., Pedrotti, M. L., Mousseau, L., Artigas, L. F., et al. (2014). Onset of the spring bloom in the northwestern Mediterranean Sea: influence of environmental pulse events on the in situ hourly-scale dynamics of the phytoplankton community structure. Front. Microbiol. 5:387. doi: 10.3389/fmicb.2014.00387
Thyssen, M., Mathieu, D., Garcia, N., and Denis, M. (2008). Short-term variation of phytoplankton assemblages in Mediterranean coastal waters recorded with an automated submerged flow cytometer. J. Plank. Res. 30, 1027–1040. doi: 10.1093/plankt/fbn054
Ussler, W. III, Preston, C. M., Tavormina, P., Pargett, D., Jensen, S., and Roman, B. (2013). Autonomous in situ quantitative PCR amplification of aerobic methanotroph genes in the deep sea. Environ. Sci. Technol. 47, 9339–9346. doi: 10.1021/es4023199
Valdés, L., and Lomas, M. W. (2017). “New light for ship-based time series,” in What are Marine Ecological Time Series telling us about the ocean? A status report, Technical Series, No. 129, eds T. D. O’Brien, L. Lorenzoni, K. Isensee, and L. Valdés ( Paris: IOC-UNESCO), 297.
Wang, Z. A., Sonnichsen, F. N., Bradley, A. M., Hoering, H. A., Lanagan, T. M., and Chu, S. N. (2015). An in-situ sensor technology for simultaneous spectrophotometric measurements of seawater total dissolved inorganic carbon and pH. Environ. Sci. Technol. 49, 4441–4444. doi: 10.1021/es504893n
Yang, B., Emerson, S. R., and Peña, M. A. (2018). The effect of the 2013-2016 high temperature anomaly in the subarctic northeast Pacific (the “Blob”) on net community production. Biogeosciences 15, 6747–6759. doi: 10.5194/bg-2018-2246
Keywords: ocean time series, marine ecosystems, climate, end-users, synthesis, sustained observations
Citation: Benway HM, Lorenzoni L, White AE, Fiedler B, Levine NM, Nicholson DP, DeGrandpre MD, Sosik HM, Church MJ, O’Brien TD, Leinen M, Weller RA, Karl DM, Henson SA and Letelier RM (2019) Ocean Time Series Observations of Changing Marine Ecosystems: An Era of Integration, Synthesis, and Societal Applications. Front. Mar. Sci. 6:393. doi: 10.3389/fmars.2019.00393
Received: 19 November 2018; Accepted: 24 June 2019;
Published: 12 July 2019.
Edited by:
Minhan Dai, Xiamen University, ChinaCopyright © 2019 Benway, Lorenzoni, White, Fiedler, Levine, Nicholson, DeGrandpre, Sosik, Church, O’Brien, Leinen, Weller, Karl, Henson and Letelier. This is an open-access article distributed under the terms of the Creative Commons Attribution License (CC BY). The use, distribution or reproduction in other forums is permitted, provided the original author(s) and the copyright owner(s) are credited and that the original publication in this journal is cited, in accordance with accepted academic practice. No use, distribution or reproduction is permitted which does not comply with these terms.
*Correspondence: Heather M. Benway, hbenway@whoi.edu