Multidisciplinary Scientific Cruise to the Rio Grande Rise
 Luigi Jovane1*
  James R. Hein2
  Isobel A. Yeo3,4
  Mariana Benites1
  Natascha M. Bergo1
  Paulo V. F. Corrêa1
  Daniel M. Couto1 Ayrton D. Guimarães1 Sarah A. Howarth3
  Henrique R. Miguel1
  Kira L. Mizell2
  Denise S. Moura1 Francisco L. Vicentini Neto1
  Mayza Pompeu1 Ianco M. M. Rodrigues1
  Frederico R. Santana1
  Pedro F. Serrao1 Tomas E. Silva1 Pedro M. Tura1 Carolina L. Viscarra1 Mateus G. Chuqui1
  Vivian H. Pellizari1
  Camila N. Signori1 Ilson C. A. Da Silveira1 Paulo Y. G. Sumida1 Bramley J. Murton3
  Frederico P. Brandini1
- 1Instituto Oceanográfico, Universidade de São Paulo, São Paulo, Brazil
- 2United States Geological Survey, Santa Cruz, CA, United States
- 3National Oceanographic Centre, Southampton, United Kingdom
- 4Department of Geography, Geology and the Environment, Kingston University London, London, United Kingdom
Introduction
The western Rio Grande Rise (RGR), where this research took place, is an extensive oceanic rise (~150,000 km2) in the South Atlantic Ocean, located ~1,000 km to the east of the Brazil and Argentine basins (Cavalcanti et al., 2015). The RGR has gained special attention from scientists and governments worldwide due to its marine mineral deposits and, as yet, the controversial origin of the rise itself (Montserrat et al., 2019). In 2015, the International Seabed Authority (ISA) and the state-owned Companhia de Pesquisa de Recursos Minerais (CPRM) of Brazil signed a 15-year contract for exploration of Co-rich ferromanganese crusts in the RGR, accentuating the need for baseline environmental studies in the area. Co-rich ferromanganese crusts are of interest as potential resources for critical and rare metals such as Co, Ni, Mn, Bi, Mo, Nb, Pt, REEs, Te, Th, Ti, W, Y, and Zr, most of which are essential for high- and green-technology industries (Hein et al., 2013). The supply of these rare metals is becoming critical as global consumption increases, hence deep-ocean mineral deposits may present an additional resource for these raw materials.
Extensive geophysical surveys in the 1970s and 1980s aimed to characterize the geological structure and morphology of the RGR and surrounding areas. Seismic refraction and reflection surveys by Leyden et al. (1971) covered the SE Brazilian margin. The Deep-Sea Drilling Project (DSDP) contributed significantly to the understanding of the geological history of the region (Barker et al., 1981; Barker, 1983), with DSDP borehole data enabling interpretation of seismic-reflection profiles (Gamboa and Rabinowitz, 1984). This work led to the recognition of the RGR as an aseismic ridge, but has a negative Bouguer anomaly across the summit. This anomaly implies a relative mass deficit for the aseismic ridge relative to the surrounding regions. Gamboa and Rabinowitz (1984) separated the RGR into two distinct geomorphological units with different geological histories; the western (WRGR) and eastern (ERGR) units. The WRGR has an average summit depth of 2,000 m, and widespread Eocene volcanism is thought to have driven the formation of numerous seamounts and later uplift. The ERGR is less well-characterized and consists of two segments bound to the north and south by fracture zones (Gamboa and Rabinowitz, 1981). Both the WRGR and ERGR are cut by NW-SE trending troughs. Recent extensive hull-mounted multibeam surveys by CPRM were carried out as part of a campaign focused on the Fe-Mn crust resources of the RGR (CPRM, 2018). However, detailed and high-resolution geophysical surveys are still scarce for the area. Regarding RGR mineral deposit formation, even greater scarcity exists concerning published scientific studies, except for the work of Benites et al. (2018), in which geochemical results of a single Fe-Mn oxide-coated pebble indicates a hydrogenetic origin—precipitation of Fe and Mn oxyhydroxides directly from the cold seawater.
In this cruise report, we detail the geophysical, hydrographic, geological, oceanographic, and ecological surveys carried out on board the N/Oc Alpha Crucis of the Instituto Oceanográfico da Universidade de São Paulo (Figure 4C) during 22 days (28 January 2018 to 19 February 2018). The goal of the RGR cruise (RGR1) was to gather multidisciplinary data to supplement and expand previous environmental studies of RGR, to serve as baseline data on understanding Fe-Mn deposit formation, and environmental assessments for possible future mining activities on the RGR.
Methods
Areas of Interest
The surveys were conducted over four (4) areas of interest (A1, A2, B1, and B2) (Figure 1), determined based on the likelihood of encountering Fe-Mn crusts on the flanks of the central rift and thicker sediment packages for coring along the plateaus. Areas A and B, as well as the subsections 1 and 2 on opposite sides of the central rift, were chosen in order to compare different locations on the RGR.
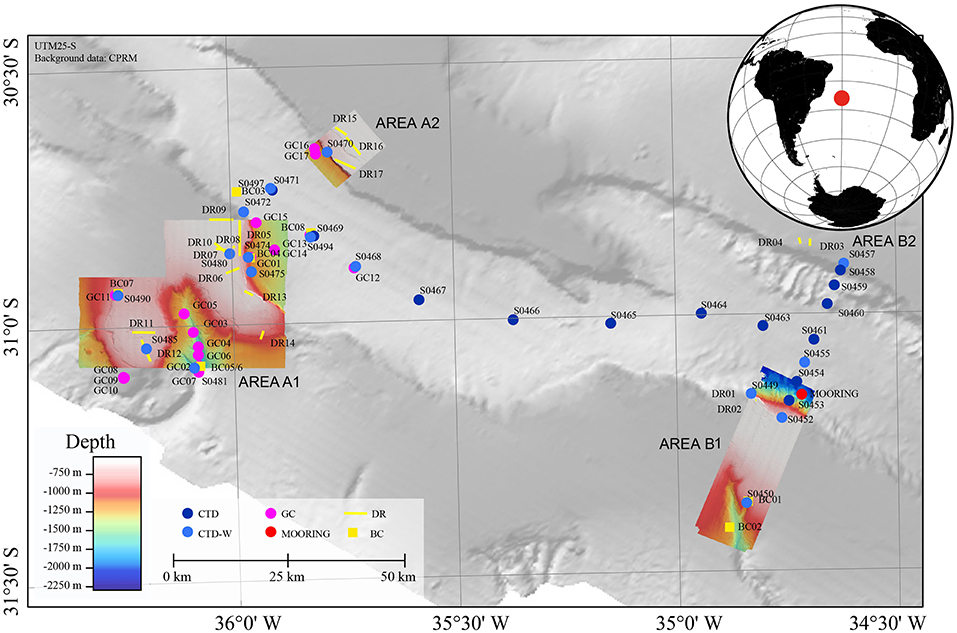
Figure 1. Location map of the operations performed during the oceanographic expedition RGR1 to Rio Grande Rise on board the research vessel Alpha Crucis (Universidade de São Paulo). High resolution bathymetry was performed during the cruise. GC, gravity corer; DR, dredge; BC, box-corer.
Benthic Organisms
Sediment at RGR was collected by using a BX-650 box corer manufactured by Ocean Instruments. The sample box is 50 x 50 cm in area (0.25 m2) and 60 cm deep. Eight attempts at box coring were made, from which six were successful and retrieved sediment from 935 m to 1,566 m water depths (Supplementary Table 4). The box cores collected the first 5 to 15 cm of sediment layer, which was mainly composed of sand, foraminifera, and pteropod ooze. Once on deck, small sediment cores were retrieved from the material collected by the box core for geomicrobiology analysis. Afterwards, the top 5 cm of sediments were sieved through a 300 μm mesh screen and fixed in 96% alcohol for the preservation of macrofauna for shore-based analyses. A total of 39 L of sediment were retained in the sieve from the six box cores.
Biota attached to the rocks collected via dredgings were photographed, removed from the rocks, and fixed in 96% ethanol. Larger individuals had a small piece of tissue cut and frozen at −80°C for molecular biology. Future activity will involve sorting the specimens according to morphotypes and identification to the lowest taxonomic level possible, based on morphological features and DNA barcode. In general, we collected a low number of morphotypes with a few numbers of specimens each (usually one to three individuals). By the end of the cruise, we counted 60 morphotypes, but this number is expected to increase with further analysis, as part of the material could not be sorted during the cruise. Because of the mesh size of the dredges (2 and 2.5 cm), only benthic megafauna organisms have been collected. Nevertheless, a few interesting organisms were collected, including the demersal fish Chaunax sp. (Figure 2E), starfish, sea urchins, barnacles, and black corals, but the most common organisms were corals (Figures 2F, H), small tube-dwelling annelids, and sponges (Figure 2G). We expect the new records will help to determine the biodiversity and ecological patterns of RGR. Besides, it is likely that some of the organisms are new to science. A summary of benthic organisms collected in each dredge is provided in Supplementary Table 5.
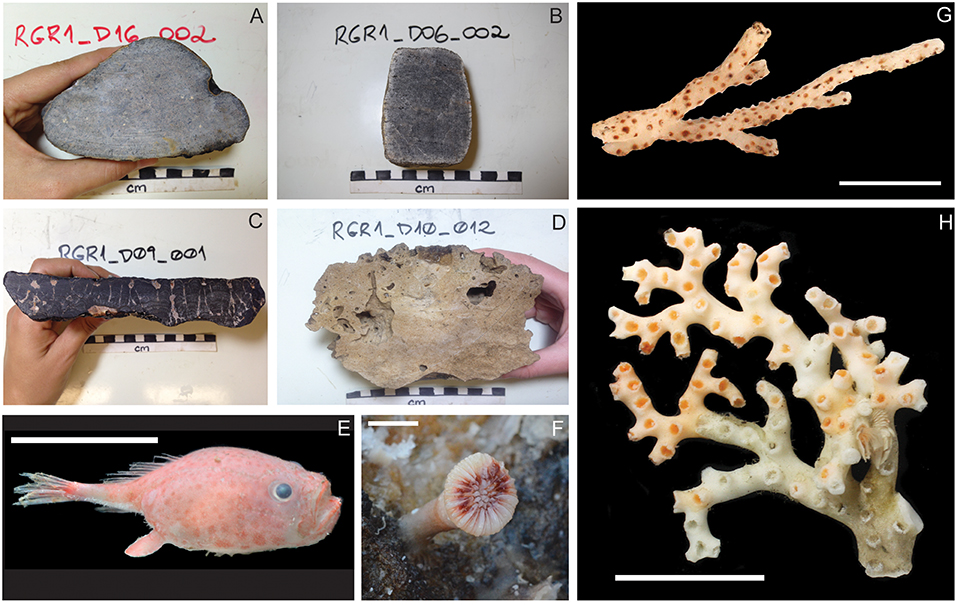
Figure 2. Representative samples of (A) volcanic rock collected in dredge 16, (B) crystalline rock collected in dredge 06, (C) Fe-Mn crusts collected in dredge 09, (D) and calcareous sedimentary rock collected in dredge 10, (E) a dermersal fish Chaunax sp. from dredge 03 (scale represents 50 mm), (F) a solitary coral Caryophyllia diomedeae attached to a rock from dredge 17 (scale: 10 mm), (G) a branch of sponge Sarostegia oculata from dredge 13 (scale: 32 mm), and (H) a branch of coral Enallopsammia rostrata from dredge 03 (scale: 35 mm).
Geophysics
The geophysical survey was designed to obtain: (1) full bathymetric and backscatter coverage over the study areas for use in understanding the morphological and hydrographical setting of Fe-Mn crusts on RGR and for use in planning other operations; (2) chirp sub-bottom profiler data along the lengths of tracks to define the sedimentary cover and to aid selection of gravity and box corer sampling sites; (3) extensive magnetic dataset in order to recognize magnetic inversions, characterize the oceanic crust surrounding the RGR, and to identify the principle anomalies on the RGR and interpret them with regard to the geological and tectonic evolution of the area.
Multibeam bathymetric data were acquired using a Reson 7160 multibeam echosounder (MBES) operating at 41 kHz. The Reson 7160 MBES collected bathymetric, backscatter, and snippet data (Figure 3). Surveys were conducted over areas A1, A2, B1, and B2 (Figures 1, 3; Supplementary Figures 1, 2). Bathymetric data were not collected on the transits to and from the working area as the speed of the ship (8 kn) and water depth (>2,000 m) would have compromised data quality. Data acquisition was achieved using the acquisition module of PDS2000 alongside the Reson Seabat sensor software to modify settings (power, pulse length, range, gain, beam width) during surveys. Raw multibeam files were generated in.s7k format which were automatically time and date stamped in the filename. The surveys were conducted at a relatively slow speed of 4–4.5 kn and aligned as much as possible with the prevailing wave direction as close as possible to the bathymetric contours. Prevailing south-westerly waves caused degradation of data quality because of roll movement of the ship. Lines were planned with a NE-SW orientation and 2.1 km spacing, perpendicular to the main slope. Spacing between acquisition lines (1–2.1 km) was calculated in order to optimize the beam coverage, while beam width was modified dynamically during the survey to attempt to maintain good data quality. The footprint of the sonar operating at 44 kHz and with a beam angle of 1.5° at a slant-range of 30° at 1,000 m water depth was calculated to be around 30 m, slightly better at shallower depths. The sonar was predominantly operated in maximum coverage mode, meaning an equi-distance beam spacing was maintained, rather than an equi-angular one.
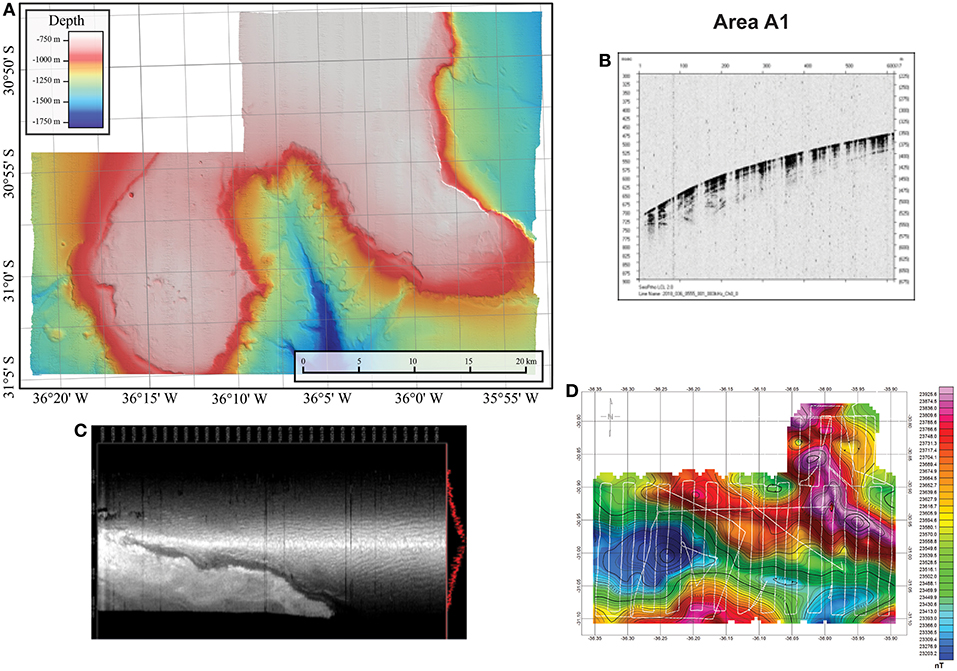
Figure 3. Geophysical survey acquired at Rio Grande Rise: (A) Multibeam bathymetry map, (B) example of a chirp record, (C) example of multibeam backscatter record and (D) total magnetic field (observed raw data with spike removed) from area A1.
Sound Velocity Profiles (SVPs) were collected at least every other day during surveys and at least once per survey to full water depth. A patch test was carried out in area B later and the results were applied retrospectively to data already collected.
Single beam bathymetric tracks were collected using an EA600 echosounder along almost all tracks to calibrate the magnetometer data. The data were recorded in *.xyz format. No further processing was done on this data.
The seismic survey was performed using a Knudsen sub-bottom profiler (SBP) CHIRP 3260, which operated at a frequency of 3.5 kHz and power 2 kW. We used the software SoundeSuite EchoControl from Knudsen for data acquisition. SBP data was used to give information on sediment coverage on the seabed and help select sites for box core and gravity core operations (Figure 3B). We used the following procedure for data processing with software SeisPrho 2.0, following the procedure: (1) Data reading; (2) Geometrical analysis; (3) Filtering and Gain; (4) Deconvolution; and (5) Seismic interpretation.
Finally, a magnetometry survey was performed (Figure 3D) using a SeaSPY magnetometer with an Overhauser sensor produced by Marine Magnetics. During multibeam surveys the magnetometer was towed 250 m behind the ship so survey lines were deliberately overshot by a few hundred meters with wide turning circles to keep the magnetometer at as constant a water depth as possible. The SeaSPY is a total field magnetometer, so it measures only the intensity or magnitude of the magnetic field vector, independent of its direction. The resolution is 0.001 nT and the absolute accuracy is 0.1 nT. There is no heading error, temperature drift, or dead zone associated with the measurements.
For all geophysical surveys, the GPS positioning was provided by an Applanix Wave Master DGPS with spatial resolution of 17 m.
Hydrography
The goals of the hydrographic survey were to: (1) measure current velocities to unravel local small-scale circulation features generated by topography; (2) measure the current close to the seabed to determine the nature of the benthic nepheloid layer; (3) map the main hydrographic features and; (4) infer possible interactions between secondary circulation generated by bathymetric gradients and regional current flow. Measurements of currents, temperature, salinity, dissolved oxygen, and fluorescence were carried out with unprecedented spatial resolution for the RGR area.
The hydrographical stations consisted of conductivity-temperature-depth (CTD) profiles collected using a Sea-Bird Electronics 9plus equipped with pressure, conductivity, dissolved oxygen, turbidity, and a-chlorophyll and picoerythrin fluorescence sensors (Figures 4A,D and Supplementary Table 7). The stations were taken along three transects, two perpendicular to the RGR central rift and 120 km distant from each other, and the third one along the central rift. Besides these stations, additional CTD stations were carried out at places where biological material was collected.
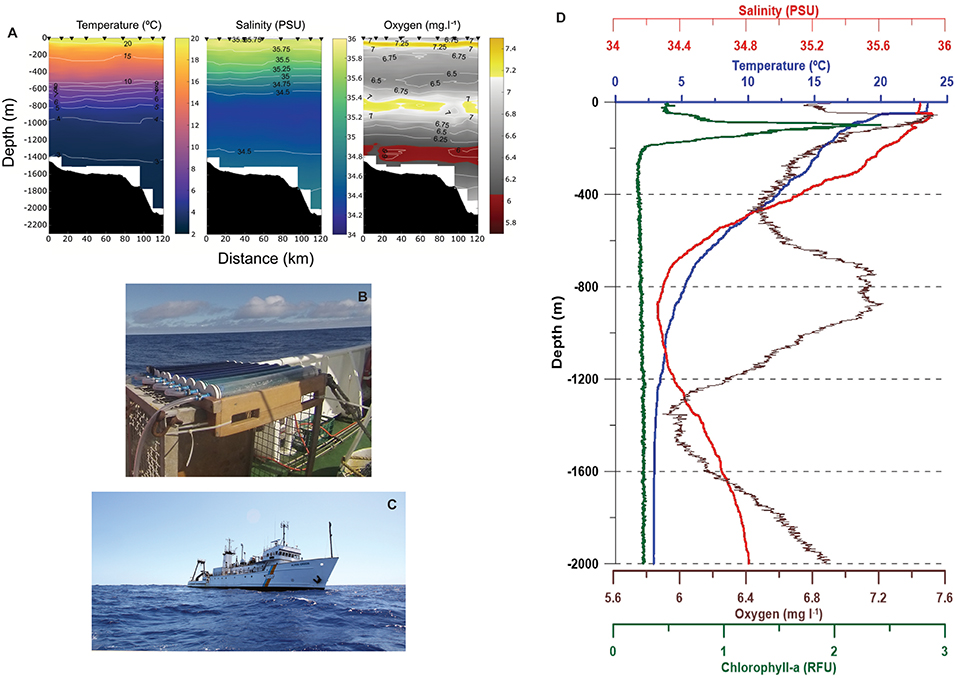
Figure 4. (A) Water column temperature (°C), Salinity (PSU), and Dissolved Oxygen (mg L−1) section for the CTD transect along the central rift, (B) In-situ simulated primary production experiment, (C) RV Alpha Crucis from the Instituto Oceanográfico da Universidade de São Paulo, and (D) CTD water column profiles of salinity (PSU), temperature (°C), dissolved oxygen (mg L−1), and chlorophyll-a (RFU).
Vertical profiles of current velocity through the water column were acquired, including the benthic nepheloid layer, using a downward-facing lowered acoustic doppler current profiler (LADCP) WorkHorse 300 kHz from Teledyne RDI with 2 m resolution coupled to the rosette. Finally, a hull-mounted ADCP Ocean Surveyor 75 kHz from Teledyne RDI continuously acquired velocity profiles from 16 to 400 m depth with horizontal resolution of 8 m. Data acquired by CTD, LADCP, and hull-mounted ADCP will be processed using the codes provided by the producer (SBE). The data are corrected using these codes, mainly for the relative delay on sensors response and removal of oscillations due to waves. Afterwards, the pre-processed data are exported as ASCII files and processed in MATLAB for removal of biased values, smoothing, and windowing. Figures will be generated based on the processed data. ADCP data are processed by using the Common Ocean Data Access System (CODAS) package (developed by University of Hawaii), in which the data are corrected for vessel height and georeferenced using GPS from the vessel. Biased data are removed manually and the processed data are exported to MATLAB. The hydrographic stations summary is in Supplementary Table 1.
Geological Sampling
Three different dredge types were used for dredge operations during the cruise. For Dredgings 1–3 sampling, the dredge used had a 1 m diameter circular opening encapsulated by a metal chain bag of 2 cm mesh size. For Dredging 4 sampling, a 0.5 m diameter opening steel cyclinder with 2.5 cm mesh-size dredge was used. For Dredgings 5–17 sampling, a 0.5 m wide rectangular dredge of 2.5 cm mesh-size was used. The rectangular dredge was favorable for the majority of dredge sites because it had the largest contact with the seafloor, increasing the probability of recovery on flat surfaces.
Dredge operations typically occurred by placing the dredge in the water and letting out wire until equal to the water depth (dredge on bottom). Next, additional wire equal to 30–50% of the water depth was let out while the ship held position. Then, the ship followed the planned dredge line while holding 1–2 knots and dredge bites (strikes) were recorded. Once the ship reached the end of the line and/or enough bites were recorded to ensure rock recovery, the ship held position and the winch was used to retrieve wire; the “off bottom” latitude/longitude/depth was recorded once the wire out was equal to the water depth below the ship. “On bottom” and “Off bottom” latitude/longitude/depth records should be taken as good estimates rather than exact locations. Dredging operations typically lasted for several hours.
A total of 17 dredging operations were completed during the cruise (Figure 1): two in area B1, two in area B2, ten in area A1, and three in area A2. From these operations, more than 300 rock samples were recovered and 254 of them were cut and described onboard. The major rock types recovered included volcanic rocks, limestones, and Fe-Mn crusts (Figure 2). In a few dredges some rare rocks were recovered including rounded pebbles/cobbles of metamorphic rocks, mudstone, siltstone, pyroclastic rocks, and a pegmatitic rock. Overall, more rocks recovered appeared to be talus material than those that showed evidence of being broken from outcrop. Dredge stations and a summary of recovered rocks are in Supplementary Table 3.
In addition, gravity core operations were carried out, however, from 17 attempts at coring only three were successful on recovering sediments: GC04 (1.90 m) and GC05 (0.4 m) from the canyon in south Area A1; and GC13 (2 m) from the central rift valley between areas A1 and A2. These cores will be used for grain size, mineralogy, chemical composition, and micropaleontological analyses.
Biogeochemistry
The biogeochemical program of the RGR1 cruise aimed to collect biological material and perform a variety of experiments to understand the biological processes that take place in the water column, sediments, and Fe-Mn crusts. The potential relationships between the microbiota to Fe-Mn crust formation will be determined based on four main activities: (1) determination of primary production and export of particulate organic matter, Chemosynthetic Primary Production in situ Experiment, and Molecular Biology; (2) quantification of the incorporated 14C by the autotrophic organisms, dissolved organic matter, dissolved organic carbon, and nutrients in the water column along the RGR; (3) quantification of the incorporated 14C by the chemolithotrophic microorganisms in different habitats (water column, sediments, and crusts) along RGR; (4) determination of the microbial taxonomy, diversity, and metabolism in different habitats (water column, sediments, and crusts) along RGR by the combination of complementary high-throughput techniques, 16S rRNA sequencing, metagenomics, and metatranscriptomics. Each of the experiments conducted during the RGR1 cruise are described below.
Primary Production Experiment
A Profiler of Natural Fluorescence (PNF) was deployed to calculate light attenuation coefficient, following the light attenuation model:
Where k is the attenuation coefficient, I(0) is the surface radiance, and I(z) is radiance in the z depth. The depths of 100, 67, 30, 20, 14, 10, 6, 4, 2, 0.56% of incident light were calculated along the water column in order to be incubated in an in-situ simulated experiment. Water samples were collected using the CTD-Rosette system. 500 μL of 14C (duplicates) were inoculated in the water samples and incubated in the respective light filter. A single bottle was reserved as control, and was incubated in the dark and covered in aluminum foil. All incubations were made up to 6 h to simulate the photosynthetic processes in the water column (Figure 4B). One to two liters of water was filtered in a vacuum pump with a GFF membrane filters (Millipore, MA) to analyze photosynthetic pigments of abundant autotrophic groups. Membranes were stored at −80°C until transport to the Instituto Oceanográfico for High Performance Liquid Chromatographic analysis. After incubation, the samples were filtered in a vacuum pump with 0.22 μm pore-size membrane filters (Millipore, MA) and stored at −4°C for further analyses at the Instituto Oceanográfico. The samples collected for primary production are described in Supplementary Table 2. Samples for nitrate, nitrite, phosphate (10 mL), ammonium (60 mL), colored—Dissolved Organic Matter (cDOM), fluorescence—Dissolved Organic Matter (fDOM) (150 mL), and Dissolved Organic Carbon (DOC) (45 mL) analyses were collected using 0.22 μm pore-size filtered water. Samples for nitrate, nitrite, phosphate, ammonium and DOC were frozen at −4°C.
Chemosynthetic Primary Production in situ Experiment
Once water, sediment, and Fe-Mn crusts samples were collected, subsamples were made in triplicate as follows: 60 mL of water, 10 g of sediment and 10 g of Fe-Mn crusts, and a control composed of formaldehyde (37%)—to avoid microbial growth. In all triplicates, 5 μL of 14C were added. Samples were incubated in darkness at 4°C for 12 h for water samples, 24 h for sediment samples, and for 20 h for Fe-Mn crusts. Afterwards, the water samples were filtered using a vacuum pump and 0.22 μm pore-size membrane filters (Millipore, MA). The filters were then kept frozen at −80°C until further analysis. The sediments and Fe-Mn crust incubations were interrupted by adding 200 μl of formaldehyde (37%) and stored at 4°C. All steps were made inside a glove box. The samples were transported from the vessel to the laboratory facilities at Instituto Oceanográfico, at 4°C for further analyses at the Radioisotopes Laboratory. The samples collected for the chemosynthesis experiment are described in Supplementary Table 2.
Molecular Biology
Fe-Mn crusts collected by dredging were aseptically taken from the dredge and transferred to a DNA/RNA-free plastic bag. The sediment collected by box corer and subsamples were prepared aseptically. RNA latter was added to the sediments and Fe-Mn crusts samples, which were stored at −80°C until transported to the Instituto Oceanográfico, for DNA and RNA extraction at the Laboratório de Ecologia Microbiana (LECOM). Water samples were collected using a CTD-Rosette (Sea-bird 911 Plus) equipped with 24 Niskin bottles of 5 L each. Water was collected at five or six discrete depths within the water column and center of water masses: 5 m—surface; 100 m—Tropical Water and Deep Chlorophyll Maximum Layer; 400 m—South Atlantic Central Water; 900 m—Antarctic Intermediate Water; 1,600 m—Upper Circumpolar Deep Water; 2,400 m—North Atlantic Deep Water. Triplicate samples of water (1.5 mL) were transferred into cryotubes for flow cytometry, to which 0.1% glutaraldehyde (final concentrations) was added. After 20 min to guarantee fixation, the tubes were flash-frozen in liquid nitrogen and stored at −80°C. Water samples were filtered for 20 min using a peristaltic pump and 0.22 μm pore-size membrane filters (Sterivex, Millipore, MA) for RNA. Nine liters of water were also filtered for DNA analyses. Latter, RNA was added to the filters, which were stored at −80°C until transport to the Instituto Oceanográfico, Universidade de São Paulo (Brazil), for DNA and RNA extraction at LECOM Laboratory. The samples collected for biological molecular analyses are described in Supplementary Table 2. The 0.22 μm pore-size filters were stored to analyze nutrients, cDOM and fDOM, and DOC at the Instituto Oceanográfico. The samples collected for geomicrobiology are described in Supplementary Table 6.
Conclusions
Multidisciplinary data were collected during the Rio Grande Rise cruise (RGR1), including geophysical (using multibeam, sonar, backscatter, chirp, magnetometer), geological (using dredges, box corer, gravity corer), benthic ecology, hydrographic (using CTD, ADCP, L-ADCP), biogeochemical, and geomicrobiological. These data supplement and expand previous environmental studies based on data collected from RGR, and provide essential baseline information needed to understand the geological, tectonic, and oceanographic evolution of the region, the genesis and evolution of the Fe-Mn deposits, and the interactions of ecosystems with the geological and oceanographic parameters measured at RGR, all of which are required for assessments of possible future mining activities. We detected different sediments with particular distribution and unique bottom features such us deep canyons and a main central rift defined by steep scarps. On the Rio Grande Rise, we found crusts pavements and calcarenitic mounds characterized by depressions, stripes, and features similar to terraces.
Author Contributions
LJ: Chief Scientist of the Cruise, writing and overall organization. JRH: Co-chief (Geology) and writing. IAY: Co-chief (Geophysics) and writing. MB and KLM: geology and writing. NMB, PVFC, MP, PMT, CLV, MGC, and DMC: biology and writing. SAH, DSM, PFS, and IMMR: geophysics and writing. ADG, HRM, FLN, FRS, and TES: technician support and writing. VHP, CNS, ICAS, PYGS, BJM, and FPB: conceptualization and editing.
Conflict of Interest Statement
The authors declare that the research was conducted in the absence of any commercial or financial relationships that could be construed as a potential conflict of interest.
Acknowledgments
We are grateful to the Captain, Officers, and Crew of the NOc Alpha Crucis for their professionalism and dedication to data acquisition. The RGR1 cruise was funded by Fundação de Amparo a Pesquisa do Estado de São Paulo (FAPESP) grant number 14/50820-7 project Marine ferromanganese deposits: a major resource of E-tech elements which is an international collaboration between NERC (UK) and FAPESP (Brazil). Rio Grande Rise was in International Waters at the time of the cruise, so no permission is required to distribute the samples.
Supplementary Material
The Supplementary Material for this article can be found online at: https://www.frontiersin.org/articles/10.3389/fmars.2019.00252/full#supplementary-material
References
Barker, P. F. (1983). Tectonic evolution and subsidence history of the Rio-Grande Rise. Initial Rep. Deep Sea Drill Project 72, 953–976. doi: 10.2973/dsdp.proc.72.151.1983
Barker, P. F., Carlson, R. L., Johnson, D. A., Cepek, P., Coulbourn, W., Gambôa, L. A., et al. (1981). Deep sea drilling project leg 72: Southwest Atlantic paleocirculation and Rio Grande Rise tectonics. Geol. Soc. Am. Bull. 92, 294–309. doi: 10.1130/0016-7606(1981)92<294:DSDPLS>2.0.CO;2
Benites, M., Millo, C., Hein, J., Nath, B., Murton, B., Galante, D., et al. (2018). Integrated geochemical and morphological data provide insights into the genesis of ferromanganese nodules. Minerials 8:488. doi: 10.3390/min8110488
Cavalcanti, J. A. D., Santos, R. V., Lacasse, C. M., Rojas, J. N. L., and Nobrega, M. (2015). “Potential mineral resources of phosphates and trace elements on the Rio Grande Rise, South Atlantic Ocean,” in Nearshore Underwater Mining: Critical Commodities for the Future UMC 2015 (Tampa Bay, FL).
CPRM (2018). Available online at: https://www.cprm.gov.br/publique/Noticias/Brasil-realiza-expedicao-inedita-no-Atlantico-Sul-5027.html (accessed May 8, 2019).
Gamboa, L. A., and Rabinowitz, P. D. (1981). The Rio Grande fracture zone in the western South Atlantic and its tectonic implications. Earth Planet. Sci. Lett. 52, 410–418. doi: 10.1016/0012-821X(81)90193-X
Gamboa, L. A., and Rabinowitz, P. D. (1984). The evolution of the Rio Grande Rise in the southwest Atlantic Ocean. Mar. Geol. 58, 35–58. doi: 10.1016/0025-3227(84)90115-4
Hein, J. R., Mizell, K., Koschinsky, A., and Conrad, T. A. (2013). Deep-ocean mineral deposits as a source of critical metals for high- and green-technology applications: comparison with land-based resources. Ore Geol. Rev. 51, 1–14. doi: 10.1016/j.oregeorev.2012.12.001
Leyden, R., Ludwig, W. J., and Ewing, M. (1971). Structure of continental margin off Punta del Este, Uruguay, and Rio de Janeiro, Brazil. AAPG Bull. 55, 2161–2173. doi: 10.1306/819A3E2A-16C5-11D7-8645000102C1865D
Montserrat, F., Guilhon, M., Corrêa, P. V. F., Bergo, N. M., Signori, C. N., Tura, P. M., et al. (2019). Deep-sea mining on the Rio Grande Rise (Southwestern Atlantic): a review on environmental baseline, ecosystem services and potential impacts. Deep Sea Res. I Oceanogr. Res. Pap. 145, 31–58. doi: 10.1016/j.dsr.2018.12.007
Keywords: Rio Grande Rise, South Atlantic Ocean, multidisciplinary cruise, Fe-Mn crusts and nodules, benthic fauna
Citation: Jovane L, Hein JR, Yeo IA, Benites M, Bergo NM, Corrêa PVF, Couto DM, Guimarães AD, Howarth SA, Miguel HR, Mizell KL, Moura DS, Vicentini Neto FL, Pompeu M, Rodrigues IMM, Santana FR, Serrao PF, Silva TE, Tura PM, Viscarra CL, Chuqui MG, Pellizari VH, Signori CN, Da Silveira ICA, Sumida PYG, Murton BJ and Brandini FP (2019) Multidisciplinary Scientific Cruise to the Rio Grande Rise. Front. Mar. Sci. 6:252. doi: 10.3389/fmars.2019.00252
Received: 09 November 2018; Accepted: 25 April 2019;
Published: 24 May 2019.
Edited by:
Craig John Brown, Nova Scotia Community College, CanadaReviewed by:
Helena Passeri Lavrado, Federal University of Rio de Janeiro, BrazilAkkur Vasudevan Raman, Andhra University, India
Copyright © 2019 Jovane, Hein, Yeo, Benites, Bergo, Corrêa, Couto, Guimarães, Howarth, Miguel, Mizell, Moura, Vicentini Neto, Pompeu, Rodrigues, Santana, Serrao, Silva, Tura, Viscarra, Chuqui, Pellizari, Signori, Da Silveira, Sumida, Murton and Brandini. This is an open-access article distributed under the terms of the Creative Commons Attribution License (CC BY). The use, distribution or reproduction in other forums is permitted, provided the original author(s) and the copyright owner(s) are credited and that the original publication in this journal is cited, in accordance with accepted academic practice. No use, distribution or reproduction is permitted which does not comply with these terms.
*Correspondence: Luigi Jovane, jovane@usp.br