 Meritxell Boada-Pérez1,2Victoria Ruiz de Miguel2Marta Erro3Piedad Ussetti3Myriam Aguilar3Raquel Castejón4
 Silvia Rosado4Roser Escobar-Fornieles5
 Eva Revilla-López5Carlos Bravo5,6
 Berta Sáez-Giménez5,7Marta Zapata-Ortega1,5Yolanda Villena-Ortiz8Jaume Vima-Bofarull8
 Víctor Monforte5,6*Susana Gómez-Ollés2,6
- 1Department of Medicine, Universitat Autònoma de Barcelona, Barcelona, Spain
- 2Department of Pulmonology, Vall d’Hebron Institut de Recerca, Barcelona, Spain
- 3Department of Pulmonary Medicine, University Hospital Puerta de Hierro, Madrid, Spain
- 4Internal Medicine Laboratory, Instituto de Investigación Puerta de Hierro Segovia de Arana, Madrid, Spain
- 5Department of Pulmonology, Lung Transplant Program, Hospital Universitari Vall d’Hebron, Barcelona, Spain
- 6Centro de Investigación Biomédica en Red de Enfermedades Respiratorias (CIBERES), Instituto de Salud Carlos III, Madrid, Spain
- 7Department of Cellular Biology, Physiology and Immunology, Universitat Autònoma de Barcelona, Barcelona, Spain
- 8Central Laboratory Services, Pharmacology Section, Hospital Universitari Vall d’Hebron, Barcelona, Spain
Introduction: Trough blood levels (C0) of tacrolimus are used to adjust drug dosage, but they do not consistently correlate with clinical outcomes. Measurement of residual gene expression of nuclear factor of activated T cell (NFAT)-regulated genes (NFAT-RGE) has been proposed as a pharmacodynamic biomarker to assess the degree of immunosuppression in certain solid organ transplantations, but little is known regarding lung transplant recipients (LTR). Our primary objective is to correlate tacrolimus blood levels with NFAT-RGE.
Methods: NFAT-RGE and tacrolimus C0 and peak (C1.5) levels were determined in 42 patients at three, six and 12 months post-transplantation.
Results: Tacrolimus C0 did not exhibit a correlation with NFAT-RGE, whereas C1.5 did. Besides, over 20% of measurements indicated high levels of immunosuppression based on the below 30% NFAT-RGE threshold observed in many studies. Among those measurements within the therapeutic range, 19% had an NFAT-RGE<30%.
Conclusion: Consequently, a subset of patients within the tacrolimus therapeutic range may be more susceptible to infection or cancer, potentially benefiting from NFAT-RGE and tacrolimus peak level monitoring to tailor their dosage. Further quantitative risk assessment studies are needed to elucidate the relationship between NFAT-RGE and the risk of infection, cancer, or rejection.
1 Introduction
After lung transplantation (LT), immunosuppressive regimens are used to reduce the rate of acute and chronic rejection, which continue to represent significant sources of morbidity and mortality in this population (1). While immunosuppressive therapy protocols vary from center to center, conventional maintenance therapy consists of a triple drug combination with a calcineurin inhibitor (cyclosporine or tacrolimus, CNI), an antiproliferative agent, and corticosteroids (2). CNIs remain the cornerstone of immunosuppression following LT, and tacrolimus is currently the drug of choice. However, tacrolimus is characterized by a wide intra- and inter-individual pharmacokinetic variability and a narrow therapeutic index. Thus, therapeutic drug monitoring (TDM) is mandatory. In current clinical practice, tacrolimus dose adjustment is performed solely through a pharmacokinetic measurement of its trough levels, and in particular cases by performing an abbreviated area under the curve assessment. Nevertheless, pharmacokinetic monitoring does not have an optimal correlation with clinical outcomes (3), making it challenging to determine an individual patient’s risk for infection or rejection. Therefore, efforts are being made to find non-invasive biomarkers and pharmacodynamic monitoring strategies capable of measuring an individual patient’s state of immunosuppression.
One of the most promising immune function assays is the measurement of residual expression of nuclear factor of activated T-cells (NFAT)-regulated genes (NFAT-RGE) in the peripheral blood by real-time quantitative polymerase chain reaction (RT-qPCR) (3–12). The immunosuppressive effect of tacrolimus is produced by inhibition of the calcineurin-NFAT signaling pathway in T-helper cells. In broad terms, tacrolimus binds to an immunophilin causing a non-competitive inhibition of calcineurin-phosphatase activity which is necessary for activation of cytoplasmic nuclear factors such as NFAT, which then translocate to the nucleus and activate cytokine transcription, a critical step in T-cell activation (13). Among other actions, NFAT facilitates transcription of interleukin-2 (IL-2), interferon gamma (IFN-γ), or granulocyte and macrophage colony-stimulating factor (GM-CSF) (14, 15).
Most of the studies published so far on the use of NFAT-RGE refer to liver and kidney transplantation (3, 4, 8, 9, 12), and some of them have been performed in patients receiving cyclosporine A-based immunosuppression (6, 7, 9, 11, 16). Those studies have shown a lower residual expression among patients with recurrent infections or viremia and an increased risk of malignancies. In contrast, patients with a high residual cytokine expression have been associated with an increased risk of rejection (17). Several clinical trials have also demonstrated the feasibility of adjusting tacrolimus dosing according to NFAT-RGE in kidney and liver transplantation (8, 18). However, there is still little information on the use of this promising pharmacodynamic tool in the field of lung transplantation. Though information on NFAT-RGE assessment in LT recipients (LTR) is scarce, it has been tentatively suggested that the biomarker may be useful in identifying recipients at an increased risk of infection (19).
The aim of this study is to assess NFAT-RGE in relation to trough and peak blood levels of tacrolimus in LTR. We also aim to stratify patients by their grade of immunosuppression based on the below 30% NFAT-RGE threshold observed in many studies.
2 Materials and methods
2.1 Study design and population
This prospective, observational study included 42 LTR transplanted between February 2020 and September 2021. Patients were over 18 years old and were willing to participate in the study during the first 12 months post-transplant, all providing written informed consent. All procedures were conducted in accordance with the ethical standards of Vall d’Hebron University Hospital’s ethics committee (PR(AG)101/2019), and with the Declaration of Helsinki (2013).
All patients were enrolled before transplantation, and blood samples were collected at three (33 samples), six (33 samples) and 12 (21 samples) months after transplantation concurrently with routine blood tests. Ten patients contributed only one sample, 19 provided two samples and 13 patients had samples collected at all three time points.
Patients received immunosuppressive therapy according to institutional protocols, which included a triple-drug regimen consisting of tacrolimus, mycophenolic acid, and corticosteroids. In some cases, mycophenolic acid had to be temporarily discontinued due to leukopenia. The target trough levels for tacrolimus were set between 10-15 ng/mL. All patients initially received immediate-release tacrolimus, and five required a switch to extended-release tacrolimus. Thus, a total of 82 samples were collected with immediate-release tacrolimus, and five samples with extended-release tacrolimus.
2.2 Tacrolimus pharmacokinetic monitoring
Tacrolimus trough (C0) and peak (C1.5) levels were analyzed using high-performance liquid chromatography-mass spectrometry (HPLC-MS) at the clinical laboratories of Vall d’Hebron University Hospital.
2.3 Tacrolimus pharmacodynamic monitoring
The blood samples used for pharmacodynamic monitoring were obtained in parallel with the blood samples for pharmacokinetic monitoring and were analyzed at Vall d’Hebron Research Institute.
To do so, blood samples were collected in BD Vacutainer® lithium heparin tubes. One milliliter of heparinized blood was stimulated with 1 mL of complete RPMI 1640 (Gibco) enriched with 100 ng/mL of phorbol 12-myristate 13-acetate (PMA) and 5 µg/mL of ionomycin (Sigma Aldrich, Saint Louis, MO) for three hours at 37°C and 5% CO2. Then, 10 mL of RNA/DNA Stabilization Reagent for Blood/Bone Marrow (Roche, Mannheim, Germany) were added to lyse cells and stabilize nucleic acids, according to the manufacturer’s instructions. Samples were stored at -20°C for a maximum of a year.
mRNA was isolated using an mRNA Isolation Kit for Blood/Bone Marrow (Roche, Mannheim, Germany) following the manufacturer’s instructions. It was then stored at -20°C for a week or less, or at -80°C indefinitely.
Reverse transcription was performed with 8.2 µL of mRNA in a thermocycler using avian myeloblastosis virus reverse transcriptase and oligo (dT) as a primer (First Strand cDNA synthesis kit Roche, Mannheim, Germany) following the manufacturer’s instructions. The resulting cDNA was stored concentrated at -20°C until further use.
2.4 Gene expression analysis
First, cDNA was diluted to a final volume of 200 µL by adding 180 µL of water. Gene expression of three genes regulated by NFAT (IL-2, IFN-γ and GM-CSF) was quantified by performing real-time quantitative PCR in a LightCycler® 480 thermocycler (Roche Diagnostics, Basel, Switzerland). Target sequences were amplified using commercially available LightCycler Primer Sets (Search-LC, Heidelberg, Germany) with the LightCycler FastStart DNA Sybr Green I Kit (Roche Diagnostics, Basel, Switzerland), following the manufacturer’s instructions. Transcript concentrations for each gene were calculated from a virtual standard curve. The mRNA input was normalized by the constant expression of two reference genes (β-actin and cyclophilin B). Quantification cycle values were determined using the fit point method.
The percentage of NFAT-RGE was calculated as: [(IL-2 adjusted transcripts C1.5/C0 X 100) + (IFN-γ adjusted transcripts C1.5/C0 X 100) + (GM-CSF adjusted transcripts C1.5/C0 X 100)]/3. For further details, see previous reports (4, 6, 9, 19).
Previous studies, mostly conducted in kidney transplantation, demonstrated that patients with an NFAT-RGE lower than 30% were at high risk of infection and malignancies (5). Therefore, this study used a cut-off of NFAT-RGE <30% to stratify patients as having a high degree of immunosuppression and an increased risk of infection.
2.5 Statistical analysis
Continuous variables were presented as mean ± standard deviation (SD) or median ± interquartile range (IQR). Categorical variables were described as frequencies and percentages. Normality of distributions was evaluated before performing statistical analyses to determine the most appropriate test for each case. Chi-Square or Fisher’s exact test was used for comparisons between qualitative variables, while t-tests for two independent variables/ANOVA test (>2 categories) or Mann Whitney/Kruskal Wallis U tests were employed for continuous variables. Pearson’s test was used to examine linear correlations in Gaussian variables, and Spearman’s was used for non-Gaussian variables. Statistical significance was set at p ≤ 0.05. All analyses were performed using Graphpad Prism 9.0 statistical software (GraphPad Software, LLC, San Diego, CA).
3 Results
3.1 Inhibition of NFAT-regulated genes over time after LT
Residual expression of the three NFAT-regulated genes analyzed in this project remained stable over time after LT. The median IL-2 RGE was 35% (IQR=18%-70%) at three months, 42% (IQR=22%-65%) at six months, and 50% (IQR=30%-77%) after one year (Figure 1A). The median IFN-γ RGE was 65% (IQR=40%-79%) at three months, 59% (IQR=40%-75%) at six months, and 70% (IQR=46%-81%) after one year (Figure 1B). The median GM-CSF RGE was 30% (IQR=11%-54%) at three months, 28% (IQR=18%-45%) at six months, and 38% (IQR=21%-84%) after one year (Figure 1C). Overall, the median NFAT-RGE was 45% (IQR=23%-66%) at three months, 42% (IQR=28%-60%) at six months, and 50% (IQR=33%-86%) after one year (Figure 1D).
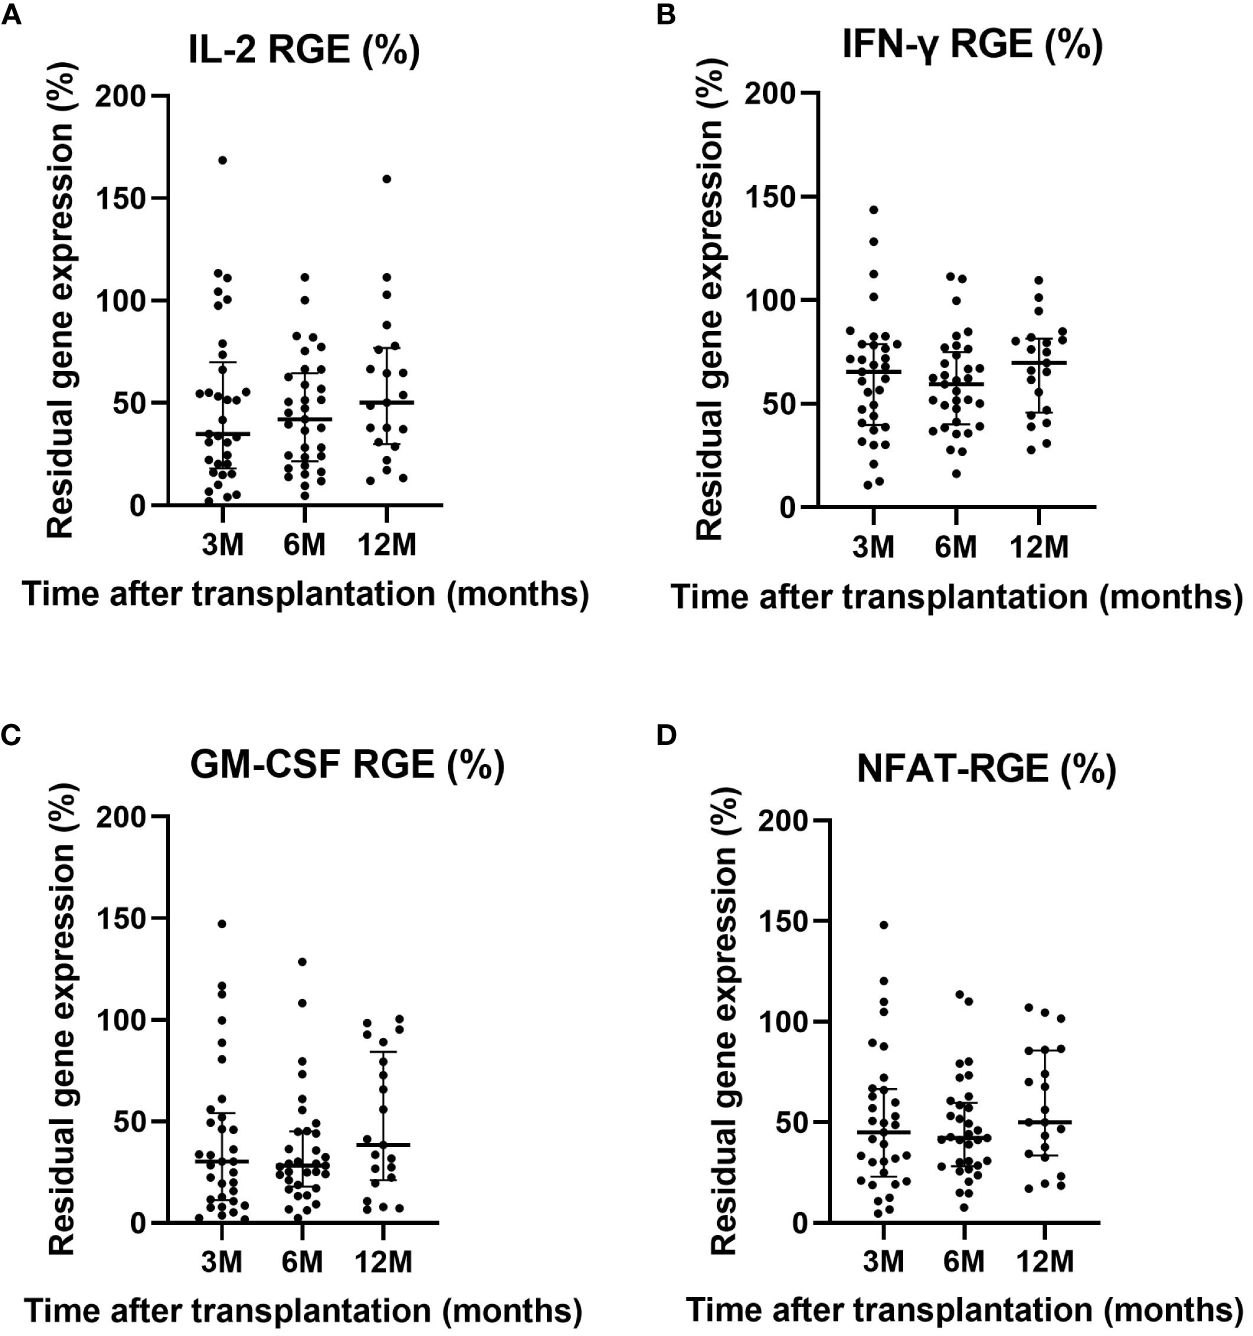
Figure 1 Residual gene expression of IL-2 (A), IFN-γ (B), GM-CSF (C) and NFAT-RGE (D) at three, six and 12 months after LT. Only significant p-values are shown (p<0.05).
Approximately 30% (n=9) of patients at three months, 30% (n=9) at six months, and 19% (n=9) at 12 months were considered to have high-grade immunosuppression based on NFAT-RGE analysis.
Comparison of clinical, demographic, and therapeutic characteristics between patients with overall high-grade immunosuppression (NFAT-RGE <30%), calculated as the median value of all time-point determinations, and overall low-grade immunosuppression (NFAT-RGE ≥30%), are shown in Table 1. Strikingly, no differences were observed in C0 tacrolimus levels (9.3 vs, 10.3, p = 0.265), but doses of tacrolimus (8.5 vs. 6, p<0.001) and C1.5 levels (31.2 vs. 20.7, p<0.001) differed, being higher in patients with an NFAT-RGE <30%. As expected, residual gene expression of each of the three different cytokines regulated by NFAT was significantly lower when NFAT-RGE was below 30%. GM-CSF residual gene expression was always the lowest, followed by IL-2 and IFN-ɣ (Table 1).
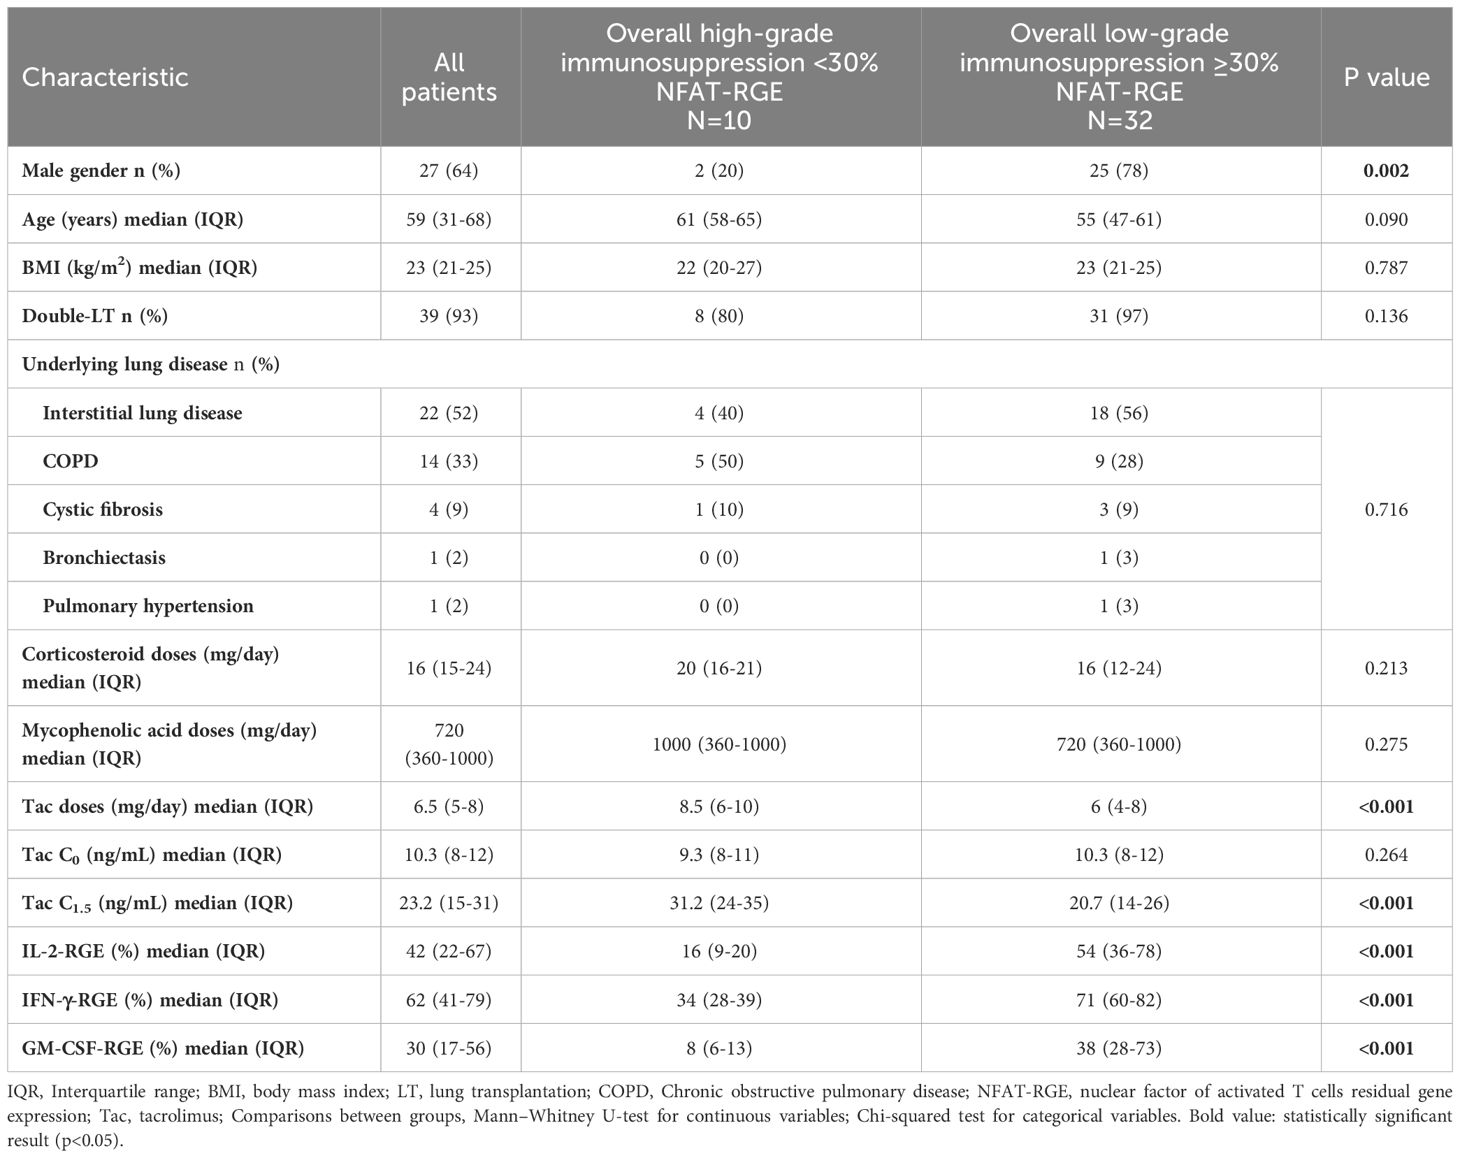
Table 1 Clinical and demographic characteristics of the population, stratifying patients into high or low-grade immunosuppression according to their overall NFAT-RGE.
3.2 Tacrolimus pharmacokinetics
The overall mean tacrolimus C0 levels were 10.3 ng/mL ± 3.3 and decreased over time. At three months after LT, mean tacrolimus C0 levels were 10.9 ng/mL ± 3.6, 10.8 ng/mL ± 3.1 at six months, and 8.5 ng/mL ± 2.11 at 12 months (Table 2). Tacrolimus C0 levels significantly decreased at 12 months compared to three months (p=0.015) and six months (p=0.026) (Figure 2A).
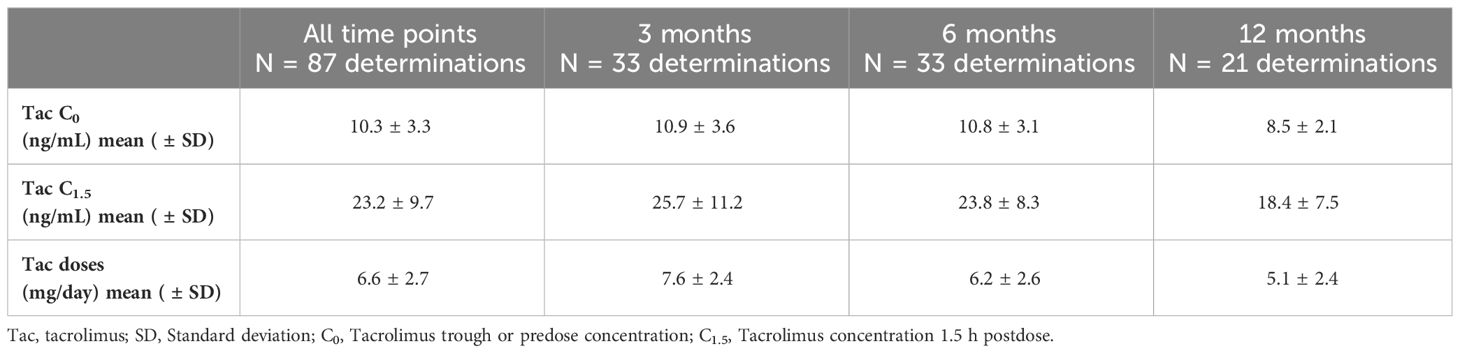
Table 2 Tacrolimus mean concentrations (C0 and C1.5) and doses at 3, 6, 12 months after transplantation and all time points.
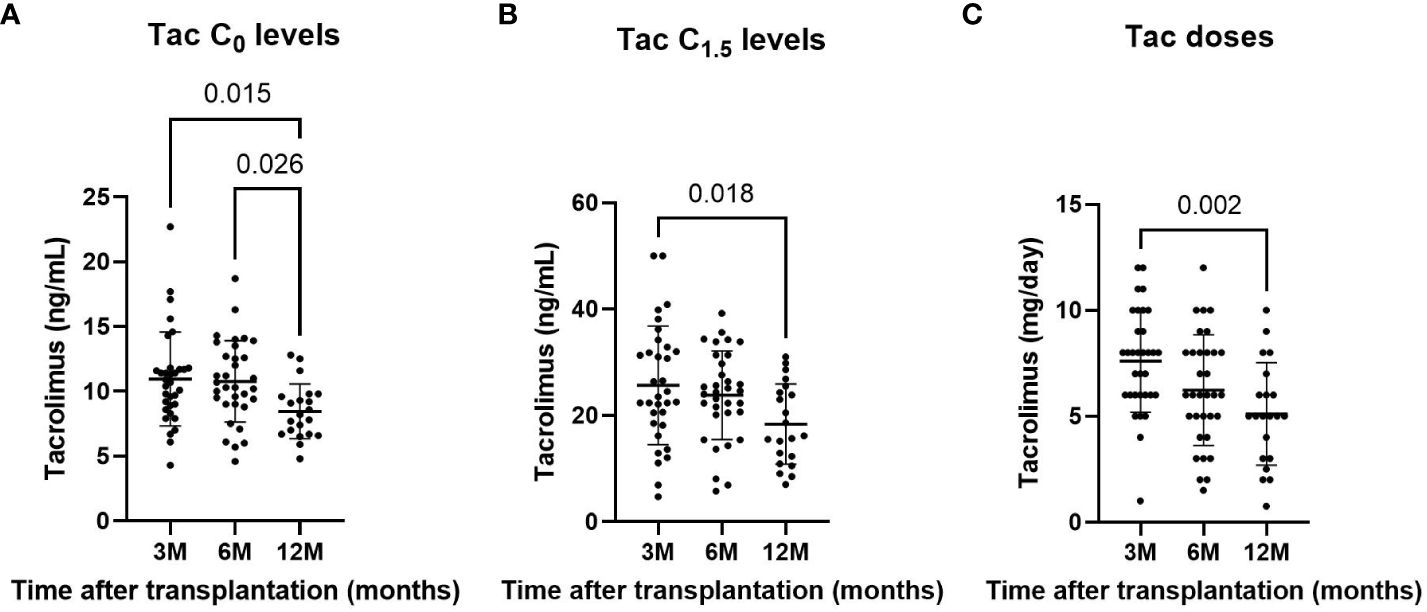
Figure 2 Tacrolimus C0 (A) and C1.5 (B) concentrations, and tacrolimus doses (C) at three, six and 12 months after LT. Only significant p-values are shown. significant result (p<0.05)
The overall mean tacrolimus C1.5 level was 23.2 ng/mL ± 9.7 and tended to decrease over time. At three months after LT, mean C1.5 levels were 25.7 ng/mL ± 11.2, 23.8 ng/mL ± 8.3 at six months, and 18.4 ng/mL ± 7.5 at 12 months. Tacrolimus C1.5 levels were significantly lower at 12 months than at three months (p=0.018) (Figure 2B).
The overall mean tacrolimus dose was 6.5 mg/day ± 2.7 and also decreased over time. At three months after LT, mean doses were 7.6 mg/day ± 2.4, 6.2 mg/day ± 2.6 at six months, and 5.1 mg/day ± 2.4 at 12 months. Tacrolimus doses were significantly lower at 12 months than at three months (p=0.002) (Figure 2C).
Almost 60% (n=51) of the measurements were outside the tacrolimus therapeutic range (10-15 ng/mL); of those, 12% (n=6) were above the range. Approximately 20% of the measurements that would today be considered within the therapeutic range actually represented a high degree of immunosuppression according to NGAT-RGE. Surprisingly, NFAT-RGE <30% was found in only one out of six measurements above the therapeutic range (Table 3).
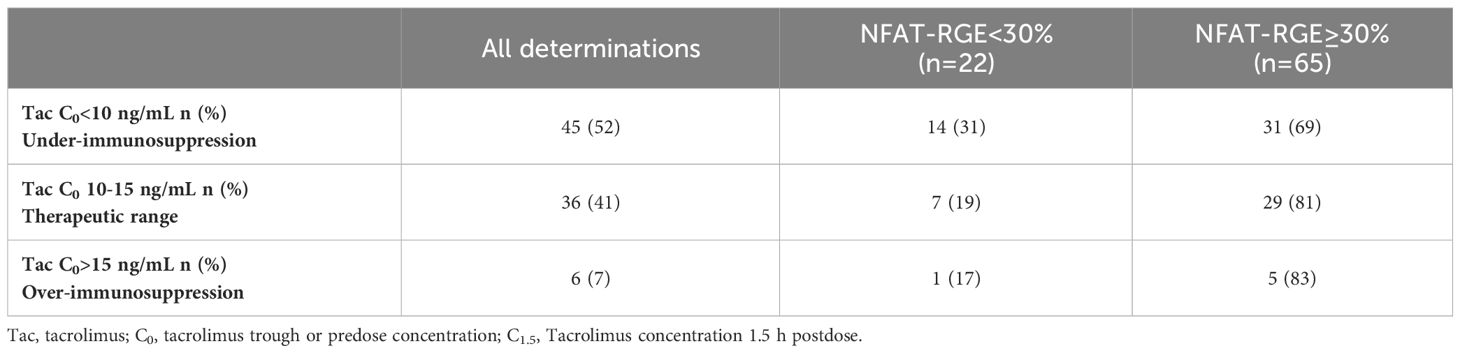
Table 3 Classification of determinations based on their NFAT-RGE and tacrolimus C0 concentrations.
3.3 NFAT-RGE and tacrolimus pharmacokinetics
Tacrolimus C0 levels showed a moderate correlation with C1.5 levels (r=0.410, p<0.001) (Figure 3A). Tacrolimus C0 levels did not correlate with any of the three NFAT-regulated genes, analyzed either separately or overall (r=-0.069, p=0.524) (Figure 3B). Tacrolimus doses showed a moderate correlation with NFAT-RGE analyzed separately or overall (r=-0.441, p<0.001) (Figure 3C).
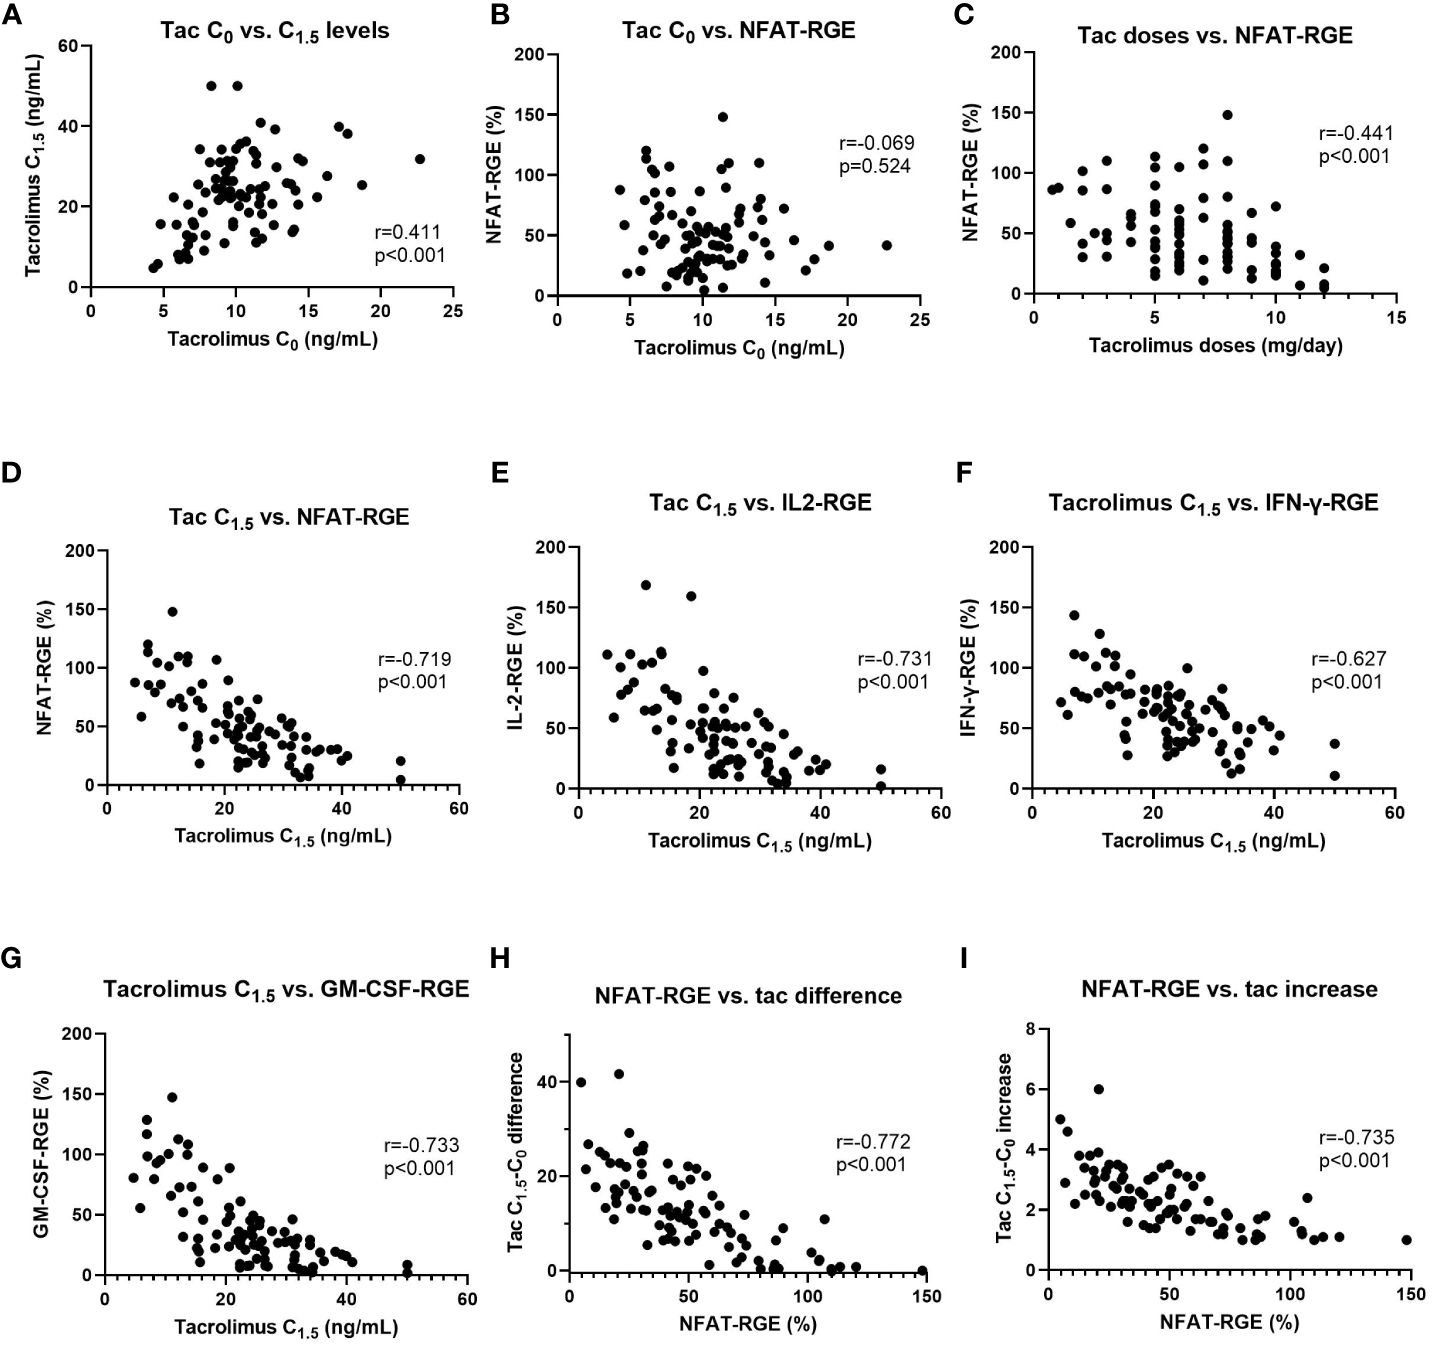
Figure 3 Linear correlations between tacrolimus C0 vs. C1.5 (A), tacrolimus C0 vs. NFAT-RGE (B), tacrolimus doses vs. NFAT-RGE (C), tacrolimus C1.5 vs. NFAT-RGE (D), tacrolimus C1.5 vs. IL2-RGE (E), tacrolimus C1.5 vs. IFNγ-RGE (F), tacrolimus C1.5 vs. GM-CSF-RGE (G), NFAT-RGE vs. tacrolimus difference (C1.5-C0) (H), and NFAT-RGE vs. tacrolimus increase (ratio calculated as C1.5/C0) (I).
Nevertheless, NFAT-RGE showed a strong negative correlation with tacrolimus C1.5 levels both overall (r=-0.719, 95% CI -0.8095 to -0.5950 p<0.001) (Figure 3D) and separately: IL-2 (r=-0.731, 95% CI -0.818 to -0.611, p<0.001) (Figure 3E), IFN-γ (r=-0.627, 95% CI -0.743 to -0.475, p<0.001) (Figure 3F), and GM-CSF (r=-0.733, 95% CI -0.819 to -0.613, p<0.001) (Figure 3G).
Moreover, NFAT-RGE presented a negative correlation with the tacrolimus difference measured as C1.5-C0 (r=-0.772, 95% CI -0.847 to -0.666, p<0.001) (Figure 3H) or as an increase (ratio), C1.5/C0 (r=-0.735, 95% CI -0.821 to -0.616, p<0.001) (Figure 3I).
3.4 NFAT-RGE and its correlation with corticosteroids and mycophenolic acid
When classifying patients according to their NFAT-RGE, there were no statistically significant differences in corticosteroid or mycophenolic acid doses (Table 1). Nor was there a correlation between corticosteroid doses (r=-0.175, 95% CI -0.377 to 0.043, p=0.081) (Figure 4A) or mycophenolic acid doses (r=-0.257, 95% CI -0.4491 to -0.043, p=0.016) (Figure 4B) and NFAT-RGE.
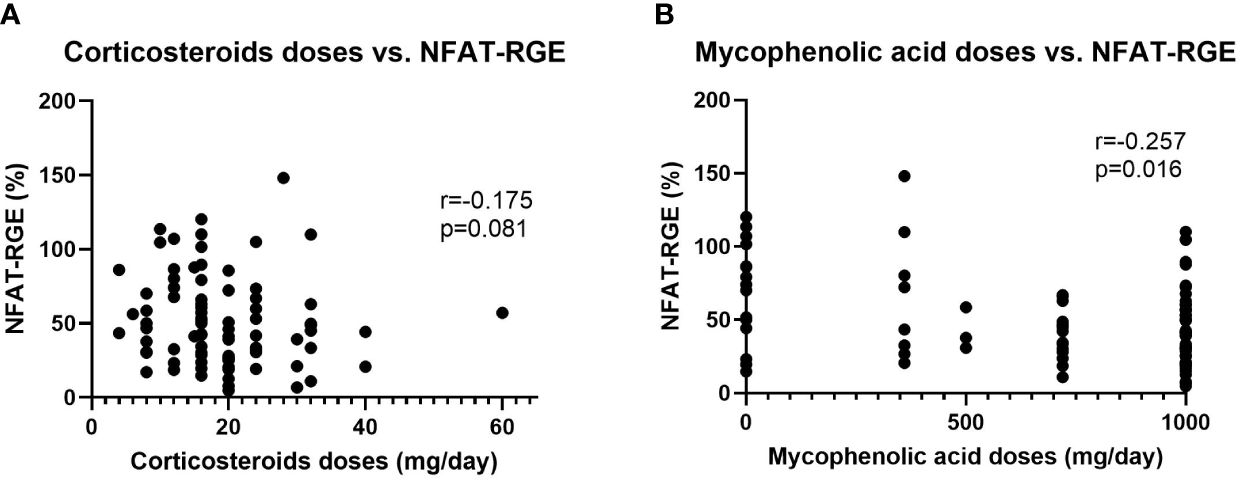
Figure 4 Linear correlations between corticosteroid doses vs. NFAT-RGE (A) and mycophenolic acid doses vs. NFAT-RGE (B).
However, when we split the determinations between those taken under methylprednisolone (n=11) and prednisone (n=76), we observed a very strong correlation between prednisone doses and NFAT-RGE (r=-0.84; p=0.002), but the correlation is non-existent when relating methylprednisolone and NFAT-RGE (r=-0.08; p=0.502).
4 Discussion
Despite tacrolimus being a cornerstone of immunosuppressive treatment in LTR, optimizing doses remains challenging due to its high inter- and intra-individual variability. Tacrolimus monitoring aims to balance efficacy, attempting to prevent chronic lung allograft dysfunction without increasing the risk of infections and malignancies. Currently, monitoring is based solely on tacrolimus trough blood levels, yet this pharmacokinetic measurement appears insufficient as it does not reflect the patient’s actual immunosuppressive state. Previous studies have demonstrated the usefulness of measuring NFAT-RGE in clinical trials monitoring kidney, liver, and heart transplant recipients (9, 11, 12). Moreover, this assay has proven highly reproducible and feasible in routine molecular biological laboratories (3, 9–11, 20), suggesting its potential integration into current clinical practice. However, the value of this pharmacodynamic tool in LTR remains unclear (19).
In our study, we observed that tacrolimus drug monitoring based on C0 blood levels does not correlate with the level of immunosuppression measured by NFAT-RGE; nearly 24% of patients had a median NFAT-RGE <30%. Consistent with previous studies, we also found that NFAT-RGE correlated better with tacrolimus peak concentrations than with trough concentrations (5, 19, 21).
NFAT-RGE levels below 30% generally indicate a high degree of immunosuppression, as an increased probability of infection and neoplasia has been observed (5, 8, 16, 22, 23). For instance, Sommerer et al. (5) demonstrated that patients with minimal or NFAT-RGE<30% had significantly more infections and malignancies, whereas patients with insufficient inhibition suffered more acute rejections. Similarly, in an LTR cohort, Greenland et al. (19) observed that pulmonary infections detected by bronchoscopy were more common with NFAT-RGE<40%.
Regarding graft rejection, most studies have focused on acute rather than chronic rejection episodes in other solid organ transplants. Sommerer et al. (5) showed that only 1.3% of patients with an NFAT-RGE <30% developed biopsy-proven acute rejection compared to 25.2% of those with NFAT-RGE >30%. Similarly, Millán et al. (24) demonstrated higher NFAT-RGE levels in patients with T cell-mediated acute rejection (75% [42-100%]) or subclinical cellular rejection (41% [18-78%]) compared with patients without these events (14% [2-23%]). Several other publications reported similar results with tacrolimus (3, 5) and or cyclosporine (8, 23). However, in the case of LTR, Greenland et al. (19) did not observe a correlation between higher NFAT-RGE levels and lung allograft acute rejection.
In our study, when classifying patients by their degree of immunosuppression according to NFAT-RGE results, corticoid or mycophenolic acid doses did not show significant differences. Moreover, there was no correlation between corticosteroid doses or mycophenolic acid doses and NFAT-RGE. According to Sommerer et al. (5), NFAT-RGE seems to be affected by tacrolimus but not by corticosteroids or mycophenolic acid. However, Greenland et al. (19) did observe a significant negative correlation between prednisone and NFAT-RGE. The differences observed between studies regarding the effect of corticosteroids on NFAT-RGE may be attributed to the specific type of corticosteroid administered to patients, as observed in our study when samples were categorized based on the type of corticosteroids used. In the study by Greenland et al. (19), patients were administered prednisone, whereas in our study, only 13% (n=11) of all determinations were analyzed under prednisone intake, with methylprednisolone being the most commonly used corticosteroid. Besides, in the study by Sommerer et al. (5), patients were administered methylprednisolone.
In accordance with the protocols, the doses of immunosuppressants are gradually reduced over time after transplantation. In our cohort, tacrolimus doses, as well as tacrolimus trough and peak blood levels, were significantly lower at 12 months compared to three months after LT. In the study by Sommerer et al. (3) tacrolimus doses in kidney transplant recipients increased from day 7 to month 2 and then stabilized. The difference could be explained by the lower tacrolimus trough levels required by kidney transplant recipients required compared to LTR.
In our study, the total residual expression of NFAT-RGE and of each gene individually increased over time, although not significantly, perhaps due to the changing sample size between 3-6 months and 12 months, or to the fact that the earliest time point tested was three months. In this context, Greenland et al. (19) observed in the early post-LT period that NFAT-RGE increased by 0.35% (95% CI 0.001-0.69%, p = 0.049) per week.
Regarding the therapeutic range of tacrolimus C0, almost 20% of the determinations in the therapeutic range in this study had an NFAT-RGE <30%, meaning that some patients with optimal trough tacrolimus concentrations were actually exposed to high-grade immunosuppression and might benefit from a dose reduction. Thus, adding the measurement of NFAT-RGE might improve drug monitoring.
The utility of NFAT-RGE as an add-on to pharmacokinetic drug monitoring with calcineurin inhibitor dose adjustment has already been explored in other solid organ transplants. Sommerer et al. (6) published a prospective, randomized clinical trial (1:1) in 54 stable patients after kidney transplant and observed that the group of patients whose cyclosporine dose was adjusted by NFAT-RGE monitoring had fewer infections, better renal function, and less arterial stiffness than those monitored in the conventional way (6). Similar studies in LT would be very useful. The main problem regarding their performance is the need to establish the optimal NFAT-RGE cut-off in this organ – that is to say, the grade of immunosuppression that presents an idea balance between the risk of infection and the risk of acute rejection or chronic graft dysfunction. This NFAT-RGE cut-off point will probably be different from that used in other types of transplants since the risk of infection in LT is significantly higher. In fact, Greenland et al. (19) found that the best cut-off in their LT cohort was 40% rather than the 30% used in all the other studies performed in kidney, liver and heart transplantation (9, 11, 12). More prospective studies with LTR stratifying the risk of infection and rejection according to NFAT-RGE determination seem necessary to confirm the optimal NFAT-RGE in LTR.
This study is part of a larger project assessing clinical outcomes 18 months after surgery. These data are no yet available; thus, one of the main limitations of this study is that at present we cannot link the NFAT-RGE results with the occurrence of infections in this population. Additionally, the sample size is small, and the data are derived from a single center.
Further clinical studies in larger LTR cohorts should assess whether this pharmacodynamic tool can predict patients at higher risk of developing infections, acute rejections, malignancies, and chronic lung allograft dysfunction, which is the main cause of graft loss within a year of lung transplantation and affects 41% of LTR patients within five years (25). Moreover, investigating whether NFAT-RGE determination could be useful in complex scenarios involving patients with recurrent infections taking apparently low immunosuppressant doses would be of interest.
5 Conclusions
Tacrolimus trough levels, currently used for therapeutic drug monitoring, did not correlate with the degree of immunosuppression measured by NFAT-RGE in LTR. However, peak levels showed a moderate correlation. A significant percentage of patients exhibited high levels of immunosuppression based on NFAT-RGE, despite being within the therapeutic range for tacrolimus. Incorporating NFAT-RGE measurement and tacrolimus peak levels into current pharmacokinetic monitoring may assist physicians in adjusting tacrolimus doses. Nevertheless, further studies are needed to establish optimal NFAT-RGE cut-offs in LTR to prevent infection and rejection events.
Data availability statement
The raw data supporting the conclusions of this article will be made available by the authors, without undue reservation.
Ethics statement
The studies involving humans were approved by Vall d’Hebron University Hospital’s ethics committee. The studies were conducted in accordance with the local legislation and institutional requirements. The participants provided their written informed consent to participate in this study.
Author contributions
MB-P: Formal analysis, Investigation, Methodology, Writing – original draft, Writing – review & editing. VRM: Investigation, Writing – review & editing. ME: Investigation, Writing – review & editing. PU: Investigation, Writing – review & editing. MA: Investigation, Writing – review & editing. RC Investigation, Writing – review & editing. SR: Investigation, Writing – review & editing. RE-F: Investigation, Writing – review & editing. ER-L: Investigation, Writing – review & editing. CB: Investigation, Writing – review & editing. BS-G: Investigation, Writing – review & editing. MZ-O: Investigation, Writing – review & editing. YV-O: Investigation, Writing – review & editing. JV-B: Investigation, Writing – review & editing. VM: Conceptualization, Funding acquisition, Investigation, Methodology, Project administration, Supervision, Writing – original draft, Writing – review & editing. SG-O: Conceptualization, Formal analysis, Funding acquisition, Investigation, Methodology, Project administration, Supervision, Writing – original draft, Writing – review & editing.
Funding
The author(s) declare financial support was received for the research, authorship, and/or publication of this article. The project received funding from the Instituto de Salud Carlos III (ISCIII) under the project “PI18/00770” (Co-funded by European Regional Development Fund; “A way to make Europe”) and the Air Liquide Foundation. The funders were not involved in the study design, collection, analysis, interpretation of data, the writing of this article or the decision to submit it for publication.
Conflict of interest
The authors declare that the research was conducted in the absence of any commercial or financial relationships that could be construed as a potential conflict of interest.
The reviewer OM declared a shared affiliation, with no collaboration, with some of the authors CB, VM, SG-O to the handling editor at the time of the review.
Publisher’s note
All claims expressed in this article are solely those of the authors and do not necessarily represent those of their affiliated organizations, or those of the publisher, the editors and the reviewers. Any product that may be evaluated in this article, or claim that may be made by its manufacturer, is not guaranteed or endorsed by the publisher.
References
1. Atkinson BJ, Sharma NS. Immunosuppression in lung transplantation: a narrative review. Curr Challenges Thorac Surgery. (2023) 5:21–1. doi: 10.21037/ccts
2. Chung PA, Dilling DF. Immunosuppressive strategies in lung transplantation. Ann Transl Med. (2020) 8:409. doi: 10.21037/atm
3. Sommerer C, Brunet M, Budde K, Millán O, Guirado Perich L, Glander P, et al. Monitoring of gene expression in tacrolimus-treated de novo renal allograft recipients facilitates individualized immunosuppression: Results of the IMAGEN study. Brit Jnl Clin Pharma. (2021) 87:3851–62. doi: 10.1111/bcp.14794
4. Giese T, Zeier M, Meuer S. Analysis of NFAT-regulated gene expression in vivo: a novel perspective for optimal individualized doses of calcineurin inhibitors. Nephrol Dial Transplant. (2004) 19:iv55–60. doi: 10.1093/ndt/gfh1043
5. Sommerer C, Zeier M, Meuer S, Giese T. Individualized monitoring of nuclear factor of activated T cells-regulated gene expression in fk506-treated kidney transplant recipients. Transplantation. (2010) 89:1417–23. doi: 10.1097/TP.0b013e3181dc13b6
6. Sommerer C, Giese T, Schmidt J, Meuer S, Zeier M. Ciclosporin A tapering monitored by NFAT-regulated gene expression: A new concept of individual immunosuppression. Transplantation. (2008) 85:15–21. doi: 10.1097/01.tp.0000296824.58884.55
7. Sommerer C, Morath C, Giese T, Meuer S, Zeier M. Activity of nuclear factor of activated T cells is independent of the number of peripheral lymphocytes in FTY720-treated patients. Transplant Proc. (2008) 40:1416–8. doi: 10.1016/j.transproceed.2008.01.067
8. Zahn A, Schott N, Hinz U, Stremmel W, Schmidt J, Ganten T, et al. Immunomonitoring of nuclear factor of activated T cells-regulated gene expression: The first clinical trial in liver allograft recipients. Liver Transplantation. (2011) 17:466–73. doi: 10.1002/lt.22254
9. Giese T, Zeier M, Schemmer P, Uhl W, Schoels M, Dengler T, et al. Monitoring of NFAT-regulated gene expression in the peripheral blood of allograft recipients: A novel perspective toward individually optimized drug doses of cyclosporine A. Transplantation. (2004) 77:339–44. doi: 10.1097/01.TP.0000109260.00094.01
10. Abdel-Kahaar E, Giese T, Sommerer C, Rieger H, Shipkova M, Wieland E. Analytical validation and cross-validation of an NFAT-regulated gene expression assay for pharmacodynamic monitoring of therapy with calcineurin inhibitors. Ther Drug Monit. (2016) 38:711–6. doi: 10.1097/FTD.0000000000000340
11. Sommerer C, Konstandin M, Dengler T, Schmidt J, Meuer S, Zeier M, et al. Pharmacodynamic monitoring of cyclosporine A in renal allograft recipients shows a quantitative relationship between immunosuppression and the occurrence of recurrent infections and Malignancies. Transplantation. (2006) 82:1280–5. doi: 10.1097/01.tp.0000243358.75863.57
12. Steinebrunner N, Sandig C, Sommerer C, Hinz U, Giese T, Stremmel W, et al. Reduced residual gene expression of nuclear factor of activated T cells-regulated genes correlates with the risk of cytomegalovirus infection after liver transplantation. Transplant Infect Disease. (2014) 16:379–86. doi: 10.1111/tid.12206
13. Oellerich M, Armstrong VW, Schütz E, Shaw LM. Therapeutic drug monitoring of cyclosporine and tacrolimus. Clin Biochem. (1998) 31:309–16. doi: 10.1016/S0009-9120(98)00049-6
14. Ho S, Clipstone N, Timmermann L, Northrop J, Graef I, Fiorentino D, et al. The mechanism of action of cyclosporin A and FK506. Clin Immunol Immunopathol. (1996) 80:S40–5. doi: 10.1006/clin.1996.0140
15. Rao A, Luo C, Hogan PG. Transcription factors of the NFAT family: regulation and function. Annu Rev Immunol. (1997) 15:707–47. doi: 10.1146/annurev.immunol.15.1.707
16. Konstandin MH, Sommerer C, Doesch A, Zeier M, Meuer SC, Katus HA, et al. Pharmacodynamic cyclosporine A-monitoring: relation of gene expression in lymphocytes to cyclosporine blood levels in cardiac allograft recipients. Transpl Int. (2007) 20:1036–43. doi: 10.1111/j.1432-2277.2007.00552.x
17. Bremer S, Vethe NT, Skauby M, Kasbo M, Johansson ED, Midtvedt K, et al. NFAT-regulated cytokine gene expression during tacrolimus therapy early after renal transplantation. Br J Clin Pharmacol. (2017) 83:2494. doi: 10.1111/bcp.13367
18. Webber AB, Tatapudi V, Maw TT, Peralta C, Leung JCY, Vincenti F. Nuclear factor of activated T cell-regulated cytokine gene expression for adjustment of tacrolimus in kidney transplant recipients: A randomized controlled pilot trial. Transplant Direct. (2018) 4(7):e369. doi: 10.1097/TXD.0000000000000810
19. Greenland JR, Chong T, Wang AS, Martinez E, Shrestha P, Kukreja J, et al. Suppressed calcineurin-dependent gene expression identifies lung allograft recipients at increased risk of infection. Am J transplantation. (2018) 18:2043. doi: 10.1111/ajt.14886
20. Keller F, Sommerer C, Giese T, Zeier M, Schröppel B. Correlation between pharmacokinetics of tacrolimus and pharmacodynamics on NFAT-regulated gene expression in stable kidney transplant recipients. Clin Nephrol. (2017) 87:93–9. doi: 10.5414/CN108893
21. Djaelani YA, Giese T, Sommerer C, Czock D. Pharmacodynamic monitoring of ciclosporin and tacrolimus: insights from nuclear factor of activated T-cell-regulated gene expression in healthy volunteers. Ther Drug Monit. (2023) 45:87–94. doi: 10.1097/FTD.0000000000001046
22. Sommerer C, Zeier M, Meuer S, Giese T. Monitoring of calcineurin inhibitors by NFAT-regulated gene expression in de novo renal allograft recipients on cyclosporine A. Clin Nephrol. (2015) 84:165–72. doi: 10.5414/CN108623
23. Sommerer C, Zeier M, Czock D, Schnitzler P, Meuer S, Giese T. Pharmacodynamic disparities in tacrolimus-treated patients developing cytomegalus virus viremia. Ther Drug Monit. (2011) 33:373–9. doi: 10.1097/FTD.0b013e318226dac7
24. Millán O, Ruiz P, Fortuna V, Navasa M, Brunet M. Nuclear factor of activated T cells as potential pharmacodynamic biomarker for the risk of acute and subclinical rejection in de novo liver recipients. Liver Int. (2020) 40:931–46. doi: 10.1111/liv.14339
25. Chambers DC, Cherikh WS, Goldfarb SB, Hayes D, Kucheryavaya AY, Toll AE, et al. The International Thoracic Organ Transplant Registry of the International Society for Heart and Lung Transplantation: Thirty-fifth adult lung and heart-lung transplant report—2018; Focus theme: Multiorgan Transplantation. J Heart Lung Transplantation. (2018) 37:1169–83. doi: 10.1016/j.healun.2018.07.020
Keywords: pharmacodynamics, pharmacokinetics, tacrolimus, rejection, infection, therapeutic drug monitoring, biomarker
Citation: Boada-Pérez M, Ruiz de Miguel V, Erro M, Ussetti P, Aguilar M, Castejón R, Rosado S, Escobar-Fornieles R, Revilla-López E, Bravo C, Sáez-Giménez B, Zapata-Ortega M, Villena-Ortiz Y, Vima-Bofarull J, Monforte V and Gómez-Ollés S (2024) Pharmacodynamic monitoring by residual gene expression of the nuclear factor of activated T cell-regulated genes in lung transplant recipients and its correlation with tacrolimus blood levels. Front. Immunol. 15:1382459. doi: 10.3389/fimmu.2024.1382459
Received: 05 February 2024; Accepted: 22 April 2024;
Published: 10 May 2024.
Edited by:
Manuel Muro, Virgen de la Arrixaca University Hospital, SpainReviewed by:
Olga Millán, Carlos III Health Institute (ISCIII), SpainMichael Adu Gyamfi, Charité University Medicine Berlin, Germany
Maja-Theresa Dieterlen, HELIOS Clinic, Germany
Copyright © 2024 Boada-Pérez, Ruiz de Miguel, Erro, Ussetti, Aguilar, Castejón, Rosado, Escobar-Fornieles, Revilla-López, Bravo, Sáez-Giménez, Zapata-Ortega, Villena-Ortiz, Vima-Bofarull, Monforte and Gómez-Ollés. This is an open-access article distributed under the terms of the Creative Commons Attribution License (CC BY). The use, distribution or reproduction in other forums is permitted, provided the original author(s) and the copyright owner(s) are credited and that the original publication in this journal is cited, in accordance with accepted academic practice. No use, distribution or reproduction is permitted which does not comply with these terms.
*Correspondence: Víctor Monforte, victor.monforte@vallhebron.cat