 Lin-Zhi Zhou
 Hong-Qi Xiao
 Jie Chen
- 1Department of Gynecological Oncology, Harbin Medical University Cancer Hospital, Harbin, China
- 2Department of General Surgery, The Second Affiliated Hospital of Harbin Medical University, Harbin, China
Objective: Many patients treated with immune checkpoint inhibitors (ICIs) developed primary or secondary drug resistance for unknown reasons. This study investigates whether mismatch repair (MMR) genes are responsible for this therapeutic restriction.
Methods: We obtained the transcriptional, clinical and single nucleotide polymorphism data for endometrial cancer (EC) from The Cancer Genome Atlas and the immunophenoscore data of EC from The Cancer Immunome Atlas, then analyzed in R to evaluate the relationship between MMR genes and clinicopathological features, prognosis, immune infiltration, immune checkpoint expression and responsiveness to ICIs in EC. We used differentially expressed genes in the MSH6 high and low expression groups to conduct GO and KEGG analyses to explore the impact of MSH6 on the biological functions of EC. Finally, we verified the bioinformatics results with in vitro experiments.
Results: Our analyses showed that compared with the high MSH6 expression group, the low MSH6 expression group had better survival outcomes and less aggressive clinicopathological features. In the multivariate Cox analysis, MSH6 was the only independent risk factor that could predict the prognosis of EC. Besides, the low MSH6 expression group also had a higher immune score, more active immune infiltration and higher immune checkpoint expression, resulting in better responsiveness to ICIs treatment, consistent with the enrichment of GO terms and KEGG pathways related to immune response in this group. Meanwhile, the GO and KEGG enrichment results of the MSH6 high expression group were associated with cell cycle, DNA damage repair and tumorigenesis. To exclude the influence of MSH6 mutations, we performed the previous analyses on the MSH6 wild-type tumor samples and obtained consistent results. In vitro experiments also confirmed that after knocking down MSH6 in endometrial cancer cells, their proliferation, migration and invasion abilities were weakened, while the expression levels of PD-L1 and PD-L2 were elevated. In comparison, overexpression of MSH6 showed an opposite trend.
Conclusion: Reduced MSH6 expression could serve as a potential biomarker for predicting better prognosis, active immune status, higher immune checkpoint expression level and better responsiveness to ICIs treatment in EC. MSH6 may become a potential target for treating solid tumors.
1 Introduction
In recent years, due to the extension of life expectancy and the increase in the obesity rate, the morbidity and mortality of endometrial cancer (EC) have continued to rise and show a younger trend (1, 2). EC is typically categorized into type I and type II according to clinical, endocrine and epidemiological features, or into endometrioid, serous and clear cell carcinoma based on histopathological characteristics (3). Many cases have demonstrated that both categorization schemes can accurately identify the nature and prognosis of most tumors. However, in some cases, the tumor morphology is vague, and the characteristics overlap, making it challenging to categorize accurately, resulting in overtreatment or insufficient treatment. In 2013, the American Cancer Genome Atlas (TCGA) divided ECs into four molecular subtypes based on multi-omics features and gradually optimized them: POLE ultra-mutated, microsatellite instability-high (MSI-H)/mismatch repair deficient (dMMR), p53 abnormal and no specific molecular profile (4, 5). This classification is significant in predicting patients’ prognosis and recurrence risk and can provide individualized diagnosis and treatment strategies.
Among the four molecular subtypes, the MSI-H/dMMR subtype accounts for approximately 30% of all primary ECs and 13% to 30% of all recurrent ECs (6), which is caused by mutations (germline pathogenic variants or double somatic pathogenic variants) or epigenetic changes in four MMR genes (MLH1, MSH2, MSH6, PMS2) (7, 8). This subtype is characterized by high tumor mutational burden (TMB), increased tumor-infiltrating lymphocytes and upregulated expression of immune checkpoints, making it an ideal target for immune checkpoint inhibitors (ICIs) (6, 9, 10). In May 2017, based on the findings of many clinical trials (11–13), the US Food and Drug Administration (FDA) accelerated the approval of pembrolizumab for the treatment of refractory adult and pediatric MSI-H/dMMR solid tumors, including EC (14). In 2021, this classification system was formally incorporated into the NCCN guidelines for uterine neoplasms, with precise detection and treatment protocols developed (15). By blocking programmed cell death 1 ligand (PD-L1) on tumor cells and programmed cell death receptor 1 (PD-1) or cytotoxic T lymphocyte antigen-4 (CTLA-4) on T cells, ICIs can inhibit their immunosuppressive interactions, reactivate the exhausted immune cells in the tumor microenvironment (TME), and restore the antitumor effect of effector T cells (16, 17).
ICIs have revolutionized cancer treatment, but the response of patients with MSI-H/dMMR tumors (different origins or the same origin) varies greatly. Some patients may be susceptible to ICIs and have responsiveness durably, while nearly half of the patients fail to benefit from them for unknown reasons (18). We want to explore whether different MMR gene defects are to blame for this treatment restriction from the perspective of the MMR gene itself and whether we could develop drugs that specifically target these different MMR genes to improve patients’ responsiveness to ICIs in the future. Besides, effective biomarkers are required to guide patient selection. In addition to MSI-H/dMMR, other commonly used markers for predicting reactivity include PD-L1, tumor-infiltrating lymphocytes and TMB, but these markers are not entirely reliable (19, 20). To address these issues, we investigated the connections between MMR genes and clinicopathological characteristics, prognosis, immune infiltration, immune checkpoint expression and response to ICIs in EC at the gene level by bioinformatics analysis, and the results were then confirmed by in vitro experiments.
2 Materials and methods
2.1 Bioinformatics analysis
2.1.1 Data acquisition and processing
We obtained EC’s transcriptional and clinical data from TCGA (https://portal.gdc.cancer.gov/) and the survival information on pan-cancer from the UCSC XENA database (https://xenabrowser.net/datapages/) (21). Perl scripts (https://www.perl.com/) were used to merge and preprocess the raw data to extract the gene expression matrix and clinical information. A total of 35 normal samples and 552 tumor samples were collected.
2.1.2 Survival analysis
The survival information of TCGA-UCEC was screened, including survival status, overall survival (OS), progression-free survival (PFS), disease-specific survival (DSS) and disease-free survival (DFS). Then, they were merged with the MMR gene expression data in tumor samples and divided into high and low expression groups according to the medium FPKM value of MMR gene. “survival” (https://cran.r-project.org/web/packages/survival/index.html) and “survminer” packages (https://cran.r-project.org/web/packages/survminer/index.html) were invoked in R Version 4.1.3 (https://www.r-project.org/) to analyze the survival difference between the high and low expression groups, “timeROC” package (https://cran.r-project.org/web/packages/timeROC/index.html) was used to assess the predictive accuracy of MMR genes (22).
2.1.3 The correlation of MMR gene with clinicopathological features and prognosis
We used the “limma” package (https://bioconductor.org/packages/release/bioc/html/limma.html) in R to analyze whether there were differences in clinicopathological characters between the high and low expression groups of MMR genes. The “ggpubr” package (https://cran.r-project.org/web/packages/ggpubr/index.html) was used to analyze whether there were differences in MMR gene expression among different clinicopathological features. The “survival” package was used for univariate and multivariate Cox regression analyses to determine the independent predictors related to prognosis.
2.1.4 The correlation of MMR gene with tumor immune microenvironment and immune checkpoint inhibitor response
The “ESTIMATE” algorithm was performed to calculate the immune, stromal and ESTIMATE scores for each tumor sample (23). The Wilcoxon test was used to analyze whether there were significant differences in the three scores between the MMR gene high and low expression groups (23). The “CIBERSORT” package (https://cibersortx.stanford.edu/) was called in R to analyze whether there were differences in immune cell infiltration levels between the two groups (23). Spearman’s correlation test was used to analyze the correlation of the MMR gene with immune cell infiltration and immune checkpoint related gene expression (23).
The immunophenoscore (IPS) data of EC patients was downloaded from the Cancer Immunome Atlas (TCIA) (https://tcia.at/home). Then, it was merged with the MMR gene expression data in tumor samples to compare whether there were differences in multiple IPS scores between high and low MMR gene expression groups (24).
2.1.5 Repeat analysis in MSH6 wild-type tumor samples after excluding those with MSH6 mutations
We downloaded the single nucleotide polymorphism data of UCEC from TCGA and obtained 432 MSH6 wild-type tumor samples and 75 MSH6 mutant tumor samples. R was used to screen the expression data of MSH6 and immune checkpoint related genes, survival information, immune, stromal and ESTIMATE scores, 22 types of immune cell infiltration data and IPS data of all MSH6 wild-type tumor samples. We also divided the MSH6 wild-type tumor samples into high and low MSH6 expression groups according to the median FPKM value of MSH6 and analyzed whether there were differences in survival, immune score, immune infiltration, immune checkpoint expression and ICIs treatment responsiveness between the two groups using the same methods as before.
2.1.6 Functional enrichment analyses
We used the “limma” package in R to obtain the differentially expressed genes (DEGs) between the high and low expression groups of MSH6, with | log2 fold change (FC) |>1 and adjusted p<0.05 as filtering conditions. The “clusterProfiler” package (https://bioconductor.org/packages/release/bioc/html/clusterProfiler.html) was used in R to conduct Gene Ontology (GO) and Kyoto Encyclopaedia Genes and Genomes (KEGG) analyses on the DEGs that were upregulated in MSH6 high and low expression groups. Results with a false positive rate (FDR) q value<0.05 were deemed significant and were subsequently visualized using the “ggplot2” (https://cran.r-project.org/web/packages/ggplot2/index.html) and “enrichplot” (https://bioconductor.org/packages/release/bioc/html/enrichplot.html) packages.
2.2 In vitro assay
2.2.1 Cell culture and transfection
Endometrial cancer cells Ishikawa and HEC-1B and 293T cells were purchased from Shanghai Fuheng Biotechnology Co., Ltd. All cells were cultured in Dulbecco’s modified Eagle’s medium (DMEM) containing 10% fetal bovine serum (FBS) and 1% penicillin/streptomycin at 37 °C with 5% CO2. We named the lentiviral vector that can downregulate the expression of MSH6 and its control vector as shMSH6 and shNC, respectively, and the vector that can upregulate the expression of MSH6 and the empty vector as OE-MSH6 and Vector, respectively, all of which were purchased from Wuhan Weizhen Biological Company (China). The vector plasmid (10 µg), the helper plasmid psPAX2 (5 µg) and the helper plasmid pMD2G (5 µg) were transfected into 293T cells with Neofect® DNA transfection reagent (Beijing Neofect Biotech Co., Ltd.) at a ratio of 2:1:1. We collected the supernatant containing virus particles 48 hours after transfection and used it to infect Ishikawa and HEC-1B cells after centrifugation and filtration. Target cells were screened with a complete medium containing 2 µg/mL puromycin for 7-14 days after infection with viral particles for 48 hours to obtain stably transfected cell lines. The transfection results were verified by western blotting (WB) and reverse transcription-quantitative polymerase chain reaction (RT-qPCR) analysis. The sequence of shMSH6 was CCG GTT CTG ACA AAG GTG GTA AAT TCT CGA GAA TTT ACC ACC TTT GTC AGA ATT TTT G; The sequence of shNC was TTC TCC GAA CGT GTC ACG TTT CAA GAG AAC GTG ACA CGT TCG GAG AAT TTT TT; The sequence of OE-MSH6 was referred to NM_000179.
2.2.2 Western blotting
Cells were lysed with RIPA buffer containing protease inhibitors, and protein concentration was then detected using the BCA Protein Assay Kit (Beyotime, China). According to the manufacturer’s recommendations, 50 µg protein samples per well were separated by 10% sodium dodecyl sulfate-polyacrylamide gel electrophoresis (SDS-PAGE, Beyotime, China) and transferred the protein on the gel to the PVDF membrane, blocked the membrane with 2.5% skimmed milk for 1 hour at room temperature, and then incubated with the primary antibody against GAPDH, MSH6, PD-L1 and PD-L2 at 4°C overnight, finally incubated with the corresponding second antibody. After washing with PBST 3 times, the bands were visualized with an ECL detection reagent (meilunbio®, China). Quantitative analysis of protein expression was performed using ImageJ.
2.2.3 RT-qPCR
According to the manufacturer’s recommendation, total RNA was extracted from cells using the TRIzol regent. Using a PrimeScript™ RT reagent Kit with gDNA Eraser (Perfect Real Time) (TAKARA, RR047Q, Japan) to reverse transcribed 1 µg RNA into cDNA, followed by quantitative real-time PCR using a TB Green® Premix Ex Taq™ II (Tli RNaseH Plus) (TAKARA, RR820A, Japan). The primers used in the experiment were synthesized by Beijing Ruibo Xingke Biotechnology Co., Ltd. in China, including GAPDH forward 5’-GGTGTGAACCATGAGAAGTATGA-3’and reverse 5’-GAGTCCTTCCACGATACCAAAG-3’; MSH6 forward 5’-GGCTCGAAAGACTGGACTTATT-3’and reverse 5’-CCAGGAGGCTCTGTTCATTT-3’; CD274 forward 5’-GCTGAATTGGTCATCCCAGAA-3’and reverse 5’-CAGTGCTACACCAAGGCATAA-3’; PDCD1LG2 forward 5’-CATGTGAACCTTGGAGCAATAAC-3’and reverse 5’-CCTCACTTGGACTTGAGGTATG-3’.
2.2.4 Cell proliferation and clone formation assay
After constructing endometrial cancer cell lines with stable knockdown and overexpression of MSH6, changes in cell proliferation activity were detected by cell proliferation and clone formation assay.
In the cell proliferation assay, the cells were seeded into 96-well plates at a ratio of 2,000 cells per well. Subsequently, 10 µl of CCK-8 reagent (Beyotime, China) was added to each well at 24 hours, 48 hours, 72 hours, 96 hours and 120 hours, respectively, according to the recommendations of the reagent manufacturer. The absorbance at 450 nm was measured with a microplate reader after incubation at 37°C for 2 hours.
In the clone formation assay, 2,000, 1,000 and 500 cells were seeded into 6-well plates for culture, and fresh complete medium was regularly replaced for 7-14 days until visible colonies were observed. The cell colonies were fixed with methanol for 30 minutes, stained with 2.5% crystal violet (Solebol, China) for 30 minutes, washed, dried, photographed and counted the colonies formed. Cloning efficiency (%) = (number of colonies formed/number of cells inoculated) × 100%.
2.2.5 Wound healing assay and transwell
The cells were spread into the 6-well plate one day in advance to ensure the density was above 90% the next day. The wound was made with a 200 µl yellow pipette tip perpendicular to the bottom of the plate. After the medium was discarded, the wound was cleaned twice with PBS to fully wash the cells in the scratch gap, and 2ml serum-free medium was added to each well. The inverted microscope was used to take photos at 0 hours and 48 hours after wound formation; the scratch area was measured at different time points with Image J (A0, A48), and the cell migration rate was calculated as follows: (A0-A48)/A0 x 100%.
The chamber (24-well, 8um pore size) and Matrigel used for the Transwell assay were purchased from Corning (United States). According to the manufacturer’s recommendation, 600 µL DMEM containing 20% FBS was added to the lower chamber, and 200 µL cell suspension with a density of 4X10^5 cells/mL was added to the upper chamber. After incubation for 36 hours, the upper chamber was taken out, the cells that migrated to the lower chamber were fixed with methanol for 30 minutes, stained with 2.5% crystal violet for 30 minutes, cleaned with deionized water and dried. Five fields were randomly photographed under an inverted microscope with a magnification of 100X for counting, and the average value was taken as the number of cells that passed through. In the invasion assay, the Matrigel was thawed at 4°C overnight in advance. When using, diluted the Matrigel 8 times with DMEM and added 50 µl to the upper chamber; the entire process was performed on ice. The chamber coated with Matrigel can be used as before mentioned after incubation at 37°C and 5% CO2 for 3 hours.
2.3 Statistical analysis
Statistics for all bioinformatic analyses were performed in R Version 4.1.3. The Wilcoxon test was used when comparing two groups, and the Kruskal-Wallis test was used when comparing three or more groups. Correlation analyses between two variables were performed using the Spearman test. In the in vitro assay, all experiments were repeated three times, and Student’s t-test was performed using GraphPad Prism 9.0.0 to evaluate whether there were statistical differences between two independent groups. Unless otherwise mentioned, P<0.05 was considered statistically significant in all analyses.
3 Results
3.1 Prognostic value of MMR genes in EC
MMR genes maintain genomic stability and inhibit tumor formation by preventing mutation accumulation and mediating apoptotic responses of DNA damage, while mutations in MMR genes cause hereditary non-polyposis colorectal cancer, and MMR defects are associated with the formation of multiple sporadic tumors (25, 26). Multiple studies have confirmed that the overexpression of MMR proteins is associated with adverse survival outcomes in a variety of tumors, including prostate cancer (27), oral squamous cell carcinoma (28), melanoma (29), etc. To determine whether MMR genes can predict the prognosis of EC patients or not, we divided EC samples into high and low expression groups based on the median FPKM value of MMR genes and found that the survival outcomes of the MSH2 and MSH6 low expression groups were significantly better than their high expression groups (MSH2: OS, p=0.018, Figure 1A; PFS, p=0.032, Figure 1A; DSS, p=0.033, Supplementary Figure S1A; DFS, p=0.103, Supplementary Figure S1A; MSH6: OS, p=0.009, Figure 1B; PFS, p=0.001, Figure 1B; DSS, p<0.001, Supplementary Figure S1B; DFS, p=0.015, Supplementary Figure S1B);, while there was no significant difference between the high and low expression groups of MLH1 and PMS2 (MLH1: OS, p=0.864, Figure 1C; PFS, p=0.450, Figure 1C; DSS, p=0.869, Supplementary Figure S1C; DFS, p=0.409, Supplementary Figure S1C; PMS2: OS, p=0.531, Figure 1D; PFS, p=0.625, Figure 1D; DSS, p=0.647, Supplementary Figure S1D; DFS, p=0.303, Supplementary Figure S1D);. In addition, the area under the curve (AUC) of MSH2 (Figure 1E) and MSH6 (Figure 1F) for 1-,3-, and 5-years OS were higher than those of MLH1 (Figure 1G) and PMS2 (Figure 1H). All of these indicate that MSH2 and MSH6, but not MLH1 and PMS2, may be related to the prognosis of EC patients.
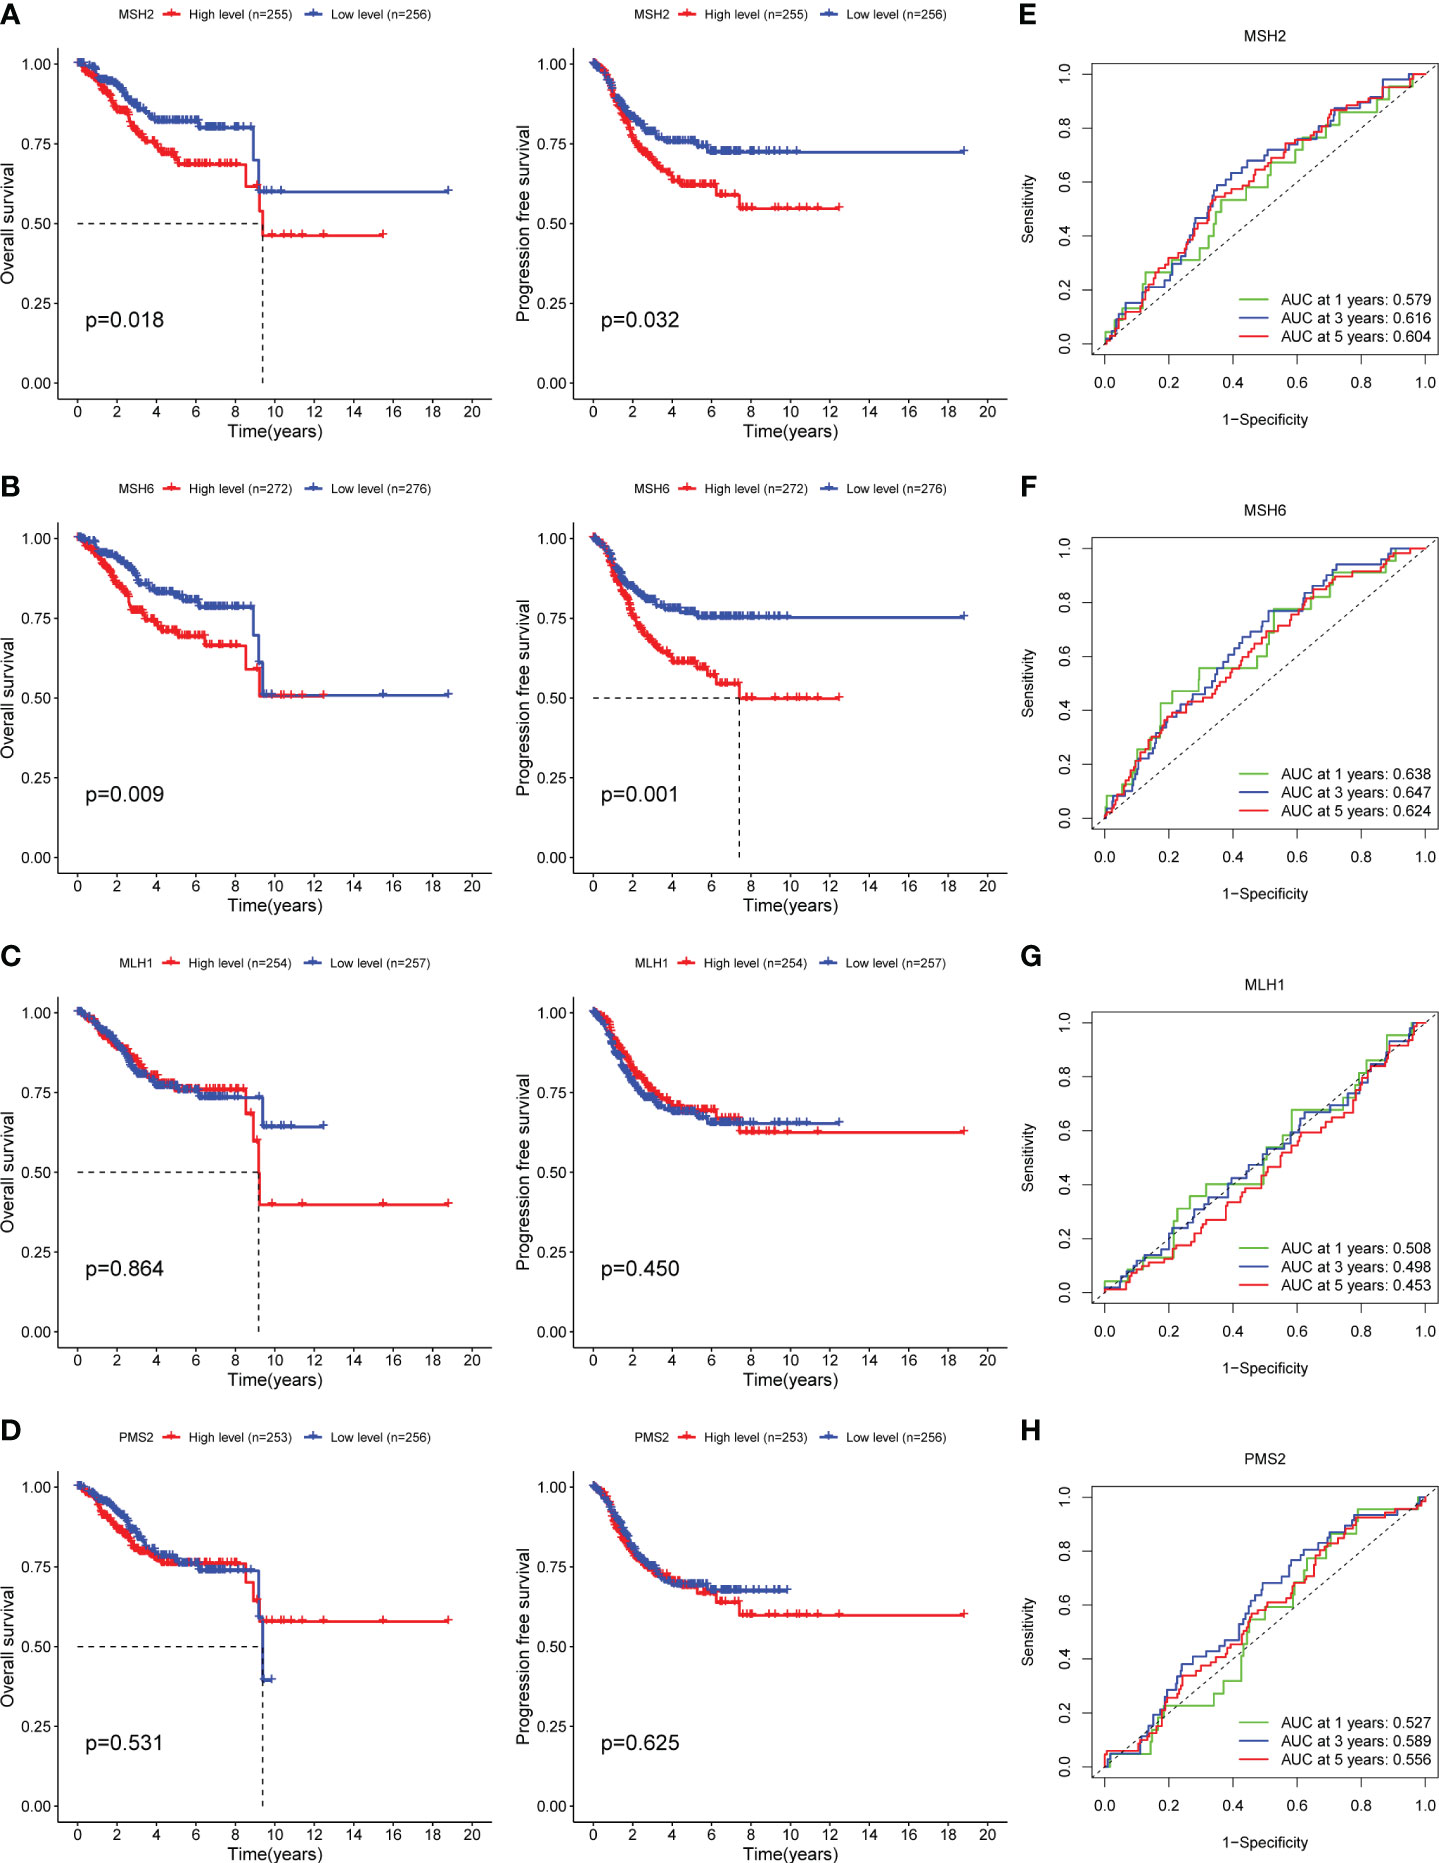
Figure 1 MSH2 and MSH6, but not MLH1 and PMS2, related to the OS and PFS of EC patients. The OS and PFS curves of the low expression groups of MSH2 (A) and MSH6 (B) were significantly higher than those of their high expression groups, while there was no significant difference between the high and low expression groups of MLH1 (C) and PMS2 (D). The area under the ROC curve of MSH2 (E) and MSH6 (F) was higher than that of MLH1 (G) and PMSH2 (H). OS, Overall Survival; PFS, Progress Free Survival; EC, endometrial cancer.
3.2 Relationship between MMR genes and clinicopathological features of EC and cox regression analysis
By evaluating the relationship between the expression of four MMR genes and the clinicopathological features of EC, we found that MSH2 (Figure 2A) and MSH6 (Figure 2B) were associated with various clinicopathological features. For example, the expression level of MSH2 (Supplementary Figure S2A) was higher in patients with BMI<27, Federation International of Gynecology and Obstetrics (FIGO) grade III (G3), serous carcinoma and lymph node metastasis; The expression level of MSH6 (Supplementary Figure S2B) was higher in patients with age over 60, BMI<27, FIGO stage III, G3, serous carcinoma and lymph node metastasis. These results suggested that patients with high MSH2 and MSH6 expression had more aggressive disease features, which were consistent with the worse survival outcomes of patients in the MSH2 and MSH6 high expression groups mentioned above. In comparison, the expression of MLH1 (Figure 2C; Supplementary Figure S2C) and PMS2 (Figure 2D; Supplementary Figure S2D) were not relevant to multiple clinicopathological features of EC.
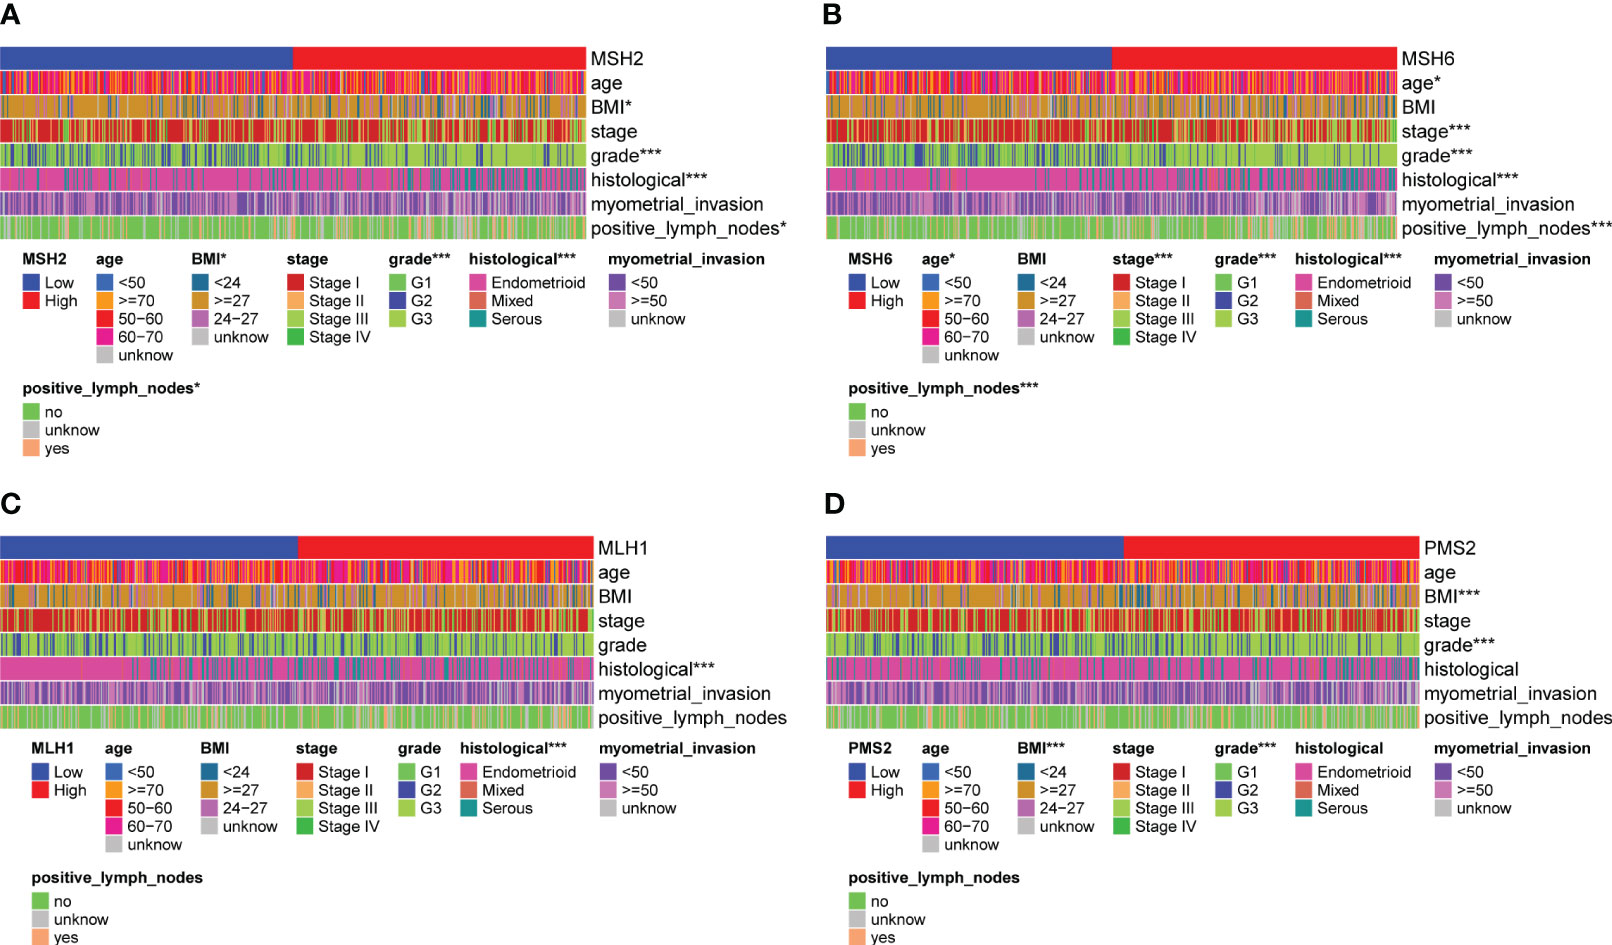
Figure 2 MSH2 and MSH6, but not MLH1 and PMS2, were related to multiple crucial clinicopathological features of EC. The expression of MSH2 (A) and MSH6 (B) was associated with various clinicopathological features, like the age, BMI, FIGO stage and grade, histological and lymph node metastasis of EC patients, while the expression of MLH1 (C) and PMS2 (D) was not relevant to multiple clinicopathological features of EC. *p < 0.05, ***p < 0.001.
We conducted Cox regression analysis to verify whether MSH2 and MSH6 can be viewed as independent prognostic factors. In univariate Cox analysis, the p values of the stage (p<0.001), grade (p=0.022), histological (p=0.006), lymph node metastasis (p<0.001) and MSH6 (p=0.008) were significant, but only MSH6 (p=0.005) remained an independent risk factor for predicting adverse outcomes in multivariate Cox regression analysis (Supplementary Table S1).
3.3 MSH6 correlated with immune score, immune infiltration, immune checkpoint expression and ICIs Reactivity in EC
Given the high immunogenicity of dMMR EC, we tried to analyze the relationship between MSH6 and the immune score and immune infiltration in EC. The results demonstrated that the immune, stromal and ESTIMATE scores of the low expression group of MSH6 were significantly higher than those of the high expression group (Figure 3A). These suggest that MSH6 is associated with immune infiltration. We next employed CIBERSORT to analyze the relationship between MSH6 and 22 types of immune cell infiltration. We found that the expression of MSH6 (Figure 3B) was significantly associated with the infiltration of various immune cells. For example, it was positively correlated with the infiltration of M1 macrophages, M2 macrophages, gamma delta T cells (γδT), follicular helper T cells (Tfh), naïve B cells and activated dendritic cells but negatively correlated with the infiltration of monocytes, activated NK cells, CD8+T cells and regulatory T cells (Tregs). We believe that patients in the MSH6 low expression group have a more active immune status, suggesting that they have a stronger antitumor immune response, which is also consistent with their better prognosis.
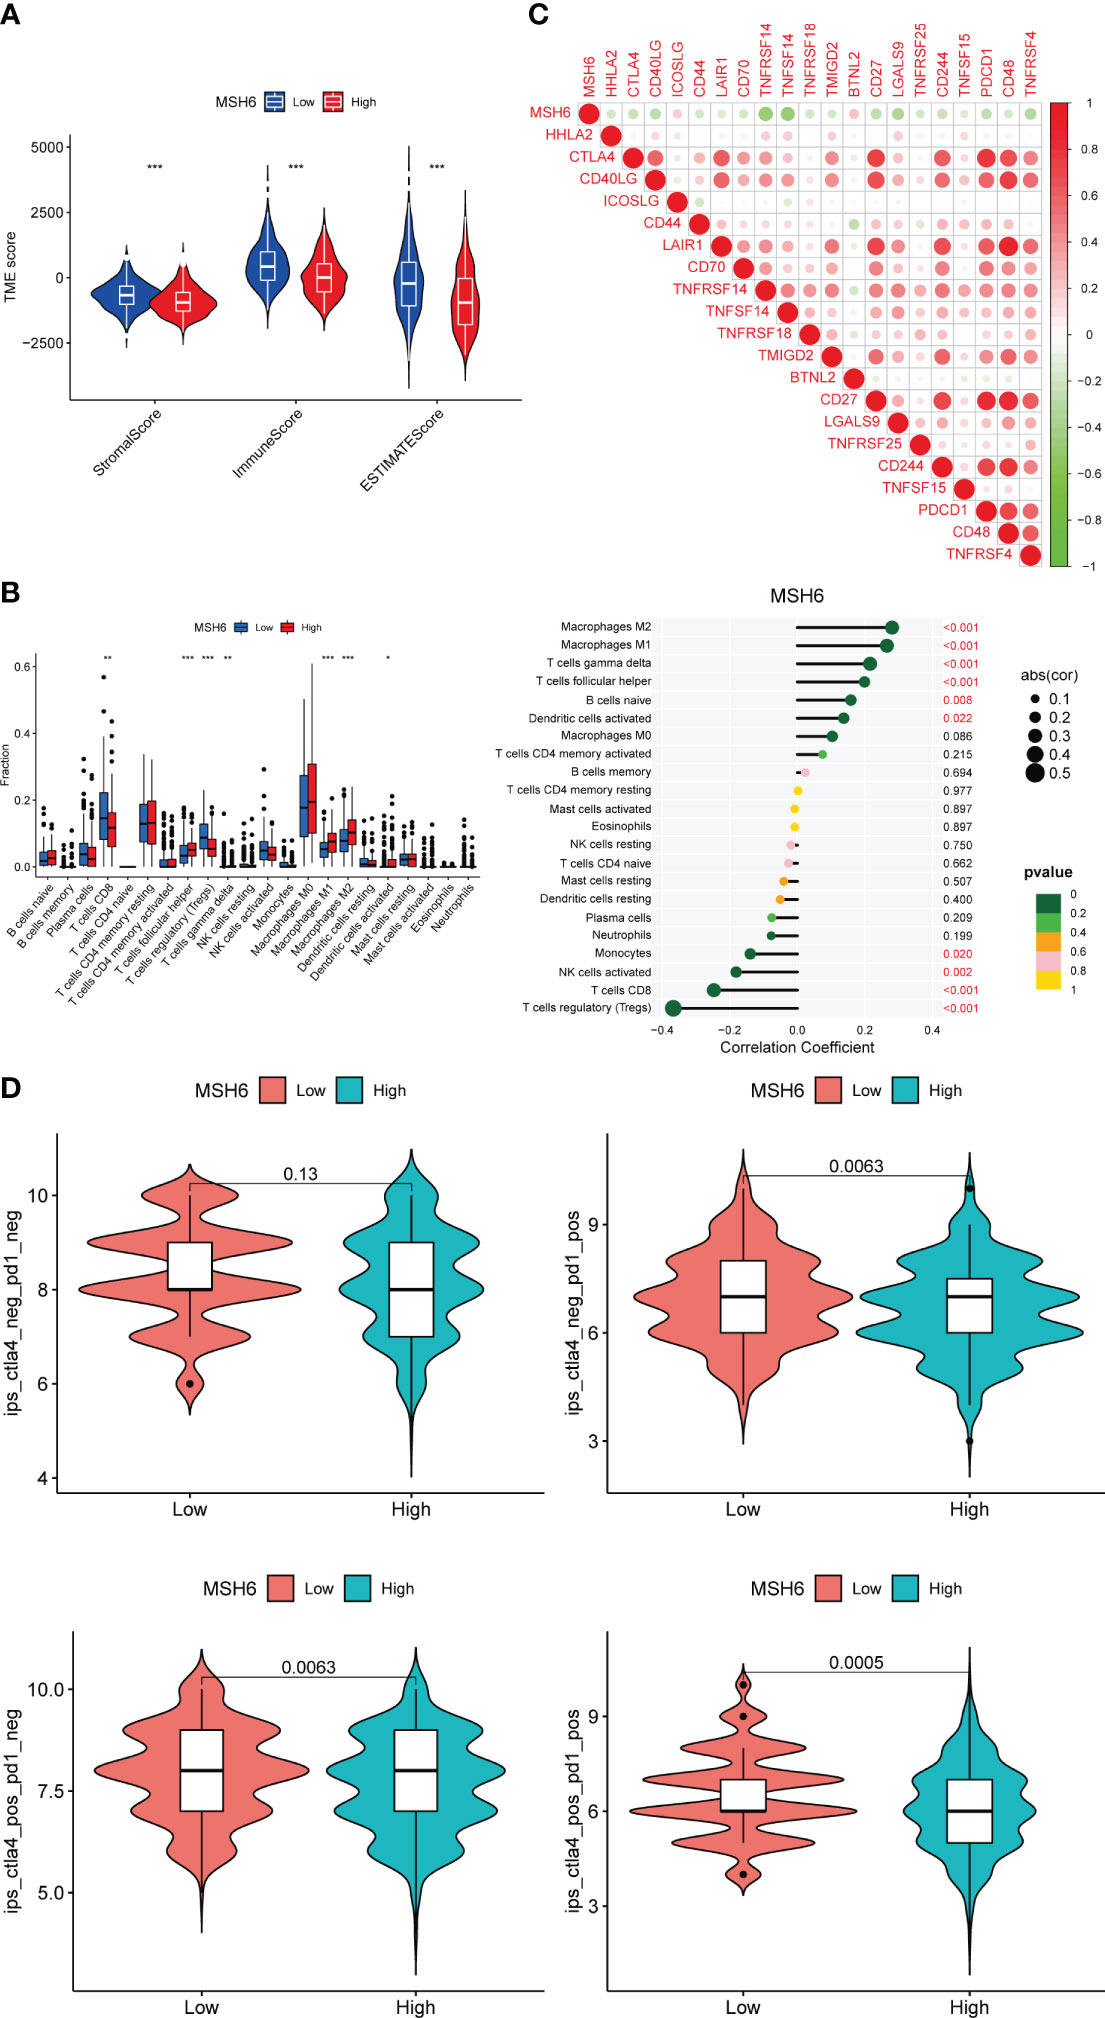
Figure 3 MSH6 correlated with the immune score, immune infiltration, immune checkpoint expression and ICIs reactivity in EC. The lower the expression level of MSH6, the higher the immune, stromal and ESTIMATE scores (A), the higher the infiltration level of multiple immune cells (B) and the immune checkpoint expression (C), and the higher the scores of multiple IPS (D). *p < 0.05, **p <0.01, ***p < 0.001.
Along with immune infiltration, the expression of immune checkpoints such as PD-1 and its ligand (PD-L1) are also associated with the reactivity of dMMR ECs to ICIs. We evaluated the relationship between MSH6 and immune checkpoint related genes in EC and found that the expression of MSH6 was negatively correlated with the expression of multiple immune checkpoint related genes, including CTLA-4 and PDCD1 (Figure 3C).
In conclusion, the negative correlation between MSH6 and active immune cell infiltration and immune checkpoint expression suggests that the expression of MSH6 is related to the response to ICIs treatment, the lower its expression, the higher the responsiveness of patients. To verify this hypothesis, we analyzed the relationship between MSH6 and multiple IPS scores of EC. It was found that IPS-CTLA-4 negative-PD-1 positive (p=0.0063), IPS-CTLA-4 positive-PD-1 negative (p=0.0063) and IPS-CTLA-4 positive-PD-1 positive (p=0.0005) scores were higher in the low expression group of MSH6 (Figure 3D), suggesting that patients in the low expression group had higher reactivity against anti-CTLA-4 antibody and/or anti-PD-1 antibody.
3.4 Repeat analysis in MSH6 wild-type tumor samples
Loss of MMR function is associated with cancer risk, progression and treatment responsiveness. Knijnenburg et al. analyzed the genomic and molecular landscape of DNA damage repair deficiency in pan-cancer using the TCGA database (30). They found that among 33 cancer types, UCEC had the most changes in the DNA damage repair gene somatic alterations, among which the incidence of MMR pathway-related gene mutations, especially MSH6, ranks second at 41%. The expression of MSH6 with loss-of-function mutation differs from that of wild-type MSH6.
To exclude the impact of MSH6 mutations on our results, we downloaded the single nucleotide polymorphism data of UCEC from TCGA and obtained 432 MSH6 wild-type tumor samples and 75 MSH6 mutant tumor samples. We performed all the previously mentioned analyses on the remaining MSH6 wild-type tumor samples after removing tumor samples with MSH6 mutations and obtained results consistent with those from before. Compared with the high MSH6 expression group, the low MSH6 expression group had higher OS (p=0.010, Figure 4A) and PFS (p=0.020, Figure 4B), as well as higher immune, stromal and ESTIMATE scores (Figure 4C). Correlation analysis indicated that MSH6 was negatively correlated with the infiltration of CD8+T cells, activated NK cells, monocytes and Tregs, while positively correlated with the infiltration of M1 macrophages, M2 macrophages, etc (Figures 4D, E). MSH6 was also negatively correlated with the expression of multiple immune checkpoint related genes (Figure 4F). In addition, the IPS-CTLA-4 positive-PD-1 positive (p=0.013) score in the group with low MSH6 expression was higher than that in the group with high MSH6 expression, suggesting a better response to anti-CTLA-4 and anti-PD-1 treatment in patients with low MSH6 expression (Figure 4G).
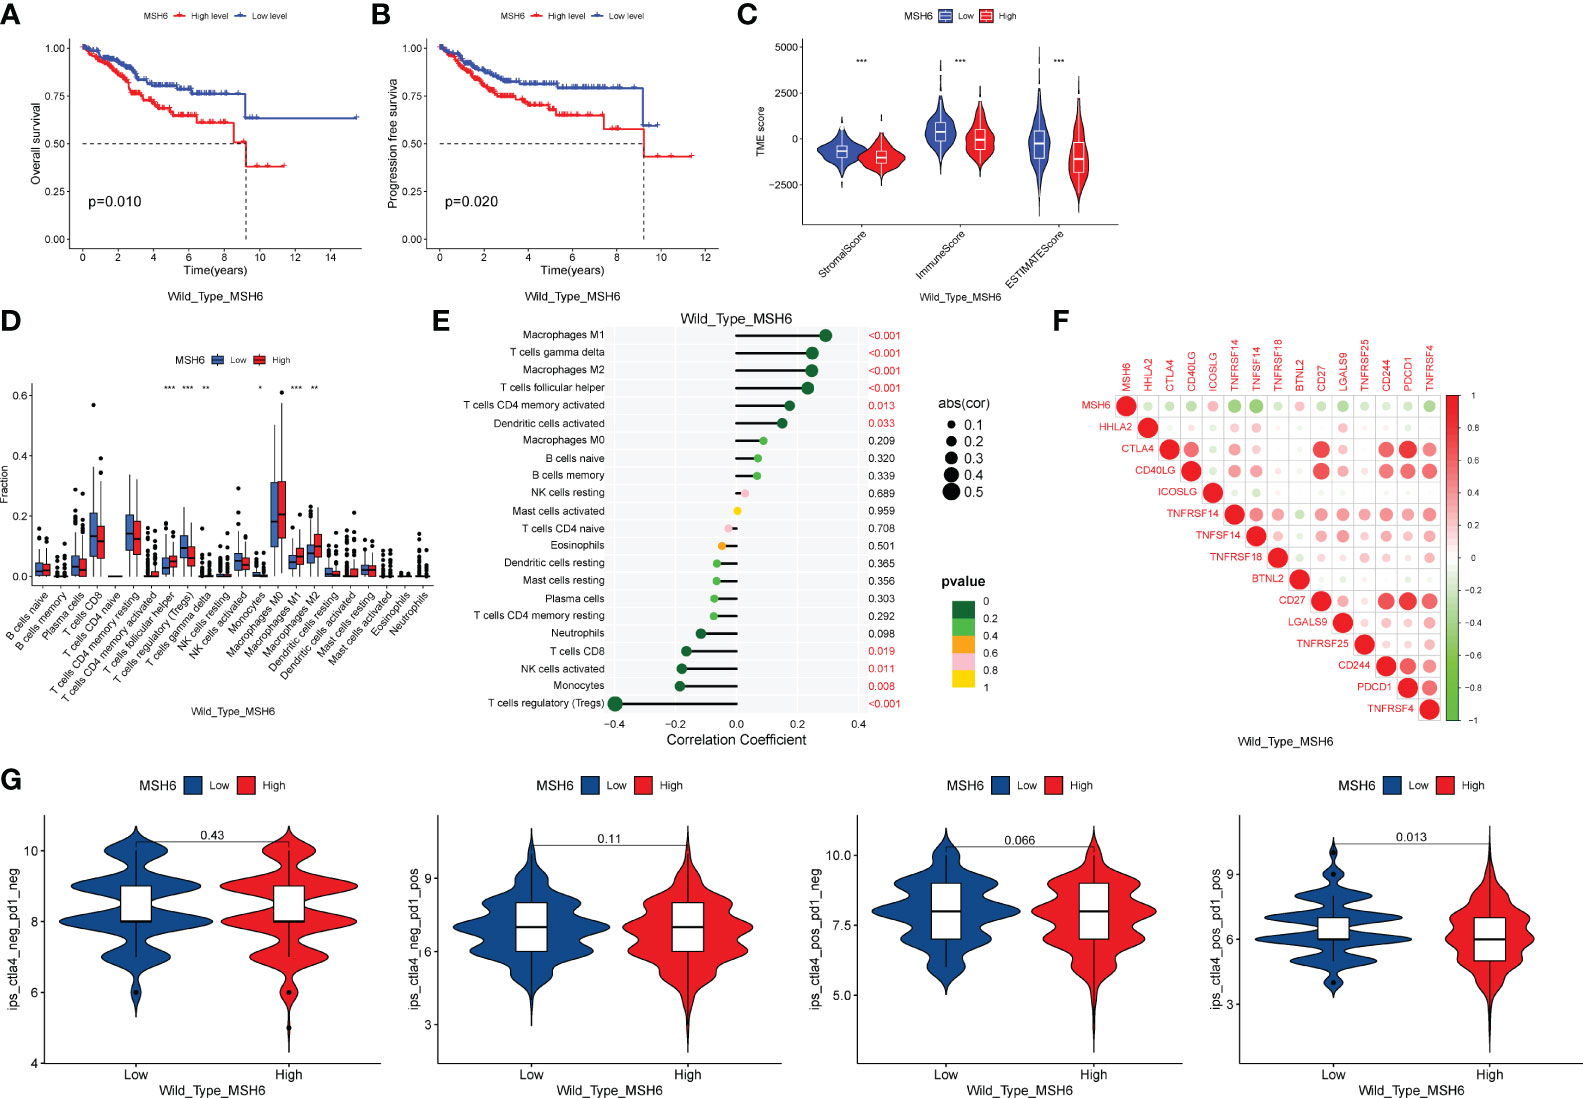
Figure 4 After excluding samples with MSH6 mutations, MSH6 was still associated with survival, immune infiltration, immune checkpoint expression and ICIs treatment responsiveness in EC. In MSH6 wild-type endometrial cancer samples, compared with the high expression group of MSH6, the low expression group had higher OS (A) and PFS (B), as well as higher immune, stromal and ESTIMATE scores (C); Correlation analysis showed that MSH6 was negatively correlated with the infiltration of multiple active immune cells (D, E) and the expression of immune checkpoints (F); Patients with low MSH6 expression had better response to anti-CTLA-4 and anti-PD-1 treatment (G). OS, Overall Survival; PFS, Progress Free Survival; EC, endometrial cancer. *p < 0.05, **p <0.01, ***p < 0.001.
3.5 Differences in biological functions between MSH6 high and low expression groups
To explore the biological functions and pathways that may be affected by changes in MSH6 expression in endometrial cancer, we used R to conduct GO and KEGG analyses on the DEGs upregulated in the MSH6 high and low expression groups, respectively. GO enrichment analysis consisted of three parts: biological process (BP), cellular component (CC), and molecular function (MF). In the MSH6 low expression group, the enriched BP terms were mainly related to immune cell migration, immune response and chemokine response, the enriched CC terms were primarily associated with the microtubule, motile cilia and dynein complex, and the enriched MF terms were mainly related to various enzyme regulator activity, cytokine activity and motor activity, etc (Figure 5A). In addition, the KEGG pathways enriched in the MSH6 low expression group were involved in multiple immune-related diseases, such as inflammatory bowel disease and asthma, and were also related to T cell differentiation and natural killer cell-mediated cytotoxicity (Figure 5C). These results all suggested that genes enriched in the MSH6 low expression group were mainly involved in regulating immune responses, consistent with the higher immune score (Figures 3A, 4C) and more active immune infiltration (Figures 3B, 4D, E) in the MSH6 low expression group. In the MSH6 high expression group, the enriched GO terms were mainly related to the regulation of mitosis, DNA replication and organism development (Figure 5B); the enriched KEGG pathways were not only associated with the cell cycle and DNA replication and DNA damage repairs related pathways such as homologous recombination, mismatch repair and base excision repair, it also involved multiple cancer-related pathways such as pancreatic cancer, renal cell carcinoma and chronic myeloid leukemia (Figure 5D). These results suggested that genes enriched in the MSH6 high expression group were mainly related to cell proliferation, and the dysregulation of cell proliferation can lead to the occurrence of cancer, which was consistent with the previously obtained worse survival outcomes of endometrial cancer patients in the high expression group of MSH6 (Figures 1B, 4A, B).
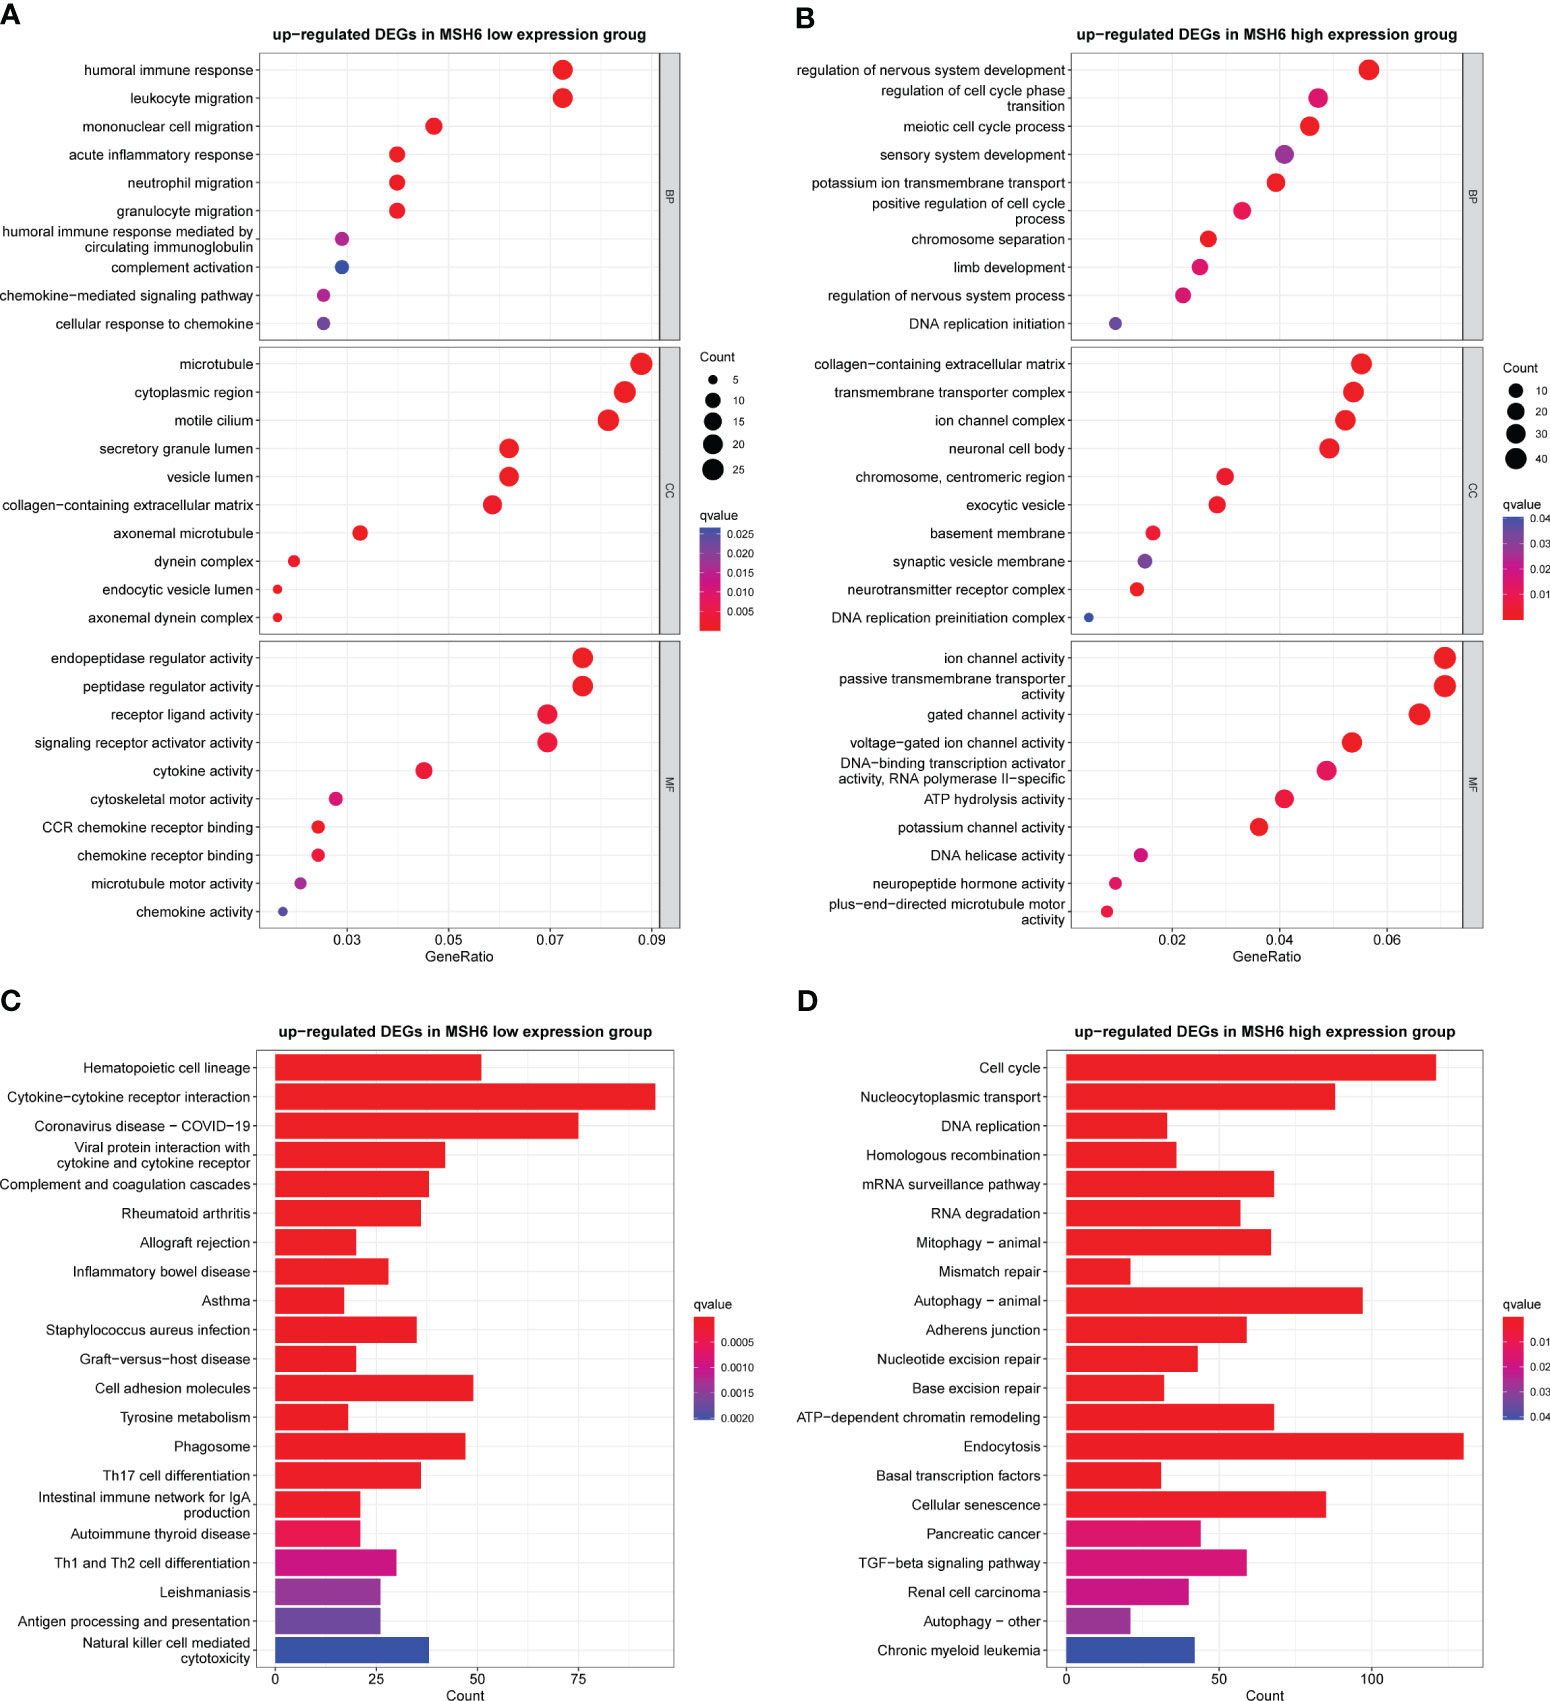
Figure 5 The GO and KEGG enrichment results in the MSH6 high and low expression groups of endometrial cancer. Representative GO terms (A) and KEGG pathways (C) enriched in the MSH6 low expression group mainly regulated immune response. Representative GO terms (B) and KEGG pathways (D) enriched in the MSH6 high expression group were related to cell cycle regulation, DNA damage repair and tumorigenesis. GO: gene otology; KEGG: Kyoto Encyclopaedia of Genes and Genomes.
3.6 MSH6 correlated with the proliferation, migration and invasion ability of endometrial cancer cells
To verify the results of the aforementioned bioinformatics analysis, we conducted in vitro experiments. We infected endometrial cancer cells (Ishikawa and HEC-1B) with lentivirus that can knock down or overexpress MSH6 and confirmed its infection effect by RT-qPCR and WB (Figure 6; Supplementary Figure S3). The cell proliferation and clonal formation assay indicated that the proliferation ability of endometrial cancer cells after MSH6 knockdown was significantly weaker than that of the control group (Figures 7A, C; Supplementary Figures S4A, C), while it was significantly stronger than that of the control group after overexpression of MSH6 (Figures 7B, D; Supplementary Figures S4B, D). The wound healing and Transwell assay revealed that the migration and invasion ability of the MSH6 knockdown group was significantly inferior to its control group (Figures 8A, C; Supplementary Figures S5A, C), while in the MSH6 overexpression group, it was significantly stronger than its control group (Figures 8B, D; Supplementary Figures S5B, D).
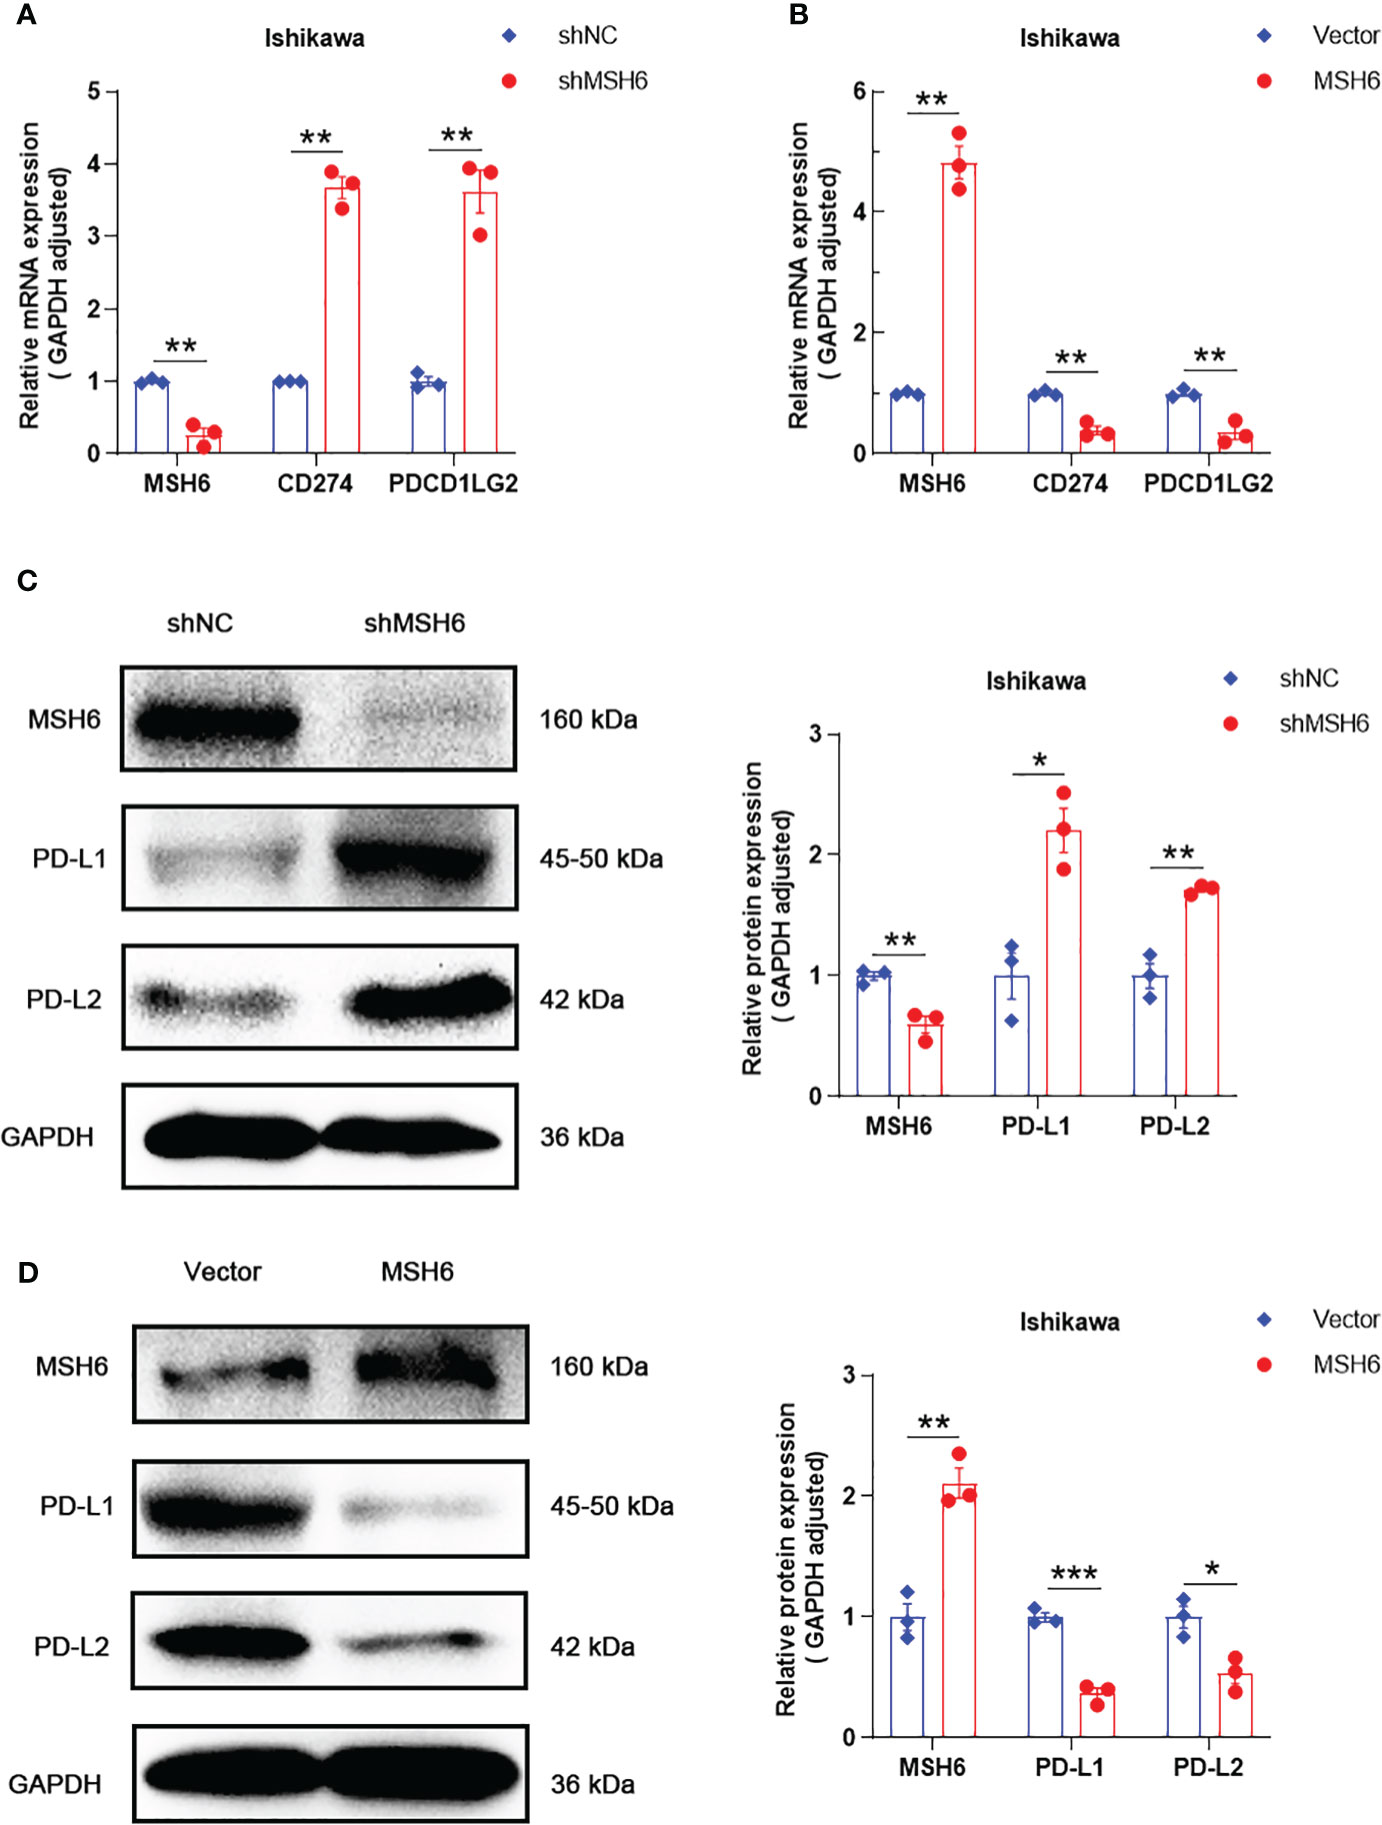
Figure 6 MSH6 correlated with the expression of PD-L1 and PD-L2 in Ishikawa cells. RT-qPCR and WB confirmed that after knocking down MSH6 in Ishikawa cells, the expression levels of PD-L1 and PD-L2 were higher than those in the control group (A, C), while the opposite trend was observed after overexpressing MSH6 (B, D).*p < 0.05, **p <0.01, ***p < 0.001.
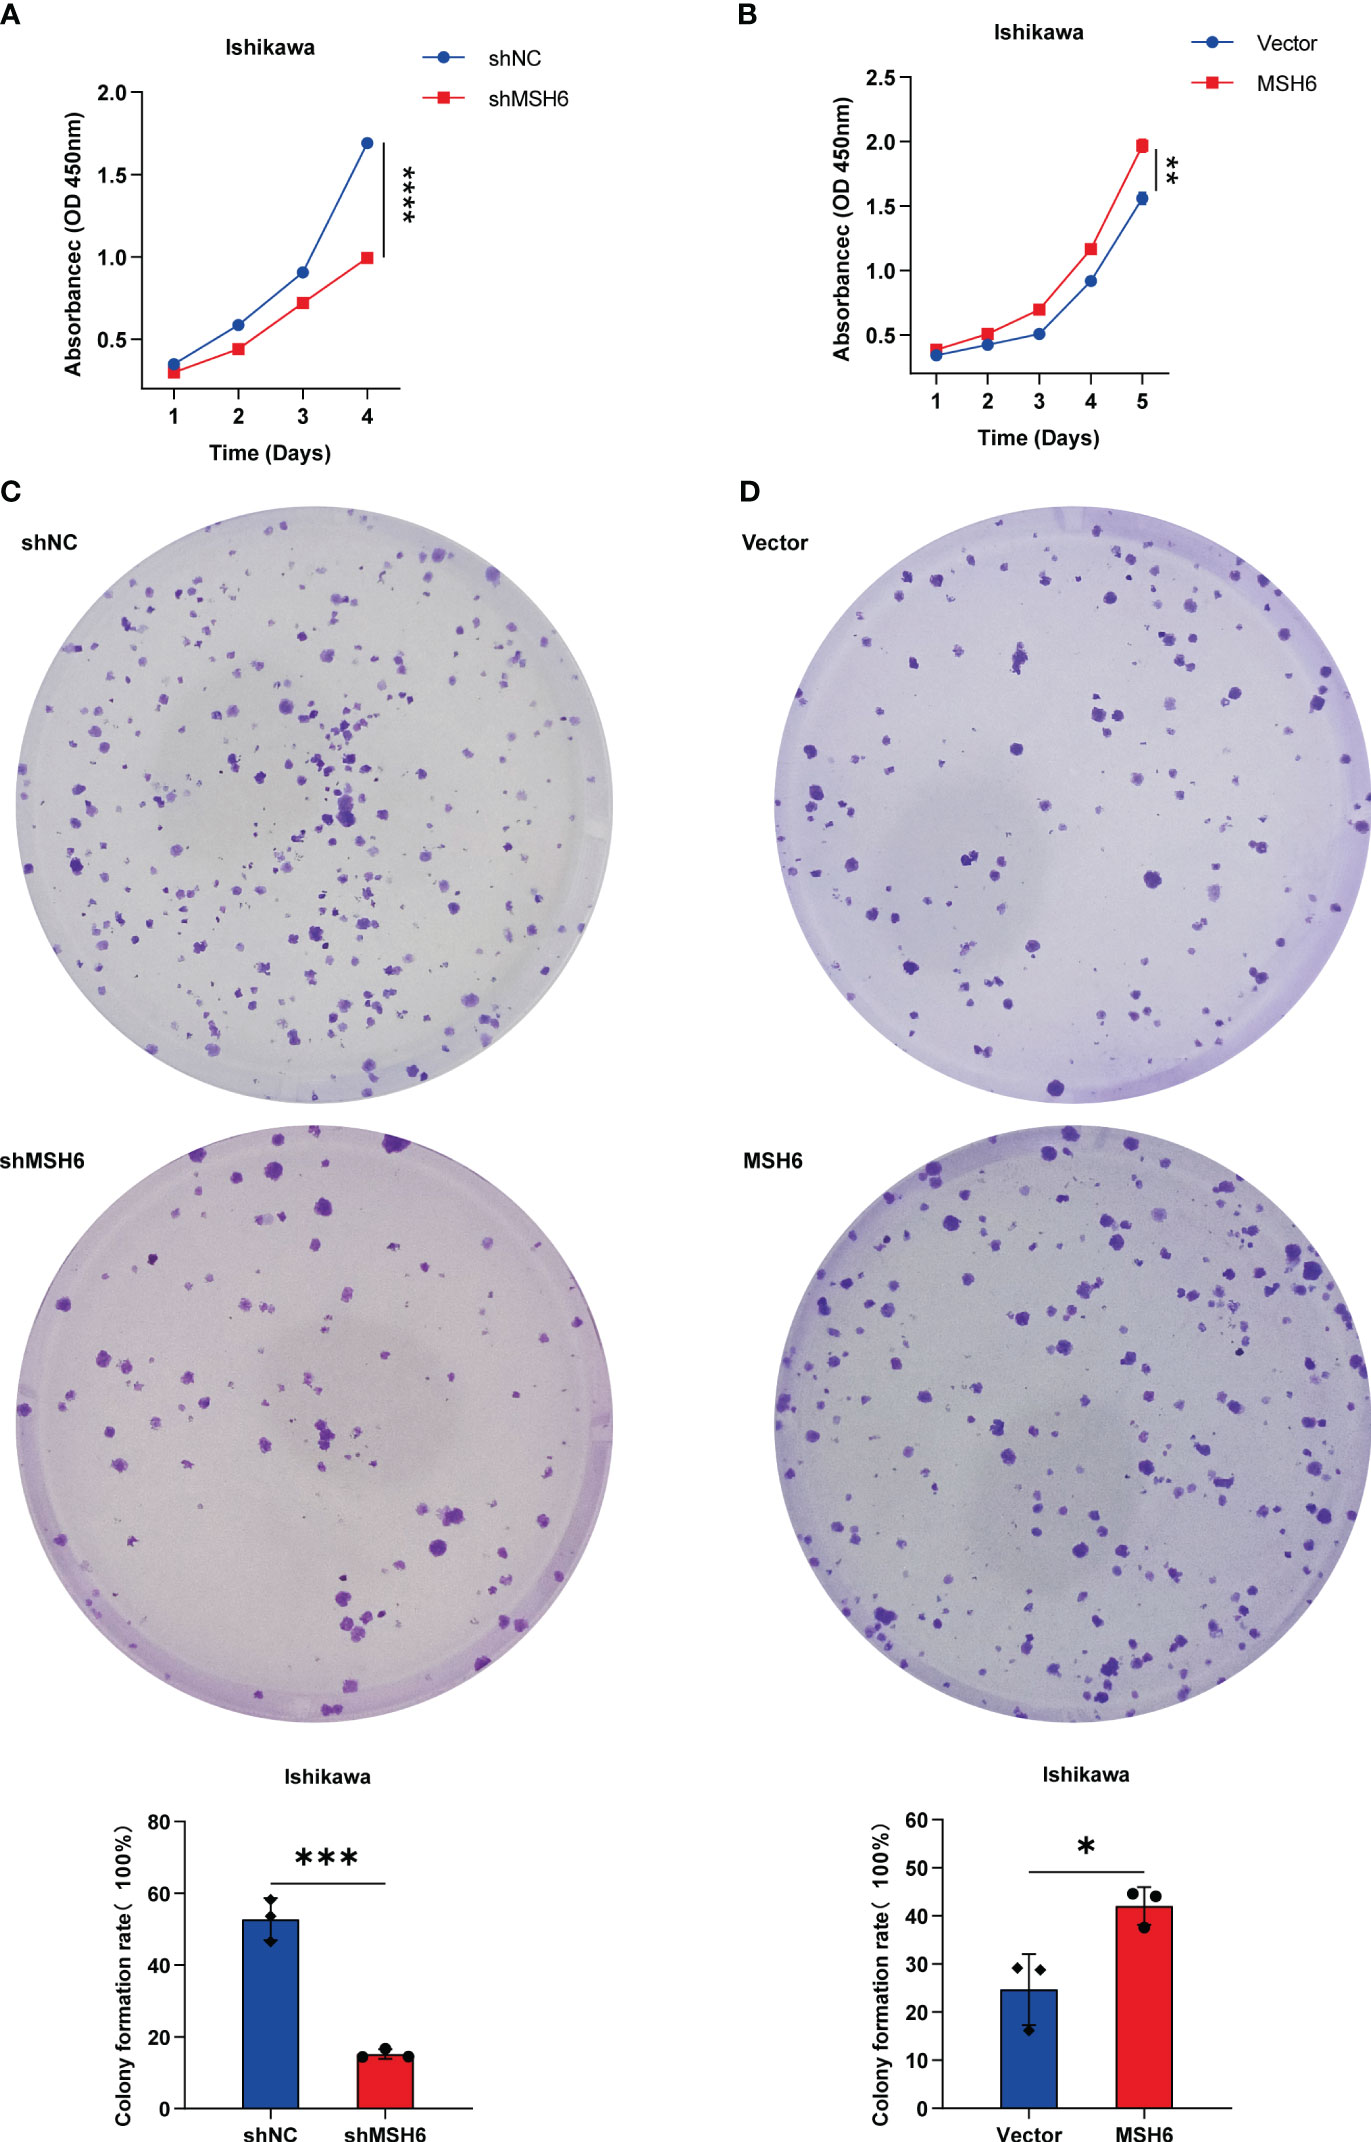
Figure 7 MSH6 correlated with the proliferation ability of Ishikawa cells. Cell proliferation and clone formation assay confirmed that the proliferation ability of MSH6 knockdown Ishikawa cells was weaker than that of the control cells (A, C), while in the MSH6 overexpression Ishikawa cells, it was stronger than that of the control cells (B, D). *p < 0.05, **p <0.01, ***p < 0.001, ****p < 0.0001.
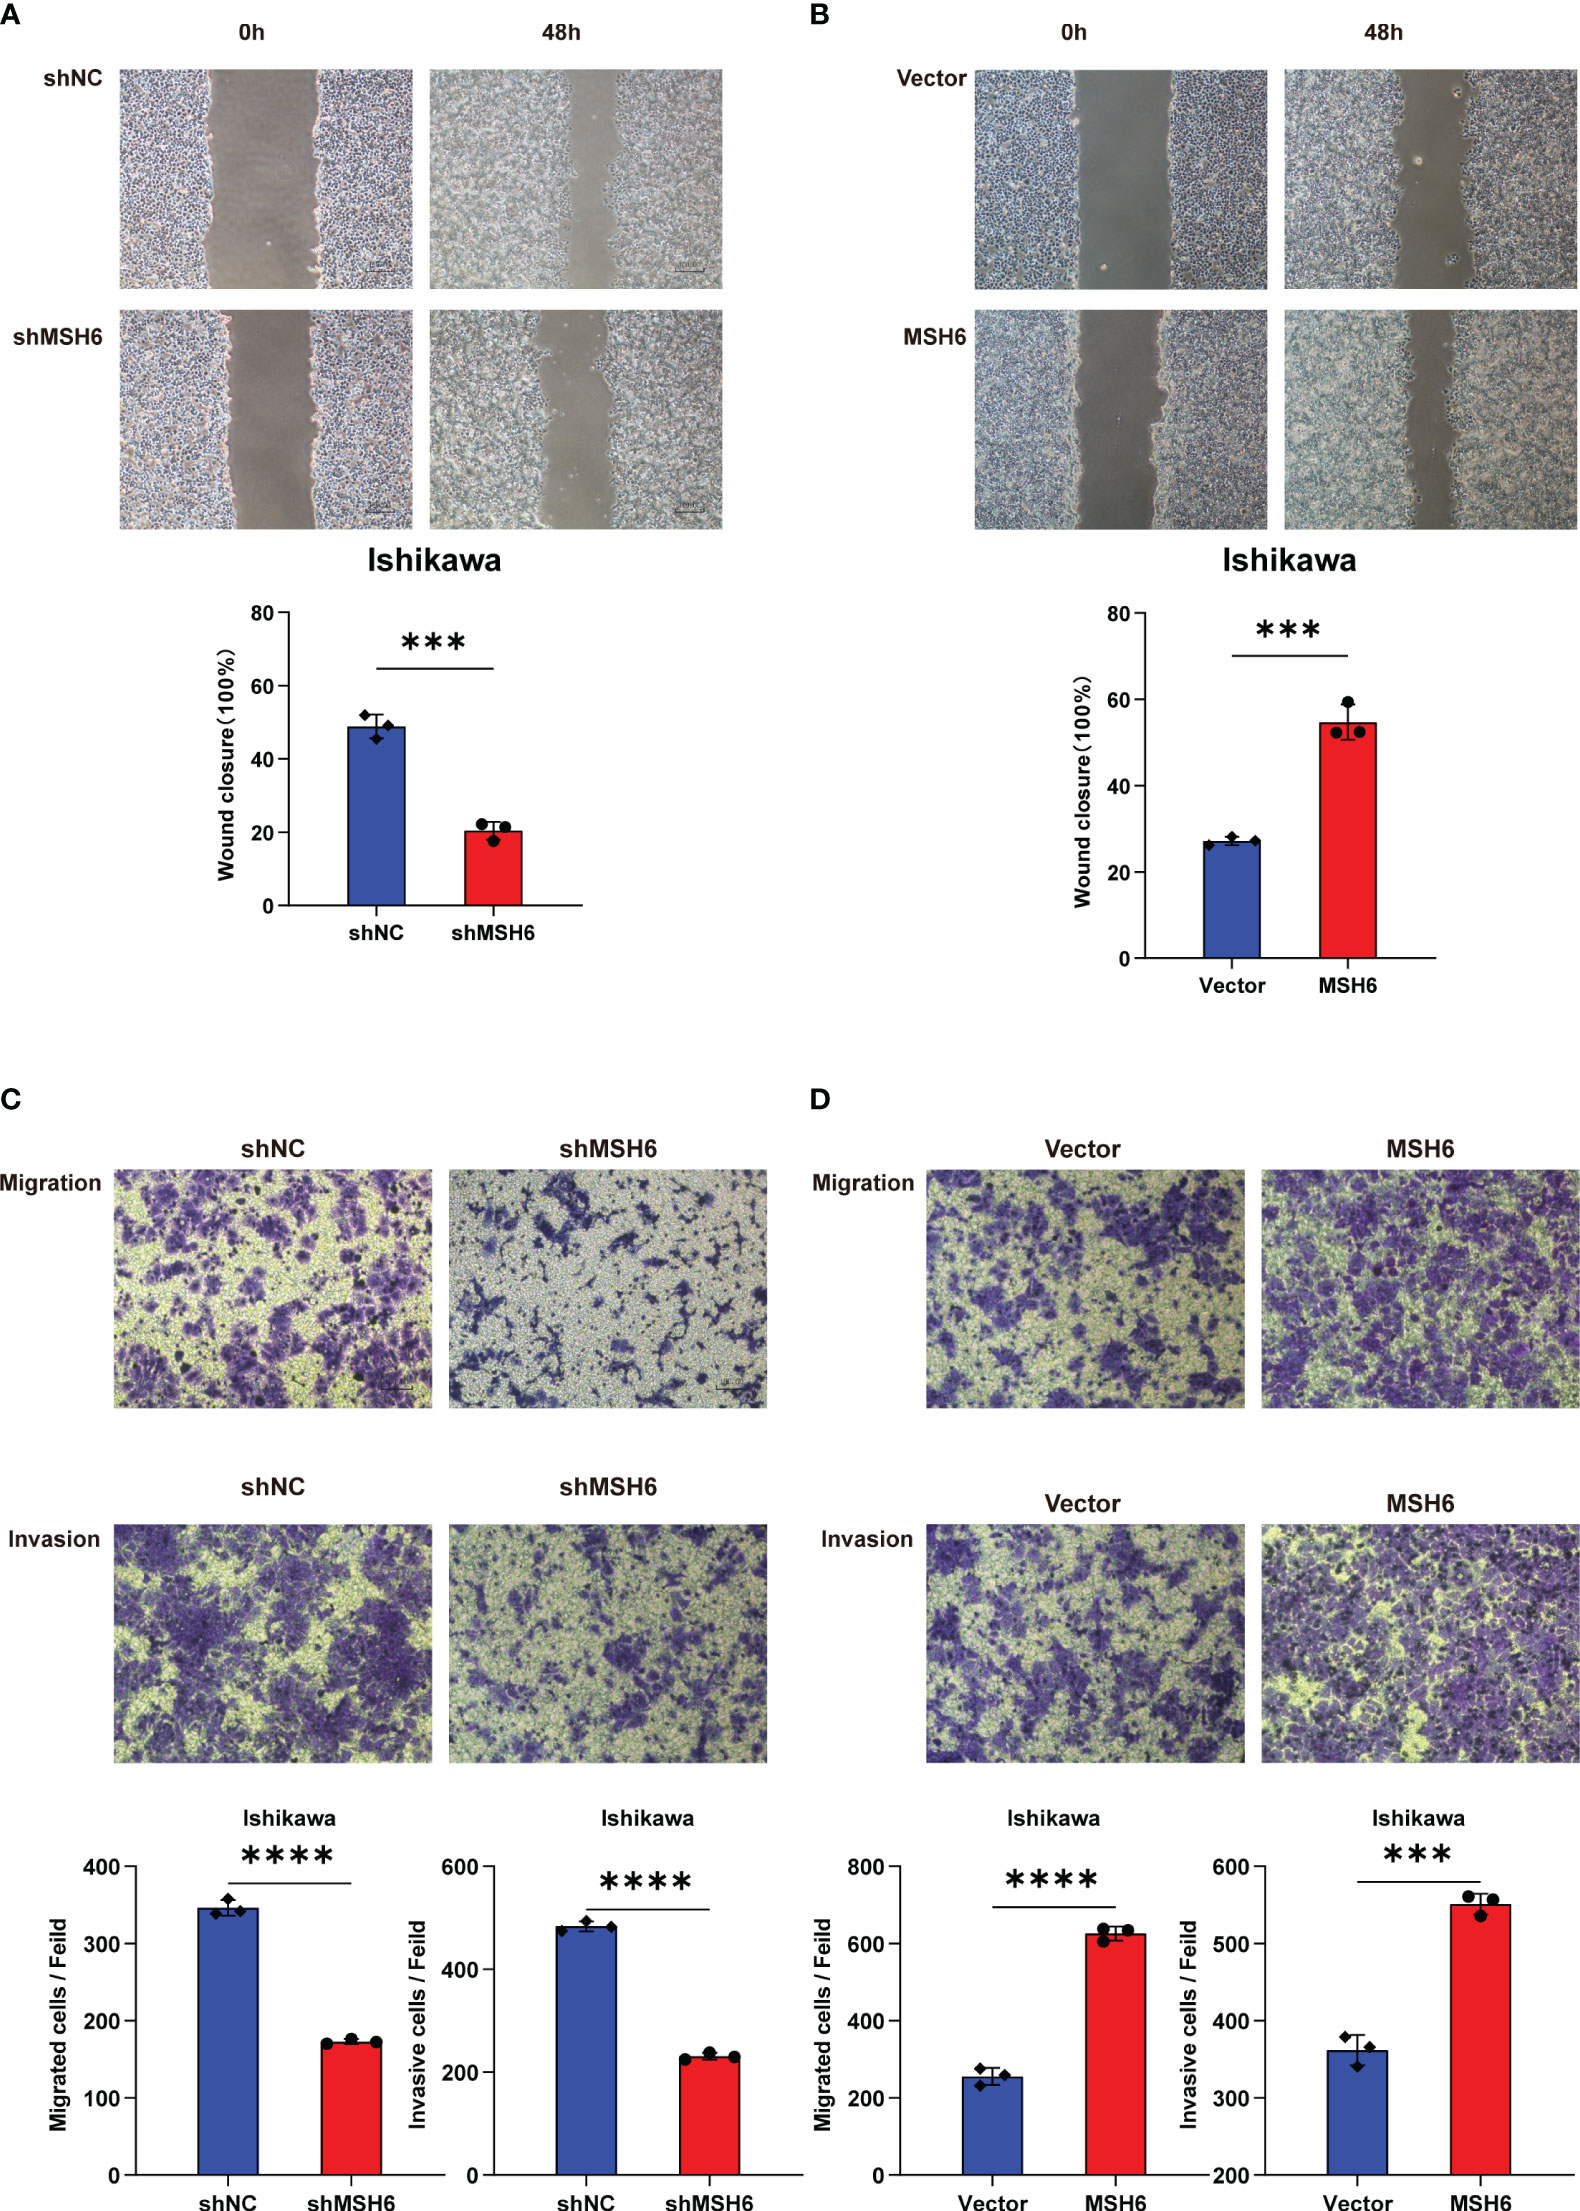
Figure 8 MSH6 correlated with the migration and invasion ability of Ishikawa cells. Wound healing and Transwell assay confirmed that the migration and invasion ability of MSH6 knockdown Ishikawa cells was weaker than that of the control cells (A, C), while the opposite trend was observed after overexpressing MSH6 (B, D). ***p < 0.001, ****p <0.0001.
3.7 MSH6 correlated with the expression of PD-L1 and PD-L2
RT-qPCR and WB also confirmed that the expression levels of PD-L1 and PD-L2 in cells after MSH6 knockdown were significantly higher than those in the control group, while in cells after MSH6 overexpression, they were significantly lower than those in the control group (Figure 6; Supplementary Figure S3).
4 Discussion
This study found through bioinformatics analysis that MSH6 was associated with clinicopathological features, prognosis, immune infiltration, immune checkpoint expression and ICIs reactivity in EC. The lower expression level of MSH6 was associated with less aggressive disease features, higher levels of immune cell infiltration (especially CD8+T cells) and immune checkpoint expression in EC patients, which may be related to higher response to ICIs and better prognosis in EC patients. GO and KEGG analyses confirmed that the genes enriched in the MSH6 low expression group were mainly involved in regulating immune response, while the genes enriched in the MSH6 high expression group were related to tumorigenesis. In vitro experiments also confirmed that the proliferation, migration and invasion ability of cells in the MSH6 knockdown group were weaker than those in the control group, but the expression levels of PD-L1 and PD-L2 were higher than those in the control group. There was an opposite trend in the overexpression group of MSH6 and its control group.
It is worth noting that when using CIBERSORT to analyze the relationship between MSH6 and immune cell infiltration, we found that the trend of Tregs infiltration was consistent with CD8+T cells but opposite to M2 macrophages. Previous studies on the immune microenvironment of various tumor types, such as nasopharyngeal cancer (31), colorectal cancer (32), and prostate cancer (33), have suggested that Tregs are positively correlated with M2 macrophages, and when they highly infiltrate tumor tissue, they usually indicate a poor prognosis. Research by Sun (34) and Tiemessen (35) also found that Tregs can promote the differentiation of monocytes into M2 macrophages. These studies typically analyzed all tumor samples uniformly without distinguishing their mismatch repair status. On the other hand, Michel et al. (36) found that the infiltrating levels of CD8+T cells and Foxp3+Tregs in MSI-H colorectal cancer were significantly higher than those in microsatellite stable (MSS) colorectal cancer and the two cell types were positively correlated. They believed that microsatellite status also affects the density of infiltrating Tregs. Asaka et al. (37) also found that dMMR EC and PD-L1 positive EC had higher levels of CD8+T cells, Fxop3+Tregs, PD-1+ immune cells and PD-L1+ immune cells than mismatch repair proficient (pMMR) EC or PD-L1 negative EC, and they suggested that in addition to MMR status, PD-L1 was also associated with T cell-inflamed phenotype. Spranger (38) found that CD8+T cells induce the expression of PD-L1 in tumor tissues by secreting IFN-r. On the other hand, CD8+T cells can induce in situ proliferation of Tregs, which can also recruit Tregs into the tumor by secreting CCL22 and binding with CCR4 on the surface of Tregs. The two mechanisms work together to increase the infiltration level of Tregs in tumors. In conclusion, we speculated that there are three possible reasons for the same trend of Treg infiltration as CD8+T cells but opposite to M2 macrophages in our study. One is that MSH6, as a mismatch repair protein, affects the infiltration of Tregs. Second, given the inverse correlation between MSH6 and CD8+T cell infiltration, MSH6 low-expression tumors have a high degree of CD8+T cell infiltration, and these highly infiltrated CD8+T cells recruit Tregs to tumors by inducing in situ proliferation of Tregs or by secreting cytokines. Third, PD-L1 expression was increased in tumors with low MSH6 expression, and these highly expressed PD-L1 may also affect Tregs infiltration.
As a responder to DNA damage, the mismatch repair system plays an important role in maintaining genome stability and preventing tumorigenesis. Many studies have found that the overexpression of core genes of the mismatch repair system is related to the occurrence of various tumors. Chen et al. (39) demonstrated that MSH6 was an overexpressed oncogene in human glioblastoma multiforme tissues that can promote gliomagenesis. In studies about prostate cancer, oral squamous cell carcinoma and melanoma, the overexpression of MMR proteins was associated with poor prognosis (27–29). Lemetre (40) and Berg (41), respectively, used the TCGA database and their own endometrial cancer samples to analyze and found that MSH6 was an independent prognostic marker, and patients with low expression of MSH6 had better survival outcomes. Our results were consistent with their findings. Given the high mutation rate of MSH6 in endometrial cancer, we not only conducted analysis in unclassified tumor samples but also innovatively verified the results in the remaining MSH6 wild-type tumor samples after removing those with MSH6 mutants and obtained consistent results with them. Furthermore, to our knowledge, we are the only study that analyzed the relationship between MSH6, immune infiltration and ICIs treatment responsiveness in endometrial cancer. Previous studies primarily compared pMMR tumors with dMMR tumors or between dMMR tumors caused by MLH1 promoter hypermethylation(MLH1-PHM) or MMR-related gene mutation. For example, Kaneko (42) suggested that dMMR ECs with MLH1- PHM had a worse prognosis than pMMR ECs and Lynch syndrome (LS) associated dMMR ECs (dMMR ECs without MLH1-PHM); Sloan (43) found that the expression of PD-L1 was the highest in LS-associated dMMR ECs, followed by dMMR ECs with MLH1-PHM and finally pMMR ECs. Moreover, the MMR immunohistochemical staining pattern most consistent with PD-L1 expression was MSH6 expression loss. They hypothesized which MMR protein defect was the most important variable regulating PD-L1 expression in tumors, regardless of whether it undergoes germline or somatic deficiency. We lack information on the correlation between different involved MMR genes (MLH1, MSH2, MSH6, or PMS2) and the prognosis and ICIs reactivity in EC. We supplemented this for the first time and confirmed that MSH6 is closely associated with prognosis, immune infiltration, immune checkpoint expression and ICIs reactivity in EC. In 2021, by constructing dMLH1 tumor cells and mouse dMLH1 tumor models, Lu et al. (44). demonstrated that deletion of MLH1 expression improves tumor infiltration of CD8+ T cells and enhances ICIs reactivity by promoting cytoplasmic DNA aggregation and activating cGAS- STRING pathway. These also suggested that MMR genes themselves were related to immune infiltration and ICIs reactivity.
The limitation of this study is the lack of our own clinical samples of endometrial cancer to validate the results, especially the need to verify the relationship between MSH6 and immune infiltration, immune checkpoint expression and ICIs treatment responsiveness. Immune checkpoint inhibitors are not routinely used in patients with endometrial cancer. Only some advanced or relapsed patients with multiple drug resistance choose to receive ICIs treatment. More time is needed to collect sufficient sample size. Understanding the communication between tumor cells and immune cells and their response to ICIs is important to guide drug administration and elucidate the mechanism of drug resistance. Single-cell NRA sequencing (sc-RNA-seq), as a powerful technique, can be used to explore the heterogeneous cellular, molecular characteristics, and intercellular communication within tumors (45). It can also be used to identify key cell types, genes, regulons and pathways with pro-tumor and antitumor potential, guiding us to explore the mechanisms related to response and resistance to ICIs treatment and biomarkers with predictive significance (46). In the future, it is necessary to collect clinical samples of endometrial cancer or construct mouse models to explore the relationship between different MMR genes, especially MSH6, and immune infiltration and ICIs response by using sc-RNA-seq or distinguish the cellular and molecular characteristics of different MMR deficiency patterns to find the cause for primary or secondary resistance of dMMR EC to ICIs treatment.
5 Conclusions
In conclusion, we confirmed that the expression of MSH6 was inversely correlated with the prognosis, immune score, immune infiltration, immune checkpoint expression and ICIs response of EC. MSH6 is anticipated to be a viable biomarker for predicting prognosis, immune status, immune checkpoint expression and perhaps the response to immunotherapy in EC patients. This study also points out new directions for potential drug development. Pharmacists can develop inhibitors that target the MMR genes, especially MSH6. These drugs may be used to treat refractory or metastatic advanced MSS/pMMR solid tumors, or they can be combined with ICIs to improve their reactivity in MSI-H/dMMR solid tumors. In addition, given that the infiltration trend of Tregs was similar to that of CD8 + T cells, we speculated that combining Tregs-targeted therapy and ICIs may improve patient reactivity and prognosis in the presence of a preexisting T cell-inflamed tumor microenvironment.
Data availability statement
The datasets presented in this study can be found in online repositories. The names of the repository/repositories and accession number(s) can be found in the article/Supplementary Material.
Ethics statement
Ethical approval was not required for the studies on humans in accordance with the local legislation and institutional requirements because only commercially available established cell lines were used. Ethical approval was not required for the studies on animals in accordance with the local legislation and institutional requirements because only commercially available established cell lines were used.
Author contributions
L-ZZ: Writing – original draft, Conceptualization, Data curation, Formal analysis, Methodology, Software, Validation, Visualization, Writing – review & editing. H-QX: Conceptualization, Methodology, Project administration, Supervision, Writing – review & editing. JC: Conceptualization, Funding acquisition, Project administration, Resources, Supervision, Writing – review & editing.
Funding
The author(s) declare financial support was received for the research, authorship, and/or publication of this article. This work was supported by the Beijing Cancer Prevention & Treatment Society (IZXUEYANZI2019-1003).
Conflict of interest
The authors declare that the research was conducted in the absence of any commercial or financial relationships that could be construed as a potential conflict of interest.
Publisher’s note
All claims expressed in this article are solely those of the authors and do not necessarily represent those of their affiliated organizations, or those of the publisher, the editors and the reviewers. Any product that may be evaluated in this article, or claim that may be made by its manufacturer, is not guaranteed or endorsed by the publisher.
Supplementary material
The Supplementary Material for this article can be found online at: https://www.frontiersin.org/articles/10.3389/fimmu.2024.1302797/full#supplementary-material
Supplementary Figure 1 | MSH2 and MSH6, but not MLH1 and PMS2, related to the DSS and DFS of EC patients. The DSS and DFS curves of the low expression groups of MSH2 (A) and MSH6 (B) were significantly higher than those of their high expression groups, while there was no significant difference between the high and low expression groups of MLH1 (C) and PMS2 (D). DSS, Disease Specific Survival; DFS, Disease Free Survival; EC, endometrial cancer.
Supplementary Figure 2 | Relationship between MMR genes and clinicopathological features of EC. Compared with patients with low expression of MSH2 and MSH6, patients with high expression of MSH2 and MSH6 had higher stage and grade, more serous carcinoma, and higher incidence of lymph node metastasis (A, B), while MLH1 and PMS2 expression were independent of most these clinicopathological features (C, D).
Supplementary Figure 3 | Validation of the relationship between MSH6 and the expression of PD-L1 and PD-L2 in HEC-1B cells. Verify the knockdown and overexpression efficiency of MSH6 by RT-qPCR (A, B) and WB in HEC-1B cells (C, D), and analyze the mRNA and protein expression of immune checkpoint related genes after knockdown or overexpression of MSH6. *p < 0.05, **p <0.01.
Supplementary Figure 4 | Validation of the relationship between MSH6 and cell proliferation in HEC-1B cells. The effect of MSH6 knockdown (A, C) or overexpression (B, D) on cell proliferation activity was verified in HEC-1B cells by cell proliferation and clone formation assay. *p < 0.05, **p <0.01.
Supplementary Figure 5 | Validation of the relationship between MSH6 and cell migration and invasion ability in HEC-1B cells. The effect of MSH6 knockdown (A, C) or overexpression (B, D) on cell migration and invasion ability was verified in HEC-1B cells by wound healing and Transwell assay. **p < 0.01, ***p <0.001, ****p < 0.0001.
References
1. Lu KH, Broaddus RR. Endometrial cancer. N Engl J Med (2020) 383:2053–64. doi: 10.1056/NEJMra1514010
2. Lortet-Tieulent J, Ferlay J, Bray F, Jemal A. International patterns and trends in endometrial cancer incidence, 1978-2013. J Natl Cancer Inst (2018) 110:354–61. doi: 10.1093/jnci/djx214
3. Murali R, Soslow RA, Weigelt B. Classification of endometrial carcinoma: more than two types. Lancet Oncol (2014) 15:e268–278. doi: 10.1016/S1470-2045(13)70591-6
4. Cancer Genome Atlas Research N, Kandoth C, Schultz N, Cherniack AD, Akbani R, Liu Y, et al. Integrated genomic characterization of endometrial carcinoma. Nature (2013) 497:67–73. doi: 10.1038/nature12113
5. Talhouk A, McConechy MK, Leung S, Yang W, Lum A, Senz J, et al. Confirmation of ProMisE: A simple, genomics-based clinical classifier for endometrial cancer. Cancer (2017) 123:802–13. doi: 10.1002/cncr.30496
6. Green AK, Feinberg J, Makker V. A review of immune checkpoint blockade therapy in endometrial cancer. Am Soc Clin Oncol Educ Book (2020) 40:1–7. doi: 10.1200/EDBK_280503
7. Deshpande M, Romanski PA, Rosenwaks Z, Gerhard J. Gynecological cancers caused by deficient mismatch repair and microsatellite instability. Cancers (Basel) (2020) 12:3319. doi: 10.3390/cancers12113319
8. Hampel H, Pearlman R, de la Chapelle A, Pritchard CC, Zhao W, Jones D, et al. Double somatic mismatch repair gene pathogenic variants as common as Lynch syndrome among endometrial cancer patients. Gynecol Oncol (2021) 160:161–8. doi: 10.1016/j.ygyno.2020.10.012
9. Ding L, Chen F. Predicting tumor response to PD-1 blockade. N Engl J Med (2019) 381:477–9. doi: 10.1056/NEJMcibr1906340
10. Howitt BE, Shukla SA, Sholl LM, Ritterhouse LL, Watkins JC, Rodig S, et al. Association of polymerase e-mutated and microsatellite-instable endometrial cancers with neoantigen load, number of tumor-infiltrating lymphocytes, and expression of PD-1 and PD-L1. JAMA Oncol (2015) 1:1319–23. doi: 10.1001/jamaoncol.2015.2151
11. Le DT, Durham JN, Smith KN, Wang H, Bartlett BR, Aulakh LK, et al. Mismatch repair deficiency predicts response of solid tumors to PD-1 blockade. Science (2017) 357:409–13. doi: 10.1126/science.aan6733
12. Seiwert TY, Burtness B, Mehra R, Weiss J, Berger R, Eder JP, et al. Safety and clinical activity of pembrolizumab for treatment of recurrent or metastatic squamous cell carcinoma of the head and neck (KEYNOTE-012): an open-label, multicentre, phase 1b trial. Lancet Oncol (2016) 17:956–65. doi: 10.1016/S1470-2045(16)30066-3
13. Ott PA, Bang YJ, Berton-Rigaud D, Elez E, Pishvaian MJ, Rugo HS, et al. Safety and antitumor activity of pembrolizumab in advanced programmed death ligand 1-positive endometrial cancer: results from the KEYNOTE-028 study. J Clin Oncol (2017) 35:2535–41. doi: 10.1200/JCO.2017.72.5952
14. Lemery S, Keegan P, Pazdur R. First FDA approval agnostic of cancer site - when a biomarker defines the indication. N Engl J Med (2017) 377:1409–12. doi: 10.1056/NEJMp1709968
15. Abu-Rustum NR, Yashar CM, Bradley K, Campos SM, Chino J, Chon HS, et al. NCCN guidelines(R) insights: uterine neoplasms, version 3.2021. J Natl Compr Canc Netw (2021) 19:888–95. doi: 10.6004/jnccn.2021.0038
16. Muenst S, Soysal SD, Tzankov A, Hoeller S. The PD-1/PD-L1 pathway: biological background and clinical relevance of an emerging treatment target in immunotherapy. Expert Opin Ther Targets (2015) 19:201–11. doi: 10.1517/14728222.2014.980235
17. Zou W, Wolchok JD, Chen L. PD-L1 (B7-H1) and PD-1 pathway blockade for cancer therapy: Mechanisms, response biomarkers, and combinations. Sci Transl Med (2016) 8:328rv324. doi: 10.1126/scitranslmed.aad7118
18. Antill Y, Kok PS, Robledo K, Yip S, Cummins M, Smith D, et al. Clinical activity of durvalumab for patients with advanced mismatch repair-deficient and repair-proficient endometrial cancer. A nonrandomized phase 2 clinical trial. J Immunother Cancer (2021) 9:e002255. doi: 10.1136/jitc-2020-002255
19. Schlauc D, Fu X, Jones SF, Burris HA 3rd, Spigel DR, Reeves J, et al. Tumor-specific and tumor-agnostic molecular signatures associated with response to immune checkpoint inhibitors. JCO Precis Oncol (2021) 5(2021):1625–38. doi: 10.1200/PO.21
20. Lagos GG, Izar B, Rizvi NA. Beyond tumor PD-L1: emerging genomic biomarkers for checkpoint inhibitor immunotherapy. Am Soc Clin Oncol Educ Book (2020) 40:1–11. doi: 10.1200/EDBK_289967
21. Tomczak K, Czerwinska P, Wiznerowicz M. The Cancer Genome Atlas (TCGA): an immeasurable source of knowledge. Contemp Oncol (Pozn) (2015) 19:A68–77. doi: 10.5114/wo.2014.47136
22. Wang D, Peng L, Hua L, Li J, Liu Y, Zhou Y. Mapk14 is a prognostic biomarker and correlates with the clinicopathological features and immune infiltration of colorectal cancer. Front Cell Dev Biol (2022) 10:817800. doi: 10.3389/fcell.2022.817800
23. Xu H, Xu Q, Yin L. Prognostic value of tumor immune cell infiltration patterns in colon adenocarcinoma based on systematic bioinformatics analysis. Cancer Cell Int (2021) 21:344. doi: 10.1186/s12935-021-02048-x
24. Mei J, Xing Y, Lv J, Gu D, Pan J, Zhang Y, et al. Construction of an immune-related gene signature for prediction of prognosis in patients with cervical cancer. Int Immunopharmacol (2020) 88:106882. doi: 10.1016/j.intimp.2020.106882
25. Li GM. Mechanisms and functions of DNA mismatch repair. Cell Res (2008) 18:85–98. doi: 10.1038/cr.2007.115
26. Yang G, Scherer SJ, Shell SS, Yang K, Kim M, Lipkin M, et al. Dominant effects of an Msh6 missense mutation on DNA repair and cancer susceptibility. Cancer Cell (2004) 6:139–50. doi: 10.1016/j.ccr.2004.06.024
27. Wilczak W, Rashed S, Hube-Magg C, Kluth M, Simon R, Buscheck F, et al. Up-regulation of mismatch repair genes MSH6, PMS2 and MLH1 parallels development of genetic instability and is linked to tumor aggressiveness and early PSA recurrence in prostate cancer. Carcinogenesis (2017) 38:19–27. doi: 10.1093/carcin/bgw116
28. Wagner VP, Webber LP, Salvadori G, Meurer L, Fonseca FP, Castilho RM, et al. Overexpression of mutSalpha complex proteins predicts poor prognosis in oral squamous cell carcinoma. Med (Baltimore) (2016) 95:e3725. doi: 10.1097/MD.0000000000003725
29. Alvino E, Passarelli F, Cannavo E, Fortes C, Mastroeni S, Caporali S, et al. High expression of the mismatch repair protein MSH6 is associated with poor patient survival in melanoma. Am J Clin Pathol (2014) 142:121–32. doi: 10.1309/AJCPCX2D9YULBBLG
30. Knijnenburg TA, Wang L, Zimmermann MT, Chambwe N, Gao GF, Cherniack AD, et al. Genomic and molecular landscape of DNA damage repair deficiency across the cancer genome atlas. Cell Rep (2018) 23:239–254 e236. doi: 10.1016/j.celrep.2018.03.076
31. Aliyah SH, Ardiyan YN, Mardhiyah I, Herdini C, Dwianingsih EK, Aning S, et al. The distribution of M2 macrophage and treg in nasopharyngeal carcinoma tumor tissue and the correlation with TNM status and clinical stage. Asian Pac J Cancer Prev (2021) 22:3447–53. doi: 10.31557/APJCP.2021.22.11.3447
32. Chen Y, Gao Y, Ma X, Wang Y, Liu J, Yang C, et al. A study on the correlation between M2 macrophages and regulatory T cells in the progression of colorectal cancer. Int J Biol Markers (2022) 37:412–20. doi: 10.1177/03936155221132572
33. Erlandsson A, Carlsson J, Lundholm M, Falt A, Andersson SO, Andren O, et al. M2 macrophages and regulatory T cells in lethal prostate cancer. Prostate (2019) 79:363–9. doi: 10.1002/pros.23742
34. Sun W, Wei FQ, Li WJ, Wei JW, Zhong H, Wen YH, et al. A positive-feedback loop between tumour infiltrating activated Treg cells and type 2-skewed macrophages is essential for progression of laryngeal squamous cell carcinoma. Br J Cancer (2017) 117:1631–43. doi: 10.1038/bjc.2017.329
35. Tiemessen MM, Jagger AL, Evans HG, van Herwijnen MJ, John S, Taams LS, et al. CD4+CD25+Foxp3+ regulatory T cells induce alternative activation of human monocytes/macrophages. Proc Natl Acad Sci USA (2007) 104:19446–51. doi: 10.1073/pnas.0706832104
36. Michel S, Benner A, Tariverdian M, Wentzensen N, Hoefler P, Pommerenck T, et al. High density of FOXP3-positive T cells infiltrating colorectal cancers with microsatellite instability. Br J Cancer (2008) 99:1867–73. doi: 10.1038/sj.bjc.6604756
37. Asaka S, Yen TT, Wang TL, Shih IM, Gaillard S. T cell-inflamed phenotype and increased Foxp3 expression in infiltrating T-cells of mismatch-repair deficient endometrial cancers. Mod Pathol (2019) 32:576–84. doi: 10.1038/s41379-018-0172-x
38. Spranger S, Spaapen RM, Zha Y, Williams J, Meng Y, Ha TT, et al. Up-regulation of PD-L1, IDO, and T(regs) in the melanoma tumor microenvironment is driven by CD8(+) T cells. Sci Transl Med (2013) 5:200ra116. doi: 10.1126/scitranslmed.3006504
39. Chen Y, Liu P, Sun P, Jiang J, Zhu Y, Dong T, et al. Oncogenic MSH6-CXCR4-TGFB1 feedback loop: A novel therapeutic target of photothermal therapy in glioblastoma multiforme. Theranostics (2019) 9:1453–73. doi: 10.7150/thno.29987
40. Lemetre C, Vieites B, Ng CK, Piscuoglio S, Schultheis AM, Marchio C, et al. RNASeq analysis reveals biological processes governing the clinical behaviour of endometrioid and serous endometrial cancers. Eur J Cancer (2016) 64:149–58. doi: 10.1016/j.ejca.2016.05.028
41. Berg HF, Engerud H, Myrvold M, Lien HE, Hjelmeland ME, Halle MK, et al. Mismatch repair markers in preoperative and operative endometrial cancer samples; expression concordance and prognostic value. Br J Cancer (2023) 128:647–55. doi: 10.1038/s41416-022-02063-3
42. Kaneko E, Sato N, Sugawara T, Noto A, Takahashi K, Makino K, et al. MLH1 promoter hypermethylation predicts poorer prognosis in mismatch repair deficiency endometrial carcinomas. J Gynecol Oncol (2021) 32:e79. doi: 10.3802/jgo.2021.32.e79
43. Sloan EA, Ring KL, Willis BC, Modesitt SC, Mills AM. PD-L1 expression in mismatch repair-deficient endometrial carcinomas, including lynch syndrome-associated and MLH1 promoter hypermethylated tumors. Am J Surg Pathol (2017) 41:326–33. doi: 10.1097/PAS.0000000000000783
44. Lu C, Guan J, Lu S, Jin Q, Rousseau B, Lu T, et al. DNA sensing in mismatch repair-deficient tumor cells is essential for antitumor immunity. Cancer Cell (2021) 39:96–108 e106. doi: 10.1016/j.ccell.2020.11.006
45. Liu C, Zhang M, Yan X, Ni Y, Gong Y, Wang C, et al. Single-cell dissection of cellular and molecular features underlying human cervical squamous cell carcinoma initiation and progression. Sci Adv (2023) 9:eadd8977. doi: 10.1126/sciadv.add8977
Keywords: endometrial cancer, mismatch repair, immune infiltration, immune checkpoint, immune checkpoint inhibiter, prognosis, MSH6
Citation: Zhou L-Z, Xiao H-Q and Chen J (2024) Mismatch repair gene MSH6 correlates with the prognosis, immune status and immune checkpoint inhibitors response of endometrial cancer. Front. Immunol. 15:1302797. doi: 10.3389/fimmu.2024.1302797
Received: 27 September 2023; Accepted: 22 January 2024;
Published: 08 February 2024.
Edited by:
Chao Liu, Shandong Cancer Hospital, ChinaReviewed by:
Xiaohui Li, Shandong Cancer Hospital, ChinaQingyu Huang, Shandong First Medical University and Shandong Academy of Medical Sciences, China
Copyright © 2024 Zhou, Xiao and Chen. This is an open-access article distributed under the terms of the Creative Commons Attribution License (CC BY). The use, distribution or reproduction in other forums is permitted, provided the original author(s) and the copyright owner(s) are credited and that the original publication in this journal is cited, in accordance with accepted academic practice. No use, distribution or reproduction is permitted which does not comply with these terms.
*Correspondence: Jie Chen, cj2365255@126.com