 Mingjia Li1,2,3,4,5,6†
 Xinrui Long1,2,3,4,5†Wenbo Bu7†
 Guanxiong Zhang1,2,3,4,5
 Guangtong Deng1,2,3,4,5Yuancheng Liu1,2,3,4,5
 Juan Su1,2,3,4,5
 Kai Huang1,2,3,4,5*
- 1Department of Dermatology, Xiangya Hospital, Central South University, Changsha, China
- 2National Engineering Research Center of Personalized Diagnostic and Therapeutic Technology, Changsha, China
- 3Hunan Engineering Research Center of Skin Health and Disease, Central South University, Changsha, China
- 4Hunan Key Laboratory of Skin Cancer and Psoriasis, Xiangya Hospital, Central South University, Changsha, China
- 5National Clinical Research Center for Geriatric Disorders, Xiangya Hospital, Central South University, Changsha, China
- 6Department of Dermatology, Peking University First Hospital, Peking University, Beijing, China
- 7Department of Dermatological Surgery, Hospital for Skin Diseases, Institute of Dermatology, Chinese Academy of Medical Sciences, Peking Union Medical College, Nanjing, China
Background: Melanoma is among the most malignant immunologic tumor types and is associated with high mortality. However, a considerable number of melanoma patients cannot benefit from immunotherapy owing to individual differences. This study attempts to build a novel prediction model of melanoma that fully considers individual differences in the tumor microenvironment.
Methods: An immune-related risk score (IRRS) was constructed based on cutaneous melanoma data from The Cancer Genome Atlas (TCGA). Single-sample gene set enrichment analysis (ssGSEA) was used to calculate immune enrichment scores of 28 immune cell signatures. We performed pairwise comparisons to obtain scores for cell pairs based on the difference in the abundance of immune cells within each sample. The resulting cell pair scores, in the form of a matrix of relative values of immune cells, formed the core of the IRRS.
Results: The area under the curve (AUC) for the IRRS was over 0.700, and when the IRRS was combined with clinical information, the AUC reached 0.785, 0.817, and 0.801 for the 1-, 3-, and 5-year survival, respectively. Differentially expressed genes between the two groups were enriched in staphylococcal infection and estrogen metabolism pathway. The low IRRS group showed a better immunotherapeutic response and exhibited more neoantigens, richer T-cell receptor and B-cell receptor diversity, and higher tumor mutation burden.
Conclusion: The IRRS enables a good prediction of prognosis and immunotherapy effect, based on the difference in the relative abundance of different types of infiltrating immune cells, and could provide support for further research in melanoma.
Introduction
Cutaneous melanoma is a highly malignant tumor derived from melanocytes and is the most invasive and complex of all skin cancers (1). In 2020, the total number of new melanoma cases in the world was 325,000 with 57,000 deaths; these numbers are predicted to increase to 510,000 new cases with 96,000 deaths by 2040 (2). The occurrence of melanoma is caused by interactions between genetic susceptibility and environmental exposure (3), that is, an accumulation of genomic changes, including the mutation burden driven by high-intensity ultraviolet light and prolonged exposure to ultraviolet, which makes melanoma the most immunogenic tumor type with the ability to induce an immune response that can inhibit melanoma growth (4, 5). Immune checkpoint inhibitors, whose main targets are programmed cell death protein 1 (PD1), programmed cell death 1 ligand 1 (PDL1), and cytotoxic T-lymphocyte-associated protein 4 (CTLA-4), have been successfully used in the treatment of melanoma. The total effective rate of immune checkpoint inhibitors in patients with advanced melanoma is 32.9%–58.0% (6). However, only a third of melanoma patients show a durable response to immune checkpoint therapies (7). Biomarkers for the prediction of prognosis and immunotherapy effect in melanoma patients remain elusive. However, previous studies have shown that cytotoxic T lymphocyte (CTL) dysfunction and exhaustion result in lower response and sensitivity to immunotherapy (8). This means that the immune microenvironment is closely related to the effectiveness of immune checkpoint inhibitors.
Tumor-infiltrating immune cells (TIICs), including T cells, B cells, macrophages, and natural killer cells, form an important component of most solid tumors and have an essential role in the host antitumor immune response, which can affect tumor progression via antitumor activity or immunosuppression (9, 10). During the process of tumor development, including elimination, balance, and escape, the dual function and plasticity of TIICs lead to complexity and changes in the antitumor response (11, 12). For example, in many tumor types, patients with high levels of CD8+ T-cell infiltration tend to have a better prognosis. On the contrary, patients with obvious infiltration of immunosuppressive cells, such as regulatory T cells, tend to have a worse prognosis. Therefore, the quantity and quality of TIICs are key determinants of prognosis (9). The value of TIICs in prognosis prediction and drug resistance analysis has been verified in a variety of tumors, including melanoma (7, 13–15). The American Joint Committee on Cancer (AJCC) guidelines are widely used to evaluate the prognosis of melanoma patients. However, TNM staging mainly describes the invasion and metastasis of tumor tissue at the pathological level, which cannot take into account the composition of tumor-infiltrating cells in the immune microenvironment. Although there are many prognostic models that incorporate immune gene expression, few studies have constructed prognostic models directly based on TIICs. This may be because of the different methods used for determining the specific content of infiltrating cells, which are affected by various measurement factors such that it is difficult to establish a unified standard.
In this study, we develop a prognostic prediction model for melanoma based on TIICs. We adopt the relative value of cell fraction to form a cell pair algorithm. In addition, we present an online nomogram, of which the IRRS is the core, including clinical indicators, to facilitate the use of the IRRS by clinicians.
Materials and methods
Study design and data collection
The integrated research design is presented in Figure 1. Transcription profiles and clinical data of cutaneous melanoma patients were obtained from The Cancer Genome Atlas (TCGA; https://portal.gdc.cancer.gov/; TCGA-SKCM cohort). After removing cases with duplication, lack of expression profiles, or lack of survival data, the data of 458 patients were included in the training group for the construction of the IRRS score. The GSE65904, GSE54467, GSE91061, and GSE115821 datasets from the Gene Expression Omnibus (GEO) (https://www.ncbi.nlm.nih.gov/geo/) and a cohort from Liu et al. were used as testing sets for validation (16–20). Missing values in the clinical or pathological data of patients were filled using the missForest package (21–28).
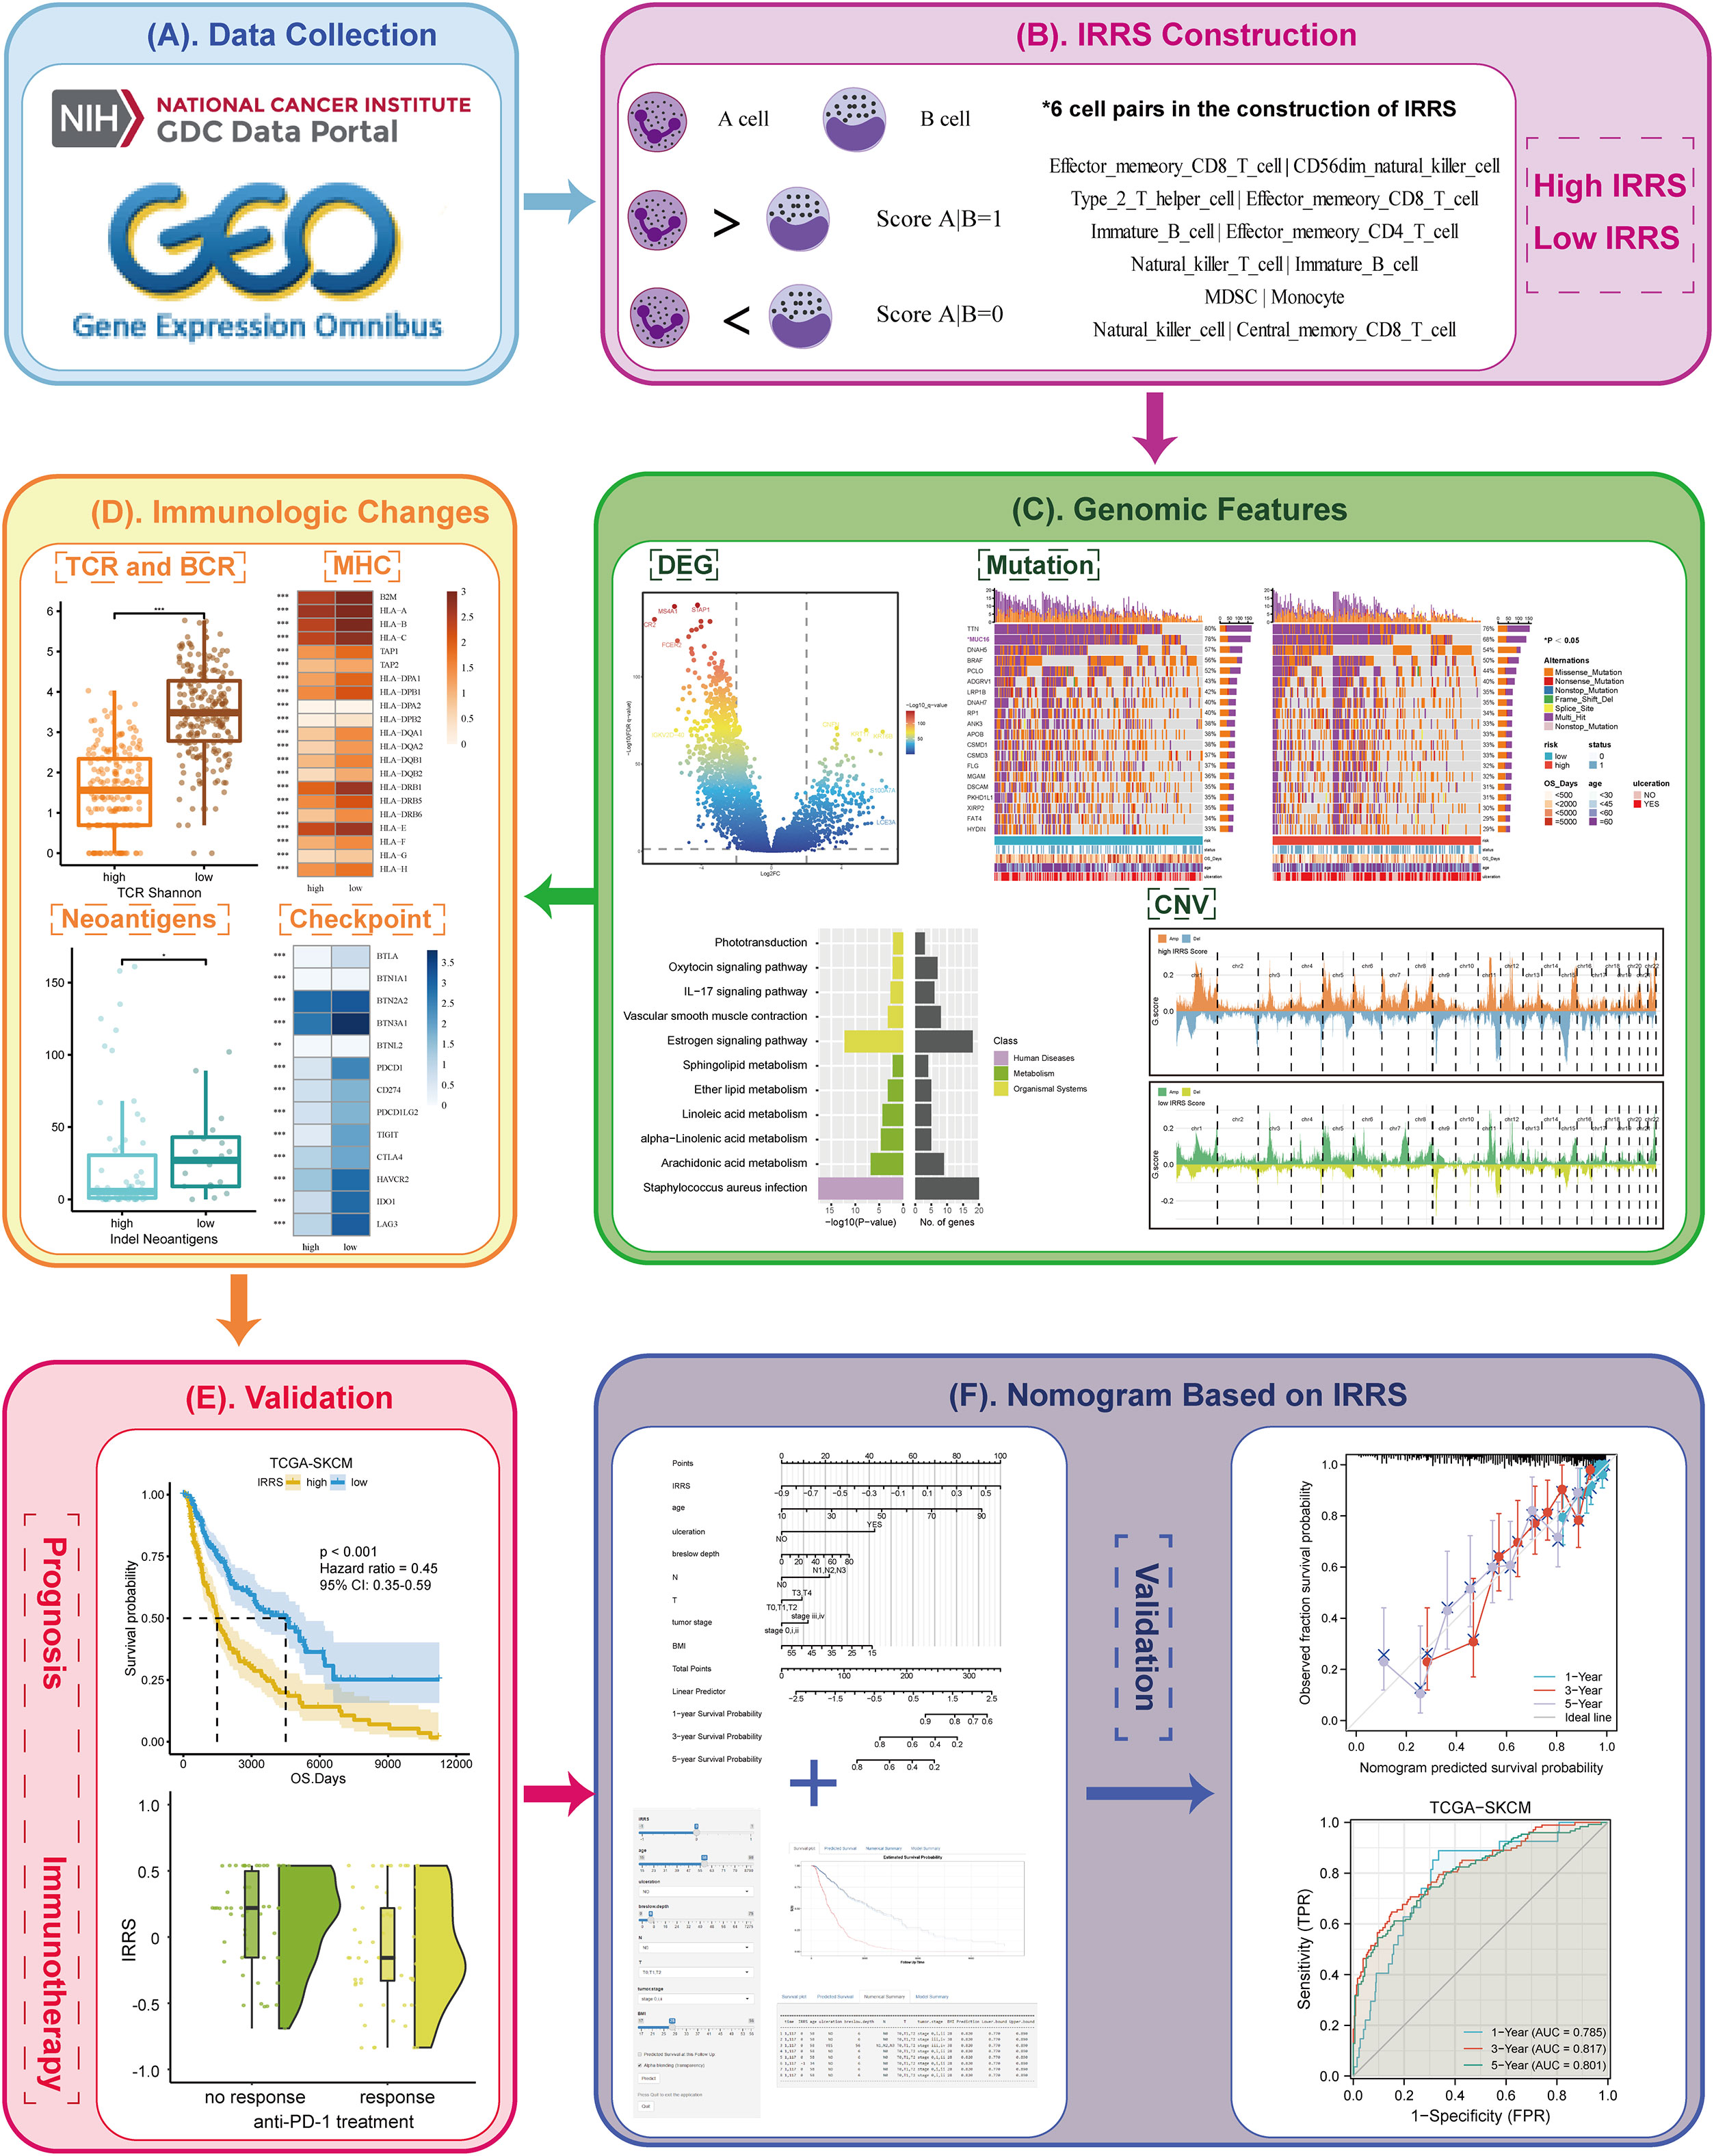
Figure 1 Overview of the workflow. (A) The data of this study were from The Cancer Genome Atlas (TCGA) and GEO cohorts. (B) The immune-related risk score (IRRS) was constructed by the relative value of cell abundance, that is, cell pairs. (C) Discovered the difference in the genomic features between the high and low IRRS through DEG, mutation, and CNV. (D) Immunologic changes based on the IRRS was analyzed by the TCR and BCR, MHC, neoantigens, and checkpoints. (E) The prognosis and immunotherapy predictive effects were confirmed. (F) A nomogram based on the IRRS was constructed and validated.
Establishment and validation of the cell pair algorithm
We carried out single-sample gene set enrichment analysis (ssGSEA) to analyze the expression of corresponding markers of 28 immune cell types (29), thereby obtaining the abundance of these cell types in patient tumor tissues. Then, the cells related to prognosis were screened by univariate Cox (uni-Cox) regression (P< 0.05).
The prognosis-related immune cells were termed A cells, and the A cells were paired with all 28 immune cells (termed B cells) in turn to form a set of A|B pairs. If the A-cell abundance exceeded the B-cell abundance for a given cell pair, the value of that pair was recorded as 1; otherwise, it was recorded as 0. This method enables the relative cell abundance to be considered without dependence on the absolute number; this avoids the variation caused by the use of different methods for gene measurement and annotation and differential cell abundance analysis. A matrix containing values of 0 or 1 was constructed, from which cell pairs with 0 or 1 accounting for more than 80% of the total were removed. In the human body, the content of some immune cells is much higher than that of other immune cells, such as neutrophils. The remaining cell pairs were screened by uni-Cox regression analysis (P< 0.05) to obtain those correlated with prognosis. We applied the least absolute shrinkage and selection operator (LASSO) Cox regression analysis (glmnet package) to avoid overfitting and obtain the remaining cell pairs. Then, each cell pair was assigned the optimal coefficient by multivariate Cox (multi-Cox), and the IRRS was generated as follows:
The receiver operating characteristic (ROC) curves, the Kaplan–Meier survival curves, the GEO datasets, and the cohort from Liu et al. were used to verify the effectiveness of the IRRS in predicting prognosis and immunotherapy effect.
Differentially expressed genes and analysis
The differentially expressed genes between the high and low IRRS groups were analyzed using the DESeq2 package, with threshold |log2 fold change (FC)| ≥2 and Benjamini–Hochberg-adjusted P-value<0.05 (30). Functional enrichment analysis and clustering of the identified biological processes were conducted using the clusterProfiler R package (31).
The main regulator (MR) is a gene located at the hub of a regulatory network that controls a large number of target genes (termed as its regulon). We used the MR4Cancer tool (http://cis.hku.hk/MR4Cancer) to identify potential MRs that could explain the DEGs between the high and low IRRS groups (32). An MR network diagram was drawn using Cytoscape.
Genomic features
We used the maftools package to draw the OncoPrint, and the Fischer test was used to evaluate differences in gene mutation frequency between the two groups (33). The somaticInteractions function in the maftools package was used to accurately evaluate the exclusive occurrence and co-occurrence of mutations in pairwise comparisons of the 25 genes with the highest mutation frequency. The DeconstructSigs package was used to analyze the cosmic mutation signature of each patient (34).
Significant deletion or amplification events in the regions of the genome were investigated with GISTIC 2.0, a revised computational program used to identify somatic copy number alterations (35).
Immunologic changes
T-cell receptor (TCR), B-cell receptor (BCR), and neoantigen data were from the research of Thorsson et al. (36). Tumor immune dysfunction and exclusion (TIDE) score and microsatellite instability (MSI) score were obtained using the official TIDE website (http://tide.dfci.harvard.edu/) (37). The statistical significance of the MSI score was evaluated by Welch’s t-test, and other indexes were evaluated by the Wilcoxon rank-sum test.
Construction and validation of the nomogram model
A nomogram was constructed to predict specific outcomes based on the IRRS and clinical variables using the rms package (38). ROC curves, calibration curves, and decision curve analysis (DCA) curves were drawn to verify the reliability of the nomogram. In addition, the nomogram was compared with the traditional TNM staging system by calculating the integrated discrimination improvement (IDI). Finally, the Dynnom package (cran.r-project.org/web/packages/rms) was used to generate an online version of the nomogram model with an interactive interface for clinical applications.
Results
Construction and validation of the IRRS
A total of 28 immune cell types from 458 melanoma patients (TCGA data) were analyzed. A total of 19 immune cell types related to prognosis were identified by uni-Cox analysis (P< 0.05) (Figure 2A). After pairing, 532 immune cell pairs were screened and entered into LASSO Cox regression analysis, and 11 immune cell pairs were retained (Figures S1, S2).
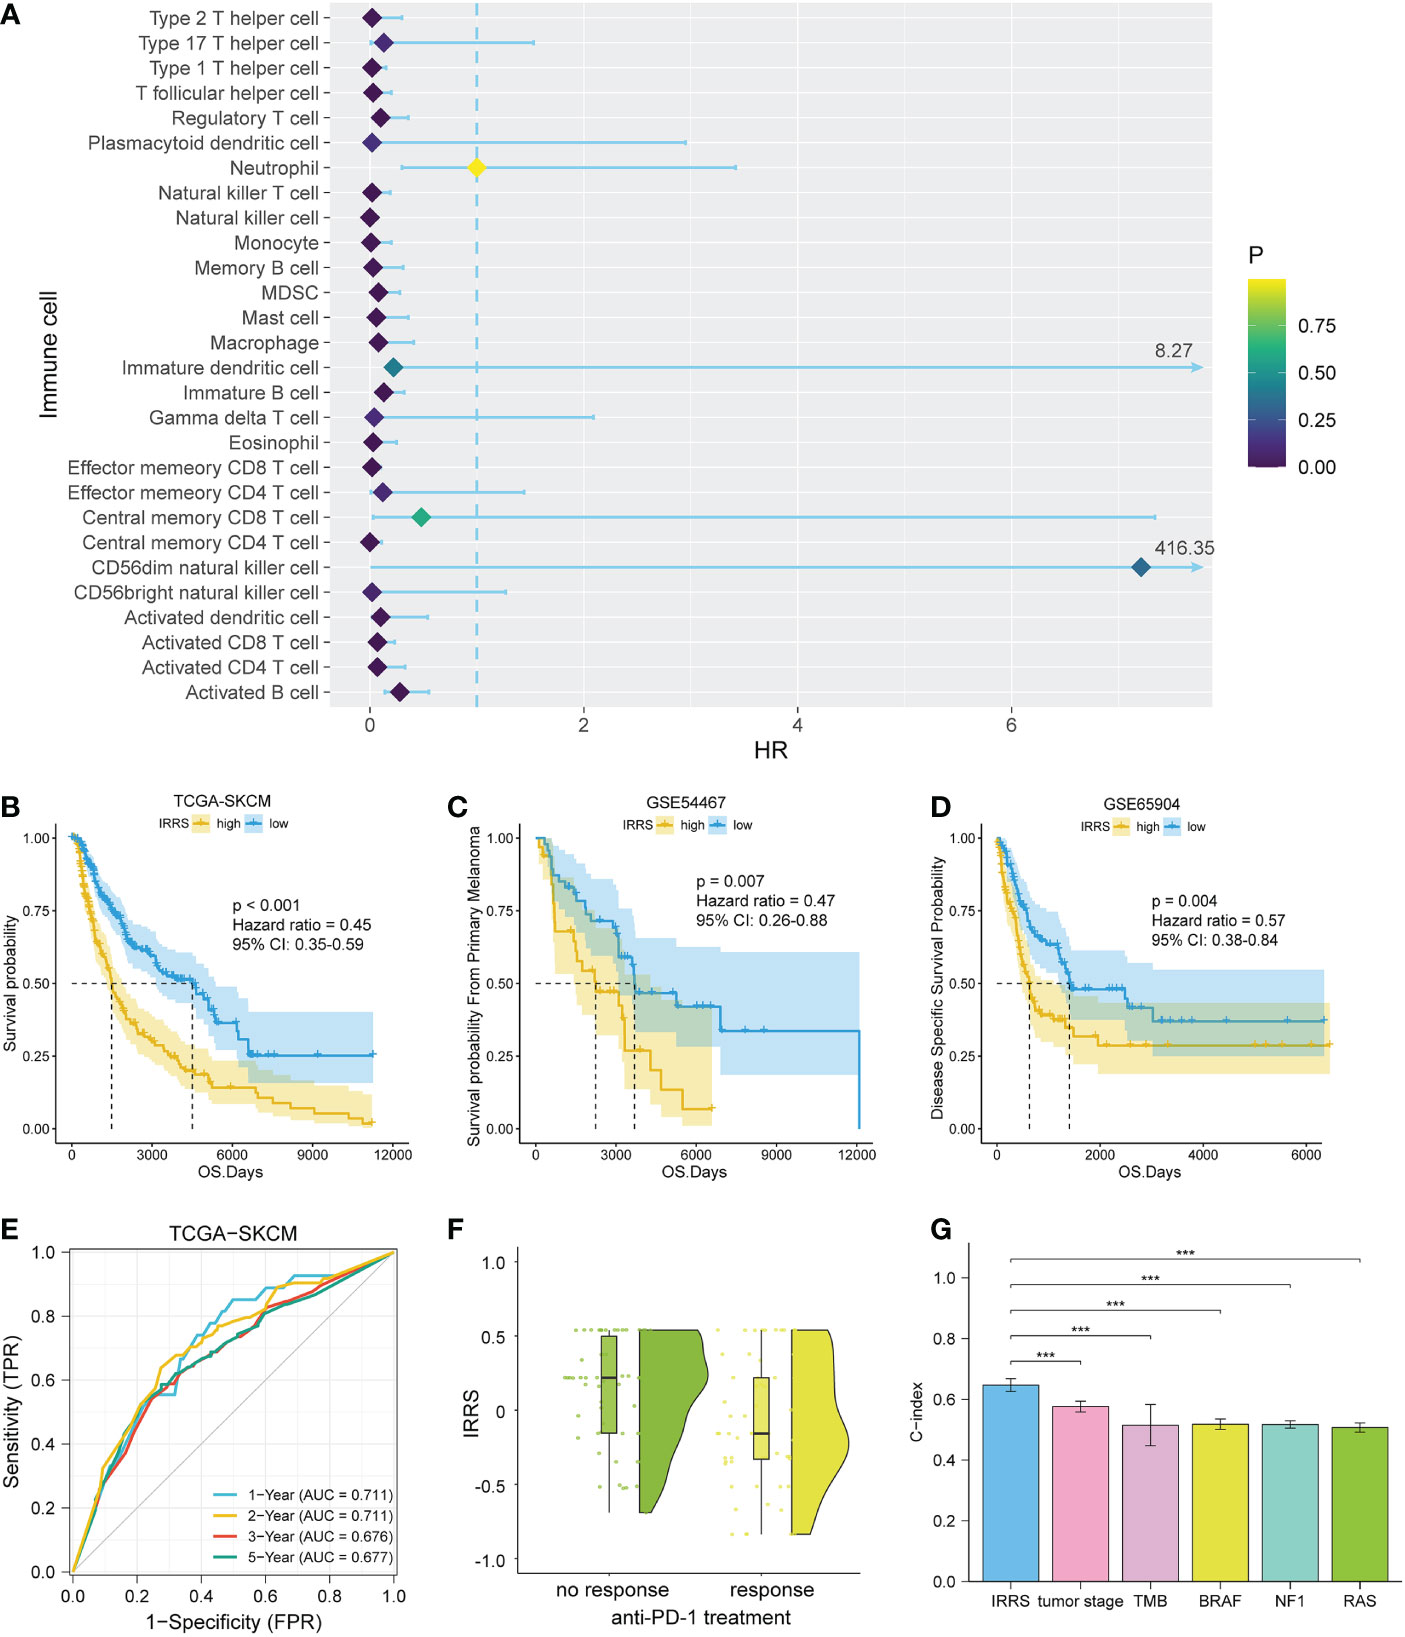
Figure 2 Construction and validation of the IRRS. (A) The 19 candidate cells screened based on uni-Cox analysis. (B–D) The Kaplan–Meier curves of survival probability for patients in the TCGA-SKCM, GSE54467, and GSE65904 cohorts. (E) The ROC curve for patients in the TCGA-SKCM cohort. (F) Comparison of immunotherapeutic responses (P< 0.01) for patients in the GSE91061, GSE115821, and Liu et al. cohorts. (G) Comparison of C-index between the IRRS and tumor stage, TMB, and driver mutations (BRAF, NF1, and RAS) in the TCGA.
We then carried out multi-Cox regression to generate the best coefficients for the corresponding immune cell pairs; only six immune cell pairs were included in the final model (Table 1). Patients with melanoma were classified into high IRRS or low IRRS groups based on the median IRRS score. Compared with patients in the high IRRS group, patients in the low IRRS group had longer overall survival (hazard ratio = 0.45, 95% confidence interval 0.35–0.59, log-rank test P< 0.001). To confirm the predictive effect of the IRRS, an ROC curve analysis was performed; the area under the ROC curve (AUC) values were 0.711, 0.711, 0.676, and 0.677 for the 1-, 2-, 3-, and 5-year survival, respectively (Figures 2B, E).
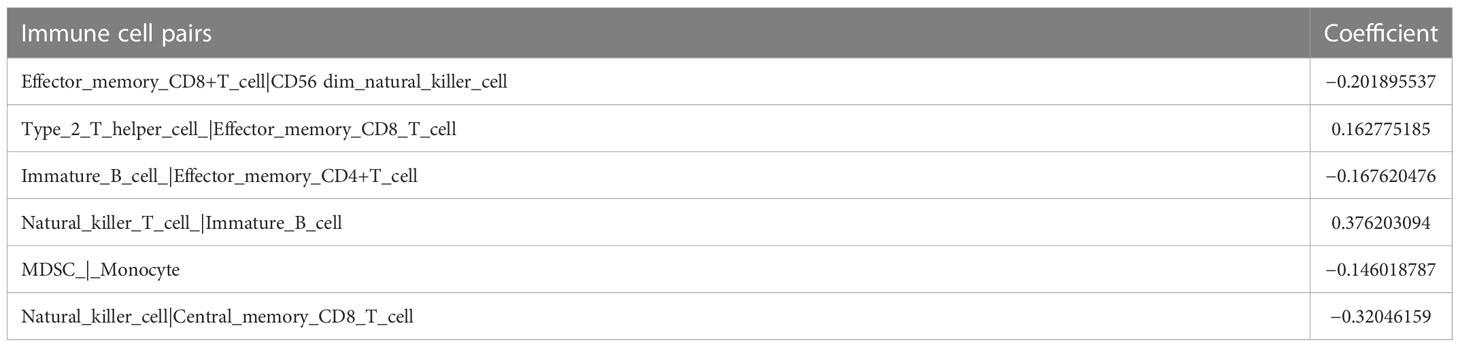
Table 1 The final immune cell pairs and the corresponding coefficient generated by multi-Cox regression.
To further assess the reproducibility and validity of the IRRS, we used external datasets, including GSE65904 and GSE54467, to validate its prognostic value. We also used the median as a group point to plot the Kaplan–Meier curve. Notably, the patients in the high-risk group had shorter overall survival. In addition, in the three anti-PD1 treatment cohorts of GSE91061, GSE115821, and Liu et al., patients with low IRRS exhibited significantly better immunotherapeutic response (P< 0.01) (Figures 2C, D, F).
The independent predictive ability of the IRRS
To estimate whether the IRRS was independent of other clinical or pathological factors of melanoma patients, multi-Cox regression was performed, in which covariables included age, gender, body mass index, ulceration, Breslow depth, Clark level, T stage, N stage, M stage, tumor stage, and the IRRS. Multi-Cox analysis showed that the IRRS, age, and ulceration were independent predictive factors for the prognosis of melanoma patients (Table 2). The C-index of the IRRS was higher than those of the other independent predictive factors (0.647 for the IRRS vs. 0.600 and 0.626 for age and ulceration, respectively). To further confirm the predictive performance of the IRRS, we also compared the C-index values for the IRRS with those for tumor stage, tumor mutation burden (TMB), and driver mutations (BRAF, NF1, and RAS); the results showed that the IRRS had the best predictive effect with respect to prognosis (Figure 2G).
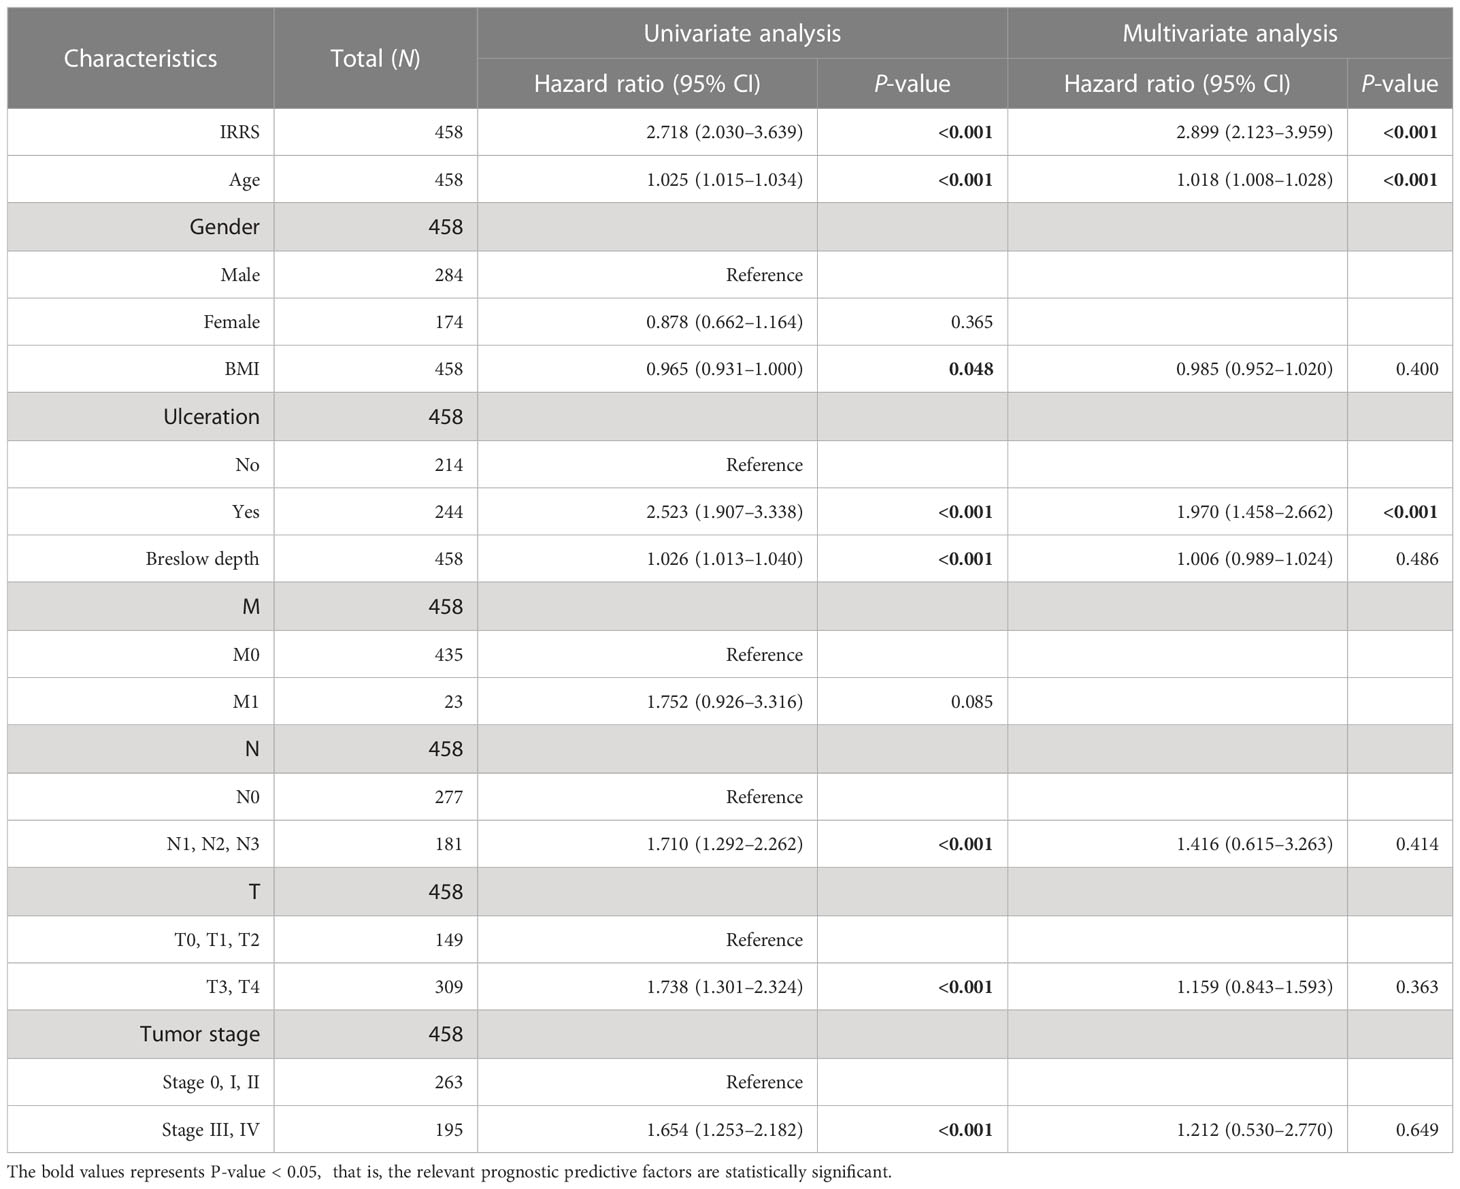
Table 2 Univariable and multivariable Cox regression analyses of the IRRS and survival in the TCGA cohort.
Furthermore, the high IRRS group had significantly worse overall survival than the low IRRS group, regardless of whether the patients were in the early or late TNM stages (Figure 3).
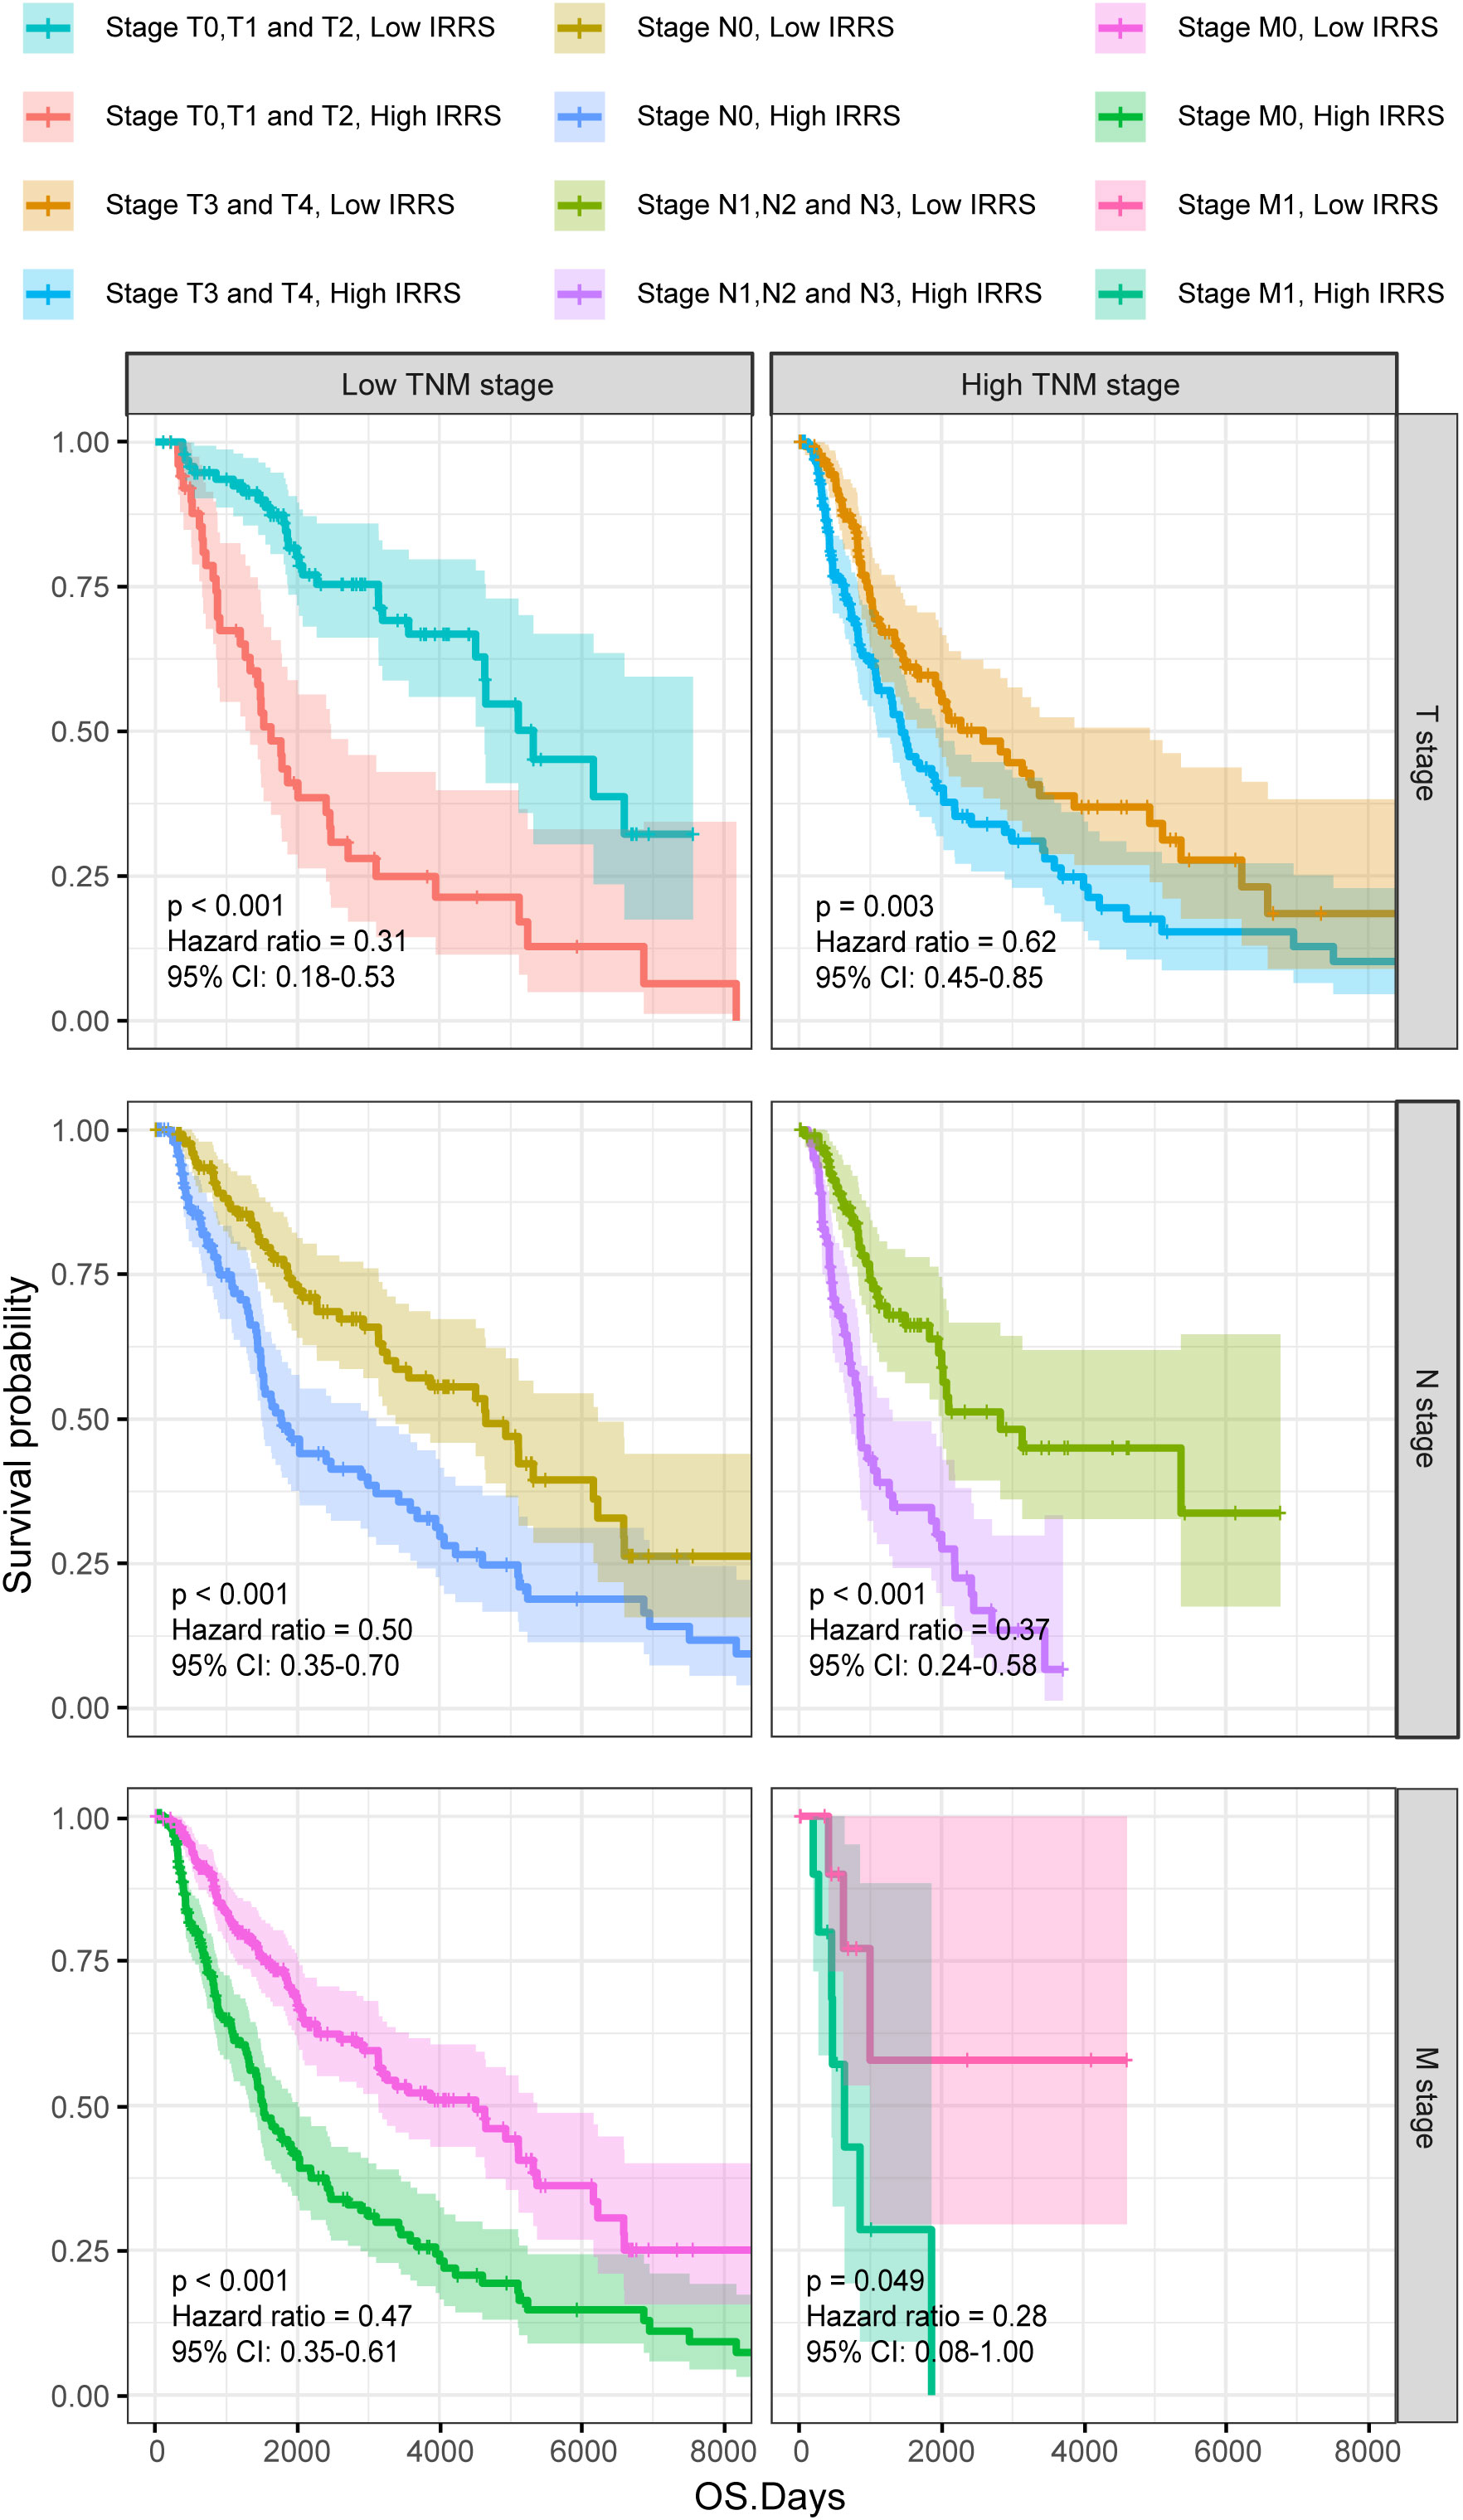
Figure 3 The Kaplan–Meier survival curves according to different TNM stages of patients from the TCGA-SKCM classified into high- and low-risk groups based on the IRRS score.
Enrichment analysis of differentially expressed genes
Screening identified 422 upregulated genes and 915 downregulated genes in the high-risk group compared with the low-risk group (|log2 FC | > 2, P< 0.05) (Figure 4A). The Kyoto Encyclopedia of Genes and Genomes (KEGG) pathway analysis of the differentially upregulated genes showed that these genes were mainly enriched in Staphylococcus aureus infection and estrogen signaling pathway (Figure 4B). In the low IRRS group, GSEA showed significant enrichment, with enrichment scores over 0.7 in 22 pathways, including 12 immune-related pathways. In addition to S. aureus infections, some pathways related to viral infection have also been enriched. Figure 4C shows the eight immune-related pathways with the highest enrichment scores.
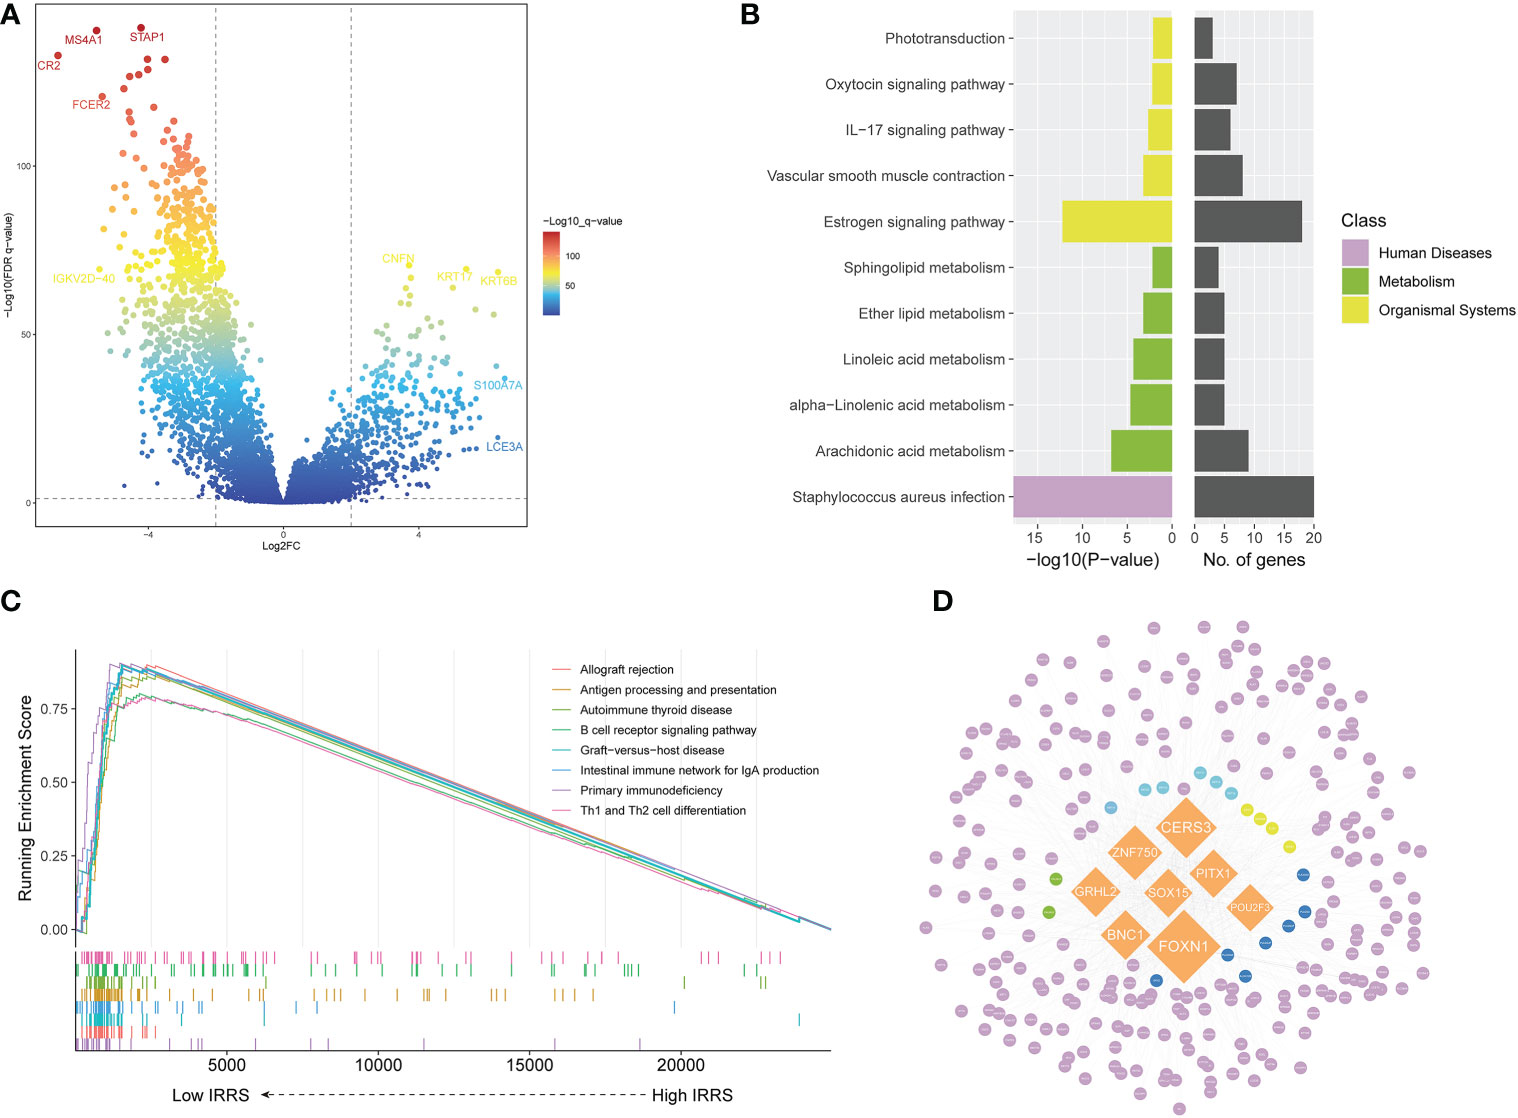
Figure 4 Screening of differentially expressed genes and the master regulator. (A) Volcano plot of differentially expressed genes between the low- and high-risk groups in the TCGA cohort. (B) KEGG enrichment of differentially expressed genes. (C) Gene set enrichment analysis of the high IRRS and low IRRS groups. (D) Network of the MRs and DEGs upregulated in the high IRRS group. Orange: eight MRs with the most nodes. Genes related to the KEGG enrichment pathway corresponding to each color: yellow, Staphylococcus aureus infection; green, estrogen signaling pathway; blue, both above; dark blue, arachidonic acid metabolism; purple, other DEGs.
We used MR4Cancer to identify the MRs, which were prioritized based on DEGs through overrepresentation analysis and GSEA. Among them, the eight transcriptional regulators with the most nodes were selected and used to plot a network of the MRs and DEGs from the MRs obtained by the analysis of upregulated DEGs in the high IRRS group (Figure 4D). Notably, FOXN1 was found to orchestrate the expression of 236 DEGs.
Genomic features of the IRRS
Based on the maftools analysis, the top 20 most frequently altered genes were identified (Figure 5A). Among these genes, MUC16 was more frequently altered in the low IRRS group, and NRAS–BRAF was the most mutually exclusive pair in the high IRRS group. On the other hand, the most frequently co-occurring gene changes in the low IRRS group were for the pair RP1–MUC16 (Figure 5C).
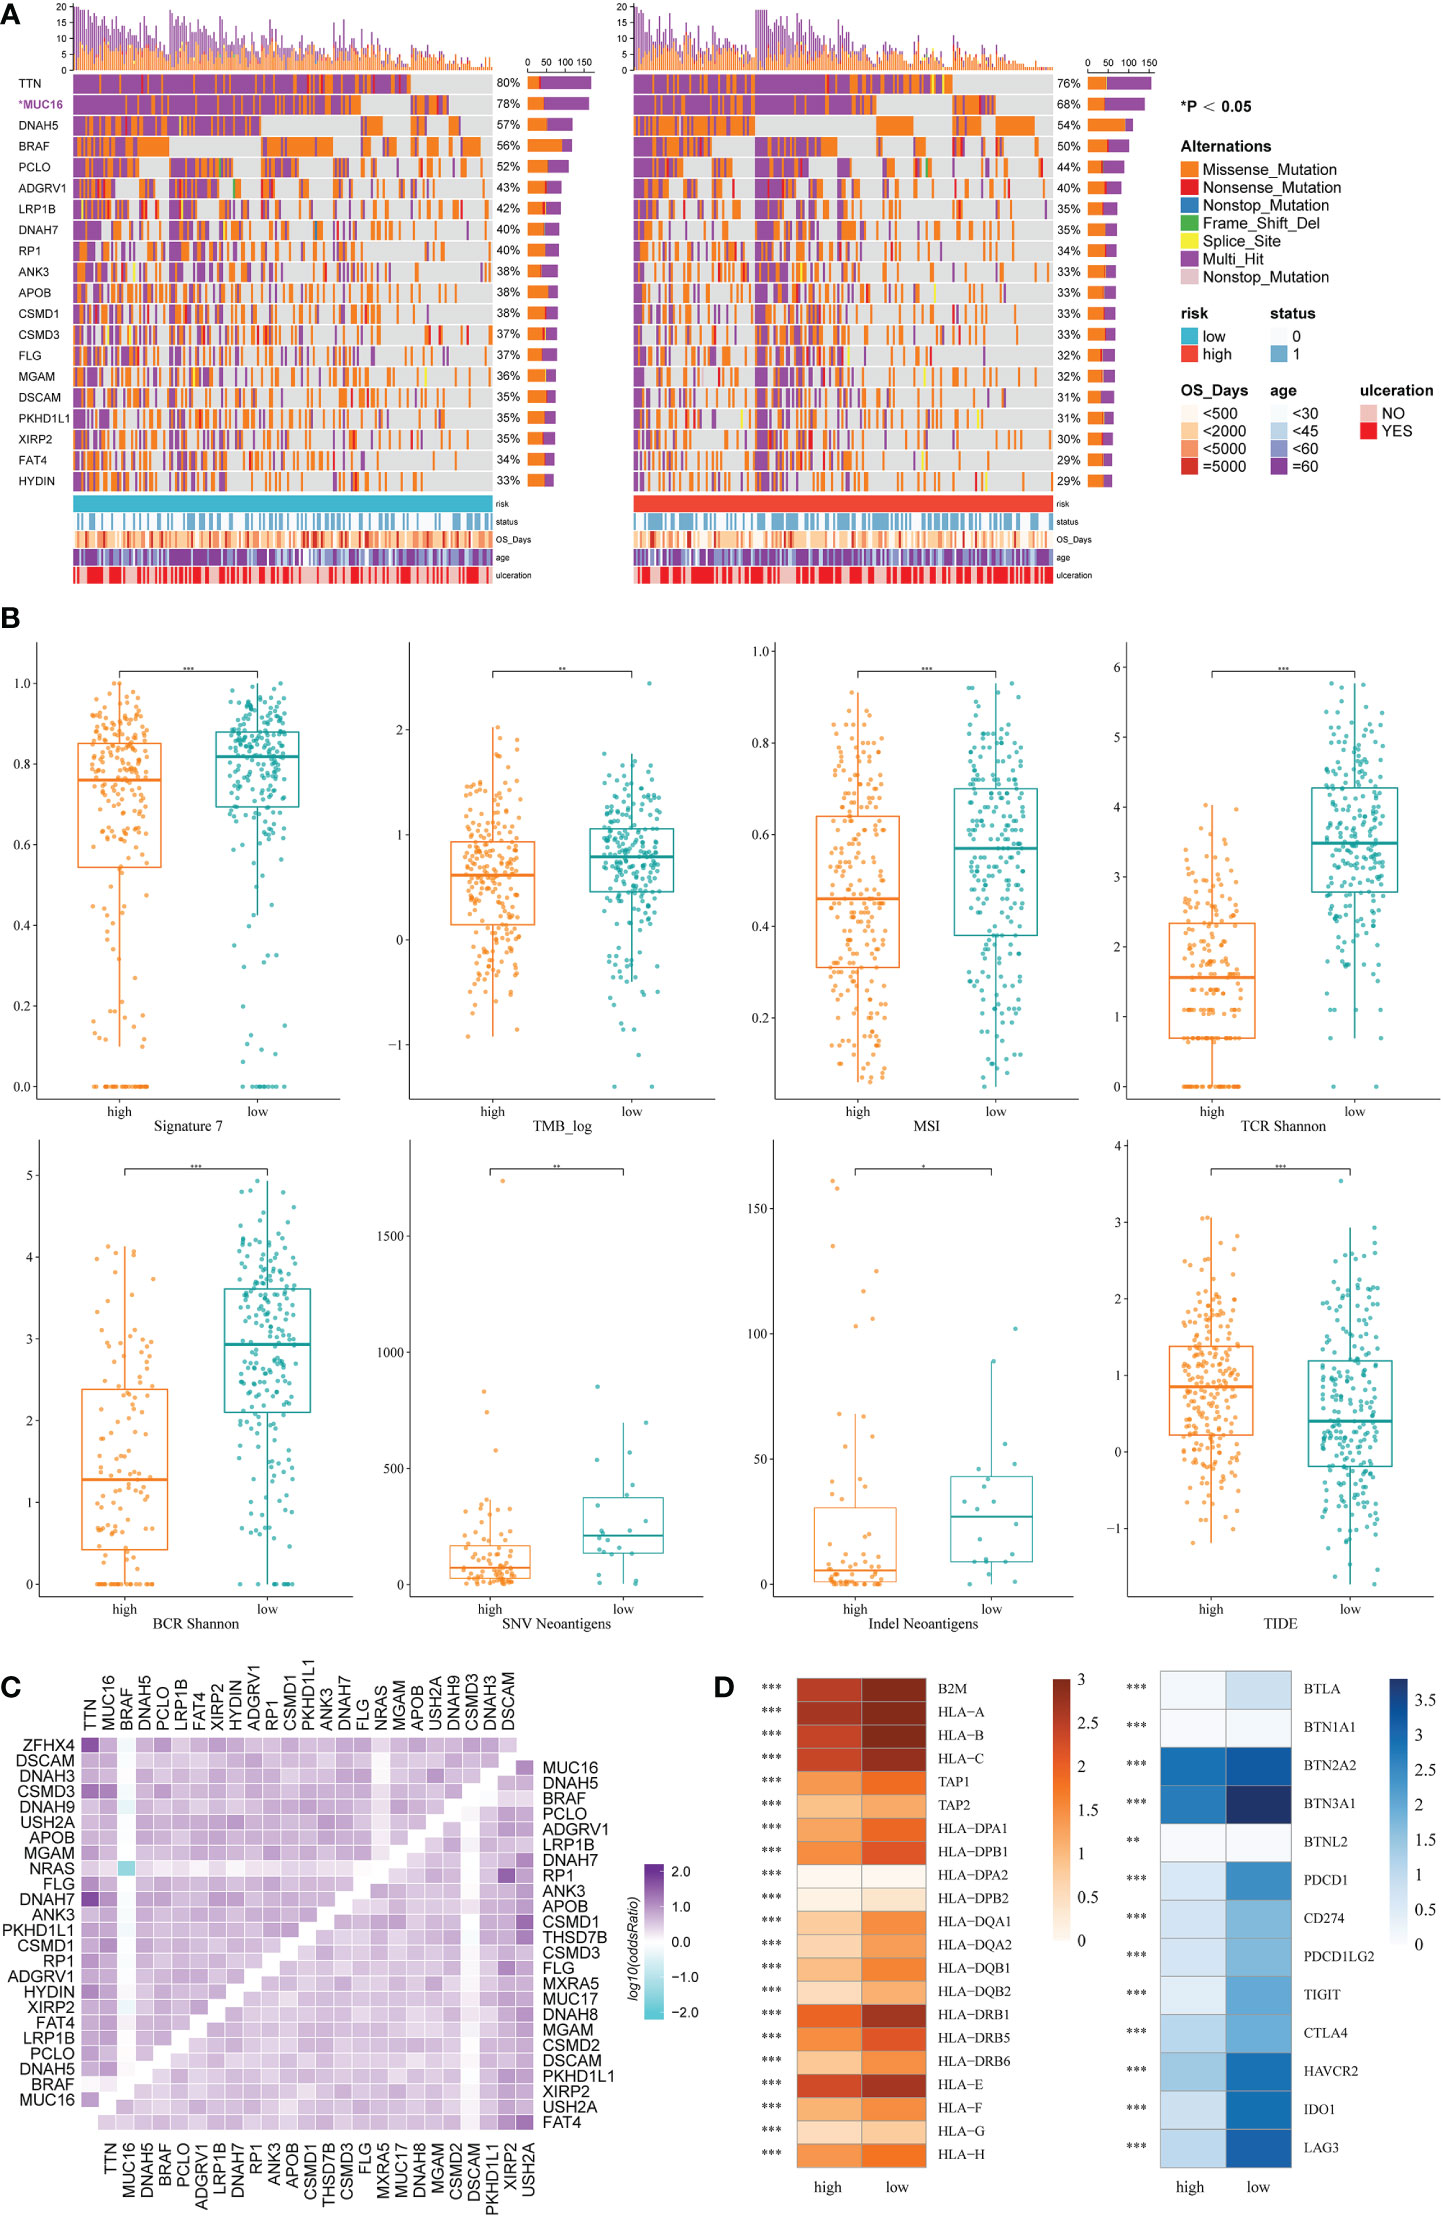
Figure 5 Genomic features and immunologic changes of the high- and low-score groups. (A) Mutation of top 20 most frequently altered genes in melanoma patients with high and low IRRS. (B) Cosmic mutation signature 7, tumor mutation burden, microsatellite instability, neoantigens, and TIDE score in the high- and low-score groups. (C) Heatmap depicting the co-occurrence or exclusivity of the top 25 most mutated genes in the high IRRS group (left upper corner) and the low IRRS group (lower right corner). (D) Association between HLA and immune checkpoint molecules and the IRRS. *P<0.05 **P<0.01 ***P<0.001.
Then, we analyzed the cosmic mutation signatures and found that signature 7 was higher in the low-risk group, which was related to ultraviolet radiation. In addition, the low IRRS group showed higher TMB and MSI (Figure 5B).
The IRRS and immunological mechanism
Immune checkpoint blockade has become a promising strategy for the treatment of many cancers. Therefore, we studied the expression of key immune checkpoint molecules, including PDCD1, CD247, PDCD1LG2, TIGIT, CTLA-4, HAVCR2, IDO1, and LAG3. Cutaneous melanoma patients with low IRRS scores had a higher expression of immune checkpoint molecules, indicating that patients in the low-risk group were more likely to exhibit better immunotherapeutic responses (Figure 5D).
We also analyzed adaptive receptors, including TCR and BCR Shannon diversity, and new antigens, including single nucleotide variant (SNV) and indel new antigens. The results showed that the group with low IRRS had higher TCR and BCR diversity and more new antigens (Figure 5B). HLA genes control the adaptive immune response by presenting antigens to T cells. The antigen-presenting genes that we analyzed all showed high expression in the low IRRS group (Figure 5D).
TIDE uses T-cell dysfunction and exclusion markers to simulate immune escape in tumors with different CTL levels, which can be used to predict the effects of immunotherapy. The high IRRS group had a higher TIDE score, indicating that the patients in the high-score group would have a poorer response to immunotherapy than those in the low-score group (P< 0.05).
Copy number variation
Significant differences in copy number variation were detected between the high IRRS and low IRRS groups (Figure 6A). Importantly, focal amplification peaks in some immune-related gene areas were observed in the low IRRS group, such as PDCD1LG2(9p24.1) (Figures 6B, C). We annotated specific amplified genes in the high and low IRRS groups through gene ontology biological processes and then clustered the top 10 biological processes. Compared with those in the high IRRS group, the genes amplified in the low IRRS group were more enriched in immune-related processes (Figures 6D, E).
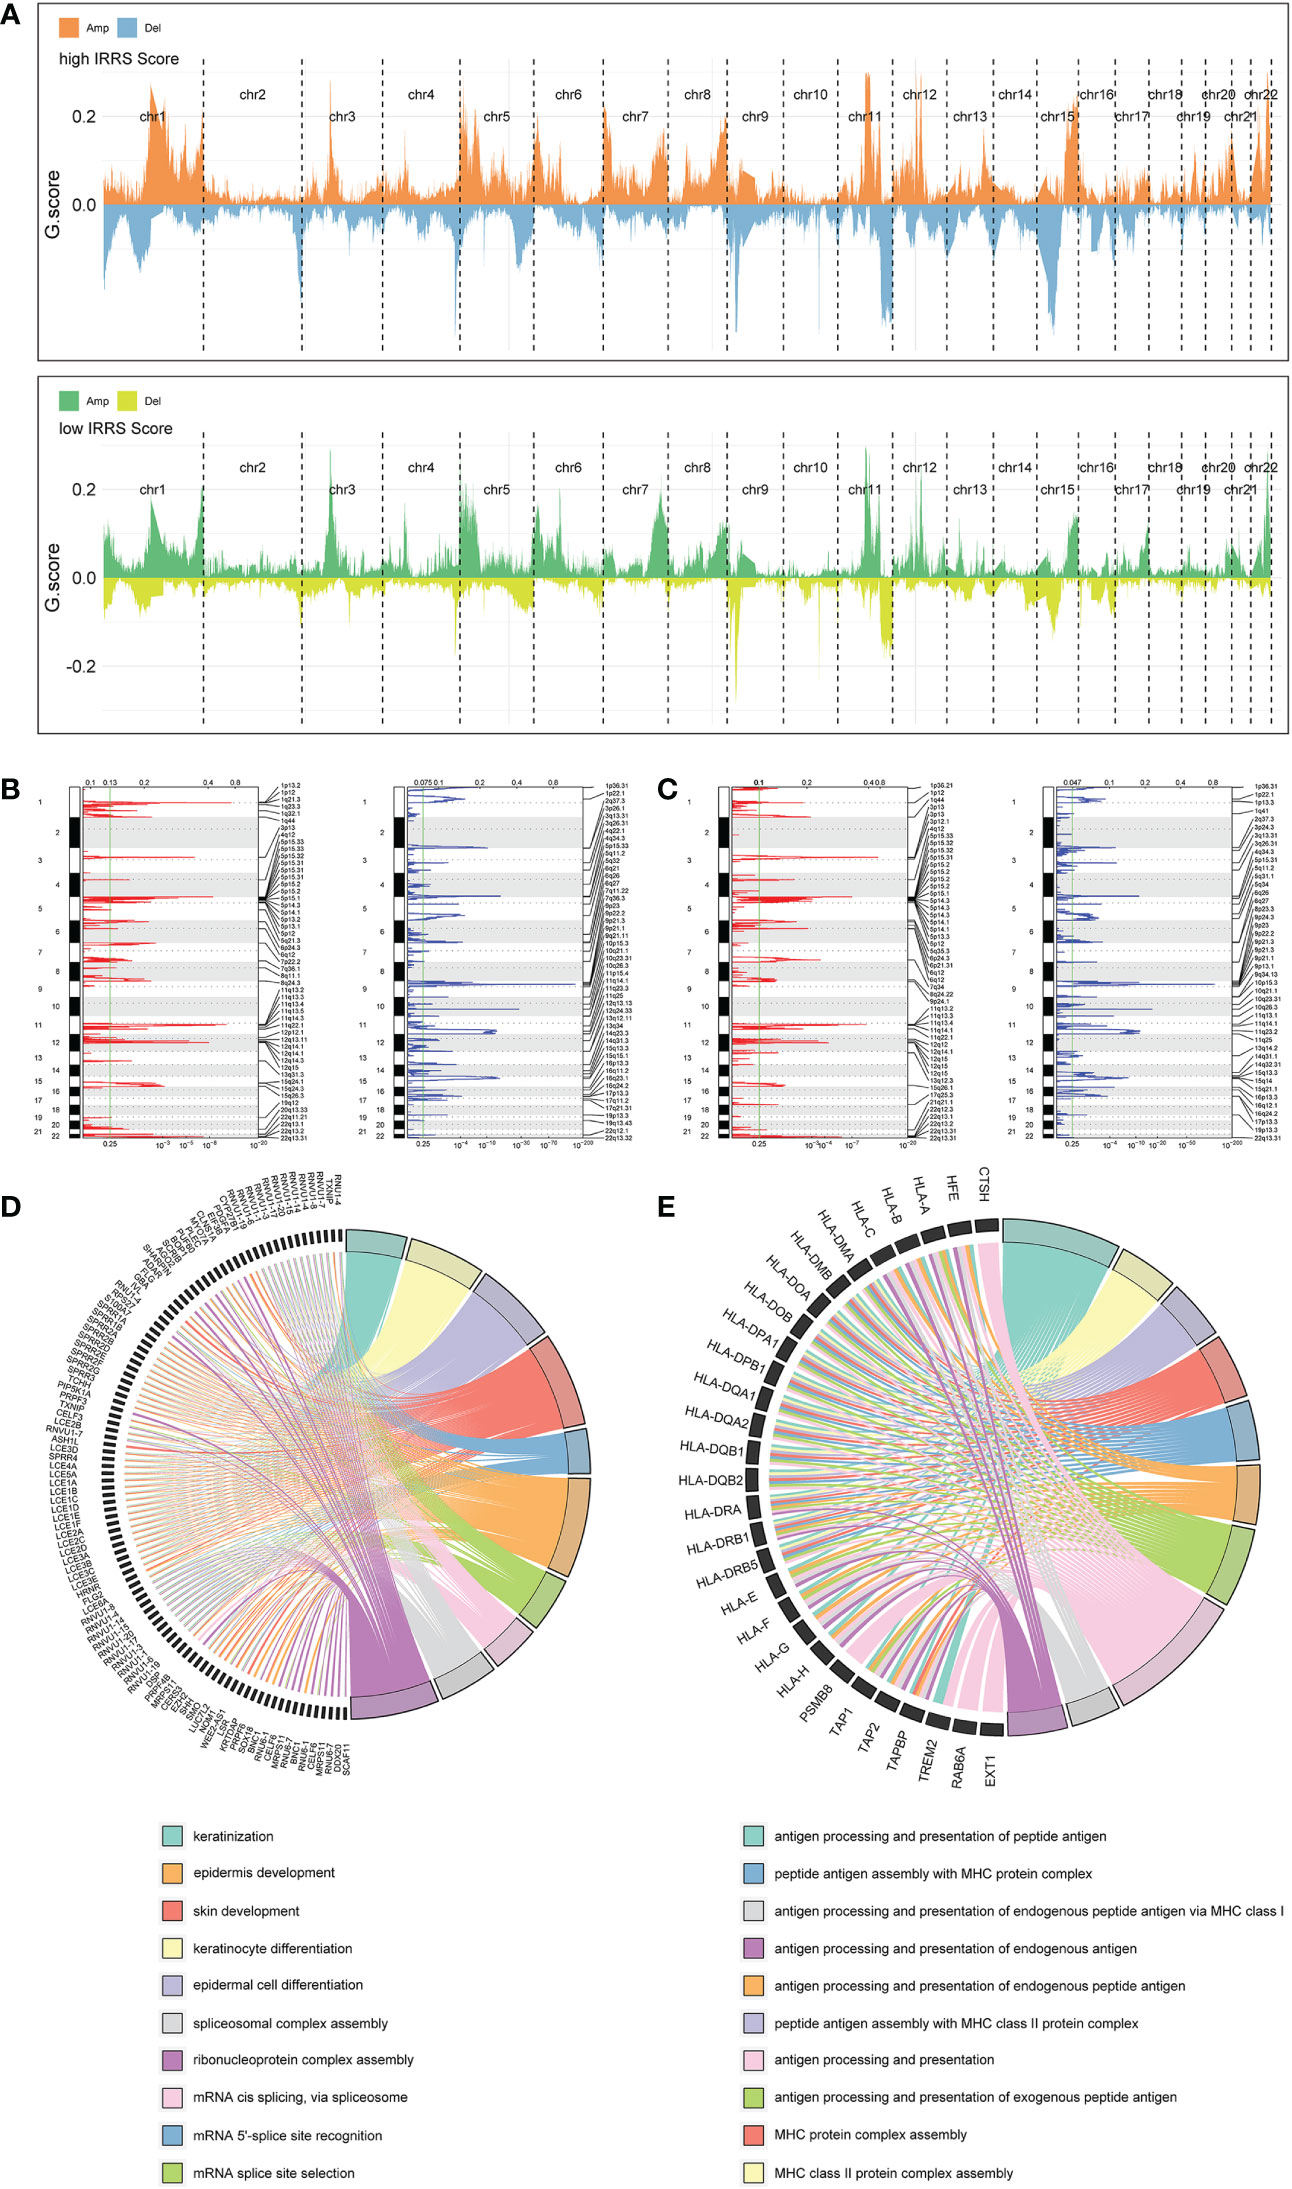
Figure 6 Copy number alterations in the high- and low-score groups. (A) Copy number profiles of the high IRRS score (above) and low IRRS score (below) groups. (B) Detailed cytobands with focal amplification (red) and deletion (blue) peaks identified in the high IRRS group. (C) Detailed cytobands with focal amplification (red) and deletion (blue) peaks identified in the low IRRS group. (D) Circular plot of the top 10 biological processes and corresponding enriched genes in the high IRRS. (E) Circular plot of the top 10 biological processes and corresponding enriched genes in the low IRRS.
Nomogram based on the IRRS
Four independent prognostic clinical characteristics associated with overall survival were identified by uni-Cox analysis (P< 0.05) and multi-Cox regression (Figure 7A). These factors, which comprised age, ulceration, Breslow depth, and N stage, were combined with the IRRS score and used to construct a nomogram to quantitatively estimate the survival rate of patients with cutaneous melanoma (Figure 7B).
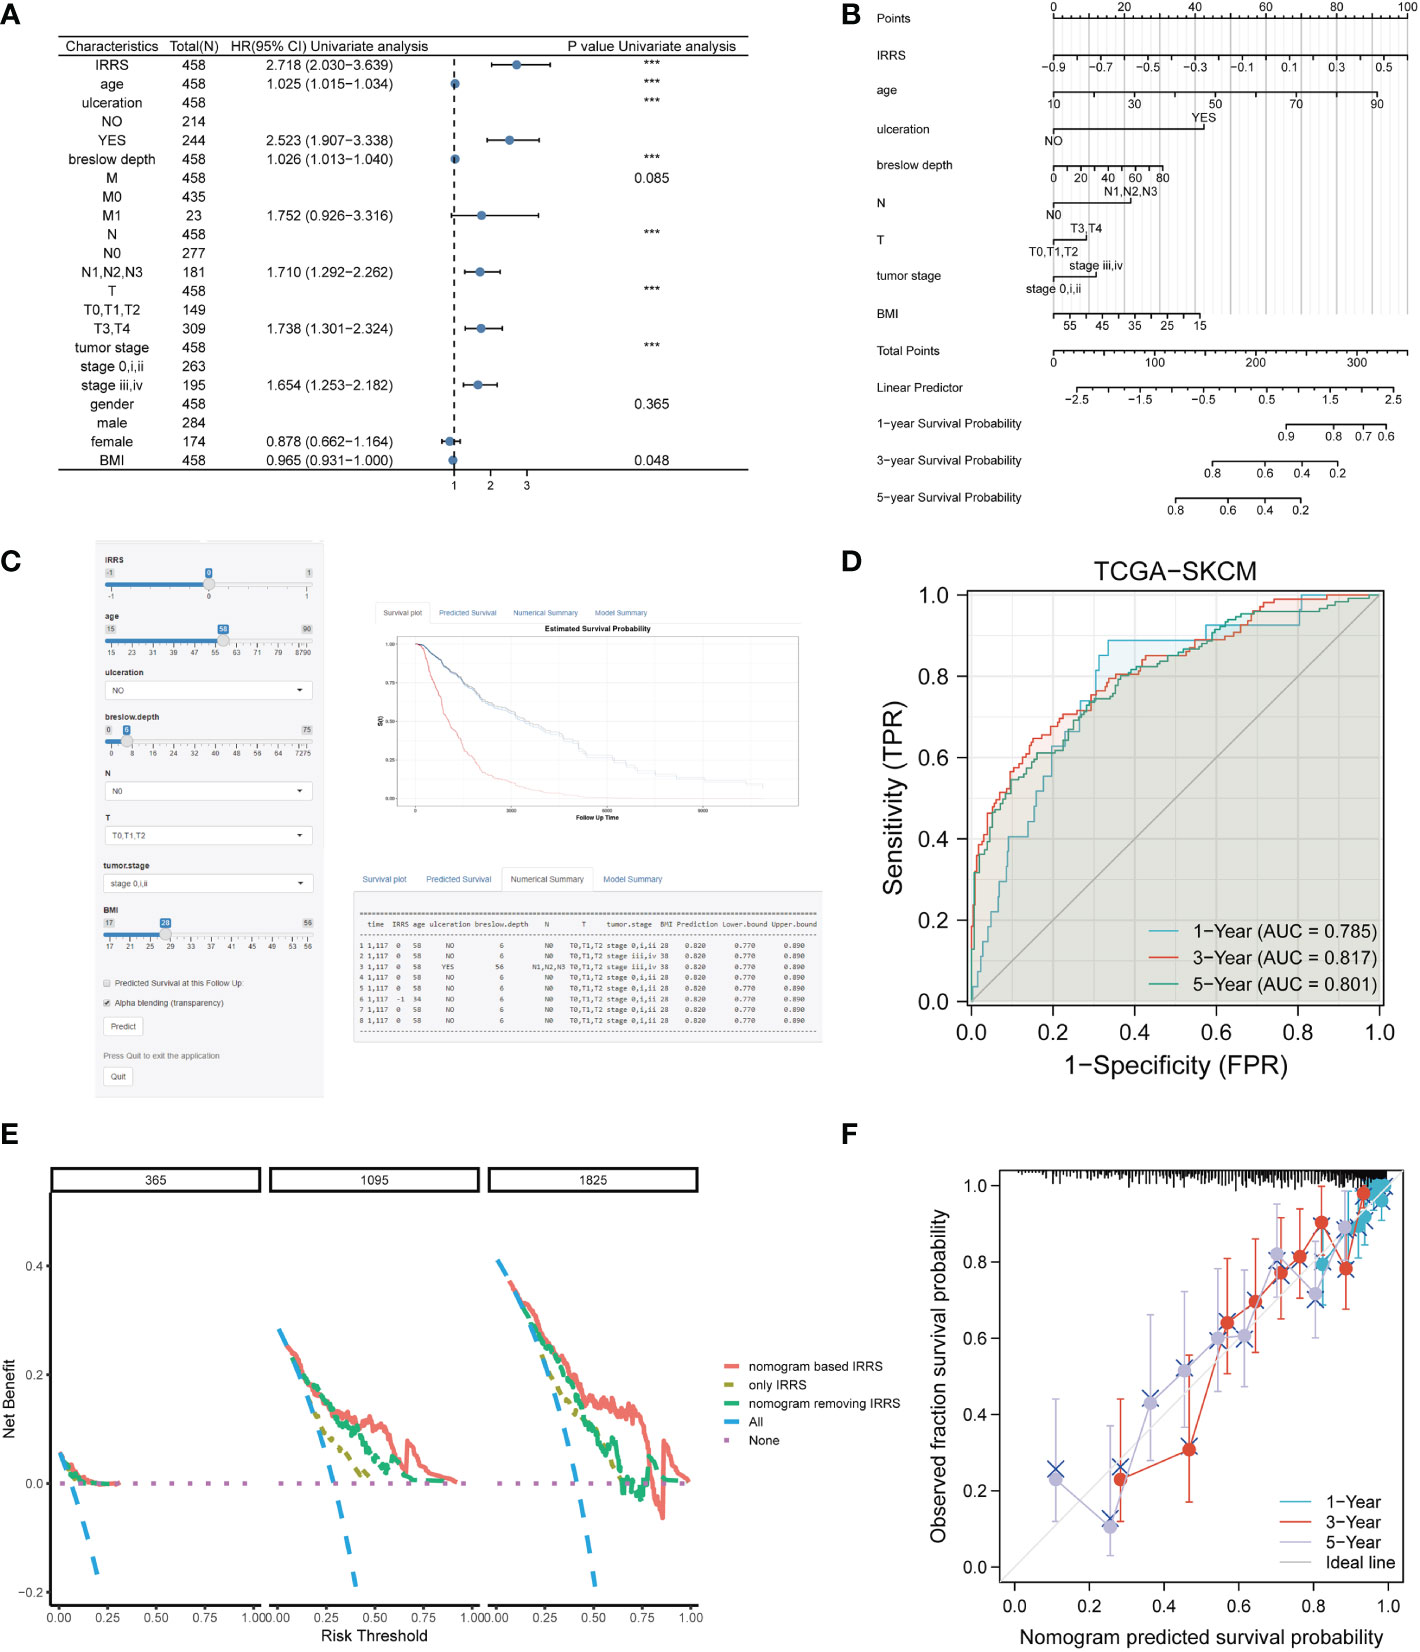
Figure 7 Construction of the nomogram. (A) The prognostic clinical factors screened based on uni-Cox regression. (B) The nomogram for predicting the survival rate of melanoma patients, including four independent clinical prognostic factors and the IRRS. (C) The online version of the nomogram. (D) The ROC analysis of the nomogram. (E) DCA of the nomogram. (F) The calibration curve of the nomogram. ***P<0.001.
Although a nomogram can enable visualization of a prognostic model to a great extent, it still requires a ruler to measure continuous variables, which may lead to error because of subjective judgment. Therefore, we developed an online website for clinicians (https://irrsmelanoma.shinyapps.io/IRRSSKCM/), where the predicted survival rate can be easily determined by inputting values of clinical factors (Figure 7C).
The calibration results of our nomogram were intuitively consistent with the actual calibration results (Figure 7F). The ROC curve analysis indicated that the nomogram had a good predictive effect on prognosis (the AUC values for the 1-, 3-, and 5-year survival were 0.785, 0817, and 0.801, respectively) (Figure 7D). According to the DCA curve, the nomogram had the highest overall net benefit within the threshold probability compared with a separate IRRS score or a separate clinical feature (Figure 7E). In addition, we compared the nomogram based on the IRRS with traditional AJCC TNM staging; the IDI values for 3, 5, and 10 years were 26.9% (P< 0.001), 28.8% (P< 0.001), and 32.5% (P< 0.001), respectively.
Discussion
In our study, first, we focused on the influence of TIICs on the prognosis of melanoma patients. Although there have been previous studies exploring the predictive value of immune genes, few prognosis models focusing on the components and content of tumor-infiltrating cells have been established (39–42). Then, we established a cell pair score matrix generated by comparing the abundance of immune cells in pairs, and the IRRS was constructed on the basis of this matrix. Finally, we not only verified the predictive ability of the IRRS but also analyzed its immune and genetic characteristics. An online nomogram integrating the IRRS and clinical information was constructed to avoid errors caused by the measurement process used by clinicians and for further visualization.
The advantages of our model are as follows. First, errors may be introduced into the models by the use of different methods of gene sequencing, continuous updating of annotations, different methods for infiltrating cell analysis, and batch effects; however, the proportion of TIICs exists in a relatively stable range. The adoption of relative values avoids the abovementioned issues. Second, the construction of cell pairs also enables the consideration of interactions between cells and personal immune factors. Therefore, this method improved the predictive ability of the IRRS. In the verification using cohorts from the GEO, the IRRS showed good prediction efficiency with respect to prognosis and immunotherapy response. Through multi-Cox analysis and stratification analysis of the IRRS, we could confirm that the IRRS was independent of other clinical or pathological factors.
In the differential gene expression analysis and KEGG enrichment analysis, the upregulated genes in the high IRRS group were found to mainly affect S. aureus infection, estrogen signaling pathway, and pathways related to lipid metabolism (arachidonic acid metabolism, linoleic acid metabolism, etc.). Previous studies have shown that increased colonization of S. aureus in squamous cell carcinoma might promote carcinogenesis by inducing chronic skin inflammation (43). Lutchminarian et al. reported a role of pathogenic bacteria in increasing the risk of postoperative complications (44). However, there have been few studies on the direct induction of melanoma carcinogenesis by epidermal microbiota, and whether the change in skin microbiota is the cause or result of melanoma remains to be studied (45). There are gender differences in the incidence of melanoma. The mortality, recurrence, and metastasis rates of melanoma in pregnant women have been found to be higher than those in a non-pregnant control group. Moreover, melanoma-related mortality and sentinel node positivity are higher in women aged 40 to 49 (46). These results suggest that increased estrogen is closely related to the occurrence of melanoma (47). In addition, Conforti et al. confirmed that estrogen could resist the effects of immune checkpoint inhibitors by promoting macrophage polarization (48). A variety of fatty acids are related to the occurrence and development of cancer. An abnormal arachidonic acid metabolic pathway is mainly due to the activation of the COX and LOX pathways, which further affects the occurrence of inflammation and cancer (49). COX-1, COX-2, and LOX are the main drug inhibitor targets of this pathway (50). With the increasing use of immunotherapy, there are excellent prospects for combination treatments involving inhibitors of this pathway acting on specific alkyl receptors (51). Linoleic acid and α-linoleic acid reduce the production of melanin by melanocytes (52). Thus, lipid-related metabolic pathways may represent therapeutic targets in malignant melanoma. In addition, in the high IRRS score group, 236 upregulated DEGs were regulated by FOXN1 as a master regulator. FOXN1 plays an important part in wound healing (53). A possible reason for this upregulation of FOXN1 is that melanoma patients in the high-risk group tend to have worse tumor progression and often develop skin ulceration. Our findings about the MRs may provide new therapeutic targets and potential approaches to treat patients with malignant melanoma.
Antigen presentation ability, tumor immunogenicity, and gene changes can all affect the immune activity of tumors and influence the effectiveness of immunotherapy (54). The high immunogenicity of melanoma makes tumor immunotherapy with checkpoint inhibitors an important treatment option for advanced melanoma patients. The higher TCR, BCR, and HLA diversity in the low IRRS group suggested higher antigen presentation ability in this group. Moreover, the higher levels of SNV or indel neoantigens in the low IRRS were the result of tumor-specific mutations, which determine tumor immunogenicity and increase responsiveness to checkpoint inhibitors (54, 55). In many solid tumors, MSI-H and high TMB are biomarkers of therapeutic benefit (56–58). The low IRRS group had a higher median value for both of these indicators, demonstrating a higher frequency of gene mutation, especially in genes related to ultraviolet exposure (mutation signature 7), which is related to increased sensitivity to checkpoint inhibitor drugs (59, 60). We also analyzed several important immune checkpoints that are related to tumor cell apoptosis (61), T-cell co-inhibition signal, lymphocyte activation (62), and T-cell immunoglobulin mucin (63). The expression levels of immune checkpoints in the high IRRS group were significantly lower than those in the low IRRS group, indicating that the low IRRS group may show a better response to immunotherapy.
In addition, the high IRRS group showed mutual exclusion of NRAS and BRAF. Previous studies have suggested a low incidence of NRAS–BRAF combined mutation, especially in soft tissue malignant melanoma (64). Kumar et al. reported exclusivity between BRAF and NRAS mutations in melanoma, and SPRY4 was a potential mediator of this synthetic response to dual oncogene inhibition (65). Petti et al. showed that the forced expression of NRAS in a single BRAF melanoma line led to growth arrest, that is, when the two mutations coexisted, the viability of cancer cells was impaired (66). On the one hand, this is consistent with our results in the high IRRS score group; that is, there was a higher degree of NRAS–BRAF mutual exclusion in the group with a poor prognosis. On the other hand, the coexistence of double mutations indicates a potential new approach to the treatment of melanoma.
In conclusion, we have introduced the use of relative values, established the IRRS as a prognostic indicator for melanoma, and provided insight into the role of TIICs in the occurrence and development of melanoma and the effects of immunotherapy.
Conclusion
The IRRS shows a good ability to predict prognosis and immunotherapy effect in melanoma, based on differences in the relative abundance of different types of TIICs, and could provide support for further research in melanoma.
Data availability statement
The original contributions presented in the study are included in the article/Supplementary Material. Further inquiries can be directed to the corresponding author.
Author contributions
Conceptualization: ML and XL. Methodology: ML, XL and GZ. Acquisition of data: ML, XL, WB, and GD. Data analysis: ML, XL and WB. Validation: YL. Revision of the article: JS, WB, KH and GZ. Writing of the original draft: ML and XL. Visualization: YL, GD and KH. All authors contributed to the article and approved the submitted version.
Funding
The work was supported by the Innovation and Entrepreneurship Funding Project of Grade 2020 of Central South University (Innovation Project:2022105330036); The Project of Intelligent Management Software for Multimodal Medical Big Data for New Generation Information Technology, Ministry of Industry and Information Technology of People’s Republic of China (TC210804V); and The Science and Technology Innovation Program of Hunan Province (2020RC3059).
Acknowledgments
We acknowledge the TCGA and GEO databases for providing their platforms and the contributors for uploading their meaningful datasets.
Conflict of interest
The authors declare that the research was conducted in the absence of any commercial or financial relationships that could be construed as a potential conflict of interest.
The reviewer MP declared a shared affiliation with the authors ML, XL, GZ, GD, YL, JS and KH to the handling editor at time of review.
Publisher’s note
All claims expressed in this article are solely those of the authors and do not necessarily represent those of their affiliated organizations, or those of the publisher, the editors and the reviewers. Any product that may be evaluated in this article, or claim that may be made by its manufacturer, is not guaranteed or endorsed by the publisher.
Supplementary material
The Supplementary Material for this article can be found online at: https://www.frontiersin.org/articles/10.3389/fimmu.2023.1112181/full#supplementary-material
References
1. Ali Z, Yousaf N, Larkin J. Melanoma epidemiology, biology and prognosis. EJC Suppl. (2013) 11(2):81–91. doi: 10.1016/j.ejcsup.2013.07.012
2. Arnold M, Singh D, Laversanne M, Vignat J, Vaccarella S, Meheus F, et al. Global burden of cutaneous melanoma in 2020 and projections to 2040. JAMA Dermatol (2022) 158(5):495–503. doi: 10.1001/jamadermatol.2022.0160
3. Dzwierzynski WW. Melanoma risk factors and prevention. Clinics Plast Surg (2021) 48(4):543–50. doi: 10.1016/j.cps.2021.05.001
4. Jespersen H, Lindberg MF, Donia M, Söderberg EMV, Andersen R, Keller U, et al. Clinical responses to adoptive T-cell transfer can be modeled in an autologous immune-humanized mouse model. Nat Commun (2017) 8(1):707. doi: 10.1038/s41467-017-00786-z
5. Vogelsang M, Martinez CN, Rendleman J, Bapodra A, Malecek K, Romanchuk A, et al. The expression quantitative trait loci in immune pathways and their effect on cutaneous melanoma prognosis. Clin Cancer Res (2016) 22(13):3268–80. doi: 10.1158/1078-0432.CCR-15-2066
6. Furue M, Ito T, Wada N, Wada M, Kadono T, Uchi H. Melanoma and immune checkpoint inhibitors. Curr Oncol Rep (2018) 20(3):29. doi: 10.1007/s11912-018-0676-z
7. Somasundaram R, Zhang G, Fukunaga-Kalabis M, Perego M, Krepler C, Xu X, et al. Tumor-associated b-cells induce tumor heterogeneity and therapy resistance. Nat Commun (2017) 8(1):607. doi: 10.1038/s41467-017-00452-4
8. Farhood B, Najafi M, Mortezaee K. CD8+ cytotoxic T lymphocytes in cancer immunotherapy: A review. J Cell Physiol (2019) 234(6):8509–21. doi: 10.1002/jcp.27782
9. Hiraoka N. Tumor-infiltrating lymphocytes and hepatocellular carcinoma: Molecular biology. Int J Clin Oncol (2010) 15(6):544–51. doi: 10.1007/s10147-010-0130-1
10. Veltman JD, Lambers ME, van Nimwegen M, Hendriks RW, Hoogsteden HC, Hegmans JP, et al. Zoledronic acid impairs myeloid differentiation to tumour-associated macrophages in mesothelioma. Br J Cancer. (2010) 103(5):629–41. doi: 10.1038/sj.bjc.6605814
11. Twitty CG, Huppert LA, Daud AI. Prognostic biomarkers for melanoma immunotherapy. Curr Oncol Rep (2020) 22(3):25. doi: 10.1007/s11912-020-0886-z
12. Pinton L, Solito S, Masetto E, Vettore M, Canè S, Puppa AD, et al. Immunosuppressive activity of tumor-infiltrating myeloid cells in patients with meningioma. Oncoimmunology. (2018) 7(7):e1440931. doi: 10.1080/2162402X.2018.1440931
13. Pagès F, Berger A, Camus M, Sanchez-Cabo F, Costes A, Molidor R, et al. Effector memory T cells, early metastasis, and survival in colorectal cancer. N Engl J Med (2005) 353(25):2654–66. doi: 10.1056/NEJMoa051424
14. Kadara H, Choi M, Zhang J, Parra ER, Rodriguez-Canales J, Gaffney SG, et al. Whole-exome sequencing and immune profiling of early-stage lung adenocarcinoma with fully annotated clinical follow-up. Ann Oncol (2017) 28(1):75–82. doi: 10.1093/annonc/mdw436
15. Ruiz de Galarreta M, Bresnahan E, Molina-Sánchez P, Lindblad KE, Maier B, Sia D, et al. β-catenin activation promotes immune escape and resistance to anti-PD-1 therapy in hepatocellular carcinoma. Cancer Discovery (2019) 9(8):1124–41. doi: 10.1158/2159-8290.CD-19-0074
16. Cirenajwis H, Ekedahl H, Lauss M, Harbst K, Carneiro A, Enoksson J, et al. Molecular stratification of metastatic melanoma using gene expression profiling: Prediction of survival outcome and benefit from molecular targeted therapy. Oncotarget. (2015) 6(14):12297–309. doi: 10.18632/oncotarget.3655
17. Jayawardana K, Schramm SJ, Haydu L, Thompson JF, Scolyer RA, Mann GJ, et al. Determination of prognosis in metastatic melanoma through integration of clinico-pathologic, mutation, mRNA, microRNA, and protein information. Int J Cancer. (2015) 136(4):863–74. doi: 10.1002/ijc.29047
18. Riaz N, Havel JJ, Makarov V, Desrichard A, Urba WJ, Sims JS, et al. Tumor and microenvironment evolution during immunotherapy with nivolumab. Cell. (2017) 171(4):934–49. doi: 10.1016/j.cell.2017.09.028
19. Auslander N, Zhang G, Lee JS, Frederick DT, Miao B, Moll T, et al. Robust prediction of response to immune checkpoint blockade therapy in metastatic melanoma. Nat Med (2018) 24(10):1545–9. doi: 10.1038/s41591-018-0157-9
20. Liu D, Schilling B, Liu D, Sucker A, Livingstone E, Jerby-Arnon L, et al. Integrative molecular and clinical modeling of clinical outcomes to PD1 blockade in patients with metastatic melanoma. Nat Med (2019) 25(12):1916–27. doi: 10.1038/s41591-019-0654-5
21. Carmona CP, Bueno CG, Toussaint A, Träger S, Díaz S, Moora M, et al. Fine-root traits in the global spectrum of plant form and function. Nature. (2021) 597(7878):683–7. doi: 10.1038/s41586-021-03871-y
22. Dayan I, Roth HR, Zhong A, Harouni A, Gentili A, Abidin AZ, et al. Federated learning for predicting clinical outcomes in patients with COVID-19. Nat Med (2021) 27(10):1735–43. doi: 10.1038/s41591-021-01506-3
23. Stekhoven DJ, Bühlmann P. MissForest–non-parametric missing value imputation for mixed-type data. Bioinformatics. (2012) 28(1):112–8. doi: 10.1093/bioinformatics/btr597
24. Pommier JD, Gorman C, Crabol Y, Bleakley K, Sothy H, Santy K, et al. Childhood encephalitis in the greater Mekong region (the SouthEast Asia encephalitis project): A multicentre prospective study. Lancet Glob Health (2022) 10(7):e989–e1002. doi: 10.1016/S2214-109X(22)00174-7
25. Patel KV, Segar MW, Lavie CJ, Kondamudi N, Neeland IJ, Almandoz JP, et al. Diabetes status modifies the association between different measures of obesity and heart failure risk among older adults: A pooled analysis of community-based NHLBI cohorts. Circulation. (2022) 145(4):268–78. doi: 10.1161/CIRCULATIONAHA.121.055830
26. Kartal E, Schmidt TSB, Molina-Montes E, Rodríguez-Perales S, Wirbel J, Maistrenko OM, et al. A faecal microbiota signature with high specificity for pancreatic cancer. Gut. (2022) 71(7):1359–72. doi: 10.1136/gutjnl-2021-324755
27. Petrazzini BO, Chaudhary K, Márquez-Luna C, Forrest IS, Rocheleau G, Cho J, et al. Coronary risk estimation based on clinical data in electronic health records. J Am Coll Cardiol (2022) 79(12):1155–66. doi: 10.1016/j.jacc.2022.01.021
28. Auer TO, Álvarez-Ocaña R, Cruchet S, Benton R, Arguello JR. Copy number changes in co-expressed odorant receptor genes enable selection for sensory differences in drosophilid species [published online ahead of print, 2022 jul 21]. Nat Ecol Evol (2022) 6(9):1343–53. doi: 10.1038/s41559-022-01830-y
29. Charoentong P, Finotello F, Angelova M, Mayer C, Efremova M, Rieder D, et al. Pan-cancer immunogenomic analyses reveal genotype-immunophenotype relationships and predictors of response to checkpoint blockade. Cell Rep (2017) 18(1):248–62. doi: 10.1016/j.celrep.2016.12.019
30. Yu G, Wang LG, Han Y, He QY. clusterProfiler: An R package for comparing biological themes among gene clusters. Omics. (2012) 16:284–7. doi: 10.1089/omi.2011.0118
31. Anders S, Huber W. Differential expression analysis for sequence count data. Genome Biol (2010) 11(10):R106. doi: 10.1186/gb-2010-11-10-r106
32. Ru B, Tong Y, Zhang J. MR4Cancer: A web server prioritizing master regulators for cancer. Bioinformatics. (2019) 35(4):636–42. doi: 10.1093/bioinformatics/bty658
33. Mayakonda A, Lin DC, Assenov Y, Plass C, Koeffler HP. Maftools: efficient and comprehensive analysis of somatic variants in cancer. Genome Res (2018) 28(11):1747–56. doi: 10.1101/gr.239244.118
34. Alexandrov LB, Nik-Zainal S, Wedge DC, Aparicio SA, Behjati S, Biankin AV, et al. Signatures of mutational processes in human cancer. Nature. (2013) 500(7463):415–21. doi: 10.1038/nature12477
35. Mermel CH, Schumacher SE, Hill B, Meyerson ML, Beroukhim R, Getz G. GISTIC2.0 facilitates sensitive and confident localization of the targets of focal somatic copy-number alteration in human cancers. Genome Biol (2011) 12:R41. doi: 10.1186/gb-2011-12-4-r41
36. Thorsson V, Gibbs DL, Brown SD, Wolf D, Bortone DS, Ou Yang TH, et al. The immune landscape of cancer. Immunity. (2018) 48(4):812–830.e14. doi: 10.1016/j.immuni.2018.03.023
37. Jiang P, Gu S, Pan D, Fu J, Sahu A, Hu X, et al. Signatures of T cell dysfunction and exclusion predict cancer immunotherapy response Nat Med (2018) 24(10):1550–8. doi: 10.1038/s41591-018-0136-1
38. Harrell FE Jr. rms: Regression Modeling Strategies. R package version 51-4. 2019. https://CRAN.R-project.org/package=rms
39. Dunn GP, Bruce AT, Ikeda H, Old LJ, Schreiber RD. Cancer immunoediting: From immunosurveillance to tumor escape. Nat Immunol (2002) 3(11):991–8. doi: 10.1038/ni1102-991
40. Watson RA, Tong O, Cooper R, Taylor CA, Sharma PK, de Los Aires AV, et al. Immune checkpoint blockade sensitivity and progression-free survival associates with baseline CD8+ T cell clone size and cytotoxicity. Sci Immunol (2021) 6(64):eabj8825. doi: 10.1126/sciimmunol.abj8825
41. Tian Q, Gao H, Zhao W, Zhou Y, Yang J. Development and validation of an immune gene set-based prognostic signature in cutaneous melanoma. Future Oncol (2021) 17(31):4115–29. doi: 10.2217/fon-2021-0104
42. Yang Y, Long X, Li G, Yu X, Liu Y, Li K, et al. Prediction of clinical prognosis in cutaneous melanoma using an immune-related gene pair signature. Bioengineered. (2021) 12(1):1803–12. doi: 10.1080/21655979.2021.1924556
43. Squarzanti DF, Zavattaro E, Pizzimenti S, Amoruso A, Savoia P, Azzimonti B. Non-melanoma skin cancer: news from microbiota research. Crit Rev Microbiol (2020) 46(4):433–49. doi: 10.1080/1040841X.2020.1794792
44. Lutchminarian K, Clarke DL. The microbiology of ulcerative skin cancers: does the presence of pathogenic bacteria increase the risk of postoperative complications? S Afr J Surg (2021) 59(1):25a–e.
45. Woo YR, Cho SH, Lee JD, Kim HS. The human microbiota and skin cancer. Int J Mol Sci (2022) 23(3):1813. doi: 10.3390/ijms23031813
46. Gori A, Savarese I, D'Errico A, Grazzini M, Papi F, Maio V, et al. Estrogen receptor (ER)β expression and worse outcome from melanoma in pregnant and perimenopausal women. J Am Acad Dermatol (2016) 75(3):e117. doi: 10.1016/j.jaad.2016.02.1245
47. Dika E, Patrizi A, Lambertini M, Manuelpillai N, Fiorentino M, Altimari A, et al. Estrogen receptors and melanoma: A review. Cells. (2019) 8(11):1463. doi: 10.3390/cells8111463
48. Conforti F, Pala L, Bagnardi V, De Pas T, Martinetti M, Viale G, et al. Cancer immunotherapy efficacy and patients' sex: a systematic review and meta-analysis. Lancet Oncol (2018) 19(6):737–46. doi: 10.1016/S1470-2045(18)30261-4
49. Wang D, Dubois RN. Eicosanoids and cancer. Nat Rev Cancer. (2010) 10(3):181–93. doi: 10.1038/nrc2809
50. Yarla NS, Bishayee A, Sethi G, Reddanna P, Kalle AM, Dhananjaya BL, et al. Targeting arachidonic acid pathway by natural products for cancer prevention and therapy. Semin Cancer Biol (2016) 40-41:48–81. doi: 10.1016/j.semcancer.2016.02.001
51. Johnson AM, Kleczko EK, Nemenoff RA. Eicosanoids in cancer: New roles in immunoregulation. Front Pharmacol (2020) 11:595498. doi: 10.3389/fphar.2020.595498
52. Ando H, Ryu A, Hashimoto A, Oka M, Ichihashi M. Linoleic acid and alpha-linolenic acid lightens ultraviolet-induced hyperpigmentation of the skin. Arch Dermatol Res (1998) 290(7):375–81. doi: 10.1007/s004030050320
53. Bukowska J, Kopcewicz M, Walendzik K, Gawronska-Kozak B. Foxn1 in skin development, homeostasis and wound healing. Int J Mol Sci (2018) 19(7):1956. doi: 10.3390/ijms19071956
54. Schumacher TN, Schreiber RD. Neoantigens in cancer immunotherapy. Science. (2015) 348(6230):69–74. doi: 10.1126/science.aaa4971
55. Layer JP, Kronmüller MT, Quast T, van den Boorn-Konijnenberg D, Effern M, Hinze D, et al. Amplification of n-myc is associated with a T-cell-poor microenvironment in metastatic neuroblastoma restraining interferon pathway activity and chemokine expression. Oncoimmunology. (2017) 6(6):e1320626. doi: 10.1080/2162402X.2017.1320626
56. Bonneville R, Krook MA, Kautto EA, Miya J, Wing MR, Chen HZ, et al. Landscape of microsatellite instability across 39 cancer types. JCO Precis Oncol (2017) 2017:PO.17.00073. doi: 10.1200/PO.17.00073
57. Chan TA, Yarchoan M, Jaffee E, Swanton C, Quezada SA, Stenzinger A, et al. Development of tumor mutation burden as an immunotherapy biomarker: utility for the oncology clinic. Ann Oncol (2019) 30(1):44–56. doi: 10.1093/annonc/mdy495
58. Zhang Z, Lu M, Qin Y, Gao W, Tao L, Su W, et al. Neoantigen: A new breakthrough in tumor immunotherapy. Front Immunol (2021) 12:672356. doi: 10.3389/fimmu.2021.672356
59. Hollern DP, Xu N, Thennavan A, Glodowski C, Garcia-Recio S, Mott KR, et al. B cells and T follicular helper cells mediate response to checkpoint inhibitors in high mutation burden mouse models of breast cancer. Cell. (2019) 179(5):1191–1206.e21. doi: 10.1016/j.cell.2019.10.028
60. Chang L, Chang M, Chang HM, Chang F. Microsatellite instability: A predictive biomarker for cancer immunotherapy. Appl Immunohistochem Mol Morphol. (2018) 26(2):e15–21. doi: 10.1097/PAI.0000000000000575
61. Zhai L, Ladomersky E, Lenzen A, Nguyen B, Patel R, Lauing KL, et al. IDO1 in cancer: a Gemini of immune checkpoints. Cell Mol Immunol (2018) 15(5):447–57. doi: 10.1038/cmi.2017.143
62. Elia G, Ferrari SM, Galdiero MR, Ragusa F, Paparo SR, Ruffilli I, et al. New insight in endocrine-related adverse events associated to immune checkpoint blockade. Best Pract Res Clin Endocrinol Metab (2020) 34(1):101370. doi: 10.1016/j.beem.2019.101370
63. Monney L, Sabatos CA, Gaglia JL, Ryu A, Waldner H, Chernova T, et al. Th1-specific cell surface protein Tim-3 regulates macrophage activation and severity of an autoimmune disease. Nature. (2002) 415(6871):536–41. doi: 10.1038/415536a
64. Wong CW, Fan YS, Chan TL, Chan AS, Ho LC, Ma TK, et al. Cancer genome project. BRAF and NRAS mutations are uncommon in melanomas arising in diverse internal organs. J Clin Pathol (2005) 58(6):640–4. doi: 10.1136/jcp.2004.022509
65. Kumar R, Njauw CN, Reddy BY, Ji Z, Rajadurai A, Klebanov N, et al. Growth suppression by dual BRAF(V600E) and NRAS(Q61) oncogene expression is mediated by SPRY4 in melanoma. Oncogene. (2019) 38(18):3504–20. doi: 10.1038/s41388-018-0632-2
Keywords: cutaneous melanoma, cell pair, tumor infiltrating immune cell, prognosis model, immunotherapy response
Citation: Li M, Long X, Bu W, Zhang G, Deng G, Liu Y, Su J and Huang K (2023) Immune-related risk score: An immune-cell-pair-based prognostic model for cutaneous melanoma. Front. Immunol. 14:1112181. doi: 10.3389/fimmu.2023.1112181
Received: 30 November 2022; Accepted: 26 January 2023;
Published: 15 February 2023.
Edited by:
Meng Zhou, Wenzhou Medical University, ChinaReviewed by:
Mou Peng, Department of Urology, Central South University, ChinaDenise Cecil, University of Washington, United States
Copyright © 2023 Li, Long, Bu, Zhang, Deng, Liu, Su and Huang. This is an open-access article distributed under the terms of the Creative Commons Attribution License (CC BY). The use, distribution or reproduction in other forums is permitted, provided the original author(s) and the copyright owner(s) are credited and that the original publication in this journal is cited, in accordance with accepted academic practice. No use, distribution or reproduction is permitted which does not comply with these terms.
*Correspondence: Kai Huang, kaiserhuang@csu.edu.cn
†These authors have contributed equally to this work