 Matthew Pace1†
 Ane Ogbe1†
 Jacob Hurst2
 Nicola Robinson1Jodi Meyerowitz1Natalia Olejniczak1John P. Thornhill1,3
 Mathew Jones1Anele Waters4
 Julianne Lwanga4Kristen Kuldanek5Rebecca Hall5Panagiota Zacharopoulou1
 Genevieve E. Martin1,6Helen Brown1
 Nneka Nwokolo7
 Dimitra Peppa8
 Julie Fox4†
 Sarah Fidler5,9,10†
 John Frater1,11*† on behalf of the SPARTAC and CHERUB investigators
- 1Nuffield Department of Medicine, University of Oxford, Oxford, United Kingdom
- 2Etcembly Ltd, Harwell Campus, Didcot, United Kingdom
- 3Blizard Institute, Barts and The London School of Medicine and Dentistry, Queen Mary University of London, London, United Kingdom
- 4Department of Infection, Guys and St Thomas’ National Health Service (NHS) Trust, London, United Kingdom
- 5Department of HIV Medicine, St Mary’s Hospital, Imperial College Healthcare National Health Service (NHS) Trust, London, United Kingdom
- 6Department of Infectious Diseases, Monash University, Melbourne, VIC, Australia
- 7Department of HIV/GUM, Chelsea and Westminster Hospital, London, United Kingdom
- 8Division of Infection and Immunity, University College, London, United Kingdom
- 9Department of Infectious Disease, Faculty of Medicine, Imperial College London, London, United Kingdom
- 10National Institute for Health and Care Research (NIHR) Imperial College Biomedical Research Centre, London, United Kingdom
- 11National Institute for Health and Care Research (NIHR) Oxford Biomedical Research Centre, Oxford, United Kingdom
Natural Killer (NK) cells play a key role in controlling HIV replication, with potential downstream impact on the size of the HIV reservoir and likelihood of viral rebound after antiretroviral therapy (ART) cessation. It is therefore important to understand how primary HIV infection (PHI) disrupts NK cell function, and how these functions are restored by early ART. We examined the impact of commencing ART during PHI on phenotypic and functional NK cell markers at treatment initiation (baseline), 3 months, 1 year, and 2 years in seven well-characterised participants in comparison to HIV seronegative volunteers. We then examined how those NK cell properties differentially impacted by ART related to time to viral rebound and HIV DNA levels in 44 individuals from the SPARTAC trial who stopped ART after 48 weeks treatment, started during PHI. NK cell markers that were significantly different between the seven people with HIV (PWH) treated for 2 years and HIV uninfected individuals included NKG2C levels in CD56dim NK cells, Tim-3 expression in CD56bright NK cells, IFN-γ expressed by CD56dim NK cells after IL-12/IL-18 stimulation and the fraction of Eomes-/T-bet+ in CD56dim and CD56bright NK cells. When exploring time to viral rebound after stopping ART among the 44 SPARTAC participants, no single NK phenotypic marker correlated with control. Higher levels of IL-12/IL-18 mediated NK cell degranulation at baseline were associated with longer times to viral rebound after treatment interruption (P=0.028). Additionally, we found higher fractions of CD56dim NK cells in individuals with lower levels of HIV DNA (P=0.048). NKG2A and NKp30 levels in CD56neg NK cells were higher in patients with lower HIV DNA levels (p=0.00174, r=-0.49 and p=0.03, r= -0.327, respectively) while CD27 levels were higher in those with higher levels of HIV DNA (p=0.026). These data show NK cell functions are heterogeneously impacted by HIV infection with a mixed picture of resolution on ART, and that while NK cells may affect HIV DNA levels and time to viral rebound, no single NK cell marker defined delayed viral rebound.
Introduction
Despite the effectiveness of antiretroviral therapy (ART) in controlling and preventing HIV infection, efforts are still focusing on a cure to overcome the stigma and the disadvantages of lifelong therapy (1). Recent cure trials suggest that while a sterilising cure will be extremely difficult, a period of ART-free viral control may be feasible (2). In a small subset of individuals termed ‘post treatment controllers’ (PTCs), stopping ART is not followed by immediate viral rebound in plasma (3). Understanding the immunological mechanisms that underlie a PTC phenotype may provide important targets for cure efforts.
Elite controllers (EC), who spontaneously control HIV without therapy for more than 6 months, frequently have well-defined, strong anti-HIV CD8 T cell responses and are enriched for protective HLA Class I alleles (4) (5). In addition, animal studies exploring PTC following broadly neutralising antibody (bNAb) therapy have identified CD8 T cells as potential mediators of long-lasting viral control (6, 7). Natural killer (NK) cells may also be a potential effector of PTC. Similar to CD8 T cells, NK cells have the ability to clear infected cells through multiple mechanisms including exocytosis of cytotoxic granules leading to lysis, signalling through TNF death receptors and antibody dependent cell cytotoxicity (8, 9). The application of this function to HIV cure has gained traction as animal studies using bNAbs against HIV (10) have suggested a role for NK cells to augment responses targeting the HIV reservoir (11). Animal models of non-pathogenic SIV corroborate this NK cell potential as they appeared to control SIV replication in the lymph nodes of African green monkeys (12). In humans, properties of NK cells including NK cell subset distribution, activation and the expression of activating NK receptors have correlated with changes in HIV DNA reservoir size and decline (13, 14).
A role for NK cells in PTC has also been inferred from several studies indicating that PTCs are immunologically distinct from elite controllers (EC), and therefore may not rely on CD8 mediated control (15). Unlike ECs, PTCs do not have strong CD8 specific responses (3) or an enrichment of protective CD8 HLA Class I alleles (3, 16). The exact mechanisms of PTC - or clinical markers identifying these individuals - remain undetermined. Understanding the factors that contribute to viral rebound and lower HIV DNA levels could therefore help determine factors important for post-ART control.
As HIV infection is likely to disrupt NK cell functionality, any restorative effect of ART may provide important insights into specific cell phenotypes and properties that need to be sustained for viral control. Several studies have examined the effect of ART on NK cell function and phenotype with discrepancies regarding the ability of therapy to restore NK cell recovery after HIV infection (reviewed in (8, 17)). While many studies suggest NK cells recover after ART, some have suggested that not all NK cell parameters return to their pre-HIV state (17). However, the majority of these studies were performed in chronically treated HIV individuals (18, 19), after several years of ART, or without longitudinal data (20).
To address these issues in primary HIV infection - where PTC is more frequently reported - (3, 21), we undertook a study of PWH who commenced treatment shortly after seroconversion in which some subsequently undertook a treatment interruption. The study was devised in two halves – first to examine whether early treatment could restore any NK dysfunction or phenotypic changes, and the second to evaluate if these NK-associated parameters were associated with time to viral rebound in participants who stopped ART. The ‘HIV Reservoir targeting with Early Antiretroviral Therapy’ (HEATHER) cohort comprised individuals starting and maintaining ART close to the time of HIV acquisition (22) and was key to the first half of the work, providing the opportunity to look in detail at longitudinal changes of NK cell properties after ART initiation in PHI. The Short-Pulse Anti-Retroviral Therapy at Seroconversion (SPARTAC) study (23) was the focus of the second half of the study and included a treatment interruption (with documented times to viral rebound and HIV DNA levels) allowing exploration of those NK cell phenotype and function parameters identified in the first part. By comparing the data from these two cohorts we aimed to determine whether NK cell markers that were impacted by early ART would also be those that mapped onto individuals showing evidence of PTC. If this was the case, it would provide a rationale for targeting NK cells in cure strategies.
Materials and methods
Participants
All participants gave written, informed consent. Recruitment for the HEATHER cohort was approved by the West Midlands—South Birmingham Research Ethics Committee (reference 14/WM/1104). HEATHER is a prospective observational cohort study of individuals who commence ART (and remain on uninterrupted therapy) within 3 months of the date of HIV diagnosis during PHI (22). Individuals are considered to have PHI if they meet any of the following criteria: HIV-1 positive antibody test within 6 months of a HIV-1 negative antibody test, HIV-1 antibody negative with positive PCR (or positive p24 Ag or viral load detectable), RITA (recent infection assay test algorithm) assay result consistent with recent infection, equivocal HIV-1 antibody test supported by a repeat test within 2 weeks showing a rising optical density or having clinical manifestations of symptomatic HIV seroconversion illness supported by antigen positivity. The time of seroconversion was estimated as the midpoint between the most recent negative or equivocal test and the first positive test for those who met relevant criteria, and as the date of test for all other participants. Individuals with co-existent active hepatitis B or C infection were not eligible for inclusion in HEATHER. CD4 count, CD8 count and VL were measured as part of routine clinical care with baseline VL and CD4 and CD8 counts taken as the earliest value prior to the initiation of ART. All blood samples were collected in (Acid Citrate Dextrose) ACD tubes.
SPARTAC (EudraCT Number: 2004-000446-20) was a multi-centre randomized controlled trial of short course antiretroviral therapy during PHI, which completed follow up in 2010. The full inclusion criteria and details of the SPARTAC trial are published elsewhere (23). PHI was defined and estimated date of seroconversion calculated similarly to the HEATHER cohort. In this work, we examined samples collected 12 weeks post ART initiation as that was the timepoint closest to baseline where samples were still available for analysis. For this study n = 44 participants who were randomly allocated to receive 48 weeks of ART are included. Ethical approval can be found in the Supplementary Methods section.
HIV-uninfected control populations
Eight healthy volunteers were recruited into the study as part of the HIV seronegative control group. PBMCs were isolated from these volunteers and cryopreserved for subsequent use in the NK cell phenotypic and functional panels. Demographic information for this cohort can be found in Table 1.
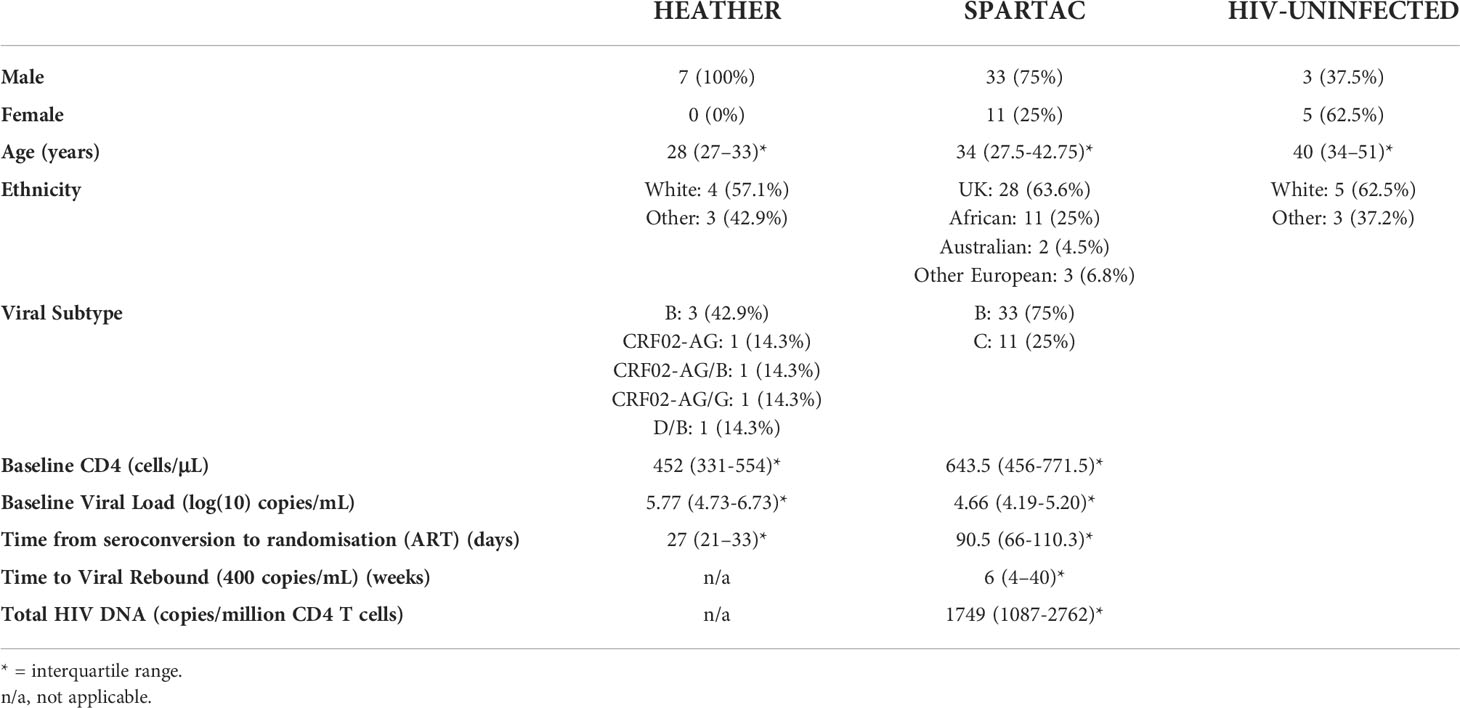
Table 1 Demographics of cohorts.
Cell culture
Frozen peripheral blood mononuclear cells (PBMC) were thawed and either immediately stained for phenotyping experiments or cultured for functional assays. For functional assays, PBMC were either cultured overnight in RPMI-1640 media with 10% FCS, L-glutamine and penicillin/streptomycin (R10) alone or were stimulated with 10ng/mL IL-12 (PeproTech, Rocky Hill USA) and 100ng/mL IL-18 (R&D Systems, Minneapolis USA). PBMC (both R10 and cytokine treated) were either co-cultured alone or with the K562 cell line at a 5:1 effector (PBMCs):target (E:T) ratio in a 96U bottom plate for 5 hours in the presence of CD107a PECy7 (Biolegend, San Diego USA). After 2 hours of co-culture GolgiStop and GolgiPlug (BD Biosciences, San Jose USA) were added to the cultures as per manufacturer’s recommendations. After co-culture, cells were washed and stained for flow cytometry.
Flow cytometry
For phenotyping experiments, cells were divided into an extracellular and intracellular panel. For the extracellular panel, cells were washed and stained at 4°C for 30 minutes with: Live/Dead fixable near-IR stain (ThermoFisher Scientific, Waltham USA), CD3 APC-Cy7 (HIT3a), CD14 APC-Cy7 (HCD14),CD19 APC-Cy7 (HIB19), CD56 BV421 (HCD56) [all Biolegend], CD16 FITC (CB16) [eBioscience, San Diego USA], NKG2A APC (REA110), NKG2C PEVio770 (REA205) [both Miltenyi Biotec, Bergisch Gladbach Germany], NKG2D PerCpCy5.5 (1D11), NKp30 PE (P30-15), NKp46 PE/Dazzle (9E2) [all Biolegend]. Cells were then washed twice with FACS buffer (PBS + 5% FCS + 1mM EDTA) and fixed with 2% formaldelhyde solution.
For the intracellular panel cells were washed and stained at 4°C for 30 minutes with: Live/Dead fixable near-IR stain (ThermoFisher Scientific), CD3 APC-Cy7 (HIT3a), CD14 APC-Cy7 (HCD14),CD19 APC-Cy7 (HIB19), CD56 BV421 (HCD56), CD16 PECy7 (3G8) [all Biolegend], Tim-3 PE (344823) [R&D Systems], CD27 Alexa Fluor 700 (O323), CD57 PE Dazzle (HNK-1), CD38 PerCpCy5.5 (HB-7) [all Biolegend]. Cells were then washed twice with FACS buffer. Cells were then fixed and permeabilised using the Human FoxP3 Buffer Set (BD Biosciences). Cells were first fixed in in 1x Buffer A for 10 minutes at room temperature. Cells were then washed with FACS buffer and resuspended in Buffer C for 30 minutes at room temperature. Cells were then washed twice with FACS buffer and then stained with EOMES eFluor 660 (WD1928) [eBioscience] and T-bet FITC (4B10) [Biolegend] at 4°C for 30 minutes.
For functional assays, cells were stained at 4°C for 30 minutes with: Live/Dead fixable near-IR stain (ThermoFisher), CD3 APC-Cy7 (HIT3a), CD14 APC-Cy7 (HCD14), CD19 APC-Cy7 (HIB19), CD56 BV421 (HCD56) [all Biolegend], and CD16 FITC (CB16) [eBioscience]. Cells were then washed twice with FACS buffer. Cells were permeabilised using BD FACS Permeabilizing solution 2 (BD Biosciences) for 10 minutes at room temperature. Cells were then washed once with FACS buffer and once with 1x Brilliant Stain Buffer (BD Biosciences). Cells were subsequently stained at 4°C for 30 minutes with: IFN-γ BV605 (BD Biosciences), TNF APC (Mab11), Granzyme A PerCpCy5.5 (CB9) [all Biolegend], Granzyme B Alexa Fluor 700 (GB11) [BD Biosciences], and Perforin PE (B-D48) [Biolegend] prior to being washed twice with FACS Buffer. All cells were run on a BD LSR II. Rainbow Calibration Particles (8 peaks) [BD Biosciences] were used to calibrate the machine to minimise daily variation.Total HIV DNA was measured as previously described (24). Briefly, CD4 T cells were enriched from frozen PBMC samples via negative selection (Dynabeads, Invitrogen, Carlsbad, CA). CD4 T cell DNA was then extracted (Qiagen, Venlo, Netherlands) and used as input DNA for PCR analysis.
CMV serology methods
Plasma from the SPARTAC cohort was taken from the 12 week timepoint and were tested for CMV IgG using the Abbott Architect i2000SR platform (Abbott, Chicago, IL, USA). The assay was performed by trained laboratory staff, in accordance with the manufacturer’s instructions, in a UK Accreditation Service (UKAS) accredited laboratory.
Statistics
Analyses were performed and plots generated using GraphPad Prism (v7.0b). Except where otherwise specified, p-values < 0.05 were considered statistically significant. Simple comparisons were performed using parametric or non-parametric tests as appropriate and are described alongside the results and in figure legends. Datasets were explored both as continuous variables or as categorical variables stratifying data above/below median or mean values, accordingly. Longitudinal analysis was performed using GraphPad Prism version 9.1.2. A Kruskal-Wallis test with Dunn’s multiple comparisons test was performed comparing baseline values with 3 months post ART and uninfected controls and 2 years post ART with uninfected controls. Viral rebound after TI was defined as a plasma viral load >400 HIV RNA copies/ml on a least two consecutive measurements.
Results
Longitudinal effect of ART on NK cells following PHI
For the first component of the study, we aimed to identify those NK markers which were impacted by starting ART in PHI in the HEATHER cohort, with the aim - in the second part of the study - of seeing how these markers predicted time to rebound in a different PHI cohort (SPARTAC).
We identified seven participants from the HEATHER cohort who were all men who had sex with men (MSM), started ART during PHI and for whom longitudinal samples were available from before ART (baseline), 3 months, 1 year and 2 years post ART initiation. Their clinical characteristics are summarised in Table 1. The median age (interquartile range, IQR) was 28 (25–31). Their median CD4 T cell count was 452 cells/μL (286–607) and median viral load was 5.77 log copies/mL (4.73log-6.73log) at baseline. The median time from seroconversion to ART start was 27 days (21–23, 25–34).
We first explored how NK cell function and phenotype were impacted by early HIV infection in comparison to HIV uninfected samples, and the extent to which this was reversed by ART over two years (Figure 1). Our HIV-uninfected participants had a median age of 40 (34–65) and were mostly female (5/8) (Supplementary Table 1).
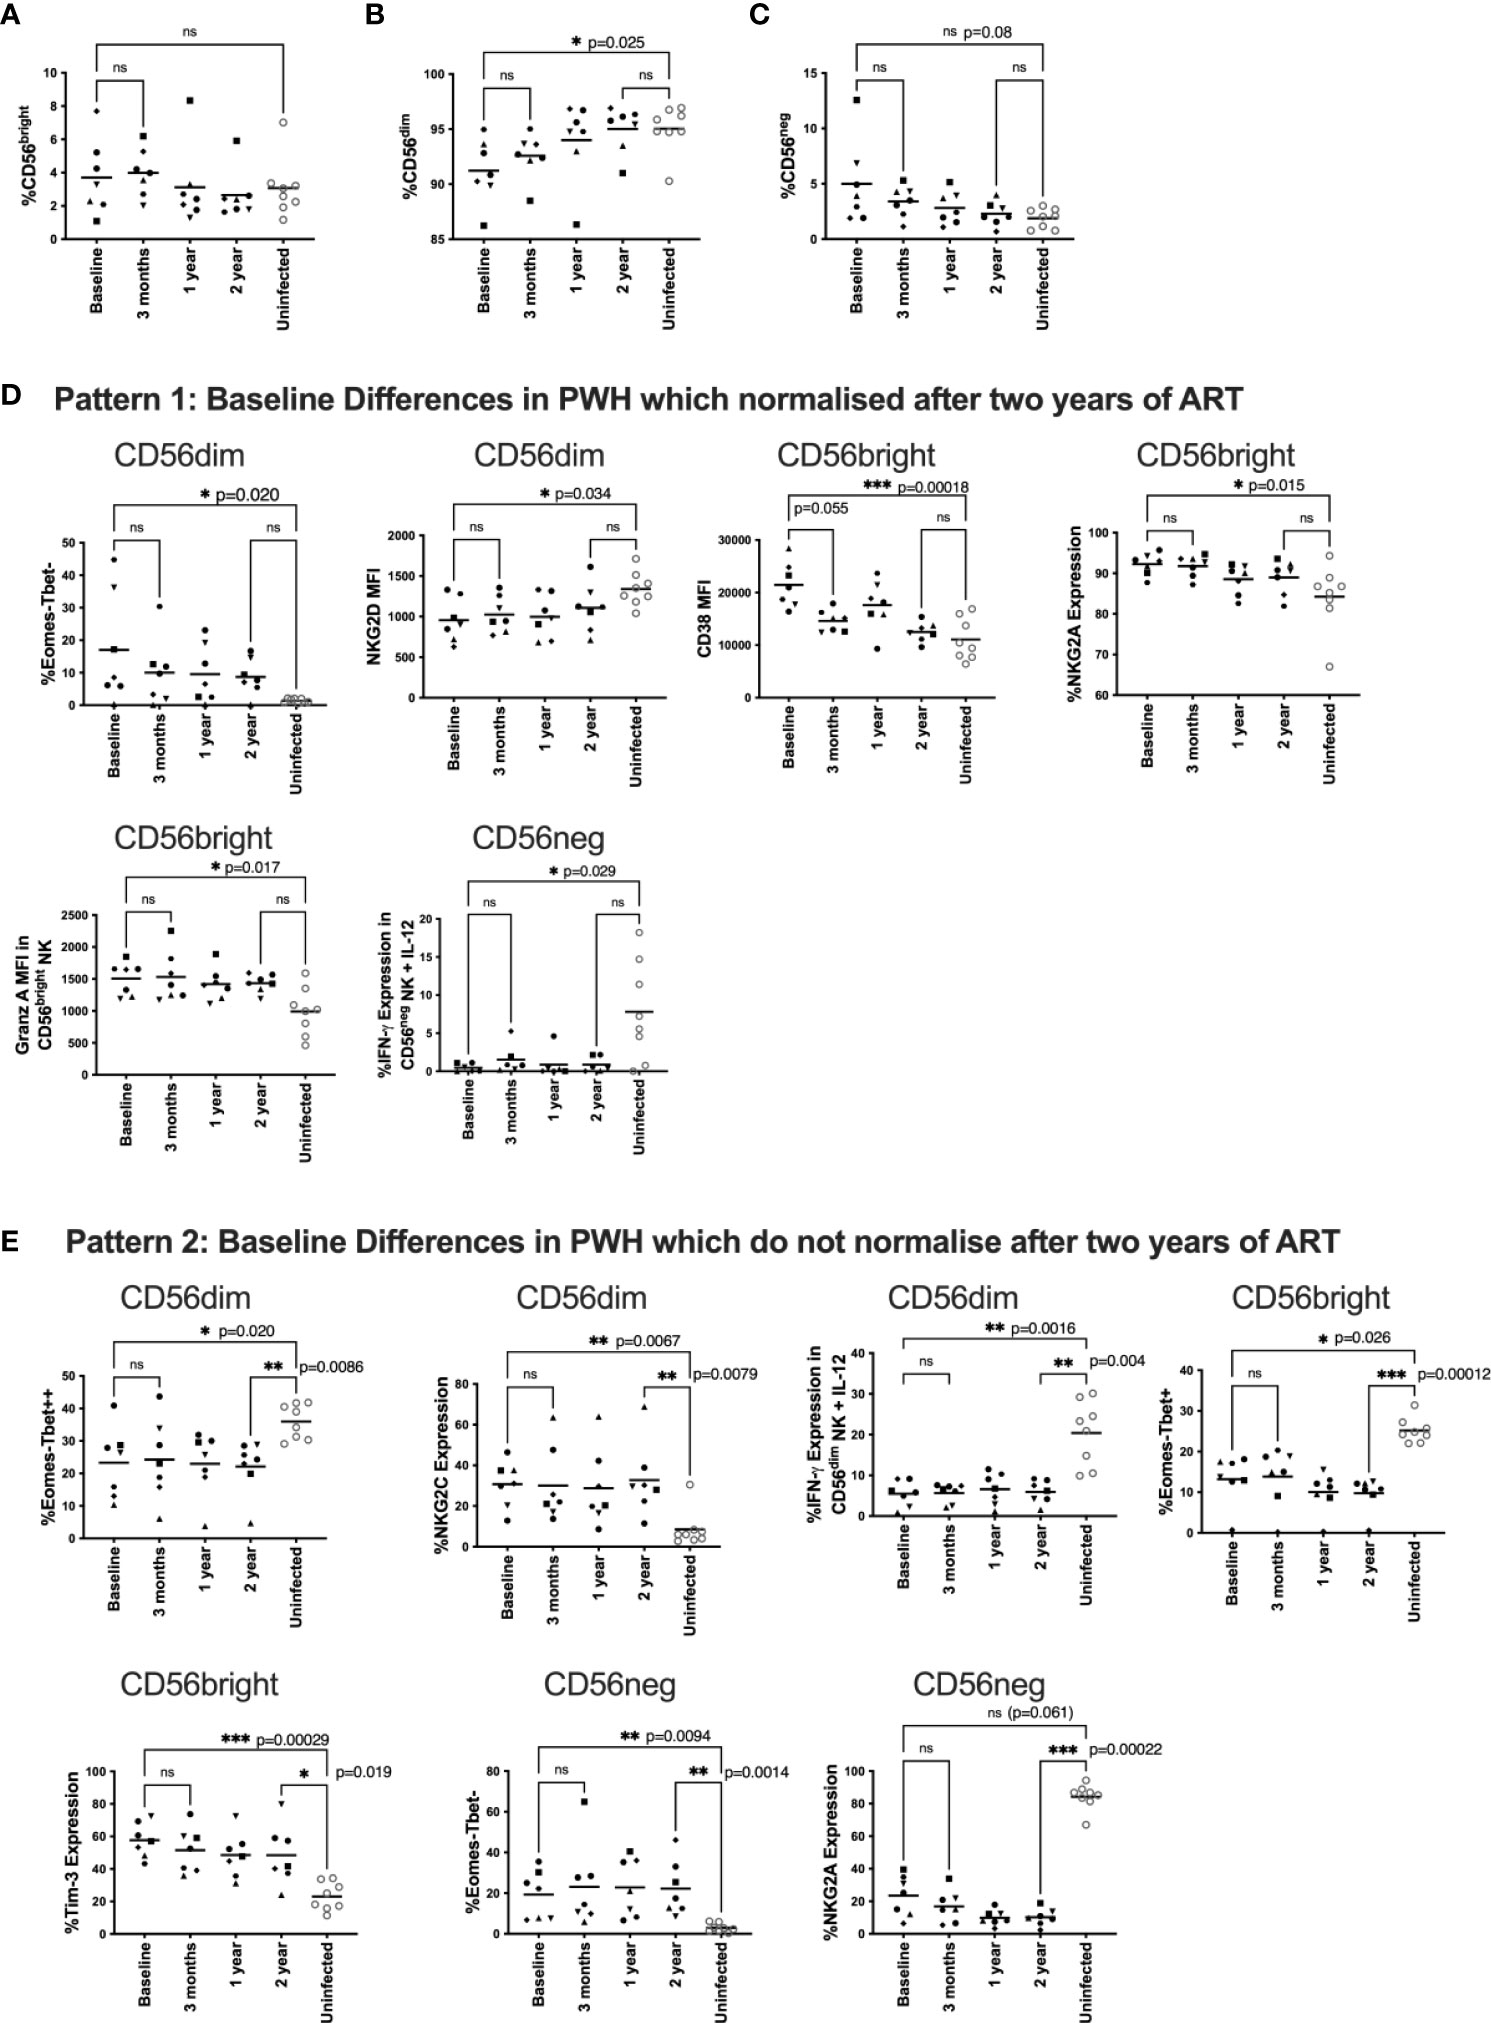
Figure 1 Changes to NK phenotype and function longitudinally on ART.PBMC from HEATHER samples were taken at baseline (off ART), 3 months, 1 year and 2 years post ART and compared to HIV uninfected individuals. HEATHER samples (n = 7) and HIV uninfected samples (n = 8) were stained for CD56 and analysed based on the expression of this marker into CD56bright, CD56dim, and CD56neg NK cells at each timepoint (A–C). Downstream analysis was performed on phenotypic and functional markers within the CD56 expressing populations. These are grouped to show those that were statistically different at baseline between PWH and HIV negative controls but then either corrected after two years of ART (D), or remained statistically different after two years of ART (E). For panels (D, E), phenotypic and functional markers are presented as percent expression or median fluorescence intensity (MFI). For all data, only samples with statistical differences between HIV infected and HIV uninfected individuals are shown. A Kruskal-Wallis test with Dunn’s multiple comparison test was performed between baseline and 3 months ART, baseline and uninfected samples, and 2 year and uninfected samples. *P < 0.05; **P < 0.01; ***P < 0.001; ns not significant.
First, we characterised NK cell subsets based on CD56 and CD16 expression including CD56bright, CD56dim, and CD56neg NK cells. For clarity, for these and subsequent analyses in the HEATHER participants we focus on differences between baseline and two years (more detailed statistical comparisons for other timepoints are shown in Supplementary Material). The gating strategy is shown in Supplemental Figure 1. We found no statistical difference in the fraction of CD56bright cells between PWH and HIV-uninfected individuals (Figure 1A) but there was a reduced fraction of CD56dim NK cells in PWH at baseline that normalised post-ART initiation when compared to uninfected individuals (p=0.025, Figure 1B). Additionally, there was a trend towards higher CD56neg NK cell frequencies in HIV-infected participants at baseline compared to uninfected individuals that was no longer apparent after ART (p=0.08, Figure 1C). We then examined the overall frequencies of NK cells per total lymphocytes and found no statistical difference over time (Supplemental Figure 2)
NK cells were first analysed by exploring their phenotypic markers and then by looking at cell function. We examined phenotypic markers including: the activation marker CD38; transcription factors T-bet and Eomes; the exhaustion marker Tim-3; phenotyping markers CD27 and CD57; the inhibitory receptor NKG2A; and the activating receptors NKG2C, NKG2D, NKp30, and NKp46. Gating strategies for these markers are shown in Supplemental Figure 3.
We tested NK cell function using two models: first by co-culturing cells with the MHC I negative cell line K562 as an NK target, and second by testing NK cell responsiveness to the cytokines IL-12 and IL-18. We stained NK cells with markers for IFN-γ, TNF, perforin, granzyme A, granzyme B and CD107a. Gating strategies are shown in Supplemental Figure 4. For this analysis we examined: granzyme A, granzyme B and perforin levels in untreated samples; CD107a expression using K562 co-cultured cells; and IFN-γ and TNF production in IL-12/IL-18 treated cells (n=6).
To undertake the analysis, we looked at patterns of these different NK cell markers before and after ART compared to HIV-uninfected participants (n=8). Figures 1D, E shows only those markers where there was a statistical difference for at least one of the comparisons; all other analyses are presented in the Supplementary Materials. We found three general patterns. The first pattern included markers that were impacted by HIV infection (i.e. significantly different between PWH and HIV-uninfected individuals off ART) but then normalised over 2 years of ART (Figure 1D). These markers included at baseline: a higher fraction of Eomes-/T-bet- CD56dim NK cells, lower NKG2D levels on CD56dim NK cells, higher CD38 levels on CD56bright NK cells, higher NKG2A expression on CD56bright NK cells, increased granzyme A levels on untreated CD56bright NK cells and reduced IFN-γ expression in cytokine stimulated CD56neg NK cells.
The second pattern included markers which were different in HIV infected individuals at baseline compared with HIV uninfected participants, and maintained that difference after two years of ART (Figure 1E). In HIV-infected individuals, these markers included a lower fraction of Eomes-/T-bet++ CD56dim NK cells, higher expression of NKG2C on CD56dim cells, reduced IFN-γ expression in cytokine stimulated CD56dim NK cells, a lower fraction of Eomes-/T-bet+ CD56bright NK cells, higher expression of Tim-3 on CD56bright cells, and a higher percentage of Eomes-T-bet- CD56neg cells. There was also a trend for a baseline difference in NKG2A expression on CD56neg cells (p=0.061), which did not reverse after 2 years of ART (Figure 1E).
The third pattern comprised NK cell markers with no statistical difference between HIV infected and uninfected individuals at baseline or 2 years after ART (Supplemental Figures 5 and 6).
There was no statistical difference in any marker in PWH between samples at baseline and 12 weeks after ART initiation suggesting any ART mediated recovery of NK cell phenotype and function was not immediate (Figure 1). We did see a trend toward lower CD38 levels in CD56bright NK cells after 12 weeks of ART (Figure 1D p=0.055) suggesting activation levels were the first to decrease after ART initiation.
NK cell phenotype and time to viral rebound
Having explored the impact of ART on NK phenotype and function, we turned to the second part of the study and a different cohort to determine if those NK markers identified in the first part were associated with correlates of HIV reservoir size and dynamics of viral rebound following ART cessation. We studied 44 participants from the SPARTAC trial [22] who received 48 weeks of ART and then stopped therapy. Their summarised clinical characteristics are shown in Table 1. Median baseline viral load (IQR) was 45,643 copies/mL (15,414-15,125), baseline CD4 T cell count was 644 cells/μL (456-771.5), median time to viral rebound was 6 weeks (1-40) and median total HIV DNA copies/million CD4 T cells at treatment interruption was 1749 (1087-2762). Median estimated time from seroconversion to ART initiation was 90.5 days (66-110.3)
We first examined whether the relative frequencies of CD56bright, CD56dim, and CD56neg NK cells correlated with time to viral rebound or were enriched in individuals with faster or slower times to viral rebound. For this latter analysis the dataset was divided into two groups based on the median time to viral rebound, < or ≥ 6 weeks. We found no correlation with time to viral rebound or any difference for any of these NK cell populations between the two groups (Figure 2A and Supplemental Table 1).
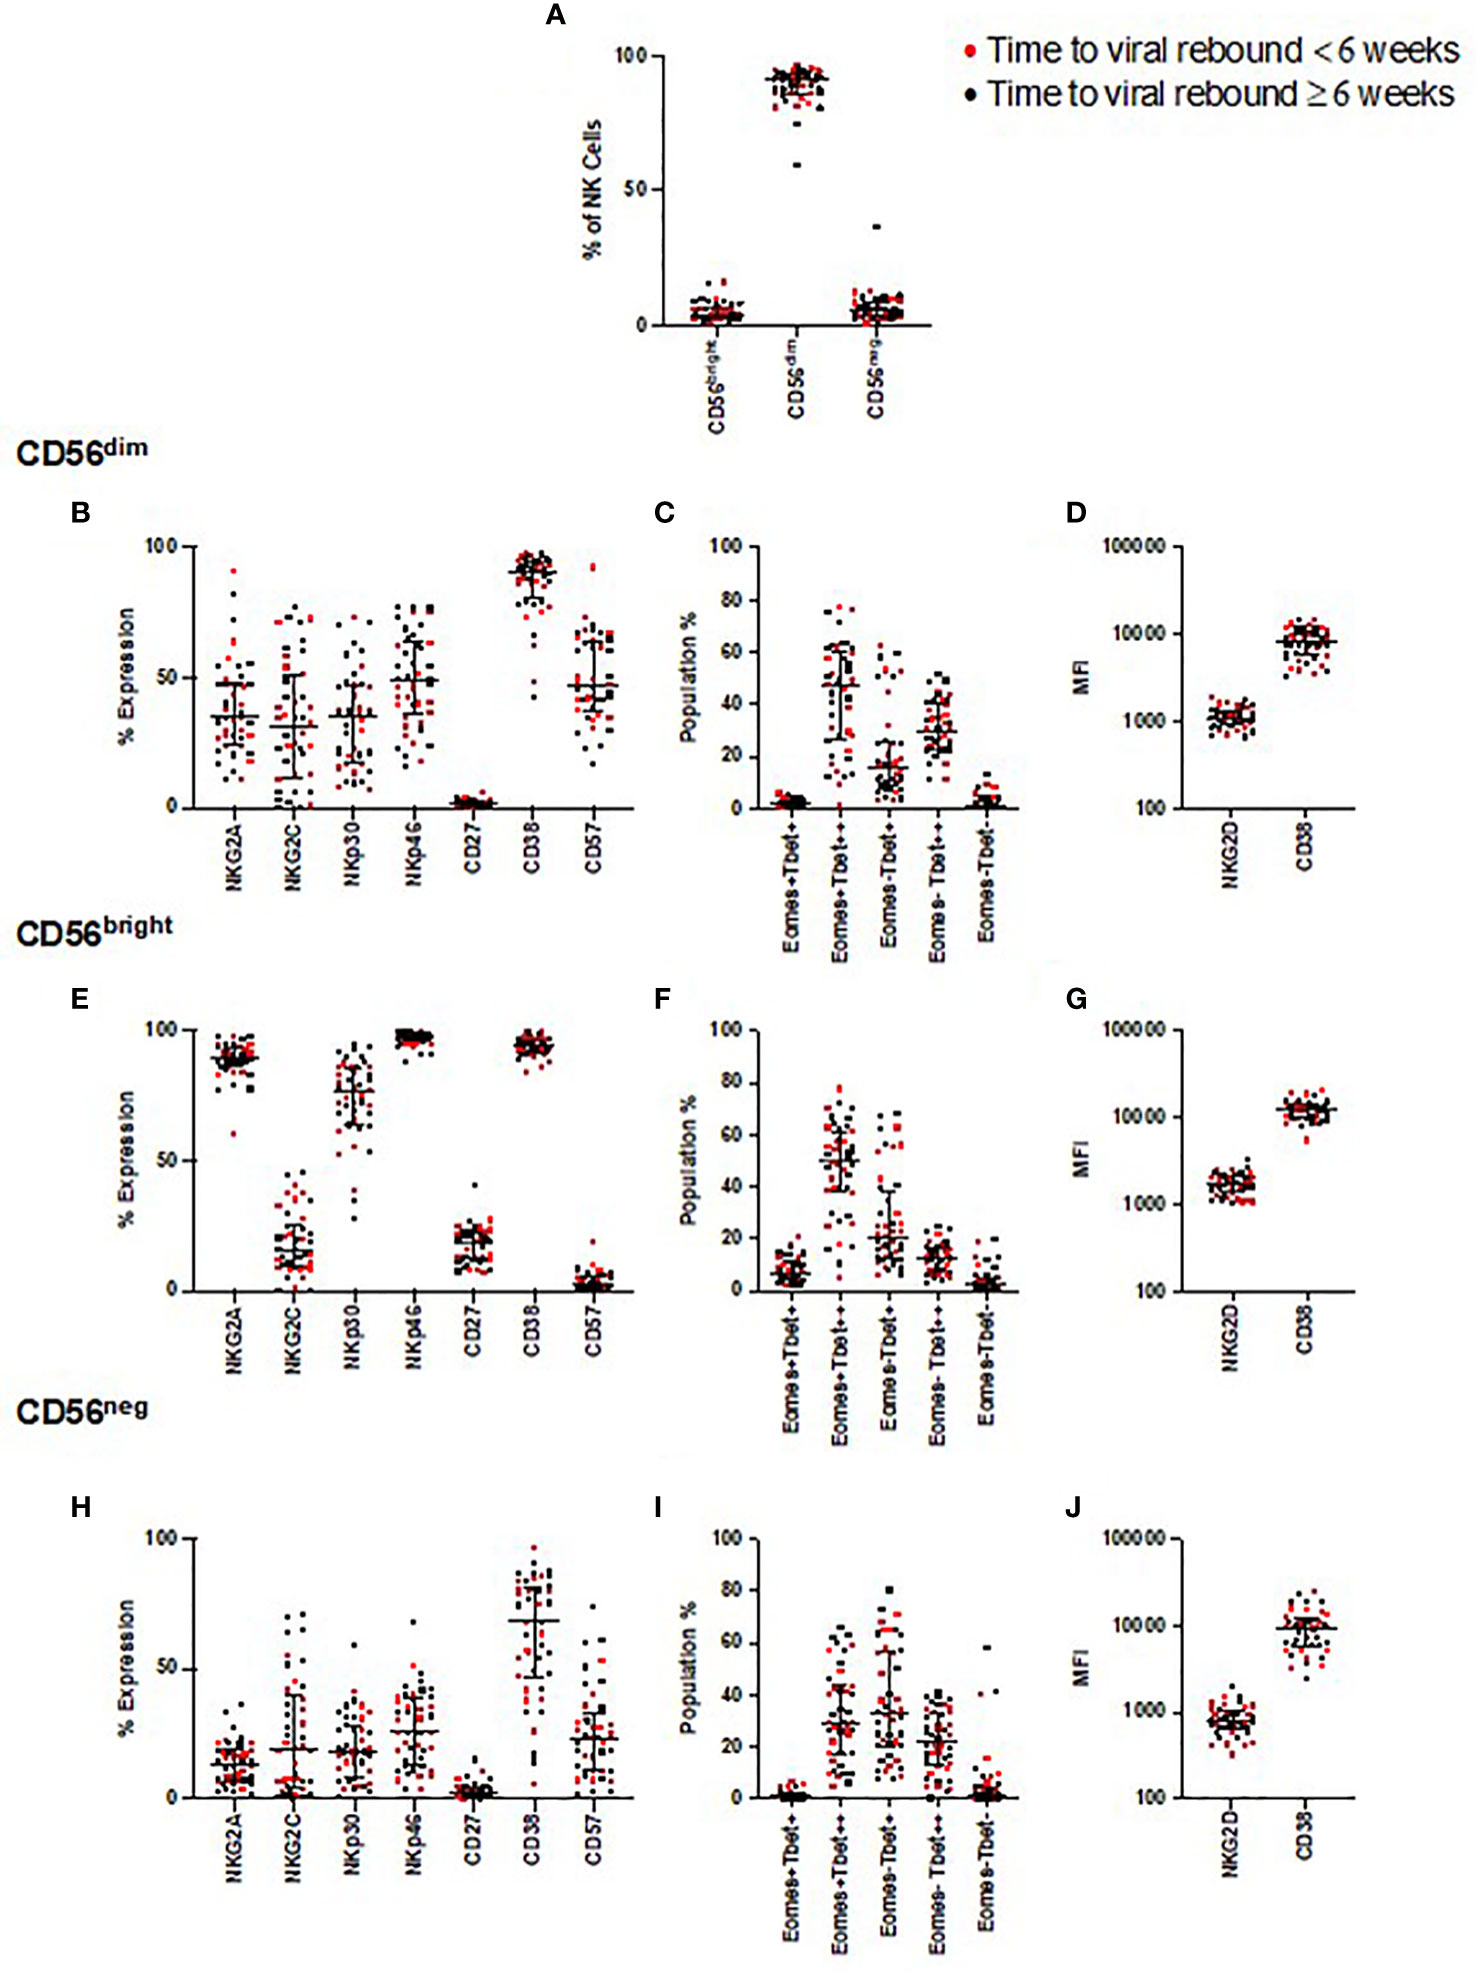
Figure 2 NK cell phenotyping and time to viral rebound. PBMC from SPARTAC patients (n = 44) were stained and divided into CD56dim, CD56bright, and CD56neg NK cells (A). Red circles indicate individuals with time to viral rebound < 6 weeks and black circles indicate individuals with time to viral rebound ≥ 6 weeks. Expression as a percent or median fluorescent intensity is shown for CD56dim NK cells (B–D), CD56bright (E–G) and CD56neg NK cells (H–J). For all graphs, median values with interquartile range are shown. A blue box represents those that were different at baseline but corrected over 2 years of ART, a red box represents those that were different at baseline but which did not correct after two years of ART.
We examined expression of the same NK cell phenotypic markers used in the longitudinal study, and looked for associations with time to viral rebound. We found no correlations with any of these phenotypic markers and time to rebound (Figure 2) nor did we find enrichment of these markers in those with < or ≥ 6 weeks to viral rebound (Supplemental Table 1).
As the participants demonstrated a range of times to viral rebound, we next focused on those with the longest period of PTC, in case they represented an extreme phenotype. We identified those participants whose time to viral rebound was >1 year after TI (n=8), a cut-off similar to other PTC studies (32, 33). We found no distinct separation of individuals with viral rebound after one year compared to the rest of the cohort for any phenotypic marker we examined (Supplemental Figure 7). Instead, we found these individuals were distributed among the rest of the cohort, suggesting no single NK cell marker defined PTC in these participants.
NK cell function and time to viral rebound
In addition to the K562 and IL-12/18 stimulation used in the longitudinal experiments, we also combined the models to examine the effect of activating NK cells with cytokines before co-culturing them with K562 cells (Figures 3A–I). We examined all markers in all conditions and compared participants who rebounded either within 6 weeks (red markers in Figures 3A–I) or ≥6 weeks (black markers in Figures 3A–I). Examining functional responses in CD56dim (Figures 3A–C), CD56bright (Figures 3D–F) and CD56neg (Figures 3G–I) NK cells, we found no difference according to this categorical time to rebound.
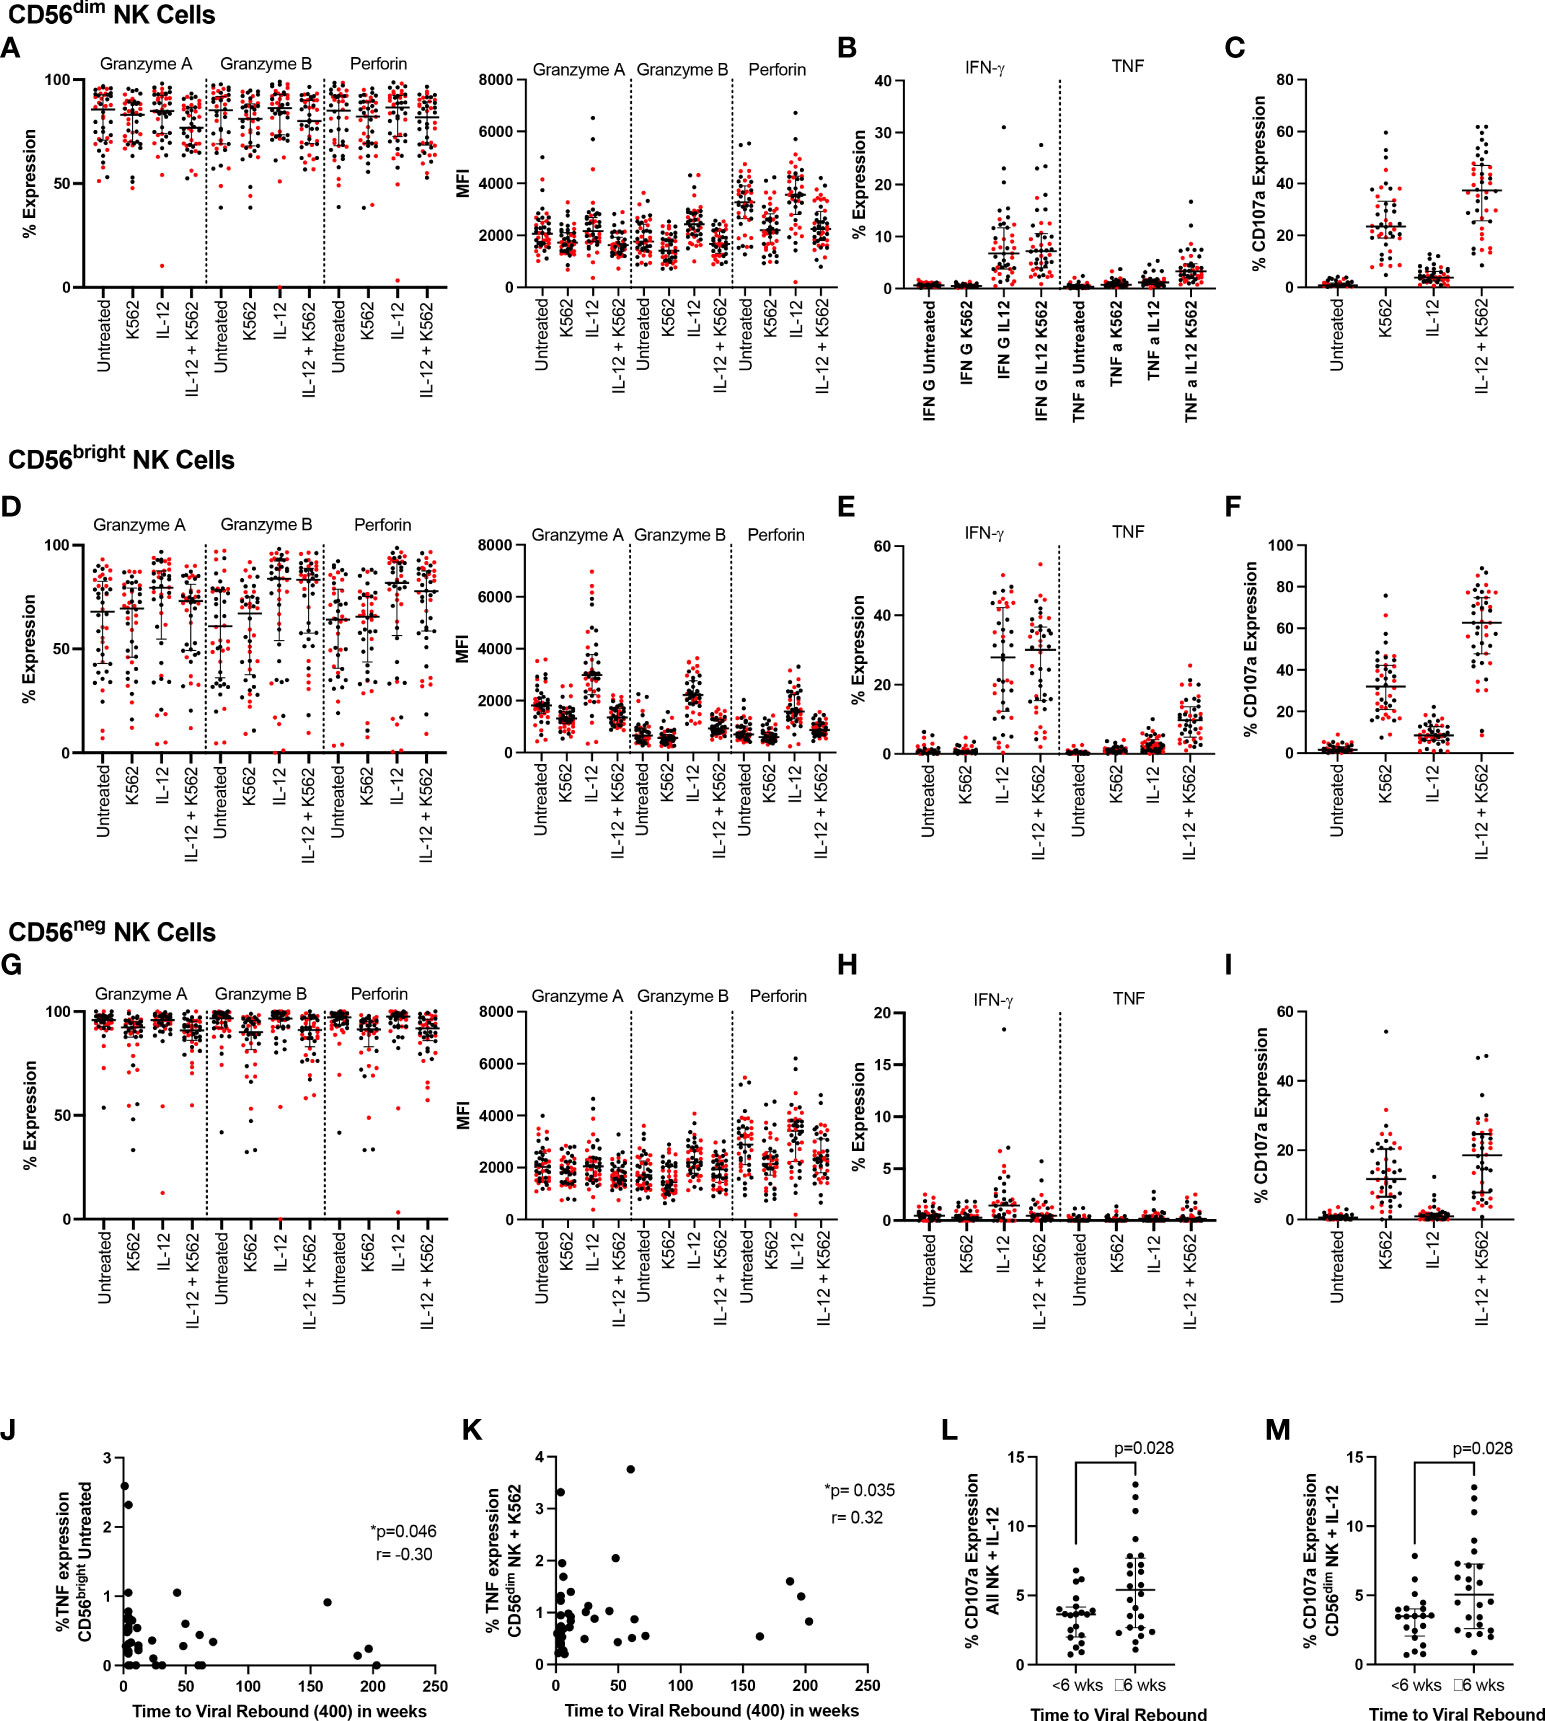
Figure 3 NK cell function and time to viral rebound. PBMC from SPARTAC participants (n = 44) were either cultured overnight in media or stimulated with 10ng/mL IL-12 and 100ng/mL IL-18. Cells were then cultured alone or with K562 cells at a 5:1 E:T ratio for 5 hours in the presence of CD107a. Cells were then stained intracellularly for granzyme (A), granzyme (B), perforin, IFN-γ and TNF. Red circles indicate individuals with time to viral rebound < 6 weeks and black circles indicate individuals with time to viral rebound ≥ 6 weeks. Expression as a percent or median fluorescent intensity is shown for CD56dim NK (A–C), CD56bright NK (D–F) and CD56neg NK cells (G–I). In (J) and (K), time to viral rebound was correlated with TNF expression in untreated CD56bright NK cells and TNF expression in untreated CD56dim NK cells co-cultured with K562 cells, respectively. A Spearman test was used and p and r values are shown. (L) and (M) show comparisons between individuals with time to viral rebound < 6 weeks compared to ≥ 6 weeks for CD107a expression in all NK cells (L) and CD56dim NK cells (M) stimulated with IL-12 and IL-18. For all graphs, median values with interquartile range are shown.
We then examined whether any functional markers were associated with time to viral rebound as a continuous function. We found baseline TNF expression in untreated CD56bright NK cells negatively correlated with time to viral rebound (Figure 3J p=0.046, r=-0.302) while TNF levels in CD56dim NK cells co-cultured with K562 cells positively correlated with time to viral rebound (Figure 3K p=0.035, r=0.319). We also saw higher levels of CD107a in bulk NK cells and CD56dim NK cells treated with IL-12 and IL-18 in individuals who rebounded ≥ 6 weeks (Figures 3L, M, p=0.028 for both). However, we did not see a difference when cells were co-cultured with K562 cells, suggesting this was a potentially small difference that was overcome with a stronger degranulation stimulus (Supplementary Table 1).
We again examined whether individuals who rebounded after a year off ART clustered separately. Similar to our phenotypic markers, we found those who rebounded after a year were distributed among the rest of the cohort suggesting no clear PTC phenotype based on NK cell function (Supplemental Figure 8).
NK cell phenotype and HIV DNA levels
Next, we examined NK cell phenotypic markers and their relationship with total HIV DNA levels measured in bulk CD4 T cells at the time of ART interruption. NKG2A and NKp30 expression in the CD56neg population negatively correlated with HIV DNA (Figures 4A, B; p=0.00174, r=-0.459 and p=0.03, r= -0.327, respectively). The Eomes-T-bet- population in both CD56bright and CD56neg NK cells also negatively correlated with HIV DNA (Figures 4C, D p=0.0055 r=-0.41, p=0.033 r=-0.32 respectively). Expression of the activation marker CD38 in the CD56bright population positively associated with HIV DNA (Figure 4E p=0.034, r=0.32).
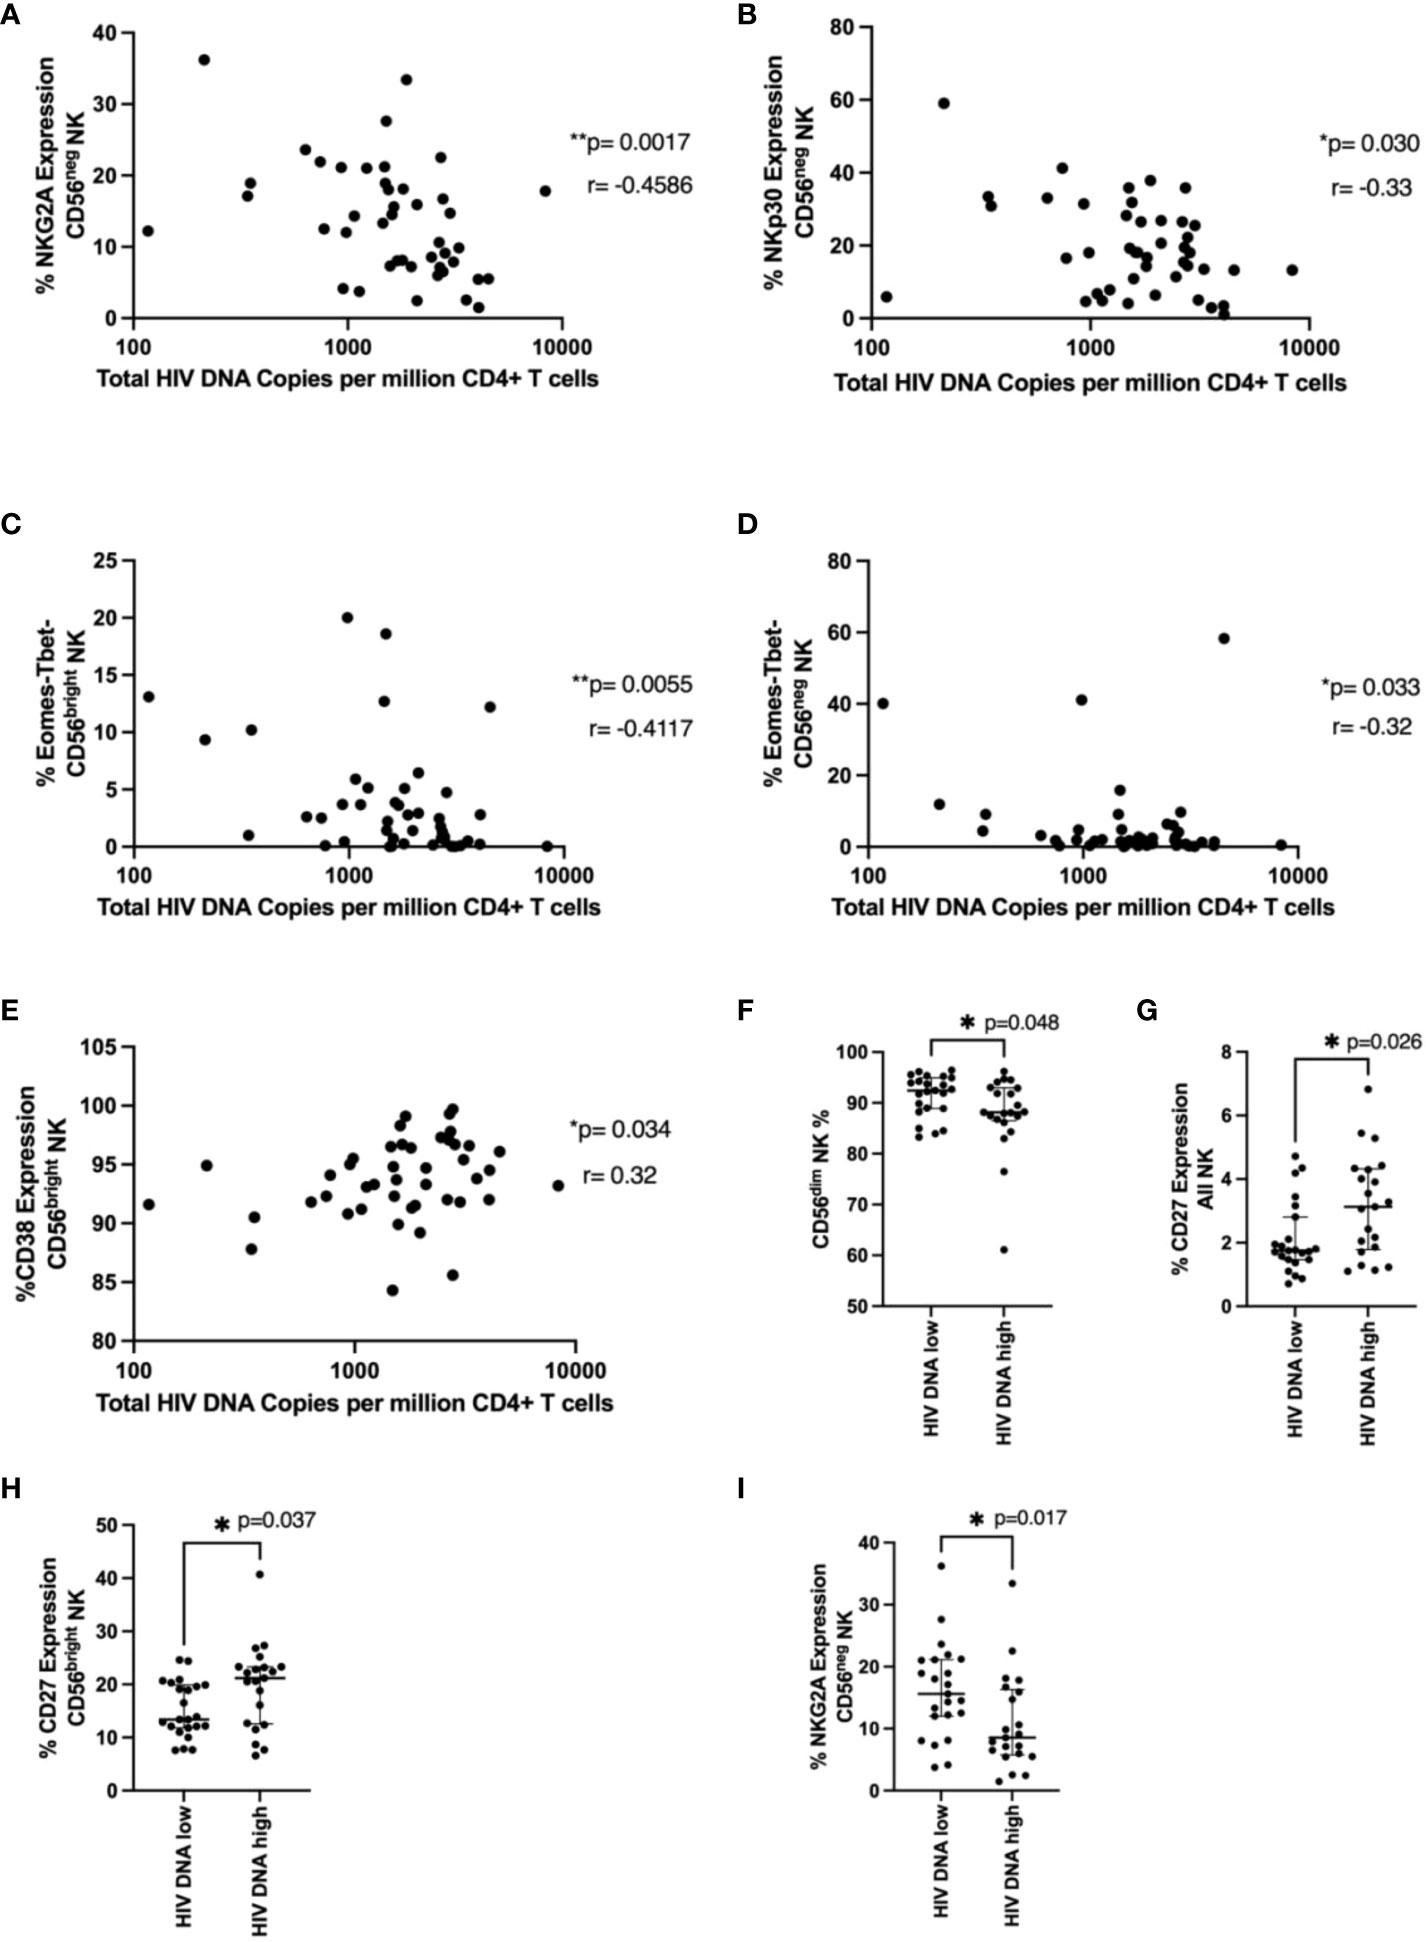
Figure 4 NK cell phenotype and HIV DNA levels. In (A–E), total HIV DNA at 48 weeks (log scale) was correlated with the indicated NK cell marker in the indicated NK cell population using a Spearman correlation. p and r values are shown. In (F–I), a Mann-Whitney test was performed between individuals with < or ≥ median HIV DNA levels (1749 HIV copies/million CD4 T cells) for the indicated marker and NK cell population. p values are shown. * represents p < 0.05, ** represents p < 0.01 (n = 44).
We next wanted to see if specific NK cell phenotypic markers were enriched in those with higher or lower levels of HIV DNA. Similar to our time to viral rebound studies we divided our cohort into those with < or ≥ median HIV DNA levels of 1749 HIV copies/million CD4 T cells. We found significantly higher fractions of CD56dim NK cells in individuals with lower HIV DNA levels (Figure 4F, p=0.048) suggesting cytotoxic NK cells may be important for limiting HIV DNA levels. We also found levels of CD27 positive NK cells and CD56bright NK cells were significantly higher in individuals with higher levels of HIV DNA (Figures 4G, H, p=0.026 and p=0.037 respectively). Previous studies have shown upregulation of CD27 during HIV infection, particularly during chronic HIV infection (20). Finally, we also saw significantly lower levels of NKG2A in CD56neg NK cells in patients with higher HIV DNA levels (Figure 4I, p=0.017), supporting the findings from the correlation analysis.
NK cell function and HIV DNA levels
We examined the relationship between NK functional markers and HIV DNA levels. We found expression of TNF after K562 co-culture in NK cells and CD56dim NK cells negatively correlated with HIV DNA levels (Figures 5A, B, p=0.015 r=-0.37, p=0.02 r=-0.35 respectively), consistent with their positive association with time to viral rebound. Granzyme A expression also positively correlated with HIV DNA levels in cytokine treated cells co-cultured with K562 (Figure 5C, p=0.029, r=0.33). We also found significantly higher levels of perforin (MFI) in individuals with lower HIV DNA levels in both untreated CD56bright NK cells (Figure 5D, p=0.018) and CD56neg NK cells co-cultured with K562 cells (Figure 5E, p=0.023), again suggesting a role for cytotoxic NK cells in limiting HIV DNA. Finally, we saw significantly higher TNF expression in cytokine stimulated CD56dim NK cells in individuals with lower HIV DNA levels (Figure 5F, p=0.041).
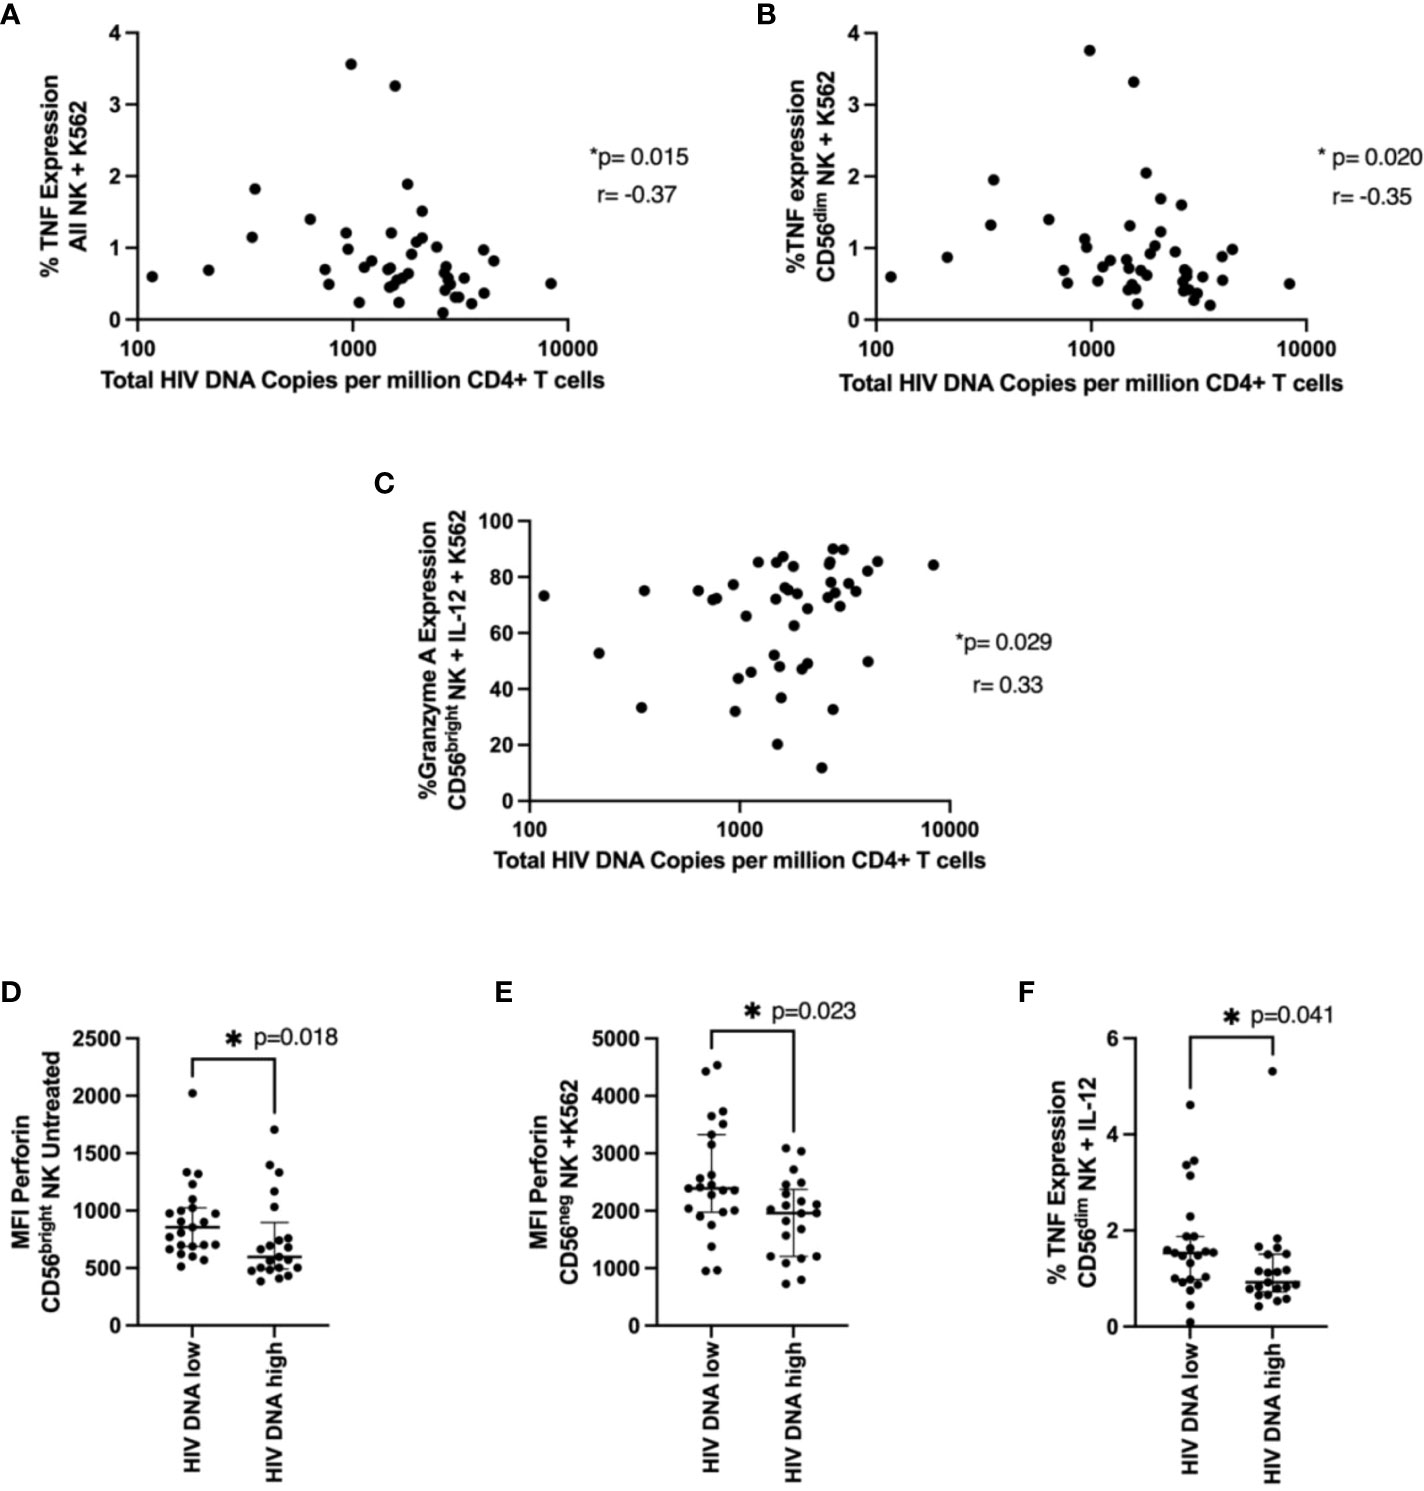
Figure 5 NK cell function and total HIV DNA levels. Cells were treated and stained as in Figure 4. In (A, B), a correlation between TNF expression in NK cells (A) or in CD56dim NK cells (B) co-cultured with K562 cells and total HIV DNA at 48 weeks post ART is shown. A Spearman test was used and p and r values are shown. In (C–F) a Mann-Whitney test was performed between individuals with < or ≥ median HIV DNA levels for the MFI of perforin in untreated CD56bright NK cells (C), the MFI of perforin in CD56neg NK cells co-cultured with K562 cells (D) and the percent TNF expression of CD56dim NK cells treated with IL-12 and IL-18 (E). *P < 0.05
Principal component analysis (PCA)
To further evaluate our cohort with regard to time to viral rebound and HIV DNA, we turned to PCA analysis. We found no statistical separation between individuals with time to viral rebound < or ≥ 6 weeks (Figure 6A) or when examining groups divided around median HIV DNA levels (Figure 6B).
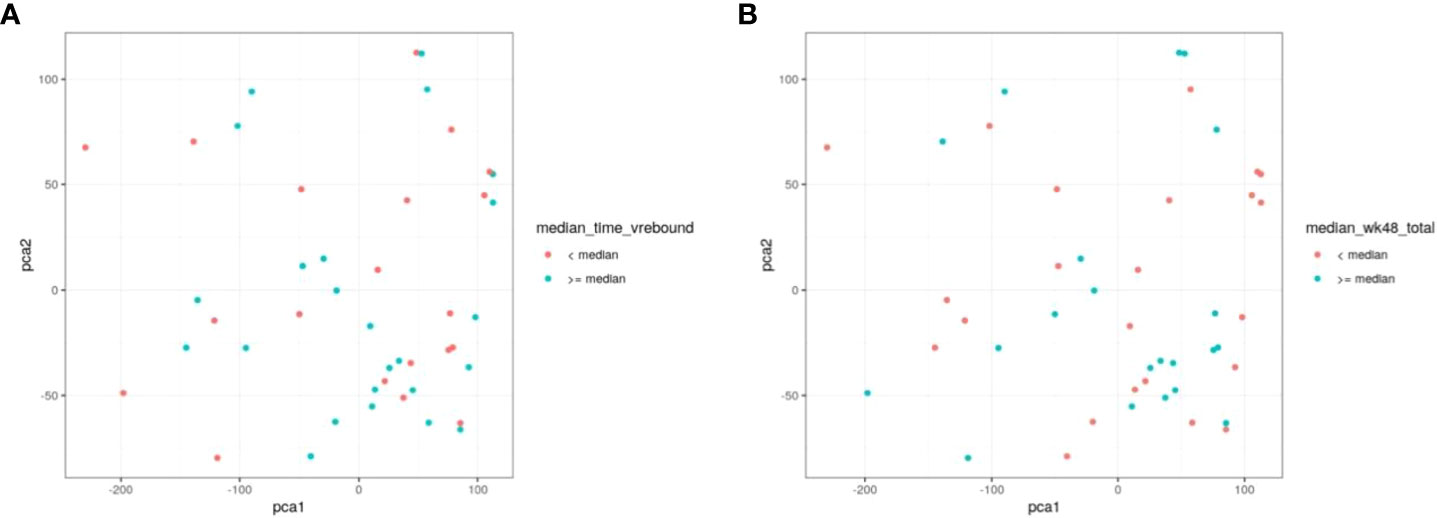
Figure 6 PCA does not discriminate between individuals based on time to viral rebound or total HIV DNA. NK cell markers and viral measurements were combined and analysed using PCA. In (A) red circles represent individuals with time to viral rebound < 6 weeks and blue circles indicate individuals with time to viral rebound ≥ 6 weeks. In (B) red circles represent individuals with HIV DNA levels < median and blue circles indicate individuals with ≥median HIV DNA levels.
Cytomegalovirus (CMV) infection
As CMV co-infection is highly prevalent in HIV-1 cohorts and has been shown to greatly affect NK cell phenotype (34), we wanted to examine the potential impact of CMV on our findings. First, we included NKG2C in our panel to help evaluate the effects of CMV as NKG2C expression on NK cells is known to be upregulated by CMV infection (34). NKG2C neither correlated with HIV DNA nor time to viral rebound (Supplemental Table 1). Additionally, we also measured CMV titres in our SPARTAC cohort and found that patients with higher CMV titres had no statistically different HIV DNA levels or time to viral rebound than those with lower titres (Supplemental Figure 9).
Discussion
Natural Killer cells are potential key players in the road to achieving HIV cure or sustained virological remission off ART. Their ability to kill HIV infected cells (9, 11), links to non-pathogenic animal models of SIV (12), correlations with vaccine protection (25, 26), and possible roles in controlling HIV DNA levels in HIV controllers and intervention studies (13, 14) all provide evidence supporting the important role NK cells may play in controlling HIV. More recent studies have also suggested NK cells may affect the induction of broadly neutralising antibody responses to HIV (10) and may have immune memory (27) which could potentially play a role in controlling viral rebound and post treatment control.
PTC provides a potential goal for HIV cure strategies, allowing individuals to remain safely off antiretroviral therapy for long periods of time. Understanding the biological factors affecting time to viral rebound would provide crucial information for both treatment interruption studies as well as therapeutic targets. However, factors dictating viral rebound or predicting who can be safely taken off therapy have yet to be elucidated (21).
As PTC is more likely in those commencing ART during primary compared with chronic HIV infection (3, 21), we examined how NK cell properties were affected over time following early ART. The majority of other studies examining the effect of ART on NK cells are focused on chronic infection, are not longitudinal or were after long periods of ART (18–20, 28). As we have previously reported evidence for PTC after 48 weeks of therapy (15), our data suggests that extremely long ART periods may not be required for PTC. Thus, we took a small group of individuals who received ART during primary HIV infection and intensively studied the phenotype and function of their NK cells longitudinally at baseline (ART naïve), 3 months, 1 year, and 2 years post ART.
We first examined NK cell subsets based on CD56 expression with gating strategies dividing cells into CD56bright, CD56dim, and CD56neg, similar to Costanzo et al (29). CD56bright cells are typically less cytotoxic and have higher proliferative potential. CD56dim cells are more cytotoxic (30), while CD56neg cells are dysfunctional cells that increase during HIV infection (31, 35). Similar to some other studies, we found no significant differences in the fraction of CD56bright cells but lower levels of CD56dim cells in untreated HIV infection (36). We also found a trend towards higher fractions of CD56neg NK cells at baseline in HIV infected individuals which is well reported (17). All of these differences in NK cell subset distribution disappeared after 2 years of ART.
We next examined phenotypic and functional NK cell markers in these different populations longitudinally after ART initiation using two stimulation models and found several markers that were restored by ART and several that did not return to pre-ART levels. Markers were chosen to represent a broad coverage of activation and exhaustion as well as activating and inhibiting receptors (as well as NKG2C as a surrogate for CMV serostatus). Any flow cytometry methodology is restricted by the number of markers that are available and newer technologies such as CyTof would permit a much more detailed analysis. Patterns of T-bet and Eomes were significantly changed by HIV infection and were still significantly different from uninfected controls despite 2 years of ART (Figure 1). This was likely due to the formation of a Eomes-/T-bet- population caused by transcription factor downregulation by HIV (37). Importantly these transcription factors are important for NK function and cytolytic activity (38). NK cell activation as measured by CD38 was similar to those in uninfected individuals post therapy and was the only marker to trend towards restoration after only 3 months of ART. Other markers with this expression pattern included a combination of activating (NKG2D levels on CD56dim NK cells) and inhibitory receptors (NKG2A expression on CD56bright NK cells) and functional markers (granzyme A levels in CD56bright NK cells and reduced IFN-γ expression in cytokine stimulated CD56neg NK cells).
Other markers that were still different in PWH and uninfected individuals after 2 years of therapy included higher expression of NKG2C on CD56dim cells, likely due to CMV infection in HIV-infected individuals which is known to upregulate NKG2C (34). We also observed higher expression of Tim-3 on CD56bright cells in ART treated PWH individuals compared to uninfected controls (Figure 1K). Tim-3 has been previously shown to be a marker of NK exhaustion (37, 39, 40) and may indicate a potentially irreversibly exhausted population of NK cells.
As our longitudinal analysis used separate uninfected controls rather than the pre-HIV samples, differences between the cohorts such as CMV serostatus and sex may contribute to the differences in NK cell marker expression. However, by comparing multiple timepoints during HIV infection with uninfected samples we were able to minimise the contribution of these confounders. By comparing pre-ART and post-ART samples with uninfected controls, markers that changed after ART exposure were likely not caused by cohort differences; if cohort characteristics were responsible, differences in NK cell marker expression would be present both pre- and post- therapy. That there are clear differences in the reversibility of some marker changes over time on ART remains of interest, and also that this may vary between individuals. Whether this is determined by differing levels of very low grade viraemia, differences in reservoir size and depth of latency (and potential expression of antigen on latently infected cells), levels of Nef-induced class I down-regulation, or degrees of chromatin accessibility remains to be seen. However, the fact that post-treatment control is rare might suggest that it is worth focusing on those characteristics that revert in a few individuals, although in this study we were unable to identify a link. For this, much larger studies would be needed.
After observing these differences in NK cell phenotype and function during primary HIV infection, we turned to the SPARTAC treatment interruption trial to determine if NK cells might play a role in controlling HIV reservoir size or delaying time to viral rebound. SPARTAC was ideal as it was a large randomised controlled trial where we had previously examined the role of T cells and viral factors on time to viral rebound (24, 41). We studied both NK cell phenotypic and functional markers and compared these markers with time to viral rebound and HIV DNA levels.
We found no NK cell phenotypic marker correlated with time to viral rebound and only weak functional correlations with TNF expression that were not statistically significant after correcting for multiple comparisons. Similarly, we found only CD107a expression was differentially expressed between two populations divided around median time to viral rebound. These data suggest none of the markers we examined effectively predicted time to viral rebound. Nor were we able to separate our cohort based on time to viral rebound using PCA analysis (Figure 6).
We also identified NK cell markers that related to levels of HIV DNA at the time of treatment interruption suggesting the importance of functional NK cells and the potential consequences of dysregulated, dysfunctional NK cells. For example, NKG2A expression in CD56neg NK cells univariably negatively correlated with HIV DNA levels (Figure 3A) and this corresponded with an enrichment of this marker in patients with HIV DNA levels below the median (Figure 3I). As the downregulation of NKG2A on CD56neg NK cells has been previously associated with NK dysfunction (42), our data is consistent with a role for functional NK cells limiting HIV DNA levels. We also found an enrichment of the marker CD27 in all NK and CD56bright NK cells in those with higher HIV DNA levels (Figures 3G, H). This population has been associated with higher IFN-γ production in viral infection, particularly HCV (43) and has been shown to be dysregulated in HIV (20). Our data also suggests a beneficial role of cytotoxic NK cells as we observed enrichment of the more cytotoxic CD56dim NK cell population in individuals with lower HIV DNA (Figure 3F) and that increased perforin levels in CD56bright and CD56neg NK cells were found in individuals with lower HIV DNA (Figures 5D, E).
These identified markers did not share a similar pattern with regards to the effects of ART: some were not different off and on ART, some had similar expression compared to uninfected controls after 2 years of ART and others were still significantly different to uninfected individuals despite 2 years of ART, suggesting markers relating to viral rebound and control may not be those most affected by ART. Our data also suggest that NK cell factors involved in time to viral rebound may not be the same as those affecting HIV DNA levels as we did not see much overlap between factors affecting HIV DNA levels compared with those affecting time to viral rebound. This could be due to HIV protein production by replication incompetent virus in the absence of viral rebound (44). We also examined those individuals who rebounded after a year off ART in case they presented a unique phenotype. However, these individuals did not cluster for any examined marker suggesting they did not present a unique NK cell profile based on the markers studied.
There are limitations to this study. First, due to limited sample availability, we did not examine HIV specific responses, instead relying on cytokine stimulation and K562 co-culture to evaluate HIV function. Additionally, our use of flow cytometry rather than a higher output technique such as CyTOF or transcriptomics meant our study was not designed for identifying specific subsets of NK cell subsets based on multiple markers. Recent studies have suggested these types of populations may be important in understanding the role of NK cells in HIV infection (29, 45). Equally, due to sample limitations we were unable to perform functional assays for ADCC which would have added interest in the context of cure strategies incorporating broadly neutralising antibodies. As we had previously studied immune response in SPARTAC, we did not have sufficient baseline samples for analysis and so relied on samples collected 12 weeks post ART initiation for analysis. However, our longitudinal HEATHER data indicated no statistical differences between these timepoints for the markers we examined. It is also possible that different NK cell markers at the time of treatment interruption may affect time to viral rebound. Furthermore, we used total HIV DNA measured in CD4 T cells as a surrogate marker of reservoir size. It is now well established that this will over-estimate the size of the replication competent reservoir due to the incorporation of defective genomes (46). Although we acknowledge that total HIV DNA is not an accurate measure of the reservoir, it still has potential value as a biomarker for viral burden or antigenic challenge and we previously found total HIV DNA related to time to viral rebound in previous SPARTAC analysis (24). Although we were able to include an HIV-ve control group, we were not able to ensure matching for age and gender; as such there may be unrecognised confounders in the analysis, although this could only really be assessed by undertaking detailed immunological analyses in the context of a randomised controlled trial. Finally, the SPARTAC cohort was a mix of individuals from different regions with different HIV clades and gender. This made teasing apart the effects of these factors difficult as we have previously reported (47). However, our focus was on identifying differences in NK cell properties that could affect HIV across the entire cohort rather than comparing clades or differences between different countries.
Overall, our work indicates that while early ART started in PHI can restore a number of changes to NK cell phenotype and function imposed by HIV infection, this is not complete. While there is evidence that NK cells may play a role in delaying viral rebound and limiting HIV DNA levels, we could not identify individual markers that predicted time to viral rebound or that could separate our cohort around median time to viral rebound or HIV DNA level. These data are important as with large numbers of clinical trials and translational studies exploring HIV cure strategies, identifying key immune effector populations is going to be crucial to success. The fact that we were unable to identify an NK cell phenotype that could be a potential driver of HIV remission does not mean that one does not exist, but does suggest that well-defined large studies and collaborative efforts may be needed to identify those NK cells that can prevent viral rebound on stopping ART.
Data availability statement
The original contributions presented in the study are included in the article/Supplementary Material. Further inquiries can be directed to the corresponding author.
Ethics statement
The studies involving human participants were reviewed and approved by West Midlands—South Birmingham Research Ethics Committee (reference 14/WM/1104). The patients/participants provided their written informed consent to participate in this study.
Author contributions
JFr, MP, SF, and JFo were involved in conceptualization, data curation, funding acquisition, supervision, methodology, writing and reviewing the manuscript. MP, AO, JH, NR, JM, NO, JT, MJ, AW, JL, KK, RH, PZ, GM, HB, NN, and DP were involved with sample methodology and preparation, assay performance, data curation, data analysis and writing and reviewing the manuscript. SF managed study recruitment at Imperial; AW, JL, and JFo managed study recruitment at Guy’s. All authors critically reviewed and approved the final version.
Funding
This work was funded by the MRC through grants to JFr and MP (MR/L006588/1 and MR/P011233/1).
Conflict of interest
Author JH was employed by Etcembly Ltd, Harwell Campus, United Kingdom.
The remaining authors declare that the research was conducted in the absence of any commercial or financial relationships that could be construed as a potential conflict of interest.
Publisher’s note
All claims expressed in this article are solely those of the authors and do not necessarily represent those of their affiliated organizations, or those of the publisher, the editors and the reviewers. Any product that may be evaluated in this article, or claim that may be made by its manufacturer, is not guaranteed or endorsed by the publisher.
Supplementary material
The Supplementary Material for this article can be found online at: https://www.frontiersin.org/articles/10.3389/fimmu.2022.878743/full#supplementary-material
References
1. Pace M, Frater J. A cure for HIV: is it in sight? Expert Rev Anti Infect Ther (2014) 12:783–91. doi: 10.1586/14787210.2014.910112
2. Davenport MP, Khoury DS, Cromer D, Lewin SR, Kelleher AD, Kent SJ. Functional cure of HIV: the scale of the challenge. Nat Rev Immunol (2019) 19:45–54. doi: 10.1038/s41577-018-0085-4
3. Sáez-Cirión A, Bacchus C, Hocqueloux L, Avettand-Fenoel V, Girault I, Lecuroux C, et al. Post-treatment HIV-1 controllers with a long-term virological remission after the interruption of early initiated antiretroviral therapy ANRS VISCONTI study. PloS Pathog (2013) 9:e1003211. doi: 10.1371/journal.ppat.1003211
4. Goulder PJR, Watkins DI. Impact of MHC class I diversity on immune control of immunodeficiency virus replication. Nat Rev Immunol (2008) 8:619–30. doi: 10.1038/nri2357
5. Walker BD, Yu XG. Unravelling the mechanisms of durable control of HIV-1. Nat Rev Immunol (2013) 13:487–98. doi: 10.1038/nri3478
6. Liu Y, Cao W, Sun M, Li T. Broadly neutralizing antibodies for HIV-1: efficacies, challenges and opportunities. Emerg Microbes Infect (2020) 9:194–206. doi: 10.1080/22221751.2020.1713707
7. Desikan R, Raja R, Dixit NM. Early exposure to broadly neutralizing antibodies may trigger a dynamical switch from progressive disease to lasting control of SHIV infection. PloS Comput Biol (2020) 16:e1008064. doi: 10.1371/journal.pcbi.1008064
8. Mikulak J, Oriolo F, Zaghi E, Di Vito C, Mavilio D. Natural killer cells in HIV-1 infection and therapy. AIDS (2017) 31:2317–30. doi: 10.1097/QAD.0000000000001645
9. Bruel T, Guivel-Benhassine F, Amraoui S, Malbec M, Richard L, Bourdic K, et al. Elimination of HIV-1-infected cells by broadly neutralizing antibodies. Nat Commun (2016) 7:10844–12. doi: 10.1038/ncomms10844
10. Bradley T, Peppa D, Pedroza-Pacheco I, Li D, Cain DW, Henao R, et al. RAB11FIP5 expression and altered natural killer cell function are associated with induction of HIV broadly neutralizing antibody responses. Cell (2018) 175:387–399.e17. doi: 10.1016/j.cell.2018.08.064
11. Lee WS, Parsons MS, Kent SJ, Lichtfuss M. Can HIV-1-Specific ADCC assist the clearance of reactivated latently infected cells? Front Immunol (2015) 6:265. doi: 10.3389/fimmu.2015.00265
12. Huot N, Jacquelin B, Garcia-Tellez T, Rascle P, Ploquin MJ, Madec Y, et al. Natural killer cells migrate into and control simian immunodeficiency virus replication in lymph node follicles in African green monkeys. Nat Med (2017) 23:1277–86. doi: 10.1038/nm.4421
13. Olesen R, Vigano S, Rasmussen TA, Søgaard OS, Ouyang Z, Buzon M, et al. Innate immune activity correlates with CD4 T cell-associated HIV-1 DNA decline during latency-reversing treatment with panobinostat. J Virol (2015) 89:10176–89. doi: 10.1128/JVI.01484-15
14. Marras F, Casabianca A, Bozzano F, Ascierto ML, Orlandi C, Di Biagio A, et al. Control of the HIV-1 DNA reservoir is associated In vivo and In vitro with NKp46/NKp30 (CD335 CD337) inducibility and interferon gamma production by transcriptionally unique NK cells. J Virol (2017) 91(23):e00647–17. doi: 10.1128/JVI.00647-17
15. Martin GE, Gossez M, Williams JP, Stöhr W, Meyerowitz J, Leitman EM, et al. Post-treatment control or treated controllers? viral remission in treated and untreated primary HIV infection. AIDS (2017) 31:477–84. doi: 10.1097/QAD.0000000000001382
16. Goujard C, Girault I, Rouzioux C, Lecuroux C, Deveau C, Chaix M-L, et al. HIV-1 control after transient antiretroviral treatment initiated in primary infection: role of patient characteristics and effect of therapy. Antivir Ther (2012) 17:1001–9. doi: 10.3851/IMP2273
17. Nabatanzi R, Cose S, Joloba M, Jones SR, Nakanjako D. Effects of HIV infection and ART on phenotype and function of circulating monocytes, natural killer, and innate lymphoid cells. AIDS Res Ther (2018) 15:7–8. doi: 10.1186/s12981-018-0194-y
18. Nabatanzi R, Bayigga L, Cose S, Rowland-Jones S, Canderan G, Joloba M, et al. Aberrant natural killer (NK) cell activation and dysfunction among ART-treated HIV-infected adults in an African cohort. Clin Immunol (2019) 201:55–60. doi: 10.1016/j.clim.2019.02.010
19. Parato KG, Kumar A, Badley AD, Sanchez-Dardon JL, Chambers KA, Young CD, et al. Normalization of natural killer cell function and phenotype with effective anti-HIV therapy and the role of IL-10. AIDS (2002) 16:1251–6. doi: 10.1097/00002030-200206140-00007
20. Titanji K, Sammicheli S, De Milito A, Mantegani P, Fortis C, Berg L, et al. Altered distribution of natural killer cell subsets identified by CD56, CD27 and CD70 in primary and chronic human immunodeficiency virus-1 infection. Immunology (2008) 123:164–70. doi: 10.1111/j.1365-2567.2007.02657.x
21. Martin GE, Frater J. Post-treatment and spontaneous HIV control. Curr Opin HIV AIDS (2018) 13:402–7. doi: 10.1097/COH.0000000000000488
22. Martin GE, Pace M, Shearer FM, Zilber E, Hurst J, Meyerowitz J, et al. Levels of human immunodeficiency virus DNA are determined before ART initiation and linked to CD8 T-cell activation and memory expansion. J Infect Dis (2020) 221:1135–45. doi: 10.1093/infdis/jiz563
23. SPARTAC Trial Investigators, Fidler S, Porter K, Ewings F, Frater J, Ramjee G, et al. Short-course antiretroviral therapy in primary HIV infection. N Engl J Med (2013) 368:207–17. doi: 10.1056/NEJMoa1110039
24. Williams JP, Hurst J, Stöhr W, Robinson N, Brown H, Fisher M, et al. HIV-1 DNA predicts disease progression and post-treatment virological control. Elife (2014) 3:e03821. doi: 10.7554/eLife.03821
25. Bonsignori M, Pollara J, Moody MA, Alpert MD, Chen X, Hwang K-K, et al. Antibody-dependent cellular cytotoxicity-mediating antibodies from an HIV-1 vaccine efficacy trial target multiple epitopes and preferentially use the VH1 gene family. J Virol (2012) 86:11521–32. doi: 10.1128/JVI.01023-12
26. Haynes BF, Gilbert PB, McElrath MJ, Zolla-Pazner S, Tomaras GD, Alam SM, et al. Immune-correlates analysis of an HIV-1 vaccine efficacy trial. N Engl J Med (2012) 366:1275–86. doi: 10.1056/NEJMoa1113425
27. Nikzad R, Angelo LS, Aviles-Padilla K, Le DT, Singh VK, Bimler L, et al. Human natural killer cells mediate adaptive immunity to viral antigens. Sci Immunol (2019) 4(35):eaat8116. doi: 10.1126/sciimmunol.aat8116
28. Bächle SM, Malone DFG, Buggert M, Karlsson AC, Isberg P-E, Biague AJ, et al. Elevated levels of invariant natural killer T-cell and natural killer cell activation correlate with disease progression in HIV-1 and HIV-2 infections. AIDS (2016) 30:1713–22. doi: 10.1097/QAD.0000000000001147
29. Costanzo MC, Kim D, Creegan M, Lal KG, Ake JA, Currier JR, et al. Transcriptomic signatures of NK cells suggest impaired responsiveness in HIV-1 infection and increased activity post-vaccination. Nat Commun (2018) 9:1212–16. doi: 10.1038/s41467-018-03618-w
30. Moretta L. Dissecting CD56dim human NK cells. Blood (2010) 116:3689–91. doi: 10.1182/blood-2010-09-303057
31. Milush JM, López-Vergès S, York VA, Deeks SG, Martin JN, Hecht FM, et al. CD56negCD16+ NK cells are activated mature NK cells with impaired effector function during HIV-1 infection. Retrovirology (2013) 10:158–13. doi: 10.1186/1742-4690-10-158
32. Calin R, Hamimi C, Lambert-Niclot S, Carcelain G, Bellet J, Assoumou L, et al. Treatment interruption in chronically HIV-infected patients with an ultralow HIV reservoir. AIDS (2016) 30:761–9. doi: 10.1097/QAD.0000000000000987
33. Assoumou L, Weiss L, Piketty C, Burgard M, Melard A, Girard P-M, et al. A low HIV-DNA level in peripheral blood mononuclear cells at antiretroviral treatment interruption predicts a higher probability of maintaining viral control. AIDS (2015) 29:2003–7. doi: 10.1097/QAD.0000000000000734
34. Peppa D. Natural killer cells in human immunodeficiency virus-1 infection: Spotlight on the impact of human cytomegalovirus. Front Immunol (2017) 8:1322. doi: 10.3389/fimmu.2017.01322
35. Alter G, Teigen N, Davis BT, Addo MM, Suscovich TJ, Waring MT, et al. Sequential deregulation of NK cell subset distribution and function starting in acute HIV-1 infection. Blood (2005) 106:3366–9. doi: 10.1182/blood-2005-03-1100
36. Ahmad F, Tufa DM, Mishra N, Jacobs R, Schmidt RE. Terminal differentiation of CD56(dim)CD16(+) natural killer cells is associated with increase in natural killer cell frequencies after antiretroviral treatment in HIV-1 infection. AIDS Res Hum Retroviruses (2015) 31:1206–12. doi: 10.1089/aid.2015.0115
37. Schafer JL, Müller-Trutwin MC, Reeves RK. NK cell exhaustion: bad news for chronic disease? Oncotarget (2015) 6:21797–8. doi: 10.18632/oncotarget.5490
38. Zhang J, Marotel M, Fauteux-Daniel S, Mathieu A-L, Viel S, Marçais A, et al. T-Bet and eomes govern differentiation and function of mouse and human NK cells and ILC1. Eur J Immunol (2018) 48:738–50. doi: 10.1002/eji.201747299
39. da Silva IP, Gallois A, Jimenez-Baranda S, Khan S, Anderson AC, Kuchroo VK, et al. Reversal of NK-cell exhaustion in advanced melanoma by Tim-3 blockade. Cancer Immunol Res (2014) 2:410–22. doi: 10.1158/2326-6066.CIR-13-0171
40. Schafer JL, Li H, Evans TI, Estes JD, Reeves RK. Accumulation of cytotoxic CD16+ NK cells in simian immunodeficiency virus-infected lymph nodes associated with In situ differentiation and functional anergy. J Virol (2015) 89:6887–94. doi: 10.1128/JVI.00660-15
41. Hurst J, Hoffmann M, Pace M, Williams JP, Thornhill J, Hamlyn E, et al. Immunological biomarkers predict HIV-1 viral rebound after treatment interruption. Nat Commun (2015) 6:8495–9. doi: 10.1038/ncomms9495
42. Zulu MZ, Naidoo KK, Mncube Z, Jaggernath M, Goulder PJR, Ndung'u T, et al. Reduced expression of siglec-7, NKG2A, and CD57 on terminally differentiated CD56-CD16+ natural killer cell subset is associated with natural killer cell dysfunction in chronic HIV-1 clade c infection. AIDS Res Hum Retroviruses (2017) 33:1205–13. doi: 10.1089/AID.2017.0095
43. Eisenhardt M, Glässner A, Wolter F, Krämer B, Kokordelis P, Nischalke H-D, et al. CD27(+)CD56Bright natural killer cells may be involved in spontaneous clearance of acute hepatitis c in HIV-positive patients. AIDS (2014) 28:1879–84. doi: 10.1097/QAD.0000000000000355
44. Pollack RA, Jones RB, Pertea M, Bruner KM, Martin AR, Thomas AS, et al. Defective HIV-1 proviruses are expressed and can be recognized by cytotoxic T lymphocytes, which shape the proviral landscape. Cell Host Microbe (2017) 21:494–506.e4. doi: 10.1016/j.chom.2017.03.008
45. Peppa D. Entering a new era of harnessing natural killer cell responses in HIV infection. EBioMedicine (2019) 44:26–7. doi: 10.1016/j.ebiom.2019.05.045
46. Ho Y-C, Shan L, Hosmane NN, Wang J, Laskey SB, Rosenbloom DIS, et al. Replication-competent noninduced proviruses in the latent reservoir increase barrier to HIV-1 cure. Cell (2013) 155:540–51. doi: 10.1016/j.cell.2013.09.020
Keywords: HIV-human immunodeficiency virus, NK cell, viral rebound, antiretroviral (ARV), treatment interruption (TI)
Citation: Pace M, Ogbe A, Hurst J, Robinson N, Meyerowitz J, Olejniczak N, Thornhill JP, Jones M, Waters A, Lwanga J, Kuldanek K, Hall R, Zacharopoulou P, Martin GE, Brown H, Nwokolo N, Peppa D, Fox J, Fidler S and Frater J (2022) Impact of antiretroviral therapy in primary HIV infection on natural killer cell function and the association with viral rebound and HIV DNA following treatment interruption. Front. Immunol. 13:878743. doi: 10.3389/fimmu.2022.878743
Received: 18 February 2022; Accepted: 29 July 2022;
Published: 30 August 2022.
Edited by:
Hugh Thomson Reyburn, Spanish National Research Council (CSIC), SpainReviewed by:
Anthony Jaworowski, RMIT University, AustraliaHun Sik Kim, University of Ulsan, South Korea
Copyright © 2022 Pace, Ogbe, Hurst, Robinson, Meyerowitz, Olejniczak, Thornhill, Jones, Waters, Lwanga, Kuldanek, Hall, Zacharopoulou, Martin, Brown, Nwokolo, Peppa, Fox, Fidler and Frater. This is an open-access article distributed under the terms of the Creative Commons Attribution License (CC BY). The use, distribution or reproduction in other forums is permitted, provided the original author(s) and the copyright owner(s) are credited and that the original publication in this journal is cited, in accordance with accepted academic practice. No use, distribution or reproduction is permitted which does not comply with these terms.
*Correspondence: John Frater, john.frater@ndm.ox.ac.uk
†These authors have contributed equally to this work