 Sofiya Pisarenka1,2
 Nicole C. Meyer1
 Xue Xiao1
 Renee Goodfellow1
 Carla M. Nester1
 Yuzhou Zhang1
 Richard J. H. Smith1,2*
- 1Molecular Otolaryngology and Renal Research Laboratories, Caver College of Medicine, University of Iowa, Iowa City, IA, United States
- 2Molecular Medicine Graduate Program, Caver College of Medicine, University of Iowa, Iowa City, IA, United States
Introduction: C3 glomerulopathies (C3G) are ultra-rare complement-mediated diseases that lead to end-stage renal disease (ESRD) within 10 years of diagnosis in ~50% of patients. Overactivation of the alternative pathway (AP) of complement in the fluid phase and on the surface of the glomerular endothelial glycomatrix is the underlying cause of C3G. Although there are animal models for C3G that focus on genetic drivers of disease, in vivo studies of the impact of acquired drivers are not yet possible.
Methods: Here we present an in vitro model of AP activation and regulation on a glycomatrix surface. We use an extracellular matrix substitute (MaxGel) as a base upon which we reconstitute AP C3 convertase. We validated this method using properdin and Factor H (FH) and then assessed the effects of genetic and acquired drivers of C3G on C3 convertase.
Results: We show that C3 convertase readily forms on MaxGel and that this formation was positively regulated by properdin and negatively regulated by FH. Additionally, Factor B (FB) and FH mutants impaired complement regulation when compared to wild type counterparts. We also show the effects of C3 nephritic factors (C3Nefs) on convertase stability over time and provide evidence for a novel mechanism of C3Nef-mediated C3G pathogenesis.
Discussion: We conclude that this ECM-based model of C3G offers a replicable method by which to evaluate the variable activity of the complement system in C3G, thereby offering an improved understanding of the different factors driving this disease process.
Introduction
C3 Glomerulopathies (C3G) are a group of ultra-rare complement-mediated renal diseases defined by specific histopathological findings on renal biopsy. The C3G definition includes presence of glomerulonephritis with C3-dominant immunofluorescence staining: C3 intensity must be at least two orders of magnitude more than any other immunoreactant. Electron microscopy (EM) is used to distinguish between the two major subtypes of C3G: Dense Deposit Disease (DDD) and C3 Glomerulonephritis (C3GN). DDD presents with extremely electron-dense, “sausage-shaped” deposits in the lamina densa of the glomerular basement membrane (GBM), a kidney-specific type of an extracellular matrix (ECM). In comparison, C3GN presents with subendothelial, subepithelial and/or mesangial deposits that are less electron-dense and have a less compact, “cloudy” appearance (1–3). The most important outcome associated with C3G diagnosis is the progression to end-stage renal disease (ESRD): ~50% of patients reach ESRD within 10 years of diagnosis (2, 4, 5). If kidney transplantation is offered, C3G recurrence in allografts is common (~60-80%), contributing to graft loss in ~50% of the cases (4, 6–10).
C3G pathogenesis is primarily driven by dysregulation of complement in the circulation and/or glomerular microenvironment (Figure 1). Complement is an integral part of the innate immune system, responsible for pathogen clearance and recruitment of immune cells to the site of complement activation. Of the three complement-initiating pathways (classical, lectin, alternative), the alternative pathway (AP) is the main contributor to C3G pathogenesis. The AP is continuously activated at a low rate in a process known as tick-over, resulting in cleavage of complement component 3 (C3) into an anaphylatoxin C3a and an opsonin C3b, which deposits on pathogen and self surfaces to drive formation of C3 convertase of the AP, C3bBb (17, 18). This process is tightly controlled by regulators of complement activation (RCA) which control complement activity to prevent injury to the host. In C3G, C3 convertase regulation is impaired, resulting in complement deposits in the renal glomeruli. While the source of disease is unknown in a subset of C3G cases (~35-40%), C3 convertase dysregulation and the subsequent development of disease is driven by acquired (~40-50%) or genetic drivers (~15-25%) in most (4, 19). Known drivers act on different parts of the complement cascade. For example, acquired drivers such as C3 nephritic factors (C3Nefs) stabilize C3 convertase (18, 20, 21), while genetic drivers like mutations in the CFH gene decrease inhibition of complement activity (22–24). Understanding the molecular processes underlying complement dysregulation is imperative for patient-specific management of C3G (2, 25, 26).
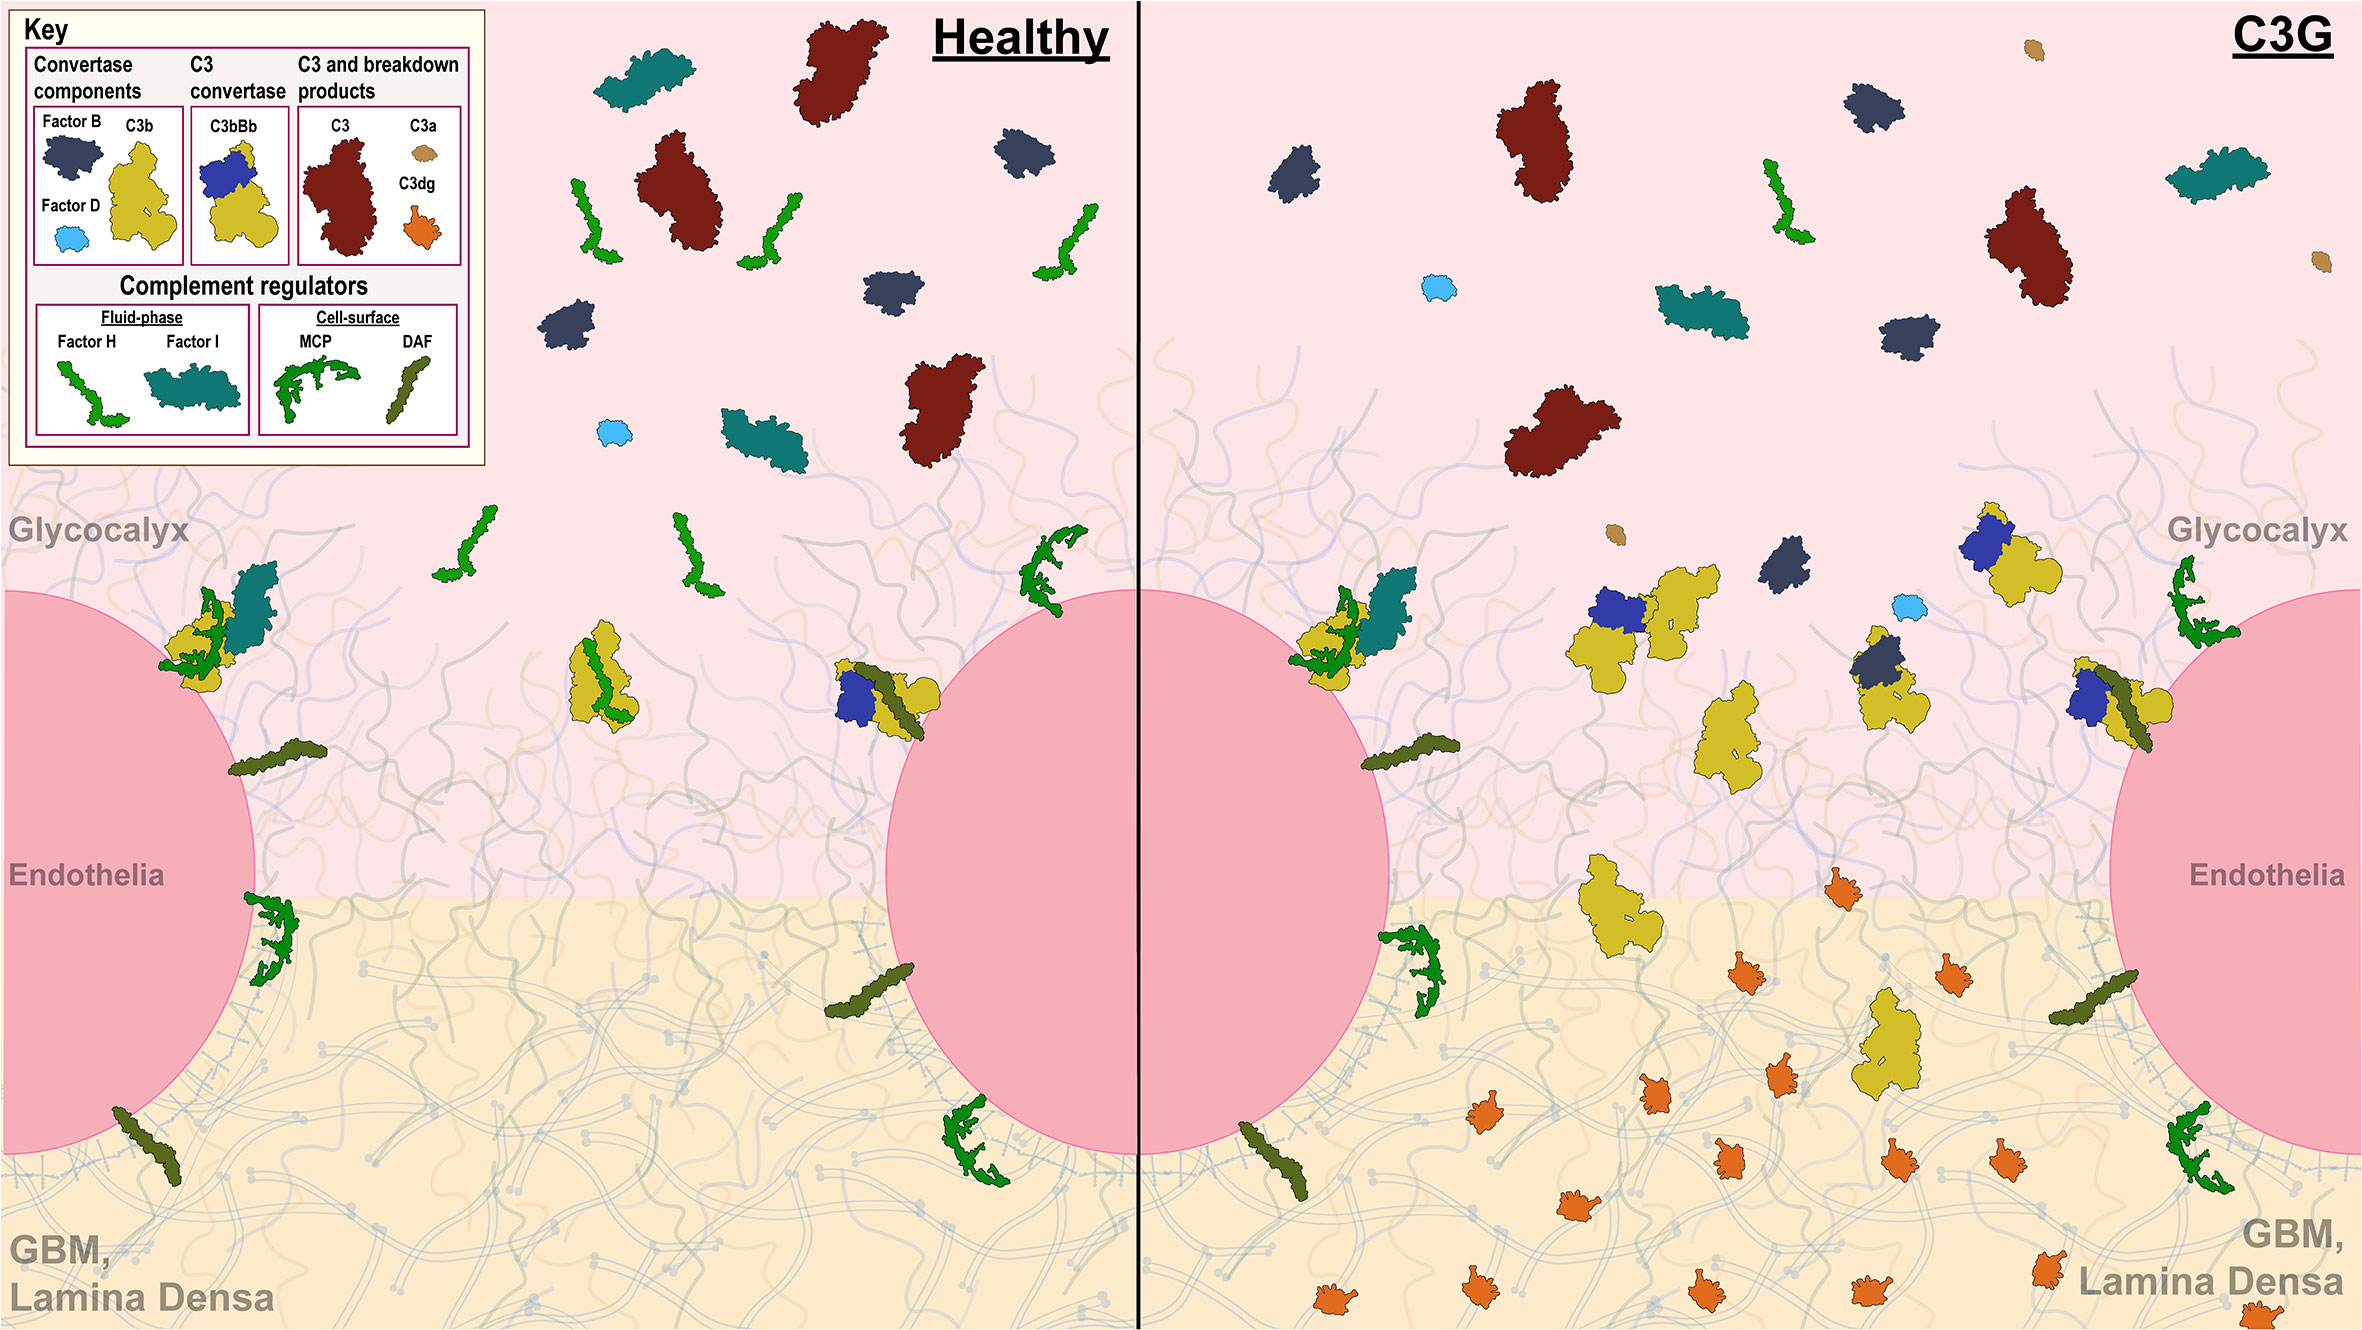
Figure 1 Complement control in the glomerular microenvironment. The glomerulus is the filtration unit of the kidney. Its filtration barrier is composed of the glycocalyx, glomerular endothelial cells (GEnC), glomerular basement membrane (GBM) and podocytes. The glycocalyx, a network of proteoglycans and glycoproteins, overlays highly fenestrated GEnCs. GEnC pores comprise ~20-50% of total cell surface area (11–16), allowing filtration of waste products through the glycomatrix (glycocalyx and the GBM), underlying podocytes and further into the Bowman’s capsule to be excreted as urine. Complement activity on GEnCs is controlled by both cell-bound (MCP and DAF depicted) and fluid-phase complement regulators (Factor H (FH) and Factor I (FI) depicted), while complement control over the GEnC pores relies on fluid-phase regulators alone. A healthy glomerular microenvironment exhibits adequate cell-surface and fluid-phase complement control thereby preventing injury to the GEnCs and complement deposition in the glycomatrix. In contrast, in the C3G glomerular microenvironment, fluid-phase complement dysregulation occurs (an example of C3G driven by FH deficiency depicted) in presence of adequate cell-surface complement control. Here, GEnCs are still protected by the cell-bound regulators, but the lack of fluid-phase complement control over the GEnC pores allows complement amplification and complement deposition to occur as reflected by changes in the lamina densa of the GBM.
End organ renal damage begins in the glomeruli, which are high-flow, high-pressure capillary beds. The glomerular endothelial cells (GEnC) are highly fenestrated, with fenestrae comprising ~20-50% of total GEnC surface area (11–16). Complement control over the fenestrae depends on fluid-phase RCA proteins, which bind to heparin sulfate proteoglycans and sialic acids in the overlaying glycocalyx (27–30). Factor H (FH) and its related proteins (FHRs) are examples of the most important fluid-phase RCAs responsible for complement control in the glomeruli (22, 31, 32). Ultimately, it is the dysregulation of complement control in the fluid phase and at the glycomatrix (glycocalyx and the GBM) surface that gives rise to C3G.
We therefore developed an in vitro extra-cellular matrix (ECM) based model to test fluid phase complement regulation. Our goal was to model normal regulation of the C3 convertase on ECM surface and then determine how acquired and genetic drivers of C3G impact convertase activity. These studies advance our understanding of C3G pathogenesis, provide a diagnostic tool to monitor patient-specific complement dysregulation, and, potentially, may become a screening tool to test complement therapeutics based on a patient’s complement profile.
Materials and methods
Patient cohort selection
Six patients were selected from our C3G research cohort. All patients had biopsy-proven C3G and sufficient purified Immunoglobulin G (IgG) samples to complete all assays multiple times. Selection was based on complement biomarker data (Table 1). Three C3G patients had elevated C3Nef activity (>20% activity as determined by C3CSA, C3Nef+), and three C3G patients had normal C3Nef activity (≤20%, C3Nef-). Control normal human serum (NHS) IgG was purified from pooled sera of persons with no history of renal disease. All patients gave informed consent before donating samples and were enrolled in this study under the guidelines approved by the institutional review board of the University of Iowa.
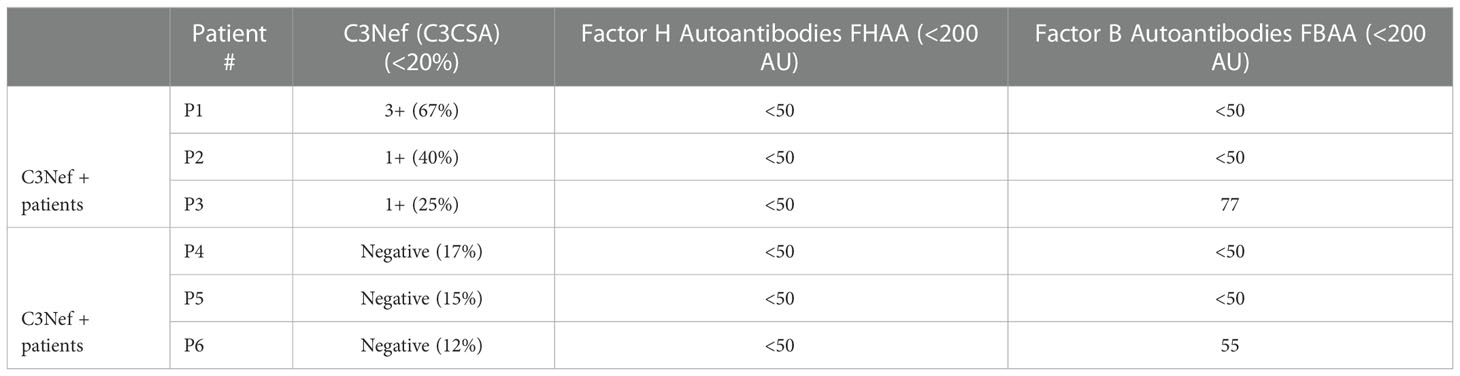
Table 1 Patient biomarkers.
IgG purification
Patient IgG was purified using the Melon Gel IgG Purification Kit (Thermo Scientific, Rockford, IL) according to the manufacturer’s instructions (33) and adjusted to 0.75 mg/ml.
C3Nef activity assay
C3 Convertase Stabilizing Assay (C3CSA) was performed as described previously (18). Briefly, AP C3 convertase was formed on the surface of sheep erythrocytes (SE), followed by adding patient-purified IgG to C3 convertase coated SE. Next, C3 convertase was allowed to decay for 20 and 60 minutes. At each time point, 50 ul was removed and mixed with rat EDTA serum, which served as a source of terminal complement components. C3CSA activity was reported as a function of the degree of hemolysis at 20 minutes as measured by OD at λ415.
Generation of recombinant FB and FH mutants
Recombinant FB and FH proteins were obtained through GeneArt, a division of ThermoFisher Scientific (Regensburg, Germany), as described previously (24). Briefly, the DNA coding region of select FB and FH variants with His-tag at the C- terminus was synthesized and cloned into a mammalian expression vector. Plasmids were then transfected into Expi 293 cells, followed by purification of the resulting Fb and FH protein directly from the culture supernatants using Ni2+ columns. After purification, all proteins were adjusted to 1 mg/mL in PBS and stored at -80°C until use (24).
C3 convertase formation assay
The C3 convertase formation assay (C3CFA) is a novel assay that measures the amount of C3 convertase formed on MaxGel™ (Sigma-Aldrich, St. Louis, MO) in the presence or absence of RCAs (Figure 2B i-ii). All complement proteins were obtained from Complement Technology Inc., Tyler, TX.
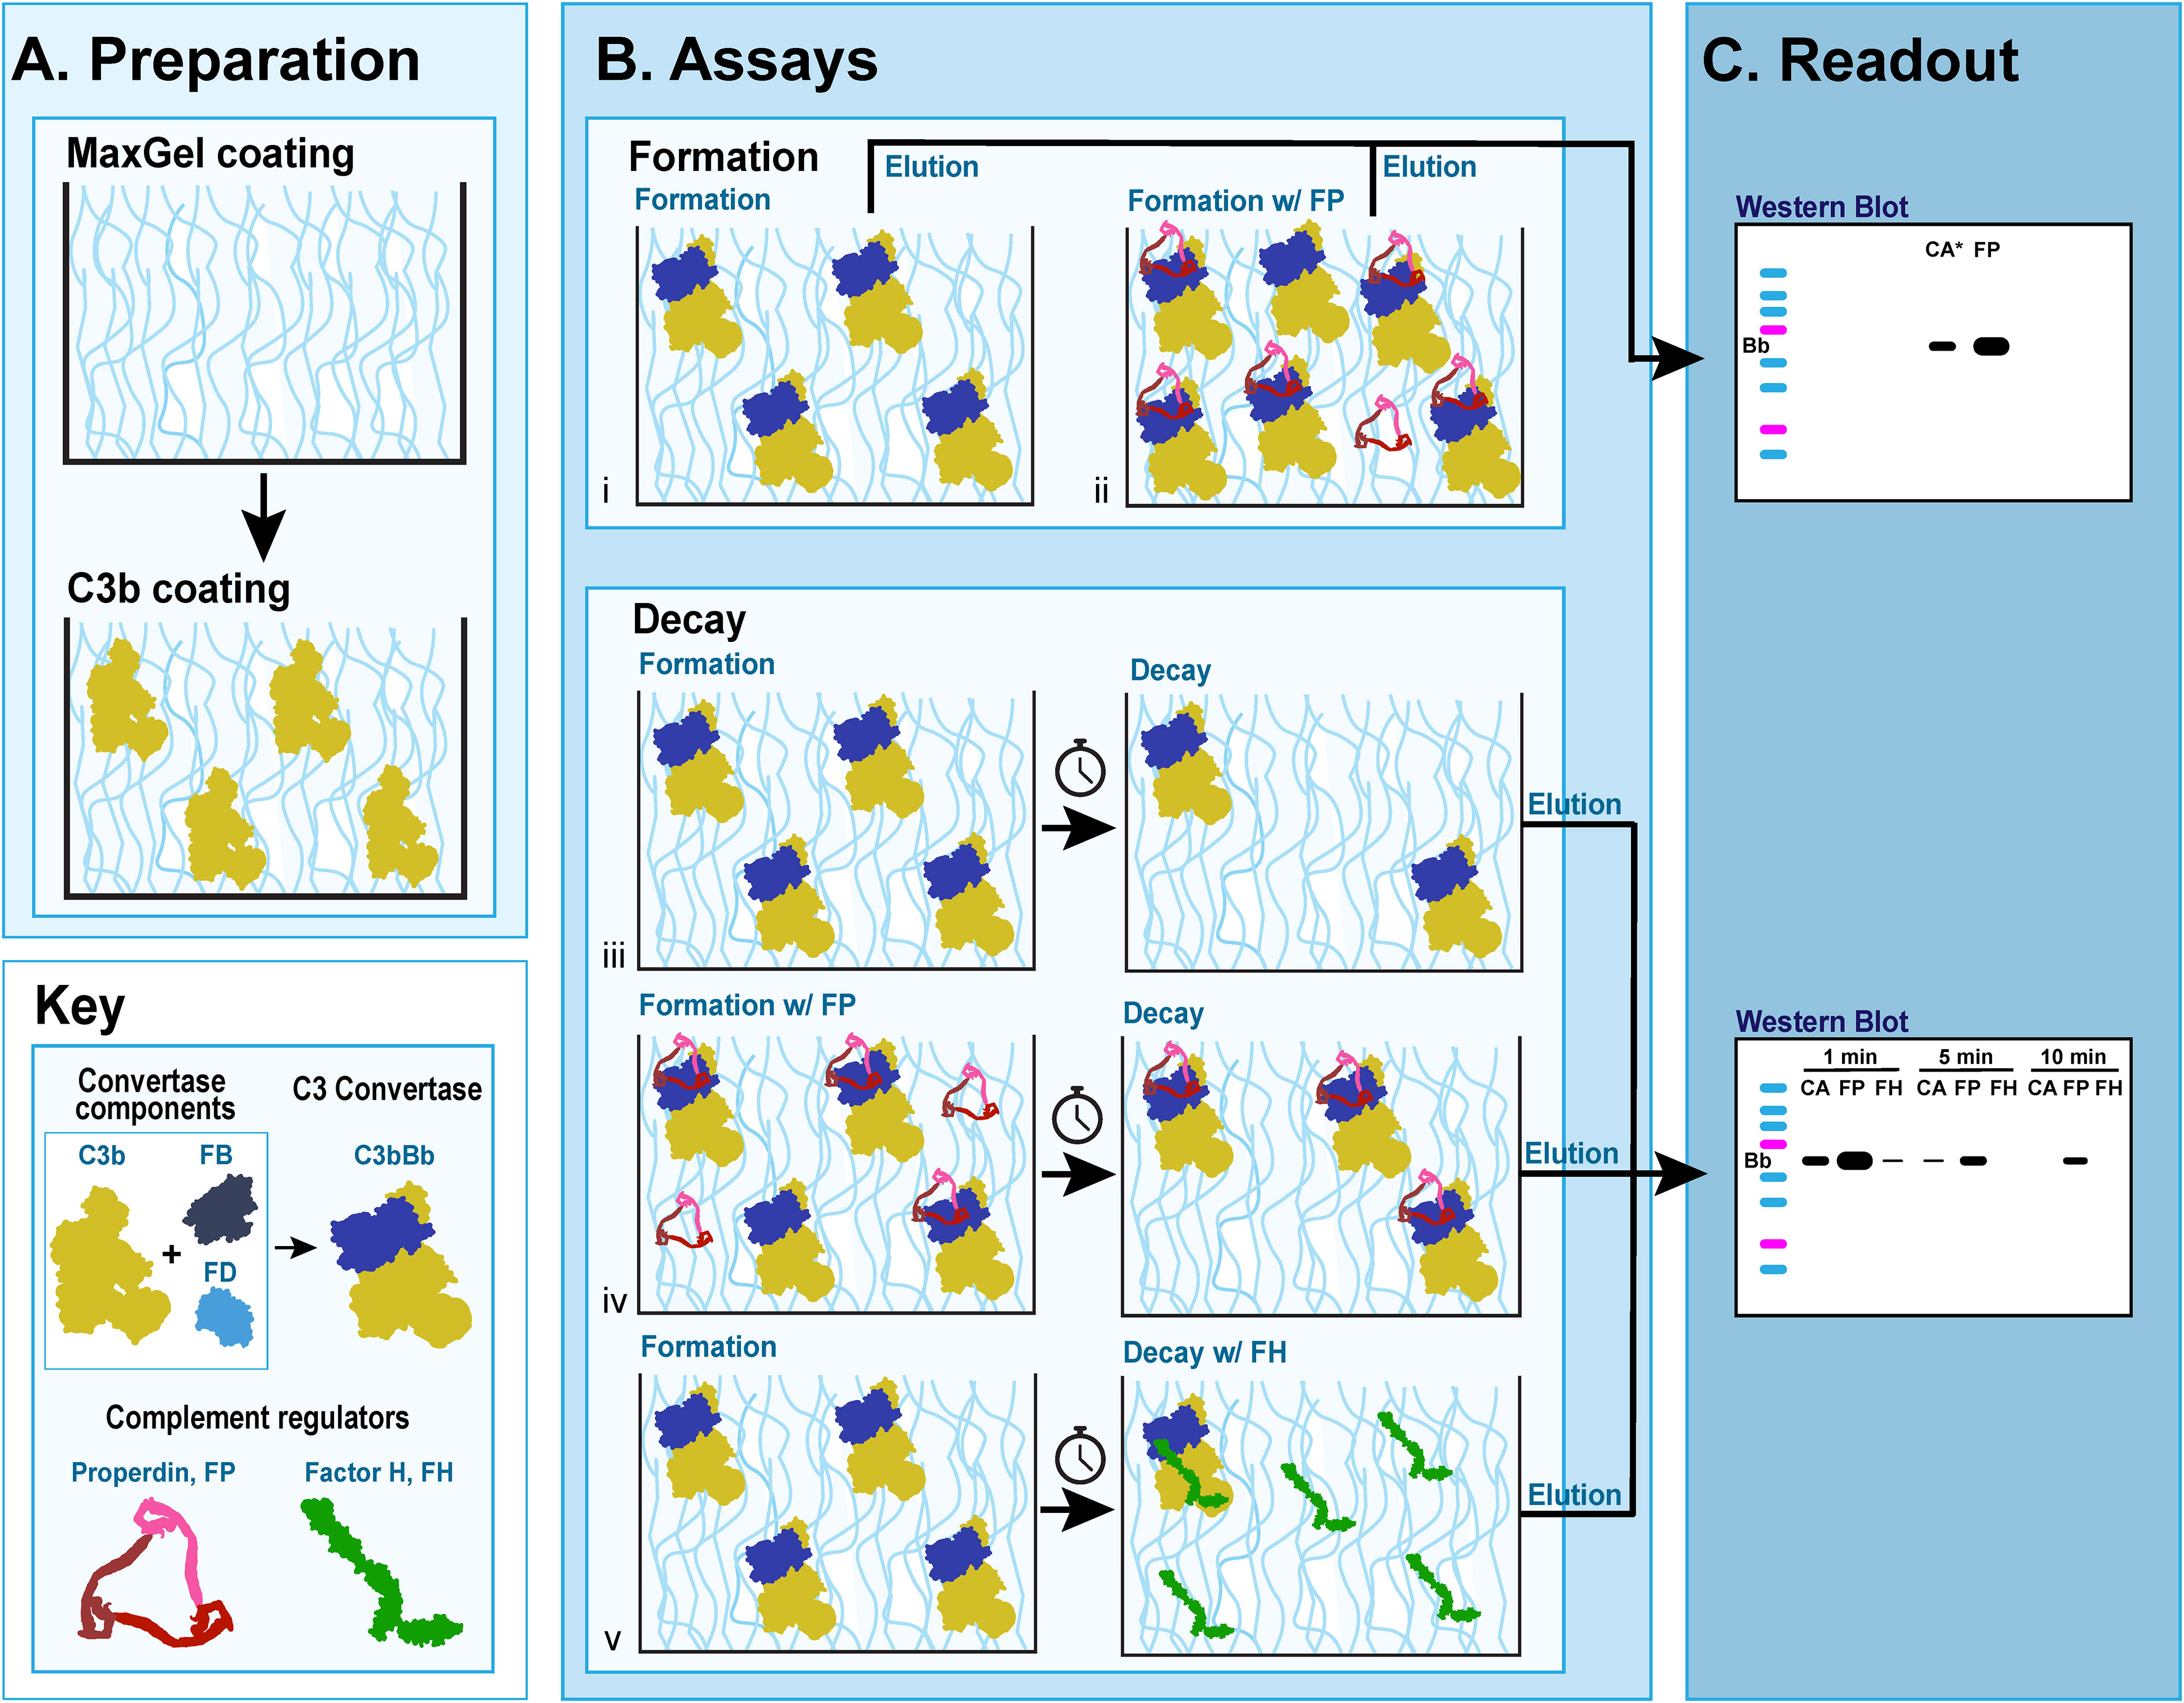
Figure 2 C3 convertase assays on MaxGel surface. (A) Preparation for all assays involves coating microtiter plates with MaxGel (ECM) followed by coating with C3b. (B) Formation assay: Factor B (FB) and Factor D (FD) are added to C3b-coated MaxGel, subsequently generating C3bBb over the course of 10 min in the absence (i) or presence (ii) of Properdin. Decay assay: C3bBb is generated as described above in absence (iii, v) or presence of Properdin (iv), and then allowed to decay over time naturally (iii, iv) or in presence of Factor H (v). (C) The amount of C3 convertase present on MaxGel surface at the time of elution is quantitated by western blot and observing the Bb complement fragment.
Preparation
96-well ELISA microtiter plates were coated with MaxGel (100 ul of 1:4 MaxGel:1xELISA coating buffer (Bio-Rad Laboratories, Inc., Hercules, CA)). Conditions were prepared in duplicate. Plates were incubated overnight (o/n) at 4°C. The following day, plates were washed with 1xPBS x3, then blocked with 4%BSA in 1xPBS for two hours at room temperature. Plates were then washed with 1xPBS x3 and wells were incubated with purified C3b (50 ul at 130 ug/ml) in 1xELISA coating buffer for at 4°C 2 o/n. C3b concentration was approximated using the normal physiological concentration of C3 (normal range, 900-1800 ug/ml) and was set at 1/10 of this value (concentration used, 1300 ug/ml); all other complement proteins and human IgG were used at 1/20 of their respective physiological concentrations (Table 2).
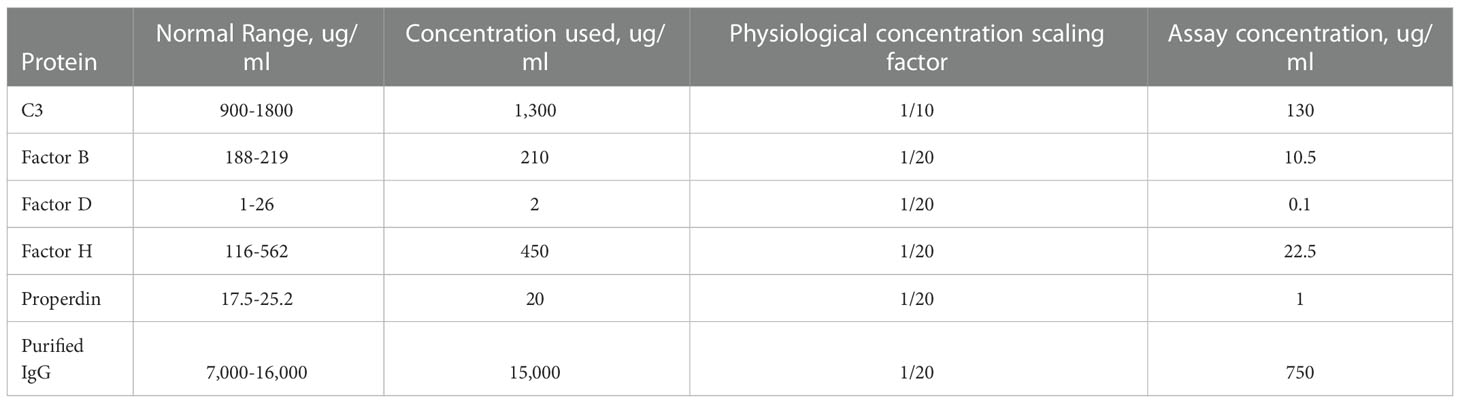
Table 2 Concentration of complement proteins in circulation.
Assays
Fresh assay buffer (AB) was used for each experiment (8.1mM Na2HPO4, 1.8mM NaH2PO4, 0.05%Tween20, 75mM NaCl, 10mM MgCl2, 2% BSA in PBS, distilled H2O, pH = 7.0). Factor B (FB, 10.5 ug/ml) and Factor D (FD, 0.1 ug/ml) were added. 50 ul was added to each well (p/w). The same composition of reagents was used for all experiments.
C3b-coated wells were washed three times with AB to remove unbound C3b. C3 convertase was then formed by incubating the wells with control (FB+FD) or experimental (FB+FD+Reactant) assay mixtures (50 ul p/w) for 10 min at 37°C. Wells were washed with AB x3 to ensure that only MaxGel-bound C3 convertase remained.
Readout
Elution buffer (10mM EDTA and 1%SDS) was added to the plates at 25 ul p/w, followed by 1h incubation at room temperature on an orbital shaker. Eluants from duplicate wells were pooled, 35 ul of the pooled eluant was then added to 35 ul of 2x Laemmli Sample Buffer (Bio-Rad Laboratories, Inc., Hercules, CA) and heated at 95°C for 15 min in preparation for SDS-PAGE.
C3 convertase decay assay
The C3 convertase decay assay (C3CDA) is a novel assay that measures the rate of decay of C3 convertase formed on MaxGel™ in presence or absence of RCAs or decay of C3 convertase alone (Figure 2B iii-v). Preparation and assay steps of the C3CFA protocol were followed for each timepoint assessed. Washed plates were incubated with AB alone or AB+Reactant (50 ul p/w) for a determined period at 37°C, then washed with AB x3. The readout for C3CDA was identical to the readout for C3CFA. The impact of properdin, FH and C3Nefs on C3 convertase decay was assessed.
Visualization via SDS-PAGE and western blotting
Samples were separated by 10% SDS-PAGE gel (Bio-Rad Laboratories, Inc., Hercules, CA), and transferred to nitrocellulose membrane. Membranes were blocked with 5% skim milk in 1x PBST (1xPBS, 0.075% Tween20) at 4°C o/n, then incubated with a mouse monoclonal Factor B antibody specific for the Bb subunit (1:200 in 5% BSA, 1xPBST; Santa Cruz Biotechnology, Inc., Dallas, TX; F-7: sc-271636) at 4°C o/n. Membranes were washed x3 with 1xPBST, followed by a 2-hour incubation at room temperature with polyclonal HRP-conjugated goat anti-mouse secondary antibody (1:4000, Jackson ImmunoResearch Inc, West Grove, PA, 115-035-062, RRID: AB_2338504, in 5% BSA, 1xPBST). Membranes were washed x5 in 1xPBST, then incubated with SuperSignal West Pico PLUS Chemiluminescent Substrate (Thermo Scientific, Rockford, IL) for 1 min. Protein bands were visualized using Classic X-ray Film (Research Products International, Mt. Prospect, IL).
Quantification and normalization of western blot data
Western blots were quantified using ImageJ (http://imagej.nih.gov/ij/; National Institutes of Health, Bethesda, MD). C3 convertase alone (CA) at the first assayed timepoint (as indicated in the legend) was set as 1; all other values in a replicate were normalized to this value.
Statistical analyses
Statistical analyses were performed using GraphPad Prism 8 (GraphPad Software, San Diego, CA). All experiments were repeated a minimum of three times. Student’s t-test and one-way ANOVA with Dunnett’s multiple comparisons test were used to assess the difference between conditions. Half-life in decay assays was determined by fitting a curve with non-linear regression using second order polynomial equation. Difference was considered statistically significant at P ≤ 0.05.
Results
Validation of the method
C3 convertase assembles, decays on ECM surface and is regulated by RCA proteins
A novel in vitro model of complement activity and regulation was designed to assess C3 convertase activity on ECM surface (Figure 2). We first ensured that MaxGel, the ECM used as a base for all the assays, does not contain complement proteins capable of forming C3 convertase. To do so, we separately added necessary components of C3 convertase (C3b, FB, FD) or their combinations to MaxGel-coated wells (Figure 3A, lanes 1-5). Further, we demonstrated that C3bBb was only able to form on MaxGel surface in presence of all necessary components (Figure 3A, lane 6) and its formation was inhibited by Factor H (FH) and stabilized by Properdin (FP) (Figure 3A, lanes 7-8). Together, these experiments show that C3 convertase forms on MaxGel surface and that complement regulators act in the physiologically expected manner.
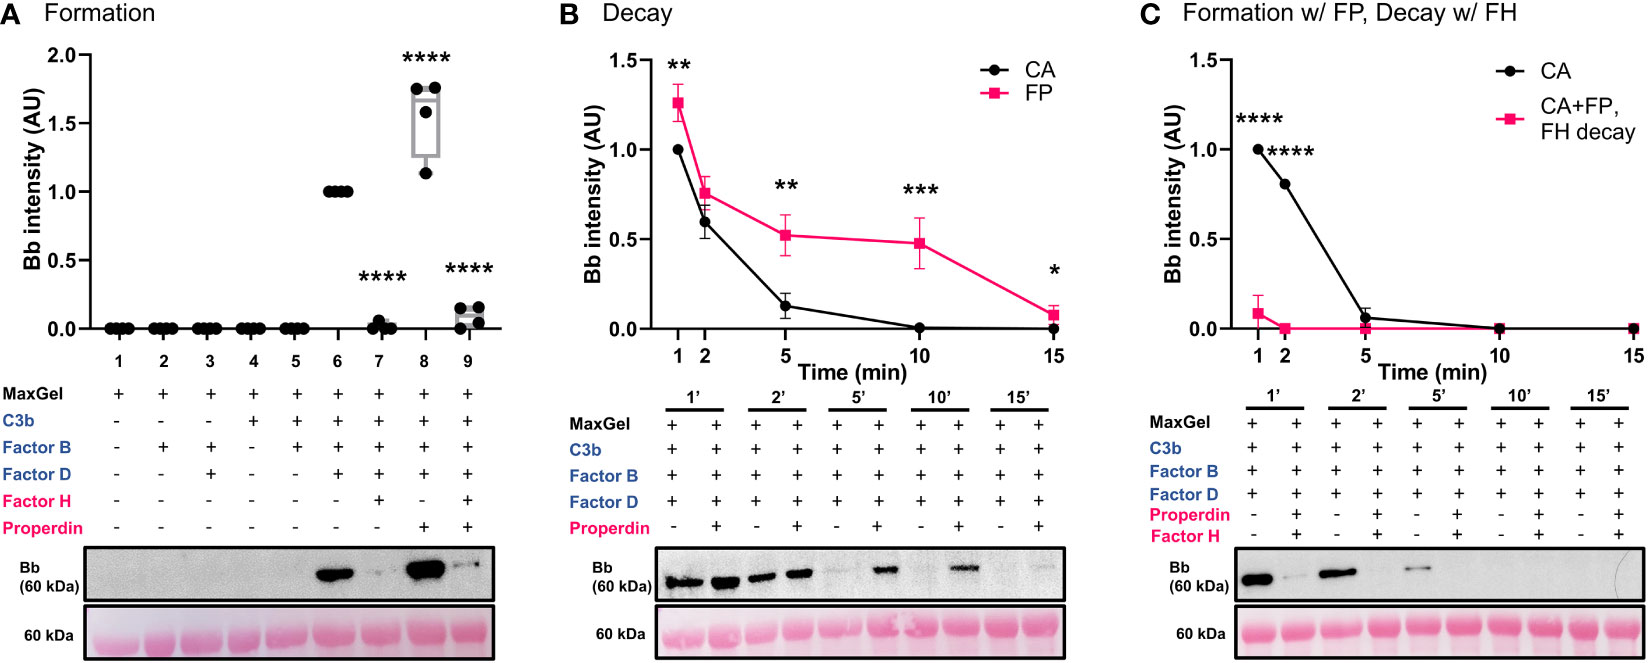
Figure 3 C3 convertase assembles, decays on ECM surface and is regulated by RCA proteins. (A) Western blot analysis of C3 convertase formation on ECM surface. MaxGel does not contain complement proteins necessary to form C3 convertase (lanes 1-5). C3 convertase alone (CA) forms in presence of C3b, FB and FD (lane 6), and is regulated by inhibitory FH (lane 7), stabilizing FP (lane 8) or a mix of FH+FP (lane 9). Results were normalized to CA and presented as relative protein expression. Box plots show median, 1st and 3rd quartile ranges, and the individual data points of four independent experiments. Significance calculated for CA. (B) Western blot analysis of timed decay (1-15 min) of CA formed alone or in presence of Properdin. FP increases C3bBb half-life more than 2-fold (CA t1/2 =3.1min; FP t1/2 =7.4min). (C) Western blot analysis of timed decay (1-15 min) of CA formed alone or in presence of properdin (C3bBb(P)), followed by FH-mediated decay of C3bBb(P). FH increases decay of C3bBb(P) (CA t1/2 =3.2min; C3bBb(P)+FH t1/2<1min). Results were normalized to CA at 1 min and presented as relative protein expression. Ponceau S Staining was used as a measure of total protein load. Mean ± SD of four independent experiments. Significance calculated for CA at respective timepoints. * P ≤ 0.05, ** P ≤ 0.01, *** P ≤ 0.001, **** P ≤ 0.0001.
Properdin, the only known positive regulatory protein of the AP of complement, is capable of increasing the half-life of the C3 convertase up to 10 times (34). We hypothesized that physiological amounts of FP would stabilize C3bBb on MaxGel surface. To test this hypothesis, we assessed the differences in C3bBb decay rates when formed alone (CA) or in presence of FP (C3bBb(P)) (Figure 3B), following natural decay rates. Addition of FP led to 2.4-fold increase in convertase half-life (FP t1/2 =7.4min) when compared to untreated control (CA t1/2 =3.1min). Notably, though not statistically significant, some C3bBb(P) complexes were still present after 15 min of decay. C3bBb(P) decayed rapidly in the presence of FH (CA t1/2 =3.2min), with complexes disappearing within 2 minutes (Figure 3C).
FH inhibits C3 convertase formation on ECM surface in dose-dependent manner
Factor H can disrupt formation of C3 convertase, perform decay acceleration activity (DAA) on already existing C3bBb complexes and act as a cofactor for another complement inhibitor, Factor I (FI) (32, 35, 36). Here we used the convertase formation assay to assess the impact of FH on C3 convertase formation. Decreasing concentrations of FH increased C3 convertase formation in dose-dependent manner (Figure 4A). Similarly, increasing concentrations of stabilizing properdin promoted dose-dependent increase in C3bBb formation (Figure 4B).
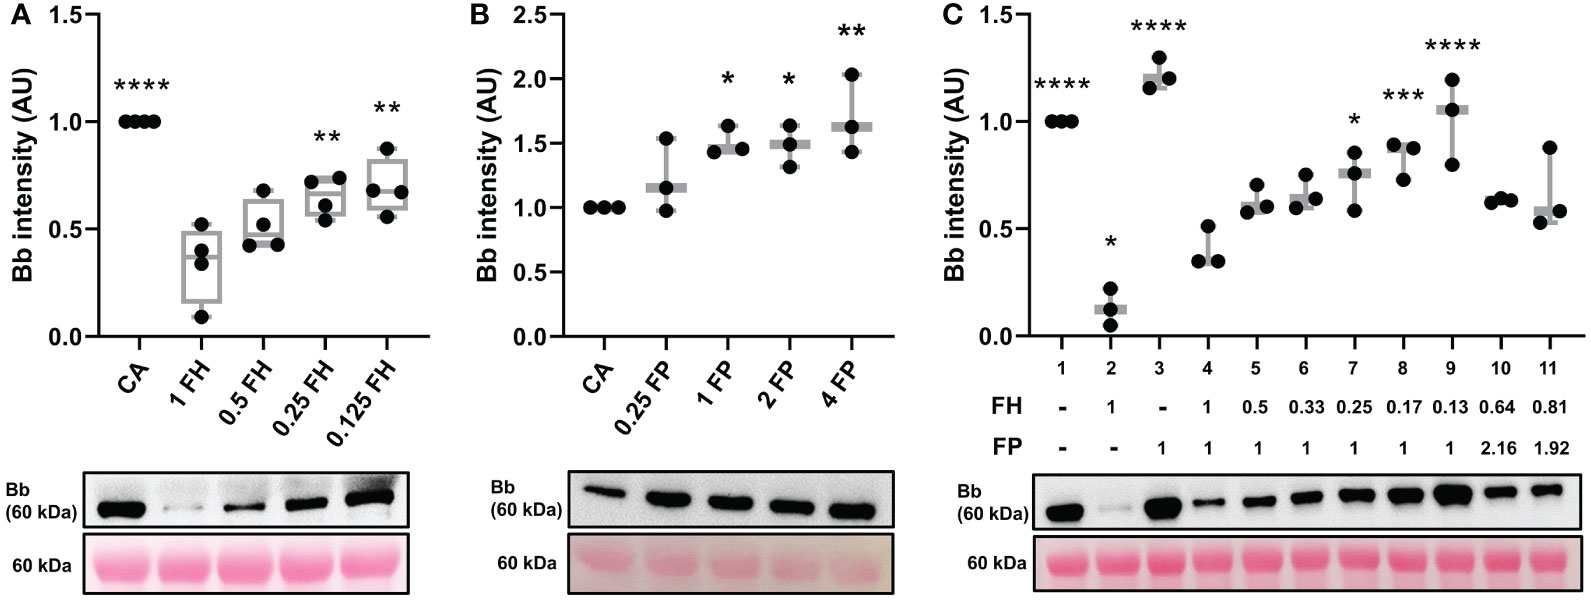
Figure 4 FH inhibits C3 convertase formation in dose dependent manner. (A) Western blot analysis of C3 convertase formed in presence of varying amounts of FH. Decreasing the concentration of FH (lanes 3-5) leads to decreased inhibition of C3 convertase formation in dose-depended manner, as compared to the normal physiological concentration of FH (lane 2). Box plots show median, 1st and 3rd quartile ranges, and the individual data points of four independent experiments. (B) Western blot analysis of C3 convertase formed in presence of varying amounts of properdin. Increasing the concentration of FP (lanes 3-5) leads to increased formation of C3 convertase in dose-depended manner, as compared to convertase alone (CA, lane 1). (C) Western blot analysis of C3 convertase formed in presence of decreasing FH : FP ratio. Decreasing the ratio of FH : FP (lanes 5-9) leads to decreased FH inhibition of complement formation in dose-dependent manner. Low FH : FP ratios allow for a significant increase (lanes 7-9) in convertase formation as compared to the physiological FH : FP ratio (lane 4). FH and FP biomarkers of two C3G patients with elevated FP levels from MORL C3G cohort are shown in lanes 10 (FH: 287ug/mL, FP: 43.2 ug/mL) and 11 (FH: 363 ug/mL, FP: 38.4 ug/mL). Results were normalized to CA and presented as relative protein expression. Ponceau S Staining was used as a measure of total protein load. Box plots show median, 1st and 3rd quartile ranges, and the individual data points of three independent experiments. Significance calculated for CA. * P ≤ 0.05, ** P ≤ 0.01, *** P ≤ 0.001, **** P ≤ 0.0001.
We modeled a range of Factor H:Properdin ratios by decreasing FH concentration while maintaining FP concentration to determine how changes in the relative ratio affect C3 convertase regulation on ECM surface (Figure 4C, lanes 4-9). A significant difference was observed at a ratio of FH : FP 0.25:1 (lane 7) which corresponds to 112.5 ug/ml FH and 20 ug/ml FP. We also modeled FH : FP ratios from two C3G patients with very high FP values (Table 1) (lanes 10-11). Neither reached significance when compared to the normal physiological ratio (lane 4, Figure 4C).
Assessment of genetic drivers of C3G
Genetic variation in CFB may lead to variation in C3 convertase activity and regulation
Three variants in CFB were assessed using our ECM-based model: one in the region encoding for the CCP2 subunit of Ba and two in the VWA subunit of Bb (Figure 5A). Convertase formation was significantly less with recombinant WT FB (FB his) (Figure 5B, lane 3) as compared to WT FB (lane 1); addition of FH prevented convertase formation entirely (lanes 2 and 4). The p.Arg138Trp failed to form active C3 convertase alone (lane 5) as well as in presence of FH (lane 6). The p.Asp279Gly, a gain-of-function mutation characterized by a high affinity for C3b and resistance to natural and FH-assisted decay (37–39), resulted in increased amounts of C3 convertase formation (lane 7). FH was not able to prevent C3 convertase formation by p.Asp279Gly (lane 8). No active C3bBb was observed for the p.Phe286Leu (lanes 9-10), but C3bB formed in absence and presence of FH, lanes 9-10).
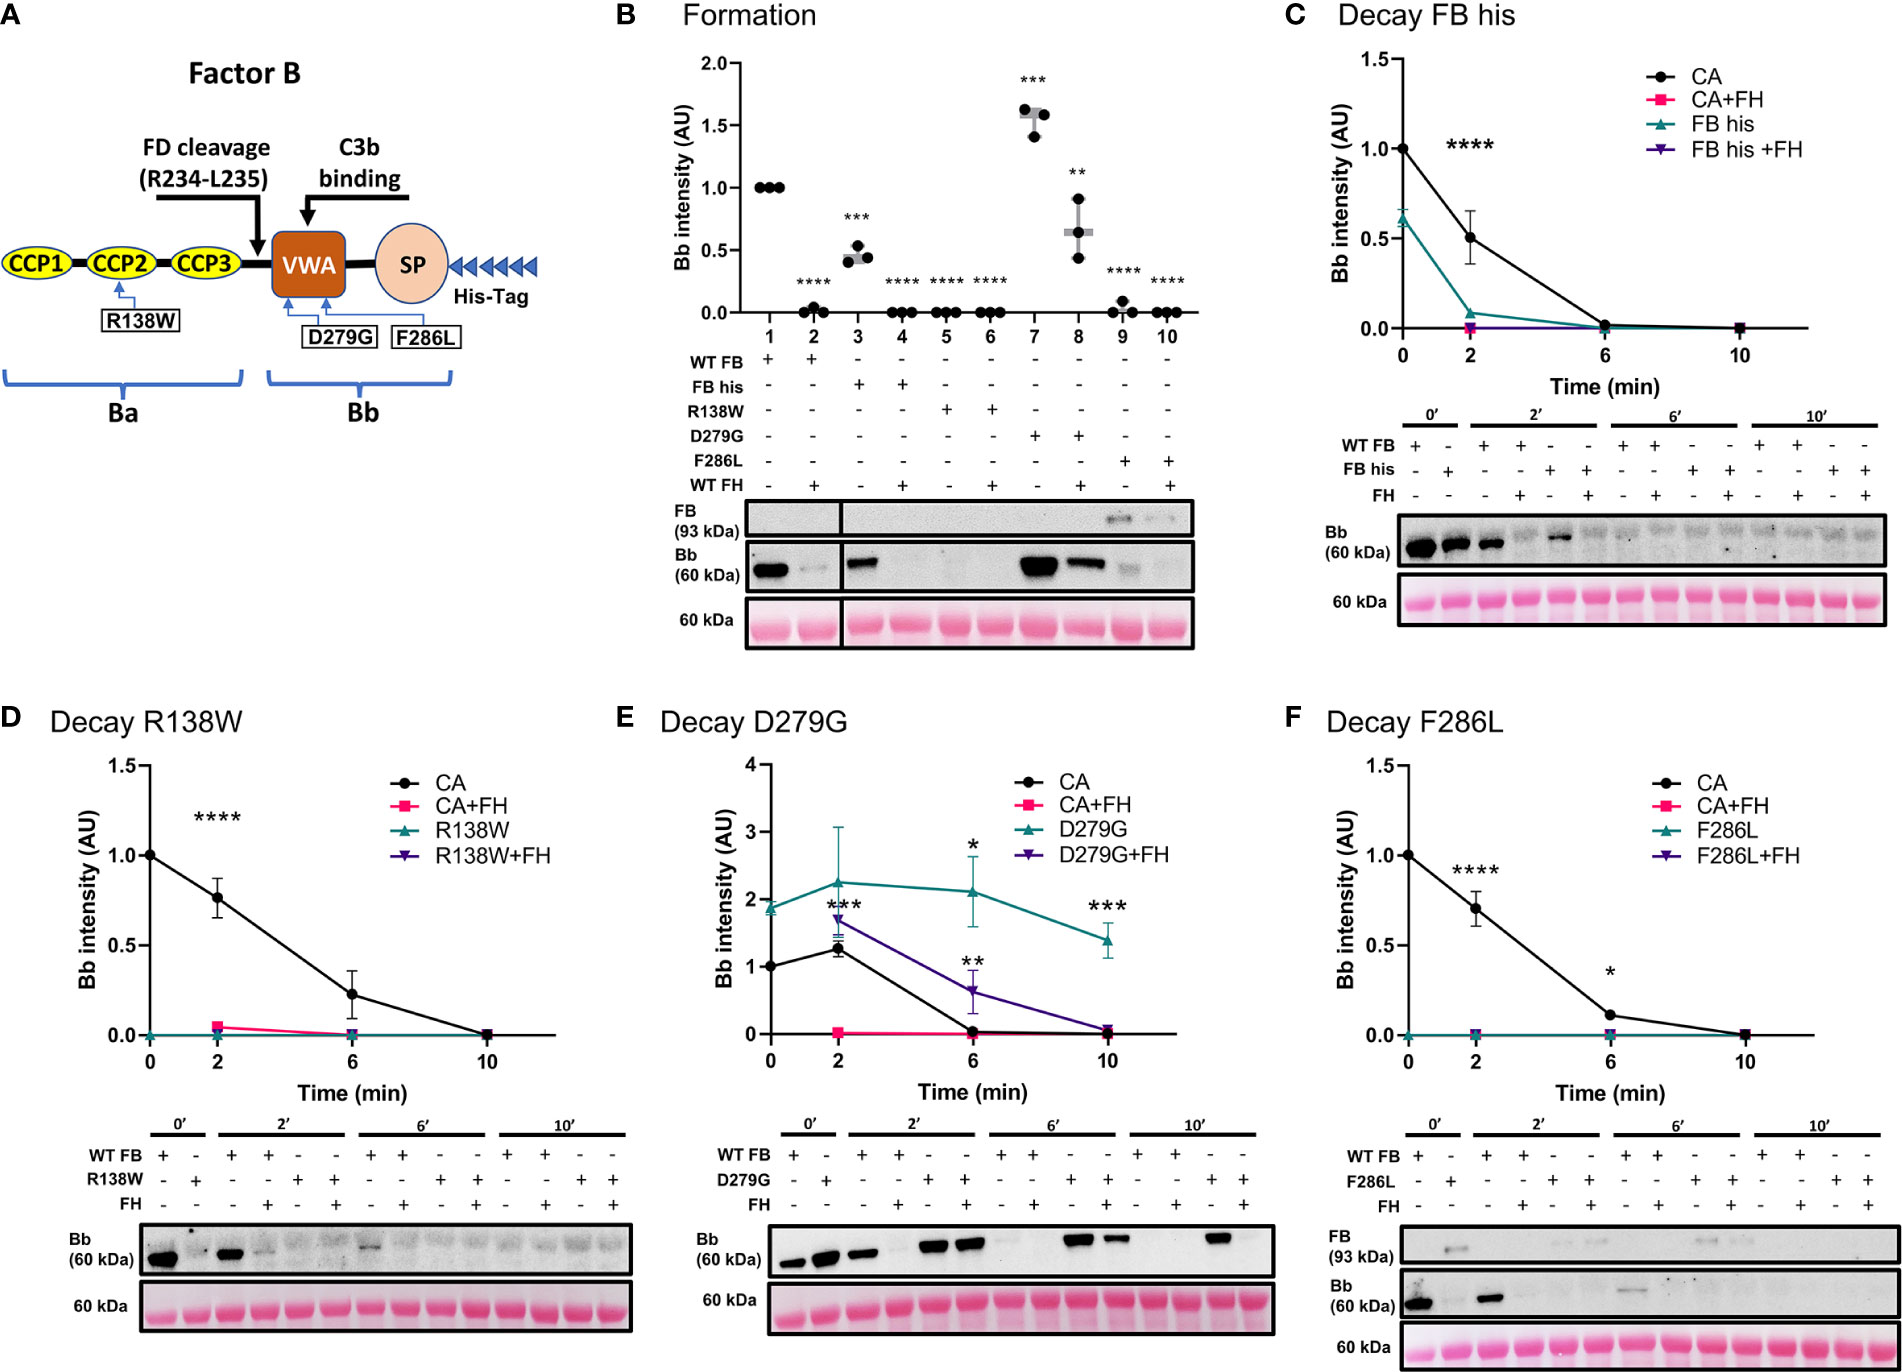
Figure 5 Variants in CFB can affect its affinity for C3b binding and rate of C3 convertase decay in presence/absence of FH. (A) Schematic of recombinant FB proteins, blue arrows denoting the positions of specific mutants. (B) Western blot analysis of C3 convertase formation. Recombinant WT FB (FB his) shows decreased ability to form C3 convertase (lanes 3) as compared to WT FB (CA, lanes 1). There is no formation in presence of FH (lanes 2 and 4). Both p.Arg138Trp (lanes 5-6) and p.Phe286Leu (lanes 9-10) fail to form C3bBb in absence/presence of FH. p.Asp279Gly increases C3 convertase formation ~1.5-fold (lane 7) as compared to CA (lane 1) and is able to form C3bBb even in presence of FH (lane 8). Results were normalized to CA and presented as relative protein expression. Box plots show median, 1st and 3rd quartile ranges, and the individual data points of three independent experiments. Significance calculated for WT FB. (C) Western blot analysis of CA formed using WT FB or FB his, then decayed in presence/absence of FH. Decrease in C3 convertase at 0 and 2 min is observed as compared to WT FB. (D) Western blot analysis of CA formed using WT or p.Arg138Trp, then decayed in absence/presence of FH. No mutant convertase activity is observed at 0 min as compared to WT FB. (E) Western blot analysis of CA formed using WT or p.Asp279Gly, then decayed in absence/presence of FH. Decrease in natural and FH-mediated decay of p.Asp279Gly C3bBb is observed as compared to WT FB at all timepoints. (F) Western blot analysis of CA formed using WT or p.Phe286Leu, then decayed in absence/presence of FH. No mutant convertase activity is observed at 0 min as compared to WT FB. For all decay experiments, results were normalized to CA at 0 min and presented as relative protein expression. Ponceau S Staining was used as a measure of total protein load. Statistical significance shown for comparisons between CA/recombinant protein and CA+FH/recombinant protein+FH respectively at the same timepoint. Mean ± SD of three independent experiments. * P ≤ 0.05, ** P ≤ 0.01, *** P ≤ 0.001, **** P ≤ 0.0001.
The C3 convertase decay assay was used to assess the mutants’ natural and FH-mediated decay. As predicted from the results of the formation assay, FB his showed significantly less C3bBb after 2 min as compared to WT FB (FB his t1/2~0.24 min, CA t1/2 =2.2 min). Addition of FH resulted in complete decay of C3 convertase at 2 min (Figure 5C). Both p.Arg138Trp (Figure 5D) and p.Phe286Leu (Figure 5F) failed to form C3bBb, thus the observed absence of C3 convertase at 0 and 2 min of decay with or without FH was expected. C3bB resulting from the p.Phe286Leu was present after 10 min of natural and FH-mediated decay. Natural decay of C3bBb formed with p.Asp279Gly was significantly slower as compared to WT FB (D279G t1/2>10 min, CA t1/2 = 4.2min). Decaying p.Asp279Gly C3 convertase with FH resulted in decreased DAA (D279G+FH t1/2 = 6.6 min), with convertase complexes still seen at 6 min (Figure 5E).
Pathogenic variation in SCR 1-3 of CFH leads to decreased inhibitory function of FH on ECM surface
We performed functional studies on three reported pathogenic variants in CFH (Figure 6A). The C3 convertase formation assay was performed to assess the ability of recombinant WT FH (FH his) and FH mutants to prevent C3 convertase formation. Non-recombinant WT FH and FH his prevented C3 convertase formation equally well (Figure 6B). p.Arg53Cys also prevented C3bBb formation. In contrast, p.Trp134Arg and p.Arg175Pro showed diminished ability to inhibit C3 convertase formation as compared to WT FH (Figure 6C).
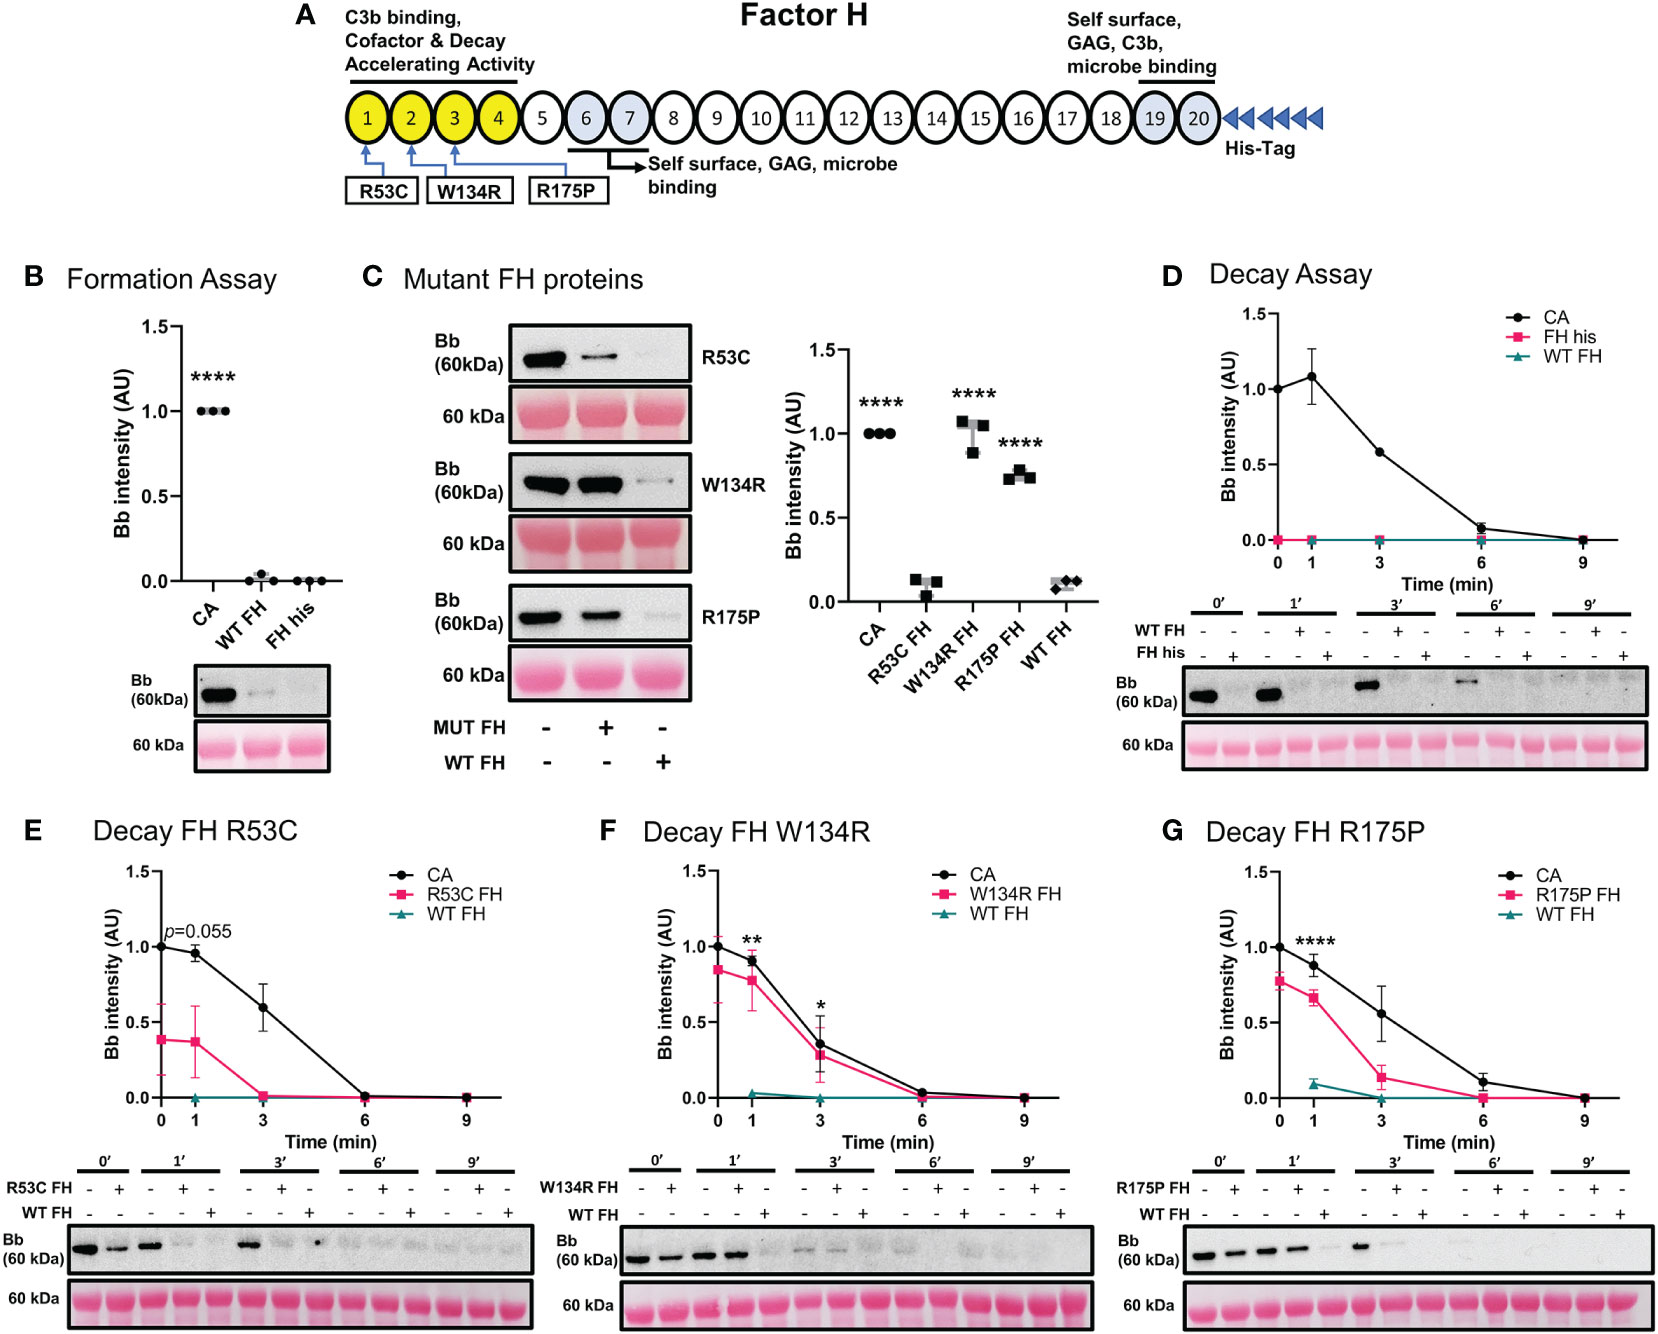
Figure 6 Variants in CFH can affect its ability to inhibit C3 convertase formation and promote Decay Acceleration Activity. (A) Schematic of recombinant FH proteins, blue arrows denoting the positions of specific mutants. (B) Western blot analysis of C3 convertase formed alone (CA), or in presence of WT FH or recombinant WT FH (FH his). Recombinant WT FH inhibits C3bBb formation to the same degree as WT FH. (C) Western blot analysis of CA formed alone, or in presence of recombinant FH variants or WT FH. p.Arg53Cys inhibits C3bBb formation to the same degree as WT FH, while p.Trp134Arg and p.Arg175Pro shows significant impairment in their ability to prevent C3 convertase formation. Results were normalized to CA and presented as relative protein expression. Box plots show median, 1st and 3rd quartile ranges, and the individual data points of three independent experiments. Significance calculated for WT FH. (D) Western blot analysis of CA formed alone, then decayed in buffer, or with WT FH or recombinant WT FH. There is no difference between the two FH conditions. (E) Western blot analysis of CA formed alone, then decayed in buffer, or with p.Arg53Cys or WT FH. p.Arg53Cys almost reached significance at 1 min as compared to WT FH (p=0.055). (F) Western blot analysis of CA formed alone, then decayed in buffer, or with p.Trp134Arg or WT FH. p.Trp134Arg (t1/2 =2 min, t1/2 =2.5 min) shows very poor DAA, providing only 20% decrease in C3bBb half-life as compared to CA. (G) Western blot analysis of CA formed alone, then decayed in buffer, or with p.Arg175Pro or WT FH. p.Arg175Pro (t1/2~1.5 min, CA t1/2 =3.1 min) decreases DAA as compared to WT FH. For all decay experiments, results were normalized to CA at 0 min and presented as relative protein expression. Ponceau S Staining was used as a measure of total protein load. Mean ± SD of three independent experiments. Statistical significance shown for comparisons between WT FH/recombinant FH at the same timepoint. * P ≤ 0.05, ** P ≤ 0.01, *** P ≤ 0.001, **** P ≤ 0.0001.
Next, we tested the decay accelerating activity of FH his and FH mutants. FH his was as effective as WT FH in accelerating C3 convertase decay (Figure 6D). C3 convertase decay rate in presence of p.Arg53Cys (CA t1/2 =3.1 min) was not significantly different from WT FH (P=0.055) at 1 min (Figure 6E). The presence of either p.Trp134Arg (Figure 6F) or p.Arg175Pro (t1/2~1.5 min, CA t1/2 =3.1 min) (Figure 6G) exhibited a significantly slower DAA at 1 min as compared to WT FH. Notably, p.Trp134Arg mutant showed particularly poor DAA; its t1/2 =2 min compared to untreated CA t1/2 =2.5 min.
Assessment of acquired drivers of C3G
IgG derived from C3Nef-positive C3G patients stabilized C3 convertase, some promoted formation
Antibodies against AP C3 convertase called C3 Nephritic Factors (C3Nefs) are a common driver of disease (2, 40). Here, we used C3 convertase decay and formation assays to assess the stabilization capacity of IgG derived from C3Nef-positive C3G patients (Figure 7) (Table 1). Addition of normal human serum IgG (NHS IgG) in C3CDA did not affect the decay rate of convertase (Figure 7B). Stabilization of C3 convertase was observed most prominently with P1 IgG (P1 t1/2 = 8.9 min, CA t1/2 = 4.3min) (Figure 7C) and P2 IgG (P2 t1/2 = 9.4 min, CA t1/2 = 4.9 min) (Figure 7D), which showed 2- and 1.9-fold increases in half-life, respectively. Addition of P3 IgG (P3 t1/2 = 8.7 min CA t1/2 = 5 min) allowed for 1.7-fold increase in convertase half-life (Figure 7E). All C3Nef-positive patient IgG promoted C3 convertase stabilization past 10 min, as compared to NHS IgG (Figure 7F). Interestingly, P3 IgG consistently formed more C3 convertase in the C3CFA than did P1 or P2 IgG (Figure 7A).
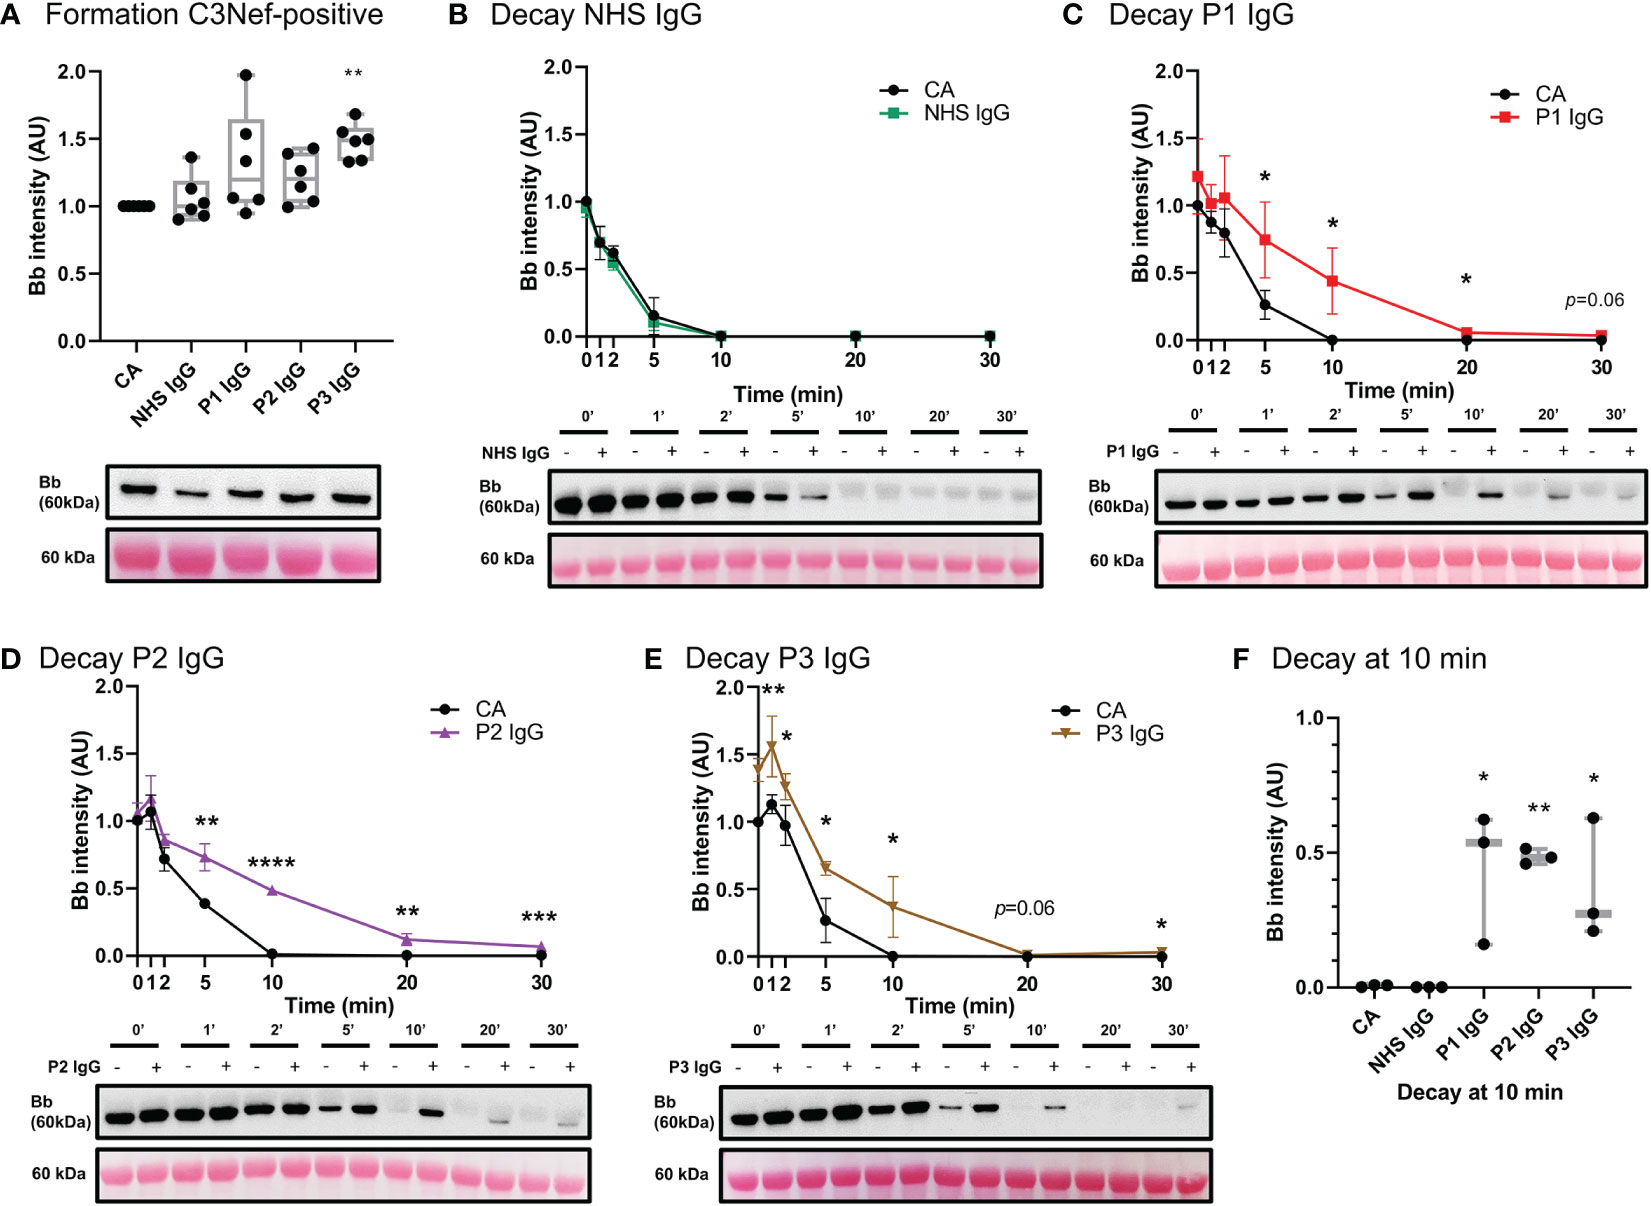
Figure 7 IgG from C3Nef+ C3G patients stabilize C3 convertase and decrease its decay rate. (A) Western blot analysis of CA formed alone, or in presence of NHS, P1, P2 or P3 IgG. P3 IgG significantly increases C3bBb formation. Results were normalized to CA and presented as relative protein expression. Box plots show median, 1st and 3rd quartile ranges, and the individual data points of six independent experiments. Significance calculated for NHS IgG. (B) Western blot analysis showing C3 convertase formed alone (CA) or in presence of NHS IgG, then decayed for up to 30 min. NHS IgG do not stabilize C3 convertase (NHS IgG t1/2 = 3 min, CA t1/2 = 3.36 min). (C–E) Western blot analyses showing C3 convertase formed alone (CA) or in presence of IgG derived from C3Nef+ patients, then decayed for up to 30 min. (C) P1 IgG stabilizes C3bBb 2-fold (P1 t1/2 = 8.9 min, CA t1/2 = 4.3min). (D) P2 IgG stabilizes C3bBb 1.9-fold (P2 t1/2 = 9.4 min, CA t1/2 = 4.9 min). (E) P3 IgG stabilizes C3bBb 1.7-fold (P3 t1/2 = 8.7 min CA t1/2 = 5 min). Mean ± SD of three independent experiments. Statistical significance shown for comparisons between CA/Patient IgG at the same timepoint. (F) Composite box plots showing C3 convertase stabilization by IgG from C3Nef+ C3G patients after 10 min of decay in buffer. For all decay experiments, results were normalized to CA at 0 min and presented as relative protein expression. Ponceau S Staining was used as a measure of total protein load. Box plots show median, and the individual data points of three independent experiments. Significance calculated for NHS IgG at 10 min. * P ≤ 0.05, ** P ≤ 0.01, *** P ≤ 0.001, **** P ≤ 0.0001.
Three C3Nef-negative patient IgG (Table 1) showed increased stabilization of C3bBb in decay assays: 1.3-fold increase in C3bBb half-life in the presence of P4 IgG (P4 t1/2 = 7 min, CA t1/2 = 5.5 min), 1.7-fold with P5 IgG (P5 t1/2 = 5.5 min, CA t1/2 = 3.3 min) and 1.2-fold with P6 IgG (P6 t1/2 = 5.6 min CA t1/2 = 4.6 min) (Figure 8C–E). While P6 IgG and P7 IgG allowed for some convertase stabilization at 10 min post formation (Figure 8F), it is evident that little to no C3bBb complexes were present on the ECM surface past that timepoint. The convertase formation assay showed no significant change in any C3Nef-negative patient IgG (Figure 8A).
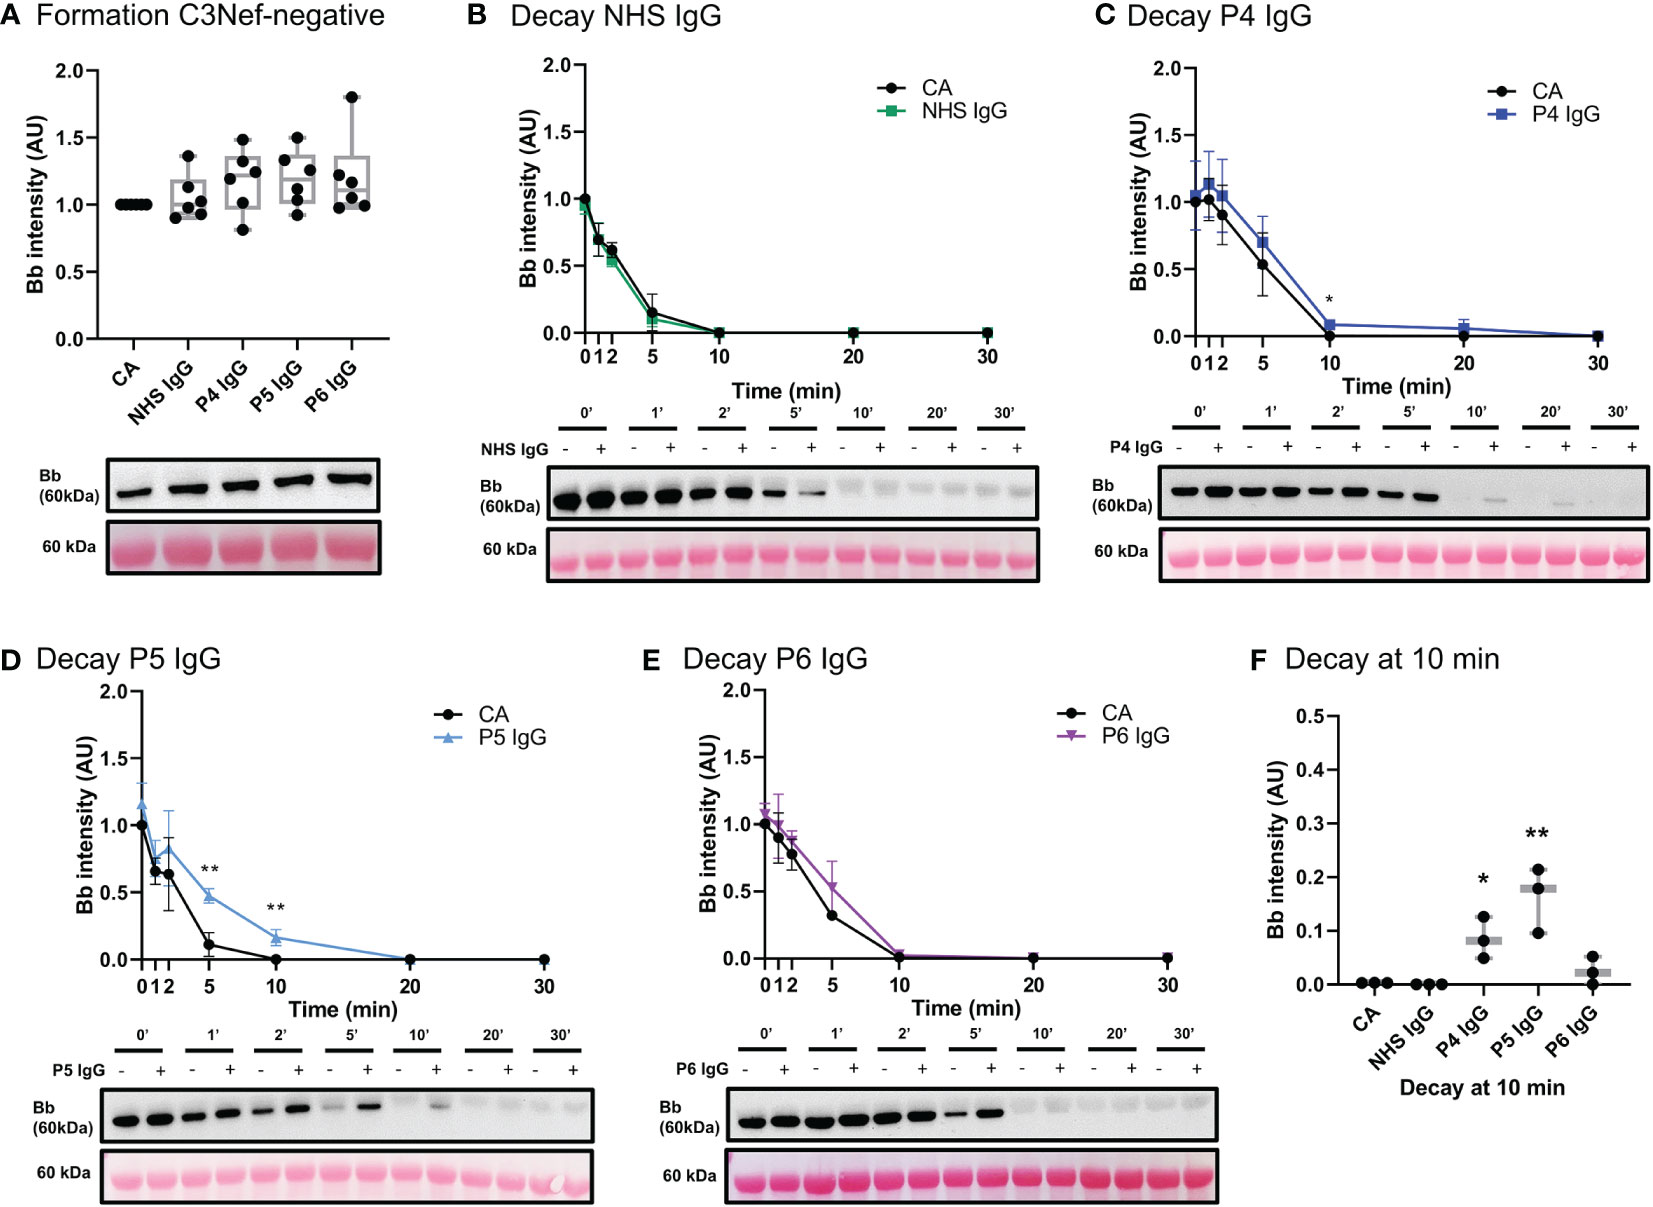
Figure 8 IgG from C3Nef- C3G patients do not promote C3 convertase formation but can increase its stability. (A) Western blot analysis of CA formed alone, or in presence of NHS, P4, P5 or P6 IgG. IgG from C3Nef-negative C3G patients does not affect C3bBb formation. Results were normalized to CA and presented as relative protein expression. Box plots show median, 1st and 3rd quartile ranges, and the individual data points of six independent experiments. Significance calculated for NHS IgG. (B) Western blot analysis showing C3 convertase formed alone (CA) or in presence of NHS IgG, then decayed for up to 30 min. NHS IgG do not stabilize C3 convertase (NHS IgG t1/2 = 3 min, CA t1/2 = 3.36 min). (C–E) Western blot analyses shows C3 convertase formed alone (CA) or in presence of IgG derived from C3Nef- patients, then decayed for up to 30 min. (C) P4 IgG increases C3bBb half-life 1.3-fold (P4 t1/2 = 7 min, CA t1/2 = 5.5 min). (D) P5 IgG increases C3bBb half-life 1.7-fold (P5 t1/2 = 5.5 min, CA t1/2 = 3.3 min). (E) P6 IgG increases C3bBb half-life 1.2-fold (P6 t1/2 = 5.6 min CA t1/2 = 4.6 min). Mean ± SD of three independent experiments. Statistical significance shown for comparisons between CA/Patient IgG at the same timepoint. (F) Composite box plots showing C3 convertase stabilization by IgG from C3Nef-negative patients (P4, P5) after 10 min of decay in buffer. For all decay experiments, results were normalized to CA at 0 min and presented as relative protein expression. Ponceau S Staining was used as a measure of total protein load. Box plots show median, and the individual data points of three independent experiments. Significance calculated for NHS IgG at 10 min. * P ≤ 0.05, ** P ≤ 0.01, *** P ≤ 0.001, **** P ≤ 0.0001.
Discussion
In this body of work, we present an in vitro model of C3G that utilizes human ECM (MaxGel), purified human complement proteins, and patient-derived antibodies to improve our understanding of C3G pathogenesis and promote patient-specific diagnostics. The first step in the development and validation of this model was to ensure that any change in C3bBb observed was due to the proteins added and not potential contamination of the ECM. We show that MaxGel does not permit C3 convertase formation unless all three essential components of the convertase are added, and that fluid-phase complement regulators successfully inhibit (FH) or promote (FP) convertase formation (Figure 3A). These outcomes are consistent with previous studies (41–47) and confirm the expected negative and positive regulation of C3bBb on ECM surface by FH and properdin, respectively. We also show that when formed in presence of properdin, the decay of C3bBb is >2 times slower (Supplemental Table 1) as compared to untreated C3 convertase (Figure 3B). These results align with the findings of a classical 1975 study where C3 convertase assembled with FP on sheep erythrocyte surface was stabilized 1.5- to 10-fold (34). It is important to note that different surfaces used as a base for C3 convertase reconstitution have been shown to result in different C3bBb half-lives (plastic = ~90 sec (48), sheep erythrocytes ~4 min (34), MaxGel ~ 3.8 min), highlighting the importance of studying complement activation on a surface that is relevant to disease pathogenesis. Next, we also showed the expected dose-response of the addition of FH and/or FP on C3bBb regulation, as confirmed by their concentration gradients and a combined assessment of FH : FP ratios (Figure 4). The results of patient-specific FH : FP assessments aligned with the gradient curve established in lanes 4-9 (Figure 4C), suggesting that the FH : FP ratio alone is not necessarily a predictor of pathogenicity.
To assess the genetic drivers of C3G, the impact of three variants each in CFB and CFH on C3 convertase formation and decay was characterized. With respect to CFB, we largely recapitulated the described phenotypes (Figure 5). p.Arg138Trp and p.Asp279Gly caused loss-of-function and gain-of-function effects, respectively (38, 49). With p.Phe286Leu, we observed very few active C3bBb complexes; uncleaved C3bB (50, 51) complexes were present instead, even when formed and decayed with FH. These data suggest that under physiological concentrations of FB and FD, p.Phe286Leu FB may have a high affinity for C3b while not being successfully cleaved by FD. A similar phenotype of p.Phe286Leu was shown in a 2007 study, where this mutant’s high affinity for C3b and decreased cleavage by FD was hypothesized to result in generation of abundant, rapidly cycling C3 convertase if supplied with unlimited FB (39). Considering both sets of data, we instead hypothesize that under normal physiological concentrations, the impaired cleavage of FB p.Phe286Leu by FD compensates for its increased affinity towards C3b. In light of a recent finding describing FD-independent AP activation (52), we also hypothesize that the incorporation of highly decay-resistant FB p.Phe286Leu into C3(H2O)B may lead to increased C3 cleavage over time, thus propagating the complement amplification process.
C3 convertase formation and decay assays were used to assess three well-characterized pathogenic variants (p.Arg53Cys, p.Trp134Arg, p.Arg175Pro) in short consensus repeats 1-3 of CFH. Their respective inhibitory functions recapitulated the results from the previous studies (Figure 6) (23, 24).
We next assessed the acquired drivers of C3G. IgG from six C3G patients was assessed for C3bBb stabilization capacity (Table 1), and a spectrum of outcomes was found. While showing no effect on convertase formation rate, some IgG derived from C3Nef-negative patients had a mild stabilizing effect on C3bBb up to 10 min post formation. This finding suggests that some IgG derived from C3Nef-negative patients may stabilize C3bBb for a short period of time, likely contributing to the overall disease pathogenesis when other disease factors are present. Assessments of C3Nef-positive patient-derived IgG resulted in expected increases in C3 convertase half-life, consistent with described C3Nef functions (3, 18, 20). Importantly, unlike any other IgG tested, P3 IgG increased C3bBb formation while providing weak stabilization (Table 1), suggesting a novel method of C3G pathogenesis whereby C3Nefs promote increased formation of C3bBb.
There are two main limitations to the proposed model. First, while MaxGel is a human basement membrane extract, we cannot ensure that it recapitulates the exact composition of the ECM found in human kidneys. Differences in glycosaminoglycan composition may need to be considered when evaluating convertase regulation by FH and FP on the surface of these ECM. Second, His-tags on the recombinant proteins may change complement dynamics and pathway activity, as demonstrated by the His-tagged WT FB (Figure 5B, lanes 3-4; 5C). Decreased C3bBb formation and faster convertase decay with recombinant WT FB indicate the need to control for the effects of His-tags on these processes and adjust the data interpretation accordingly.
In summary, we have developed a new model to test complement activity and regulation on an ECM surface. This model recapitulates normal complement activity and when used to test both genetic and acquired drivers of C3G, provides valuable insights into how complement activity can be altered in this microenvironment. Its further applications to complement-mediated glomerular diseases may facilitate patient-specific insights into disease pathogenesis.
Data availability statement
The original contributions presented in the study are included in the article/Supplementary Material. Further inquiries can be directed to the corresponding author.
Ethics statement
The studies involving human participants were reviewed and approved by Institutional Review Board of the University of Iowa. The patients/participants provided their written informed consent to participate in this study.
Author contributions
RS and YZ conceived the study. SP and XX designed the protocol. SP troubleshot the protocol, designed and carried out the experiments, analyzed the data, made the figures and drafted the manuscript. NM and RG quantified C3Nefs. RS, YZ, CN, NM and SP revised the manuscript. All authors contributed to the article and approved the submitted version.
Funding
National Institutes of Health, Grant/Award. Number: R01 DK110023.
Acknowledgments
The authors would like to sincerely thank the patients enrolled in the study. We would also like to thank Dr. Mikhail Kulak for sharing his expertise with western blots.
Conflict of interest
The authors declare that the research was conducted in the absence of any commercial or financial relationships that could be construed as a potential conflict of interest.
Publisher’s note
All claims expressed in this article are solely those of the authors and do not necessarily represent those of their affiliated organizations, or those of the publisher, the editors and the reviewers. Any product that may be evaluated in this article, or claim that may be made by its manufacturer, is not guaranteed or endorsed by the publisher.
Supplementary material
The Supplementary Material for this article can be found online at: https://www.frontiersin.org/articles/10.3389/fimmu.2022.1073802/full#supplementary-material
References
1. Pickering MC, D’agati VD, Nester CM, Smith RJ, Haas M, Appel GB, et al. C3 glomerulopathy: Consensus report. Kidney Int (2013) 84(6):1079–89. doi: 10.1038/ki.2013.377
2. Smith RJH, Appel GB, Blom AM, Cook HT, D’Agati VD, Fakhouri F, et al. C3 glomerulopathy — understanding a rare complement-driven renal disease. Nat Rev Nephrol. (2019) 1 5:129–43. doi: 10.1038/s41581-018-0107-2
3. Heiderscheit AK, Hauer JJ, Smith RJH. C3 glomerulopathy : Understanding an ultra-rare complement- mediated renal disease. Am J Med Genet (2022) 190(3):344–57. doi: 10.1002/ajmg.c.31986
4. Servais A, Noël LH, Roumenina LT, Le Quintrec M, Ngo S, Dragon-Durey MA, et al. Acquired and genetic complement abnormalities play a critical role in dense deposit disease and other C3 glomerulopathies. Kidney Int (2012) 82(4):454–64. doi: 10.1038/ki.2012.63
5. Rabasco C, Cavero T, Román E, Rojas-Rivera J, Olea T, Espinosa M, et al. Effectiveness of mycophenolate mofetil in C3 glomerulonephritis. Kidney Int (2015) 88(5):1153–60. doi: 10.1038/ki.2015.227
6. Iatropoulos P, Noris M, Mele C, Piras R, Valoti E, Bresin E, et al. Complement gene variants determine the risk of immunoglobulin-associated MPGN and C3 glomerulopathy and predict long-term renal outcome. Mol Immunol (2016) 71:131–42. doi: 10.1016/j.molimm.2016.01.010
7. Angelo JR, Bell CS, Braun MC. Allograft failure in kidney transplant recipients with membranoproliferative glomerulonephritis. Am J Kidney Dis (2011) 57(2):291–9. doi: 10.1053/j.ajkd.2010.09.021
8. Zand L, Lorenz EC, Cosio FG, Fervenza FC, Nasr SH, Gandhi MJ, et al. Clinical findings, pathology, and outcomes of C3GN after kidney transplantation. J Am Soc Nephrol. (2014) 25(5):1110–7. doi: 10.1681/ASN.2013070715
9. Li P, Ponnala L, Gandotra N, Wang L, Si Y, Tausta SL, et al. The developmental dynamics of the maize leaf transcriptome. Nat Genet (2010) 42(12):1060–7. doi: 10.1038/ng.703
10. Regunathan-Shenk R, Avasare RS, Ahn W, Canetta PA, Cohen DJ, Appel GB, et al. Kidney transplantation in C3 glomerulopathy: A case series. Am J Kidney Dis (2019) 73(3):316–23. doi: 10.1053/j.ajkd.2018.09.002
11. Satchell SC, Braet F. Glomerular endothelial cell fenestrations: An integral component of the glomerular filtration barrier. Am J Physiol - Ren Physiol (2009) 296(5):F947–56. doi: 10.1152/ajprenal.90601.2008
12. Butler MJ, Down CJ, Foster RR, Satchell SC. The pathological relevance of increased endothelial glycocalyx permeability. Am J Pathol (2020) 190(4):742–51. doi: 10.1016/j.ajpath.2019.11.015
13. Pollak MR, Quaggin SE, Hoenig MP, Dworkin LD. The glomerulus: The sphere of influence. Clin J Am Soc Nephrol. (2014) 9(8):1461–9. doi: 10.2215/CJN.09400913
14. Arkill KP, Qvortrup K, Starborg T, Mantell JM, Knupp C, Michel CC, et al. Resolution of the three dimensional structure of components of the glomerular filtration barrier. BMC Nephrol. (2014) 15(1):1–13. doi: 10.1186/1471-2369-15-24
15. Brenner BM, Hostetter TH, Humes HD. Molecular basis of protenuria of glomerular origin. N Engl J Med (1978) 298(15):826–33. doi: 10.1056/NEJM197804132981507
16. Myers BD, Guasch A. Selectivity of the glomerular filtration barrier in healthy and nephrotic humans. Am J Nephrol. (1993) 13(5):311–7. doi: 10.1159/000168645
17. Ricklin D, Reis ES, Mastellos DC, Gros P, Lambris JD. Complement component C3 - the “Swiss army knife” of innate immunity and host defense. Immunol Rev (2016) 274(1):33–58. doi: 10.1111/imr.12500
18. Zhang Y, Meyer NC, Wang K, Nishimura C, Frees K, Jones M, et al. Causes of alternative pathway dysregulation in dense deposit disease. Clin J Am Soc Nephrol. (2012) 7(2):265–74. doi: 10.2215/CJN.07900811
19. Iatropoulos P, Daina E, Curreri M, Piras R, Valoti E, Mele C, et al. Cluster analysis identifies distinct pathogenetic patterns in c3 glomerulopathies/immune complex–mediated membranoproliferative GN. J Am Soc Nephrol. (2018) 29(1):283–94. doi: 10.1681/ASN.2017030258
20. Daha MR, Fearon DT, Austen KF. C3 nephritic factor ( C3NeF ): Stabilization of fluid phase and cell-bound alternative pathway convertase. J Immunol (1976) 116(1):1–7. doi: 10.4049/jimmunol.116.1.1
21. Michels MAHM, van de Kar NCAJ, Okrój M, Blom AM, van Kraaij SAW, Volokhina EB, et al. Overactivity of alternative pathway convertases in patients with complement-mediated renal diseases. Front Immunol (2018) 9(APR):1–13. doi: 10.3389/fimmu.2018.00612
22. Rodríguez De Córdoba S, Esparza-Gordillo J, Goicoechea De Jorge E, Lopez-Trascasa M, Sánchez-Corral P. The human complement factor h: Functional roles, genetic variations and disease associations. Mol Immunol (2004) 41(4):355–67. doi: 10.1016/j.molimm.2004.02.005
23. Merinero HM, García SP, García-Fernández J, Arjona E, Tortajada A, Rodríguez de Córdoba S. Complete functional characterization of disease-associated genetic variants in the complement factor h gene. Kidney Int (2018) 93(2):470–81. doi: 10.1016/j.kint.2017.07.015
24. Martín Merinero H, Zhang Y, Arjona E, del Angel G, Goodfellow R, Gomez-Rubio E, et al. Functional characterization of 105 factor h variants associated with aHUS: lessons for variant classification. Blood (2021) 138(22):2185–201. doi: 10.1182/blood.2021012037
25. Nester CM, Smith RJ. Diagnosis and treatment of C3 glomerulopathy. Clin Nephrol. (2013) 80(6):395–404. doi: 10.5414/CN108057
26. Nester CM, Smith RJH. Complement inhibition in C3 glomerulopathy. Semin Immunol (2016) 28(3):241–9. doi: 10.1016/j.smim.2016.06.002
27. Nangaku M. Complement regulatory proteins in glomerular diseases. Kidney Int (1998) 54(5):1419–28. doi: 10.1046/j.1523-1755.1998.00130.x
28. Li X, Ding F, Zhang X, Li B, Ding J. The expression profile of complement components in podocytes. Int J Mol Sci (2016) 17(4):471. doi: 10.3390/ijms17040471
29. Dane MJC, Van Den Berg BM, Lee DH, Boels MGS, Tiemeier GL, Avramut MC, et al. A microscopic view on the renal endothelial glycocalyx. Am J Physiol - Ren Physiol (2015) 308(9):F956–66. doi: 10.1152/ajprenal.00532.2014
30. Yilmaz O, Afsar B, Ortiz A, Kanbay M. The role of endothelial glycocalyx in health and disease. Clin Kidney J (2019) 12(5):611–9. doi: 10.1093/ckj/sfz042
31. Kouser L, Abdul-Aziz M, Nayak A, Stover CM, Sim RB, Kishore U. Properdin and factor h: opposing players on the alternative complement pathway “see-saw”. Front Immunol (2013) 4:93. doi: 10.3389/fimmu.2013.00093
32. Parente R, Clark SJ, Inforzato A, Day AJ. Complement factor h in host defense and immune evasion. Cell Mol Life Sci (2016)74:1605–24. doi: 10.1007/s00018-016-2418-4
34. Fearon DT, Austen KF. PROPERDIN : BINDING TO C3b AND STABILIZATION OF THE C3b-DEPENDENT C3 CONVERTASE. J Exp Med (1975) 142:856–63. doi: 10.1084/jem.142.4.856.
35. Nilsson SC, Sim RB, Lea SM, Fremeaux-Bacchi V, Blom AM. Complement factor I in health and disease. Mol Immunol (2011) 48(14):1611–20. doi: 10.1016/j.molimm.2011.04.004
36. Kopp A, Hebecker M, Svobodová E, Józsi M. Factor h: A complement regulator in health and disease, and a mediator of cellular interactions. Biomolecules (2012) 2(1):46–75. doi: 10.3390/biom2010046
37. Hourcade DE, Mitchell LM, Teresa J, Hourcade DE, Mitchell LM, Oglesby TJ. Mutations of the type a domain of complement factor b that promote high-affinity high-affinity C3b-binding. J Immunol (1999)162:2906–11. doi: 10.4049/jimmunol.162.5.2906
38. Roumenina LT, Jablonski M, Hue C, Blouin J, Dimitrov JD, Dragon-Durey MA, et al. Hyperfunctional C3 convertase leads to complement deposition on endothelial cells and contributes to atypical hemolytic uremic syndrome. Blood (2009) 114(13):2837–45. doi: 10.1182/blood-2009-01-197640
39. Goicoechea De Jorge E, Harris CL, Esparza-Gordillo J, Carreras L, Aller Arranz E, Abarrategui Garrido C, et al. Gain-of-function mutations in complement factor b are associated with atypical hemolytic uremic syndrome. Proc Natl Acad Sci U S A. (2007) 104(1):240–5. doi: 10.1073/pnas.0603420103
40. Zhang Y, Nester CM, Martin B, Skjoedt MO, Meyer NC, Shao D, et al. Defining the complement biomarker profile of C3 glomerulopathy. Clin J Am Soc Nephrol. (2014) 9(11):1876–82. doi: 10.2215/CJN.01820214
41. Dopler A, Guntau L, Harder MJ, Palmer A, Höchsmann B, Schrezenmeier H, et al. Self versus nonself discrimination by the soluble complement regulators factor h and FHL-1. J Immunol (2019) 202(7):2082–94. doi: 10.4049/jimmunol.1801545
42. Schmidt CQ, Hipgrave Ederveen AL, Harder MJ, Wuhrer M, Stehle T, Blaum BS. Biophysical analysis of sialic acid recognition by the complement regulator factor h. Glycobiology (2018) 28(10):765–73. doi: 10.1093/glycob/cwy061
43. Clark SJ, Ridge LA, Herbert AP, Hakobyan S, Mulloy B, Lennon R, et al. Tissue-specific host recognition by complement factor h is mediated by differential activities of its glycosaminoglycan-binding regions. J Immunol (2013) 190(5):2049–57. doi: 10.4049/jimmunol.1201751
44. van Essen MF, Schlagwein N, van den Hoven EMP, van Gijlswijk-Janssen DJ, Lubbers R, van den Bos RM, et al. Initial properdin binding contributes to alternative pathway activation at the surface of viable and necrotic cells. Eur J Immunol (2022) 52(4):597–608. doi: 10.1002/eji.202149259
45. Harboe M, Johnson C, Nymo S, Ekholt K, Schjalm C, Lindstad JK, et al. Properdin binding to complement activating surfaces depends on initial C3b deposition. Proc Natl Acad Sci U S A. (2017) 114(4):E534–9. doi: 10.1073/pnas.1612385114
46. Zaferani A, Vivès RR, van der Pol P, Navis GJ, Daha MR, Van Kooten C, et al. Factor h and properdin recognize different epitopes on renal tubular epithelial heparan sulfate. J Biol Chem (2012) 287(37):31471–81. doi: 10.1074/jbc.M112.380386
47. Zaferani A, Vivès RR, van der Pol P, Hakvoort JJ, Navis GJ, Van Goor H, et al. Identification of tubular heparan sulfate as a docking platform for the alternative complement component properdin in proteinuric renal disease. J Biol Chem (2011) 286(7):5359–67. doi: 10.1074/jbc.M110.167825
48. Pangburn MK, Muller-Eberhardt HJ. The C3 convertase of the alternative pathway of human complement enzymic properties of the bimolecular proteinase the association of factor b with C3b (the major fragment of complement component C3) in the presence of Mg2+ results in the formation of. Biochem J (1986) 235:723–30. doi: 10.1042/bj2350723
49. Marinozzi MC, Vergoz L, Rybkine T, Ngo S, Bettoni S, Pashov A, et al. Complement factor b mutations in atypical hemolytic uremic syndrome-disease-relevant or benign? J Am Soc Nephrol (2014) 25(9):2053–65. doi: 10.1681/ASN.2013070796
50. Torreira E, Tortajada A, Montes T, De Córdoba SR, Llorca O. 3D structure of the C3bB complex provides insights into the activation and regulation of the complement alternative pathway convertase. Proc Natl Acad Sci U S A. (2009) 106(3):882–7. doi: 10.1073/pnas.0810860106
51. Torreira E, Tortajada A, Montes T, Rodríguez de Córdoba S, Llorca O. Coexistence of closed and open conformations of complement factor b in the alternative pathway C3bB(Mg 2+) proconvertase. J Immunol (2009) 183(11):7347–51. doi: 10.4049/jimmunol.0902310
Keywords: C3 glomerulopathies, extracellar matrix, complement regulation, C3 nephritic factor (C3Nef), factor H (FH), factor B (FB), C3 convertase
Citation: Pisarenka S, Meyer NC, Xiao X, Goodfellow R, Nester CM, Zhang Y and Smith RJH (2023) Modeling C3 glomerulopathies: C3 convertase regulation on an extracellular matrix surface. Front. Immunol. 13:1073802. doi: 10.3389/fimmu.2022.1073802
Received: 18 October 2022; Accepted: 28 December 2022;
Published: 18 January 2023.
Edited by:
Mihály Józsi, Eötvös Loránd University, HungaryReviewed by:
Christoph Licht, University of Toronto, CanadaPilar Sánchez-Corral, University Hospital La Paz Research Institute (IdiPAZ), Spain
Copyright © 2023 Pisarenka, Meyer, Xiao, Goodfellow, Nester, Zhang and Smith. This is an open-access article distributed under the terms of the Creative Commons Attribution License (CC BY). The use, distribution or reproduction in other forums is permitted, provided the original author(s) and the copyright owner(s) are credited and that the original publication in this journal is cited, in accordance with accepted academic practice. No use, distribution or reproduction is permitted which does not comply with these terms.
*Correspondence: Richard J. H. Smith, richard-smith@uiowa.edu