 Yulong Ouyang1
 Yuanqing Tu1Shuilin Chen1Huan Min2Zhexu Wen3Guihao Zheng4Ting Wan1Hao Fan1Wenzhao Yang1
 Guicai Sun5*
- 1Nanchang University, Nanchang, Jiangxi, China
- 2Jiangxi Provincial People’s Hospital, Nanchang, Jiangxi, China
- 3The Fourth Affiliated Hospital of Nanchang University, Nanchang, Jiangxi, China
- 4Shangrao People’s Hospital, Shangrao, Jiangxi, China
- 5The First Affiliated Hospital of Nanchang University, Nanchang, Jiangxi, China
Background: Few studies have been reported the potential role of N6-methyladenosine (m6A) modification in osteoarthritis (OA). We investigated the patterns of m6A modification in the immune microenvironment of OA.
Methods: We evaluated the m6A modification patterns based on 22 m6A regulators in 139 OA samples and systematically associated these modification patterns with immune cell infiltration characteristics. The function of m6A phenotype-related differentially expressed genes (DEGs) was investigated using gene enrichment analysis. An m6A score model was constructed using principal component analysis (PCA), and an OA prediction model was established based on the key m6A regulators. We used real-time PCR analysis to detect the changes of gene expression in the cell model of OA.
Results: Healthy and OA samples showed significant differences in the expression of m6A regulators. Nine key m6A regulators, two m6A modification patterns, m6A-related genes and two gene clusters were identified. Some m6A regulators had a strong correlation with each other. Gene clusters and m6A clusters have high similarity, and cluster A corresponds to a high m6A score. Immunocytes infiltration differed significantly between the two clusters, with the m6A cluster B and gene cluster B having more types of infiltrating immunocytes than cluster A. The predictive model can also predict the progression of OA through m6A regulators expression. The results of real-time PCR analysis showed that the gene expression in the cell model of OA is similar to that of the m6A cluster B.
Conclusions: Our study reveals for the first time the potential regulatory mechanism of m6A modification in the immune microenvironment of OA. This study also sheds new light on the pathogenesis of OA.
Introduction
Osteoarthritis (OA) is the most common joint disease worldwide, impacting 240 million individuals (1, 2). OA is a chronic joint disease, that is mainly characterized by pain, stiffness, joint deformity and limited joint activity (3). With the trend of the aging population and the obesity epidemic, this widespread disease and the resulting disability have a great impact on individuals and society (4). The progression of OA is driven by a series of factors, such as gene regulation, biochemical cascades, inflammation and cellular immunity (5, 6). However, the etiology and disease progression mechanisms of OA are still unclear, which limits the development of effective treatment (7).
Many studies have revealed the significance of epigenetics in disease progression (8, 9). Epigenetic modifications such as DNA methylation, RNA modification, histone modification and noncoding RNA modification have also been widely reported (10). Over 100 different types of RNA modifications have been discovered, including N1-methyladenosine (m1A), N6-methyladenosine (m6A), 5-methylcytosine (m5C), and N7-methylguanosine (m7G) (11). m6A RNA methylation occurs on approximately 20%-40% of all transcripts encoded by mammalian cells, and it is the most common type of dynamic and reversible mRNA modification (12, 13). Abnormal m6A methylation levels are strongly linked to the progression of cancer, musculoskeletal disorders and other diseases (10, 14). The level of m6A methylation is primarily determined by the role of the m6A regulator (15). Methyltransferases, demethylases, and binding proteins all play a role in m6A modification (16). The m6A methyltransferases (writers) include WTAP, METTL3, CBLL1, and RBM15B, while demethylases (erasers) consist of ALKBH5 and FTO. YTHDC1, YTHDF1, IGF2BP1, and other binding proteins (readers) can bind to m6A and mediate its regulatory function (12, 17). Previous studies have mostly concentrated on the role of m6A methylation regulators in tumor development and treatment (18–20). However, the number of studies of m6A regulators in nonneoplastic diseases is also increasing (21–23). There are only a few studies on the mechanism of m6A regulators and OA at present. Most of these studies clarify the mechanism of FTO and METTL3 in OA, but they are controversial. The mechanism of m6A regulators in OA is still unclear.
Recent research has revealed that m6A regulation can mediate some potential immune regulation mechanisms and has a significant impact on adaptive immunity (24, 25). More and more studies have focused on the effects of the immune microenvironment on diseases (26, 27). All types of immune cells are involved in cartilage injury and repair (28). However, the interaction of m6A methylation regulators with immune cells in OA is poorly understood (Figure 1).
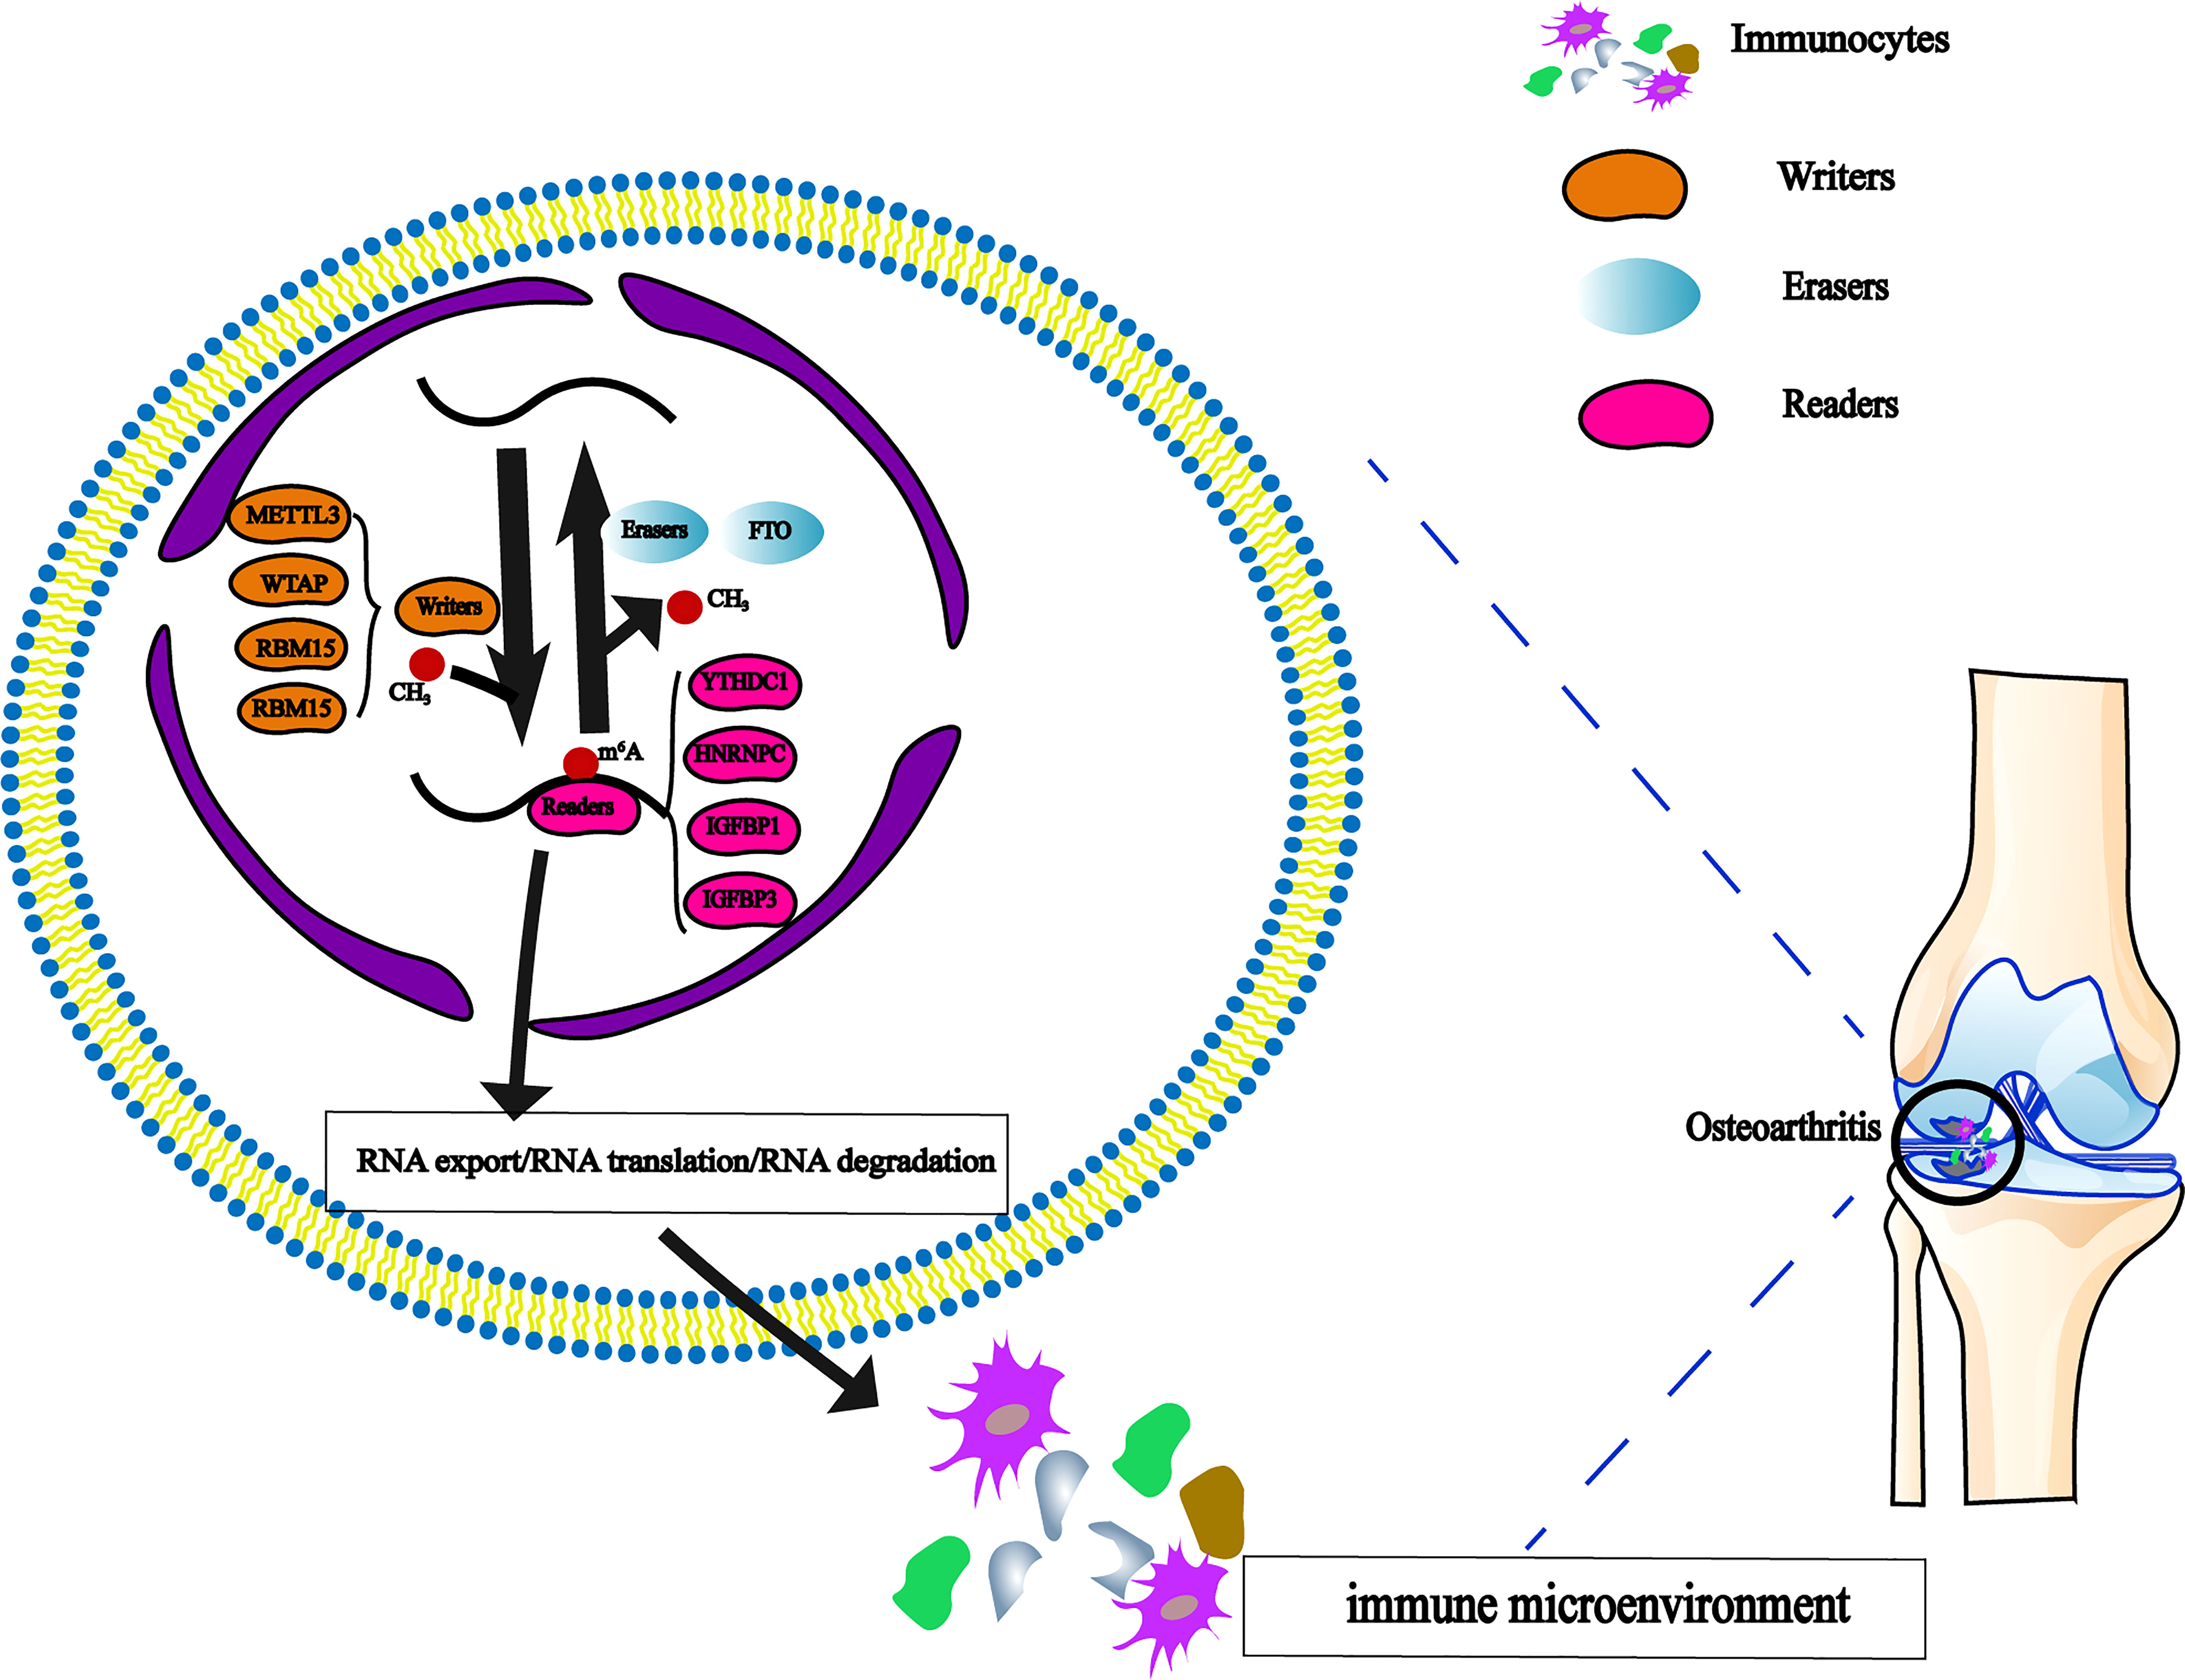
Figure 1 The dynamic regulation of m6A RNA methylation modification, which regulated by ‘writers’, ‘erasers’ and ‘readers’ in OA and their potential biological functions for RNA.
This study aimed to systematically evaluate the mechanism of m6A regulators in OA. We analyzed the gene expression profile of OA by bioinformatics analysis. Subsequently, to further investigate the implication of m6A regulators on the immune microenvironment, we investigated the correlations among clustering subgroups, risk mode, and immune cell infiltration. These findings can provide a theoretical basis for the progress and treatment of OA.
Materials and methods
Datasets preprocess
The GSE48556 datasets were obtained from the Gene Expression Omnibus(GEO) database. Total mRNA was extracted from peripheral blood mononuclear cells and detected using the Illumina HumanHT-12 V3.0 expression beadchip (29). To preprocess the expression value, the “Normalize Between Arrays” function from the “limma” package was utilized.
Analysis of m6A regulators between OA patients and healthy controls
We collated 22 recognized m6A methylation regulators from published literature (11, 12, 15, 30, 31). The following genes were screened: m6A readers (YTHDC1/2, YTHDF1/2/3, HNRNPC, FMR1, LRPPRC, IGFBP1/2/3, RBMX, ELAVL1, IGF2BP1), m6A writers (METTL3, WTAP, RBM15/15B, CBLL1, KIAA1429), and m6A erasers (FTO, ALKBH5). The Wilcoxon test was used to compare the expression of 22 m6A regulators in OA patients and healthy controls, and the differentially expressed m6A regulators were screened with P value < 0.05. The R package “Random Forest” and gene importance plots were used to show the score of differentially expressed m6A regulators. A nomogram was used to predict the possibility of OA in patients based on screened m6A regulators.
Correlation of m6A RNA methylation regulators in OA patients
The correlation between m6A regulators in OA patients was investigated by the R package “corrplot” and Spearman’s correlation analysis. The R packages “ggMarginal” and “ggplot” are used to draw the correlation plot of significantly differentially expressed m6A regulators.
m6A modification pattern identification
Unsupervised clustering analysis was used to detect diverse m6A clusters based on the 22 distinct m6A regulators’ expression. The number and feasibility of modification patterns were identified by the consensus clustering algorithm. To categorize OA patients into distinct subtypes, we utilized the “ConsensusClusterPlus” software (1,000 iterations and an 80% resampling rate). The m6A-expression pattern was assessed by principal component analysis (PCA). The m6A regulators’ differential expression in different m6A clusters is shown in the box plot and heatmap. We analyzed the difference in the levels of cytokines among m6A clusters.
Immune cell infiltration analysis
We use the ssGSEA algorithm to calculate the enrichment score of immunocytes infiltration in each sample. The gene set of infiltrating immune cells was obtained from previous studies, which included activated B cells (ABCs), type 1/2/17 T helper (Th1/2/17) cells, dendritic cells (DCs), natural killer (NK) cells and other 23 human immune cell subtypes (32). The combined ssGSEA score was used to compare the levels of immunocytes infiltration in distinct m6A clusters. The determining criterion of a significant difference was P < 0.05. The correlation between major m6A regulators and immunocytes infiltration was determined by Spearman correlation analysis. According to the expression of m 6A regulators, which are strongly related to immune cell infiltration, OA patients were divided into two groups. Then, the difference in immunocytes infiltration levels in different subgroups was calculated (P value<0.05).
Biological enrichment analysis for distinct m6A modification patterns
We identified the DEGs among distinct m6A subgroups and the overlapping genes were extracted (|log FC|>1, adjusted P value<0.05). GO functional analysis and KEGG pathway enrichment analysis were performed to analyze the DEGs via R packages (enrichplot, circlize, RColorBrewer, dplyr, ComplexHeatmap, and so on). A P value of 0.05 was used as the cutoff.
Identification and analysis of gene clusters
We used the extracted overlapping genes and the clustering algorithm to determine cluster numbers and stability. We determined the OA gene cluster based on the extracted overlapping genes and unsupervised clustering analysis. We used a box plot diagram to show the m6A regulators as differentially expressed in different gene clusters. The degree of immunocytes infiltration and expression of interleukin-associated factors were compared between gene clusters. The method was consistent with the immune infiltration analysis of m6A clusters.
Construction of m6A gene signature
The m6A clusters and gene clusters were identified by previous methods. Then, we constructed the m6A gene signature by PCA. As feature scores, principal components 1 and 2 were retrieved. The score was based only on the most significantly correlated genes, while untracked genes’ contributions to other set members were weighed. The calculation method for determining the m6A gene signature score was based on previous studies (m6Ascore =∑ (PC1i + PC2i), i = the expression of m6A phenotypic related genes) (33, 34). The difference in the m6A score in m6A clusters and gene clusters was analyzed.
Cell and cell culture
The human chondrosarcoma cell line SW135 (Pricella, China) was maintained in Dulbecco’s modified Eagle’s medium(DMEM)-high glucose (Gibco, United States) containing 10% Fetal Bovine Serum (FBS, Gibco, United States) and 1%penicillin/streptomycin. The chondrogenic ATDC5 cell line (Riken Cell Bank, Japan) was cultured in DMEM/F12 (Keygen, China) containing 10% FBS and 1%penicillin/streptomycin. Before the following experiments, all the cells were maintained under standard adherent conditions at 37°C under 5% CO2 and humidified atmosphere.
Real-time PCR analysis
SW1353 cells and ATDC5 cells were treated with 10 ng/ml recombinant human IL-1β (Proteintech, Rosemont, IL) for 48 h (35). Total RNA was extracted from cells using RNAiso plus reagent (Takara, Japan) according to the manufacturer’s instructions. RNA (1 µg) was reverse-transcribed to complementary DNA using cDNA Synthesis Super Mix (Trans Gen Biotech, China) according to the protocol of the manufacturer. The primers used for amplification are listed in the table below (Table 1). Green qPCR Super Mix (Trans Gen Biotech, China) was used for real-time PCR using the CFX Connect Real-Time PCR Detection System (Biorad, United States). The thermal cycling conditions were 95°C for 30 s and 42 cycles at 95°C for 5 s and 60°C for 30 s.
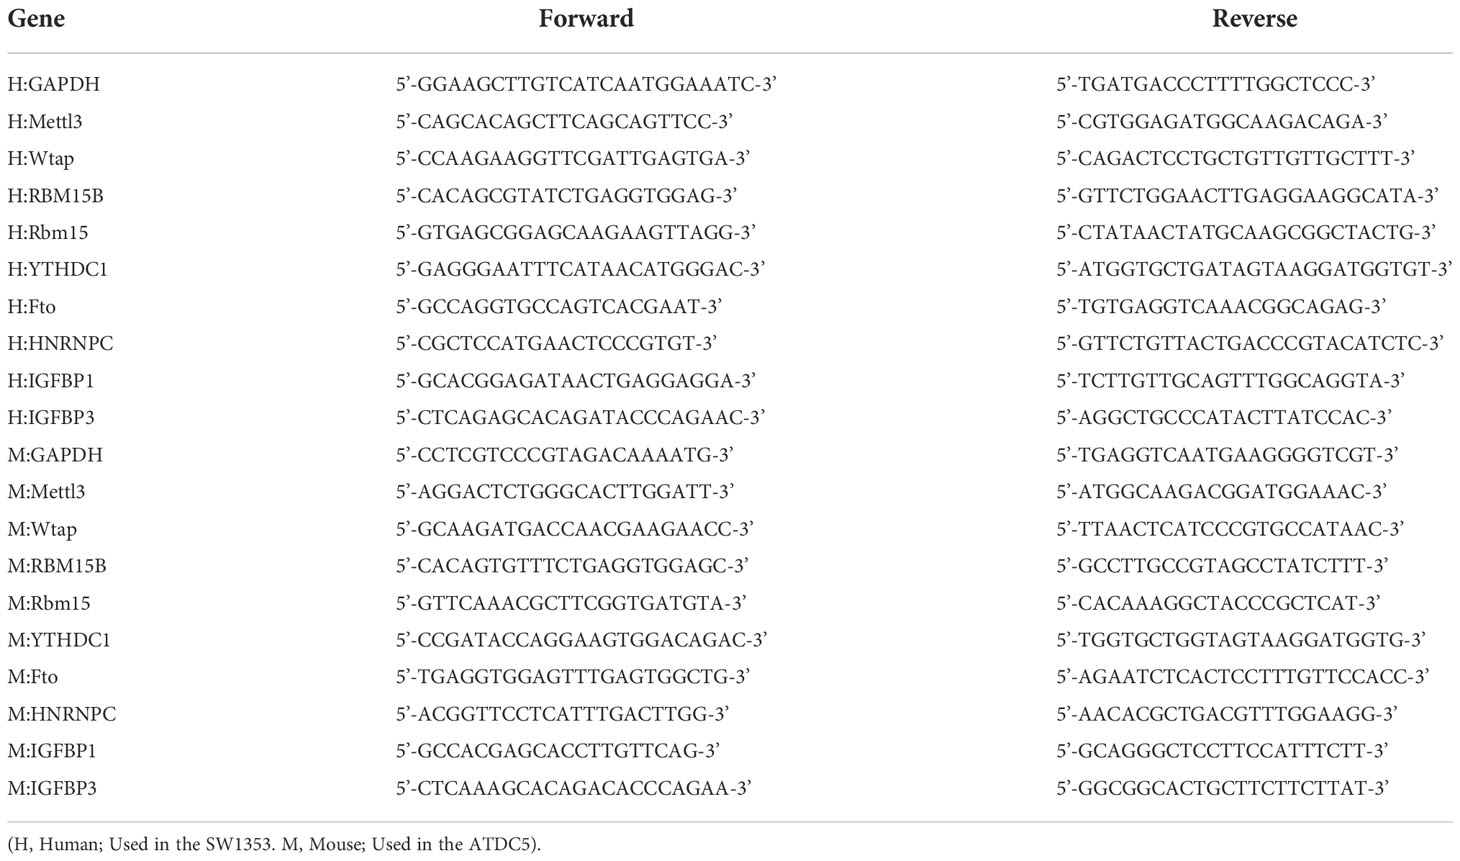
Table 1 The sequences of primer pairs used in the study.
Statistical analysis
R 4.1.3 (https://www.rproject.org/), Perl 5.32.1 (https://www.perl.org) and R Bioconductor packages were used to analyze the data. Statistical analyses of real-time PCR were performed using GraphPad Prism software (version 9.0). Statistical significance was assessed using the student t-test. All experiments were performed independently at least three times. All the statistical P values were bilateral, with P value less than 0.05 considered statistically significant.
Results
Expression of m6A regulators in OA
The profile expression data consisted of 139 samples, including 106 genetics osteoarthritis and progression (GARP) samples and 33 normal samples. The positions of 22 selected m6A regulators on the chromosomes are marked in Figure 2A. The expression levels of 22 m6A regulators in healthy patients and OA patients are shown in Figure 2B. There were significant differences in 9 m6A regulators (METTL3, WTAP, RBM15/15B, YTHDC1, HNRNPC, IGFBP1/3, and FTO) between normal and OA samples. In OA, four m6A regulators (YTHDC1, HNRNPC, METTL3, and WTAP) were downregulated and five m6A regulators (RBM15, RBM15B, IGFBP1, IGFBP3, and FTO) were upregulated (Figure 2C). IGFBP3 expression was dramatically higher in the peripheral blood of OA patients (P<0.001). METTL3 and HNRNPC levels in OA patients were considerably lower than those in healthy controls (P<0.01). Thus, these m6A regulators are critical in OA.
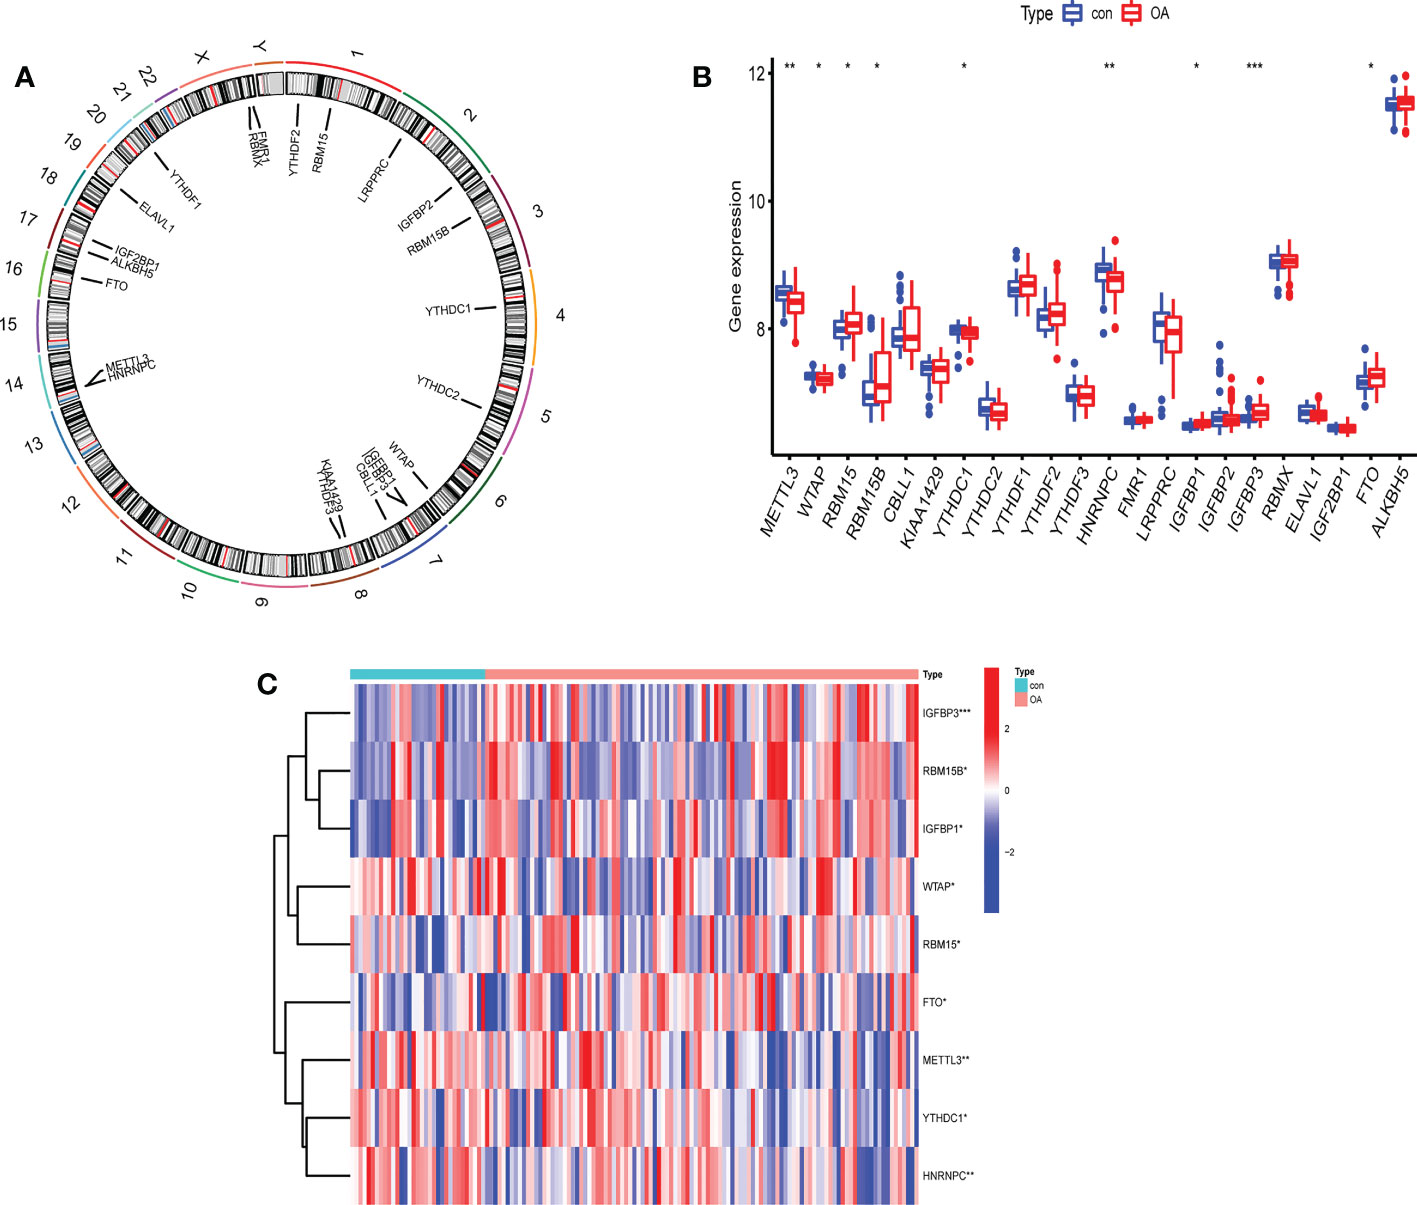
Figure 2 The expression levels of screened m6A regulators in healthy controls and OA patients. (A) The location of 22 RNA methylation m6A regulators on human chromosomes. (B) The expression levels of 22 m6A RNA methylation regulators between healthy controls and OA patients (*P < 0.05, **P < 0.01, ***P < 0.001). (C) Heatmap of expression levels of 9 key m6A RNA methylation regulators in healthy controls and OA patients (*P < 0.05, **P < 0.01, ***P < 0.001).
We further analyzed the correlations among the 22 m6A regulators in the OA group (Figure 3A). Some m6A regulators had a strong correlation with each other (Figures 3B–F: writers and readers, Figure 3G: erasers and writers, Figures 3H, I: erasers and readers).
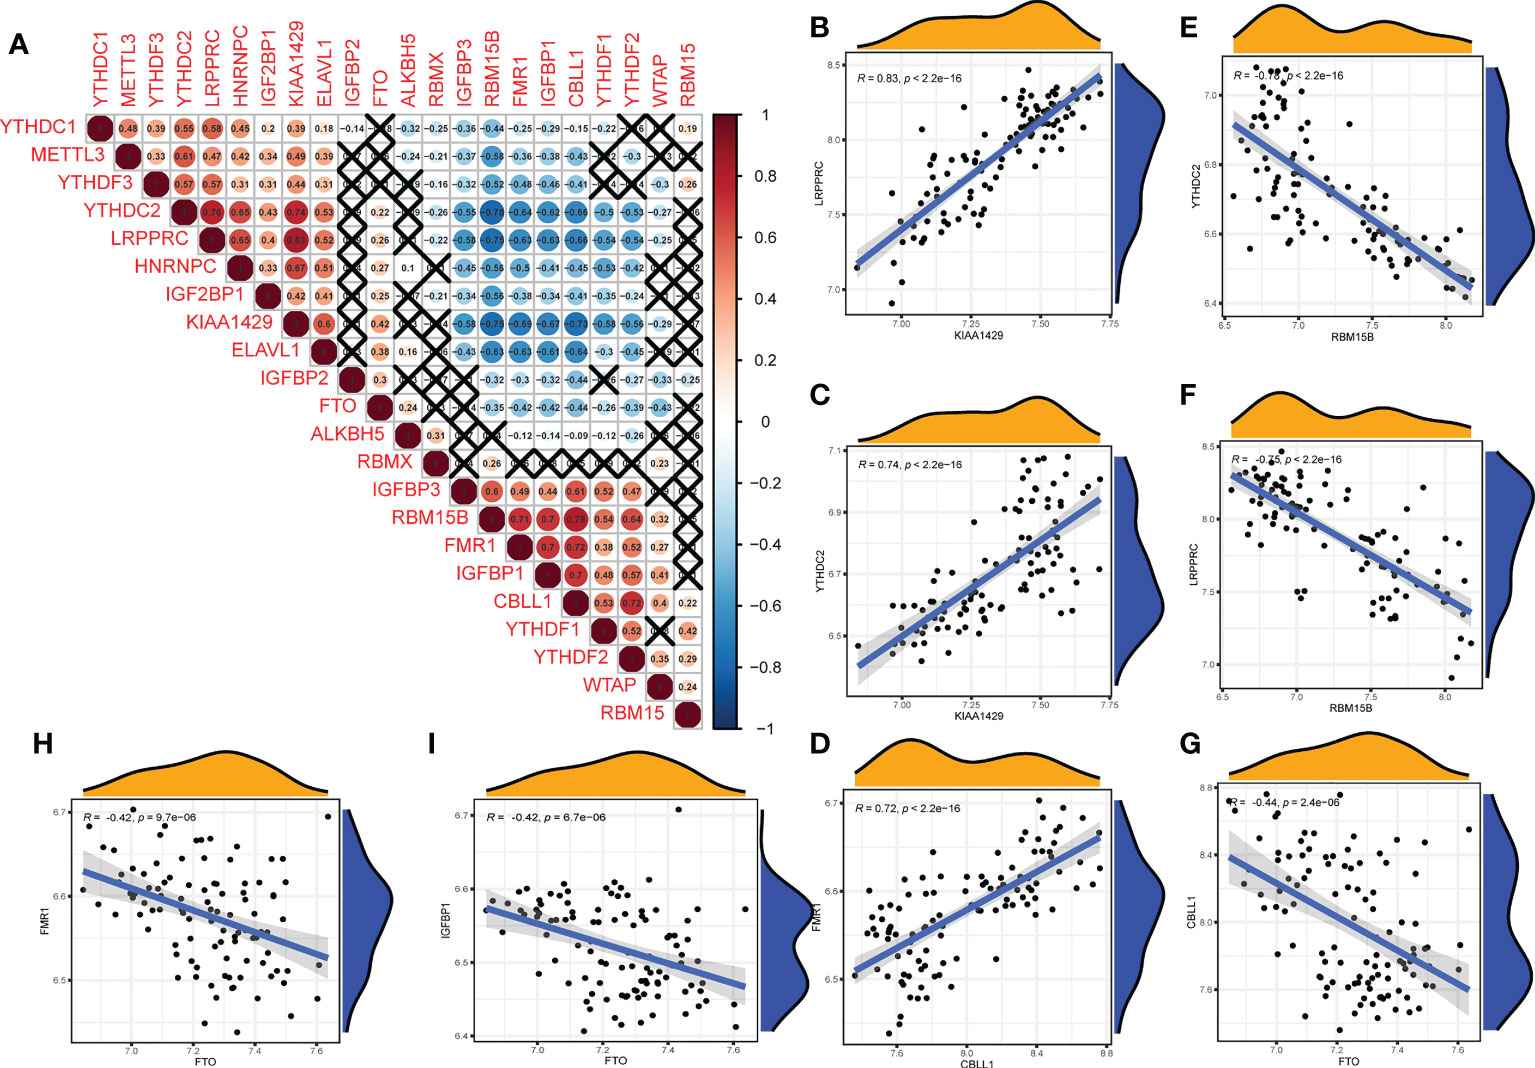
Figure 3 Correlation of m6A regulators in OA patients. (A) The relationship between m6A RNA methylation regulators in OA (A fork indicates P>0.05). (B–F) The correlation among writers and readers with a strong correlation coefficient in OA. (G) The correlation among erasers and writers in OA. (H, I) The correlation among erasers and readers in OA (B–I) Comparison between regulators with strong correlation coefficient).
m6A methylation modification patterns mediated by regulators
According to m6A regulator expression, the clustering stability was analyzed with cluster numbers from 2 to 9 (Figure 4A and Figure 1S). The optimal k value was determined, and k = 2 was eventually selected as the optimal cutoff (Figure 4B). PCA revealed that OA patients could be classified into two m6A clusters that did not intersect. Thus, two is an appropriate cluster number (Figure 4C). There were 45 OA patients in cluster A and 61 in cluster B. IGFBP1, IGFBP3, RBM15B, RBM15 and WTAP were highly expressed in cluster A. FTO, HNRNPC, METTL3 and YTHDC1 were expressed at lower levels in cluster A than in cluster B (Figures 4D, E).
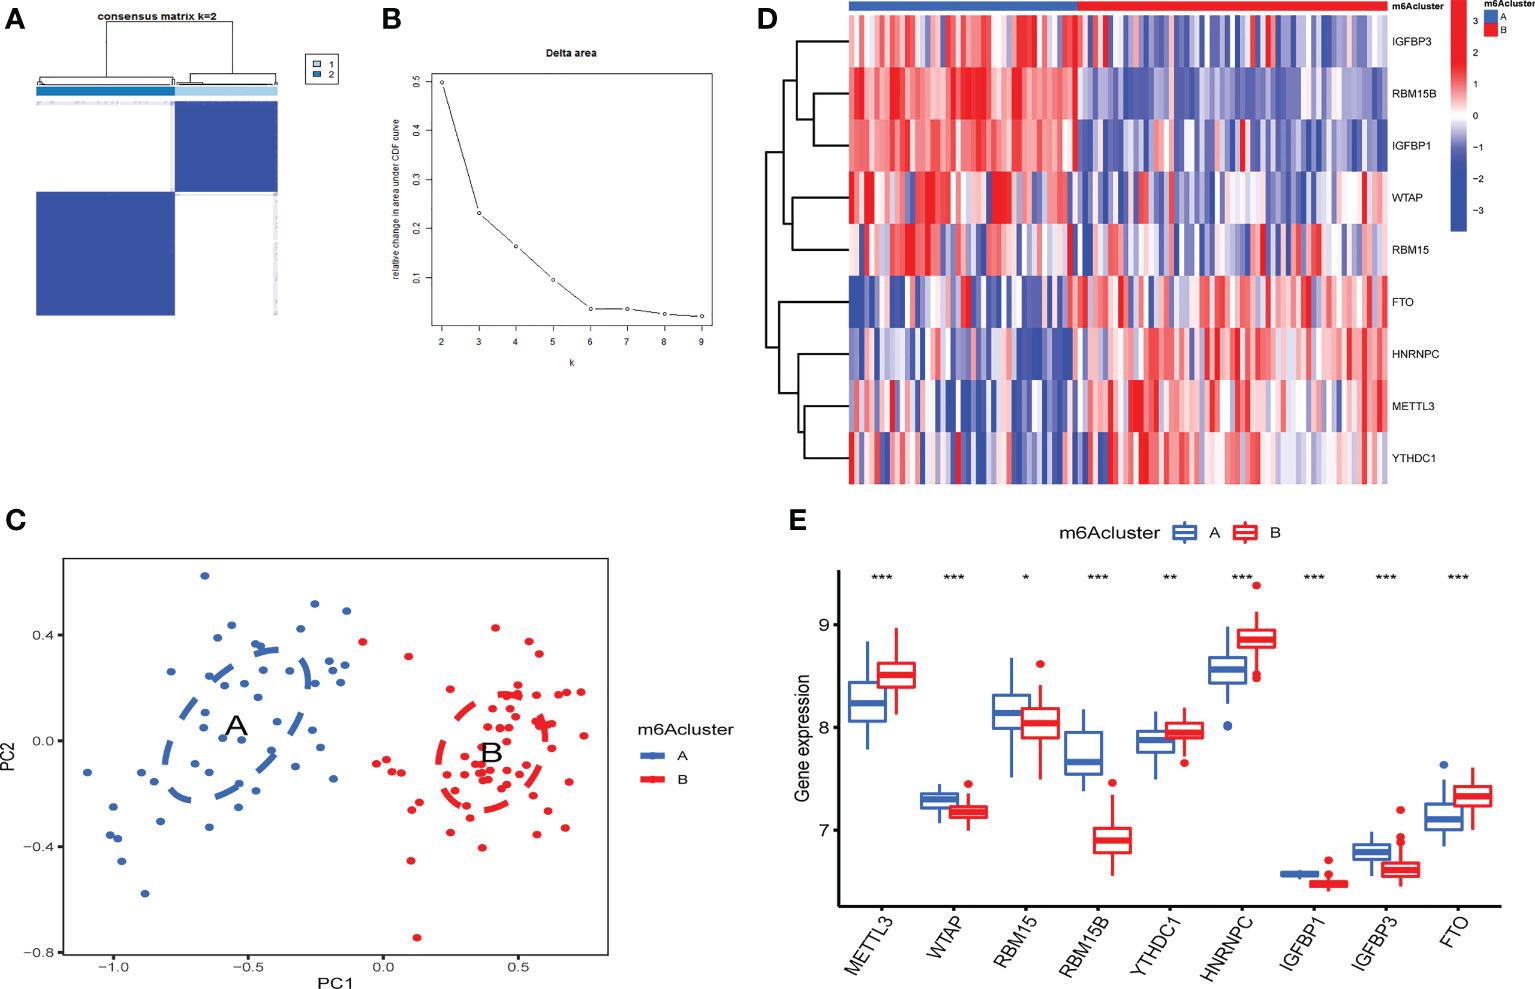
Figure 4 Identification of 2 distinct m6A modification patterns in OA. (A) Consensus clustering matrix (CCM) with K=2. (B) Change in the area under the cumulative distribution function (CDF) curve for k from 2 to 9. (C) PCA showed that two m6A clusters did not intersect (2 modification patterns in OA are an appropriate choice). (D) Heatmap of the expression of 9 key m6A RNA methylation regulators in 2 m6A clusters. (E) Box plot of the expression of 9 key m6A regulators in the 2 m6A modification patterns (*P < 0.05, **P < 0.01, ***P < 0.001).
Immune microenvironment features related to two m6A modification patterns
The expression of immune cells was examined to demonstrate the changes in immune microenvironment features in distinct m6A modification patterns. Between the two m6A clusters, there were substantial variations in virtually all immune cells observed (Figure 5A). Compared with m6A cluster A, the cluster B had a higher level of ABCs, activated CD8+ T cells, activated DCs, eosinophils, immature B cells, immature DCs, macrophages, plasmacytoid DCs, regulatory T cells, Th1 cells and Th2 cells. Activated CD4+ T cells, MDSCs, mast cells, monocytes, NK T cells, NK cells, neutrophils, T follicular helper cells and Th17 cells were enriched in cluster A. More immune cells are enriched into the cluster B.The correlation between the screened m6A regulators and immunocytes was investigated. The infiltration of immunocytes was substantially linked with the levels of IGFBP1 and RBM15B (Figure 5B). OA patients were separated into two groups based on the difference in the expression of IGFBP1 or RBM15B. Although 9 types of immunocytes were enriched in the 2 IGFBP subgroup, the high IGFBP expression group may have a higher level of immunocytes infiltration (Figure 5C). In addition, the high RBM15B expression group had fewer kinds of immune cells (Figure 5D).
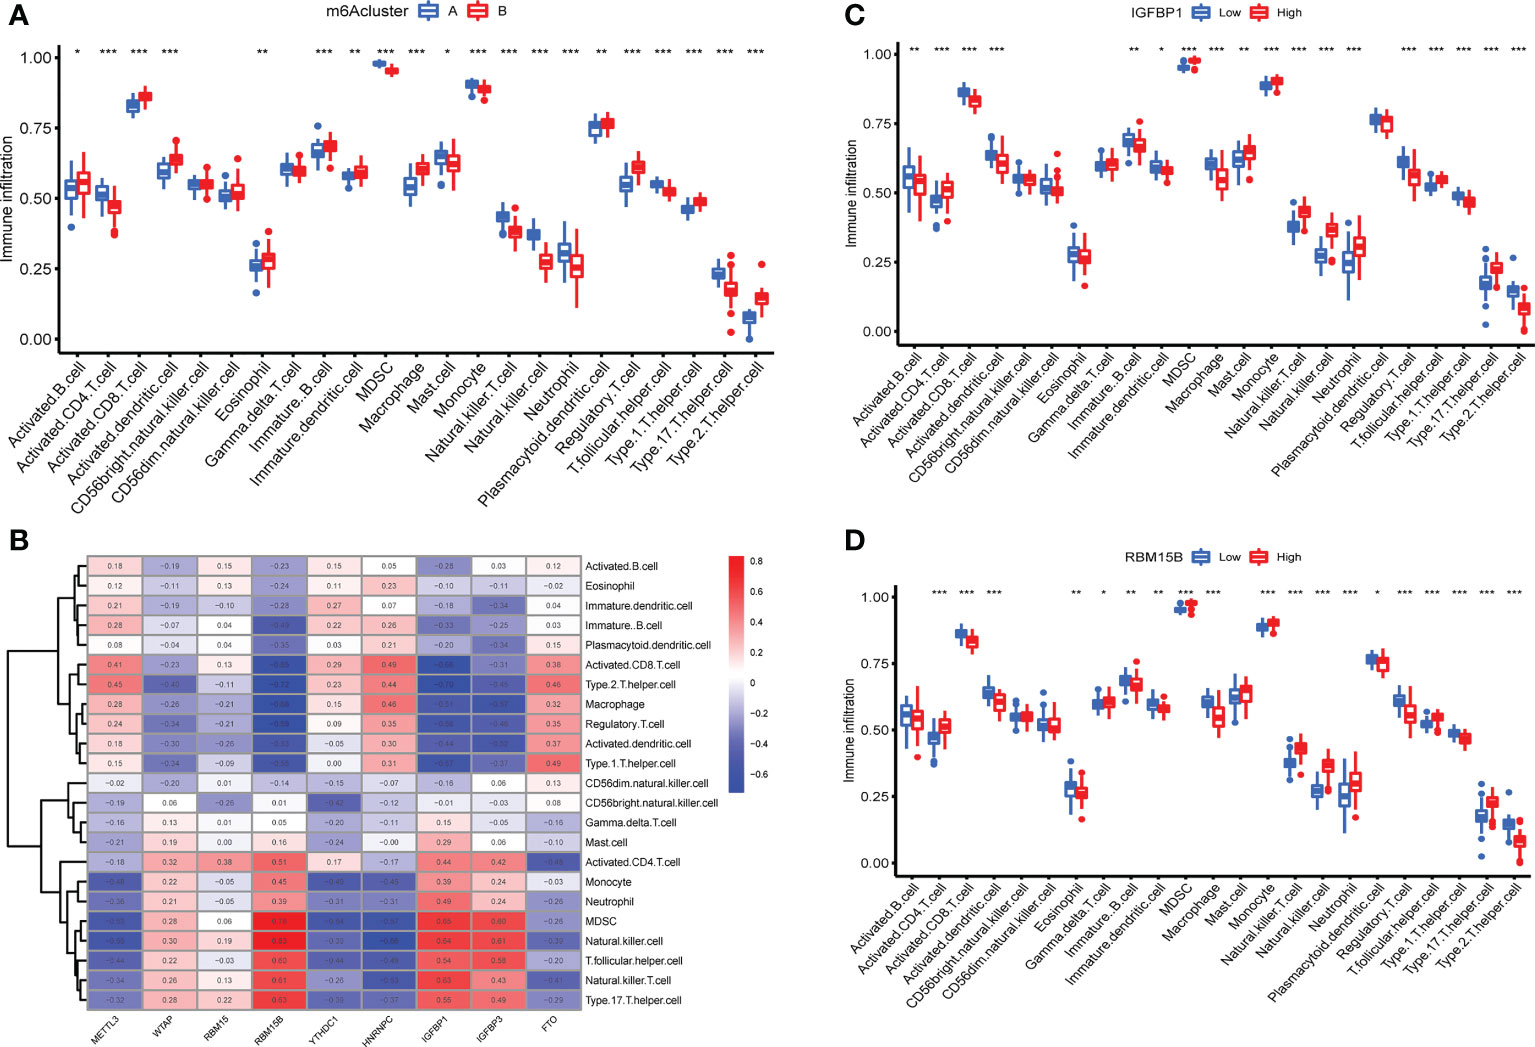
Figure 5 Immune microenvironment features in two m6A modification patterns. (A) Levels of infiltrating immunocytes in two m6A clusters in OA (*P < 0.05, **P < 0.01, ***P < 0.001). (B) Correlation between 9 key m6A regulators and immune cells. (C) The effect of high and low expression of IGFBP1 on immune infiltration (*P < 0.05, **P < 0.01, ***P < 0.001). (D) The effect of high and low RBM15B expression on immune infiltration ns, P>0.05, No statistical difference; (*P < 0.05, **P < 0.01, ***P < 0.001).
Biological characteristics of m6A modification patterns
Between m6A clusters A and B, 303 genes (m6A phenotype-related genes) were differentially expressed. GO enrichment analysis was used for analysis of enriched biological processes, molecular functions, cellular components. These genes are mostly associated with ameboidal-type cell migration (biological process), basal plasma membrane (cell component), and lyase activity (molecular function) (Figures 6A, B). To investigate the relevant activities and pathways of m6A phenotype-related DEGs, we employed KEGG pathway enrichment analysis (Figure 6C).
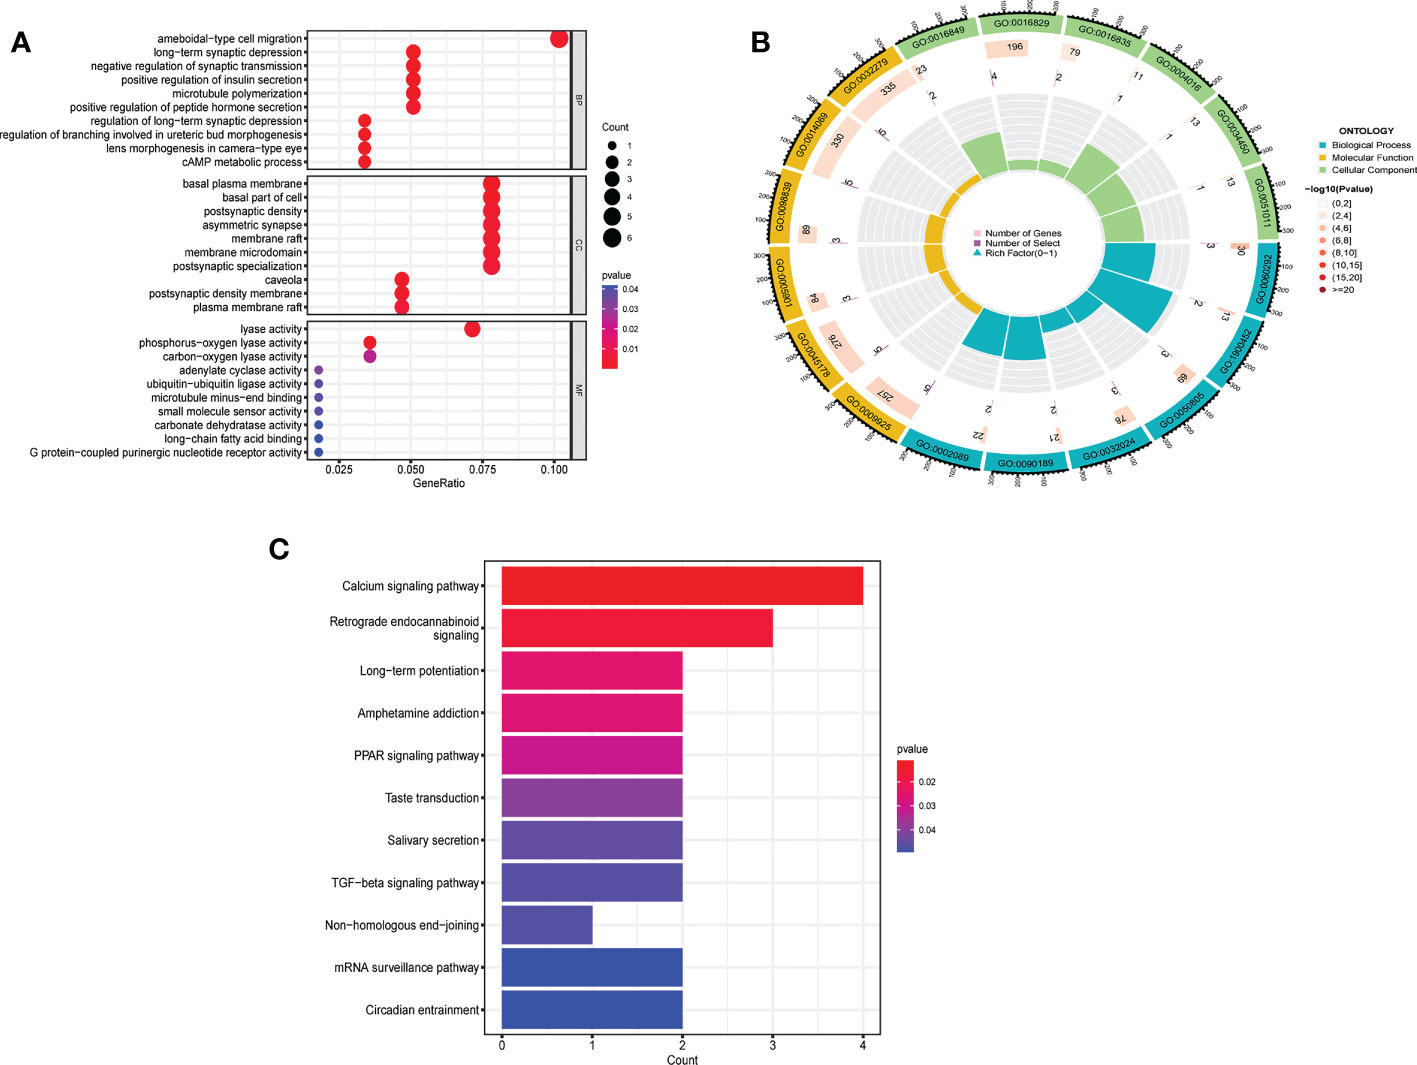
Figure 6 Biological characteristics related to m6A modification patterns. (A) GO analysis of m6A phenotype-related DEGs from three perspectives: biological process, cellular composition and molecular function. (B) The circle diagram of gene enrichment numbers for each GO item. (C) KEGG pathway enrichment analysis of m6A phenotype-related DEGs.
m6A phenotype-related DEGs in OA
The 303 m6A phenotype-associated DEGs were analyzed by unsupervised clustering analysis. It was most appropriate to divide the sample into two gene clusters (Figure 2S). There were considerable discrepancies between the two gene clusters, and only one m6A methylation-related gene was highly expressed in cluster B (Figure 7A). The evident difference in m6A phenotype-related gene expression between the two gene clusters was significant in controlling the establishment of immune cell infiltration (Figure 7B). The m6A regulators also had significantly different expression in different gene clusters (Figure 7C). However, these assays were unable to predict the m6A methylation pattern in particular individuals. We developed an m6A scoring system to quantify the pattern of m6A modifications in each OA patient. m6A cluster A had a considerably higher m6A score than m6A cluster B. Furthermore, the m6A score was considerably higher in gene cluster A. The m6A score in gene cluster A was significantly higher than that in gene cluster B (Figure 7D). An alluvial plot was used to display the characteristic variations in each patient with OA. The results of m6A regulators typing were similar to those of genotyping (Figure 7E). We also analyzed the differential expression of immune regulatory genes and immune checkpoints in m6A clusters and gene clusters. There are significant differences in the expression of immune regulatory genes and immune checkpoints between A and B (Figures 7F, G).
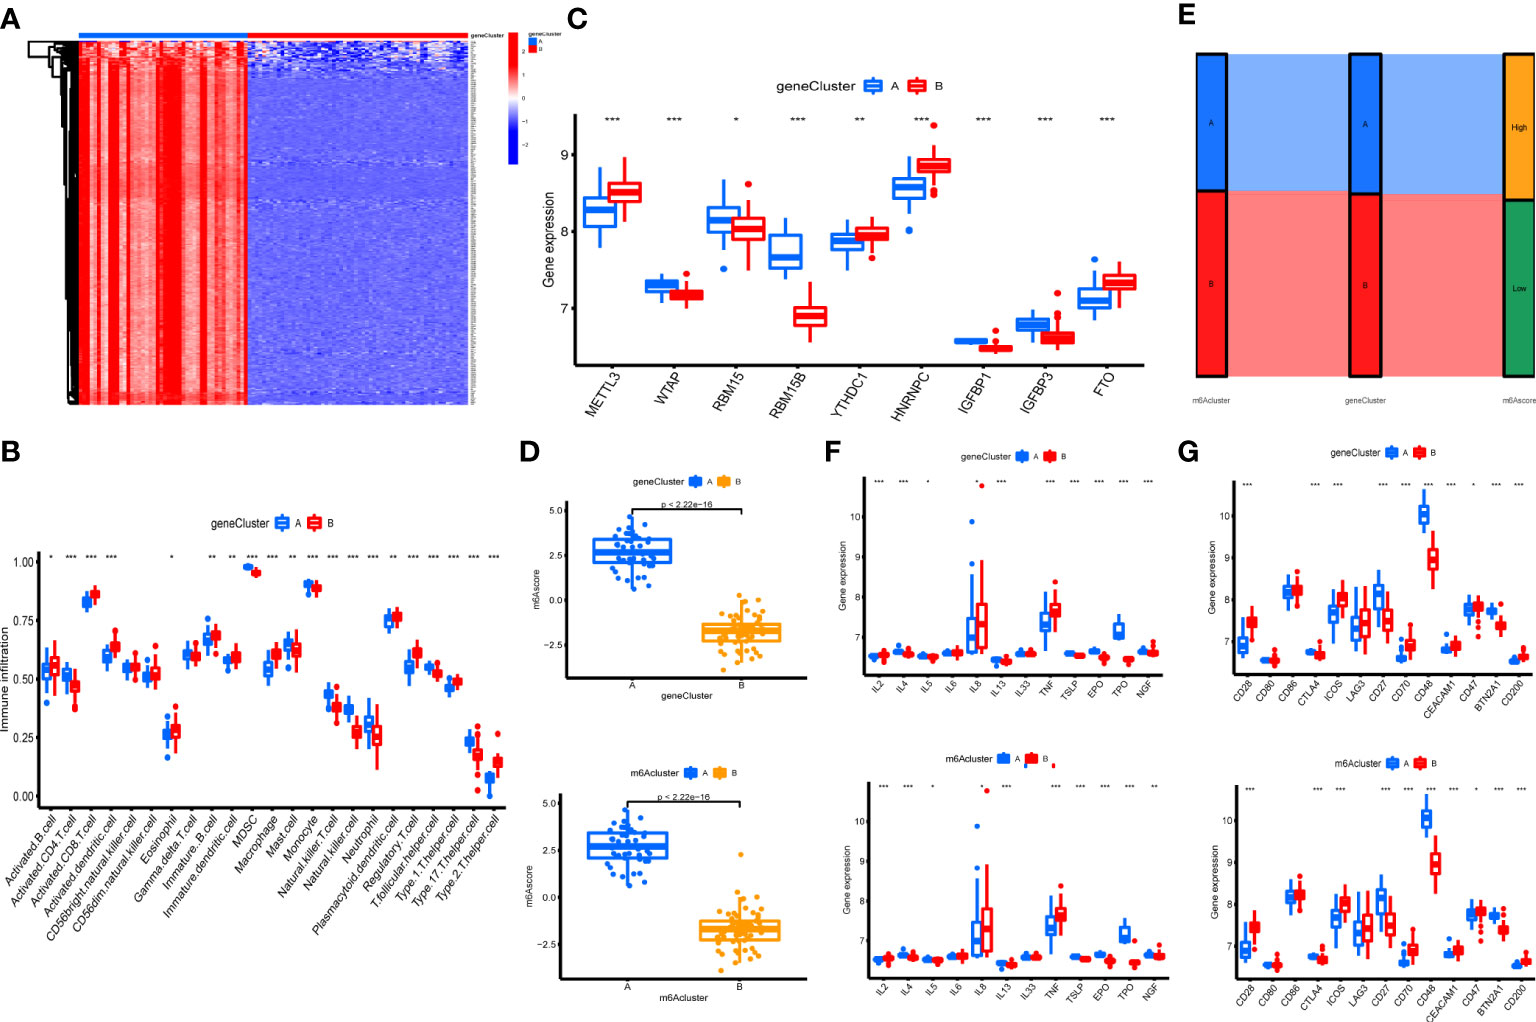
Figure 7 Construction of m6A signatures. (A) Heatmap of m6A phenotype-related in different gene clusters. (B) The immunocytes infiltrating levels in distinct gene clusters (*P < 0.05, **P < 0.01, ***P < 0.001). (C) The expression levels of 9 key m6A regulators in different gene clusters (*P < 0.05, **P < 0.01, ***P < 0.001). (D) The m6A score in different gene clusters and m6A clusters. (E) Alluvial diagram showing the changes in m6A clusters, gene clusters, and m6A score. (F) Differences in the expression of immune regulatory genes in different gene clusters and m6A clusters (*P < 0.05, **P < 0.01, ***P < 0.001). (G) Differences in the expression of immune checkpoints in different gene clusters and m6A clusters (*P < 0.05, **P < 0.01, ***P < 0.001).
Predictive model in OA
We compared the advantages of the random forest model (RFM) and support vector machine model (SVMM). The RFM was better than the SVMM (Figures 8A–C). The optimal cutoff point was selected for analysis according to the random forest tree model. The importance score of m6A regulators was obtained (Figures 8D, E). An OA prediction model was established and evaluated. The calibration curve, clinical influence curve and decision curve all showed that the model was accurate (Figures 8F–H). The predictive model can predict the incidence of OA disease by score (Figure 8I).
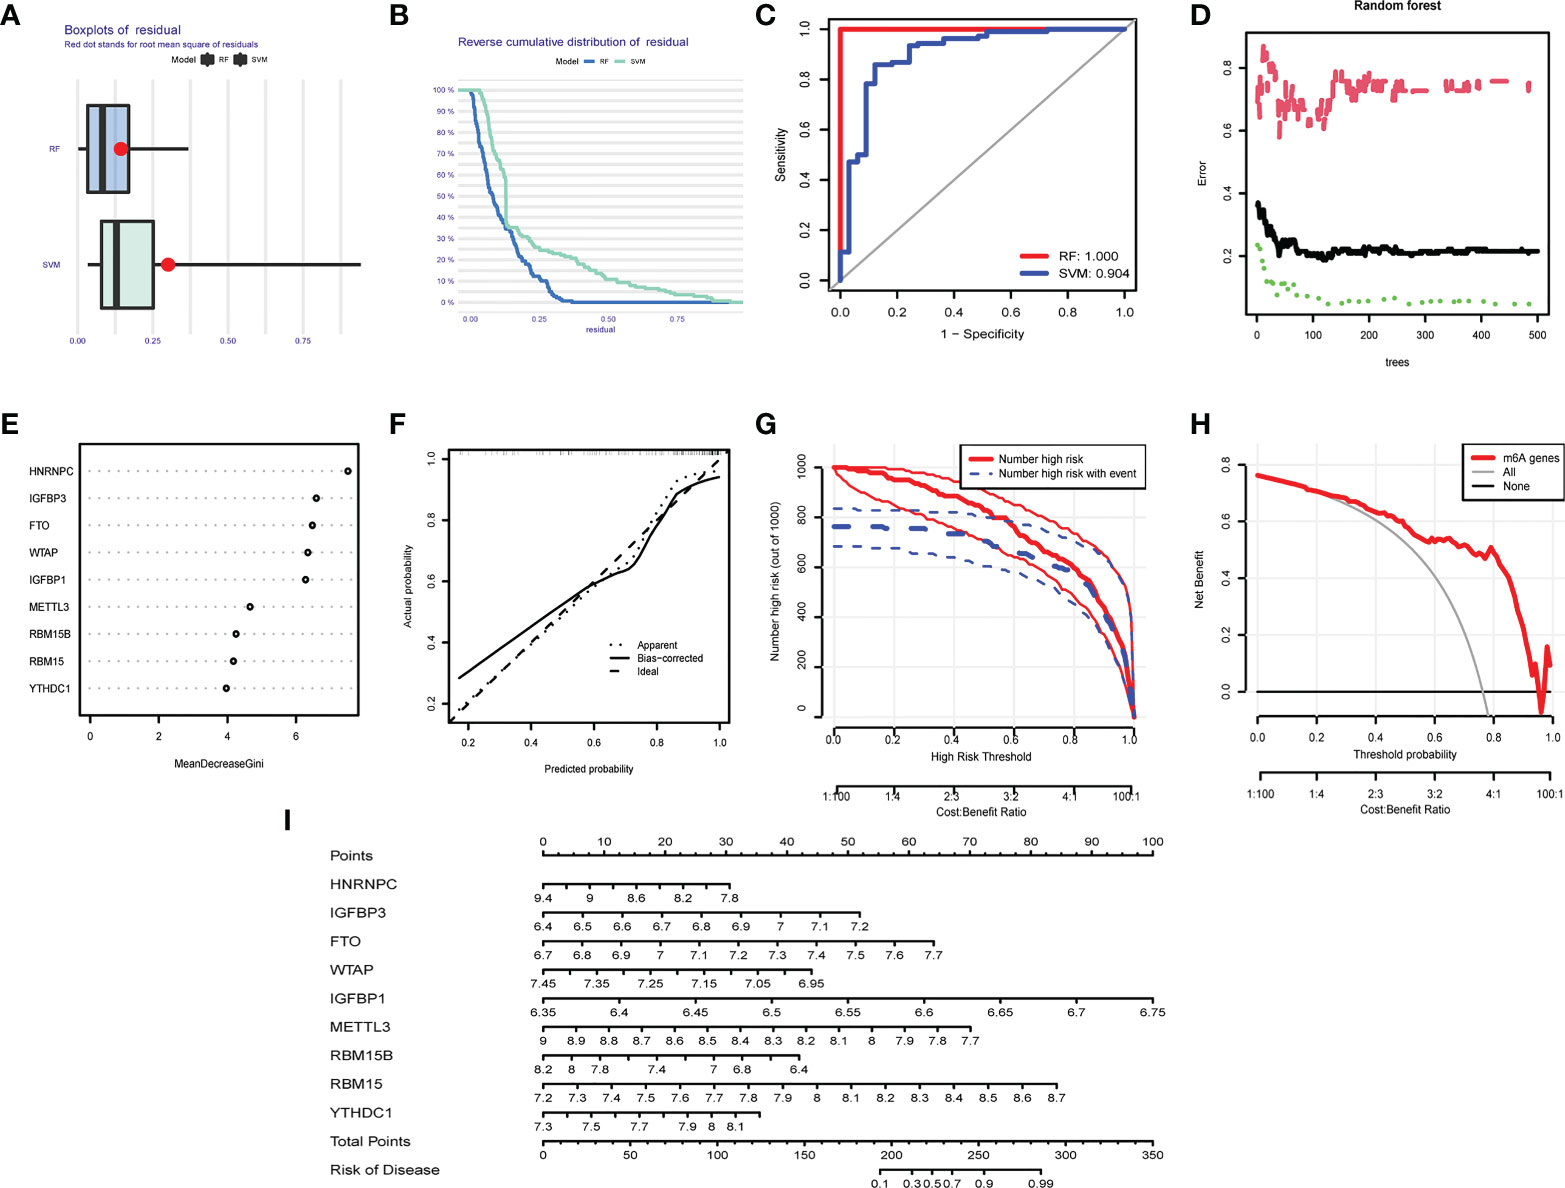
Figure 8 Predictive model in OA. (A) Boxplot of RFM and SVMM residuals (the smaller the number, the better the model). (B) Reverse cumulative distribution map of RFM and SVMM residuals (The smaller the number is, the better the model is). (C) Evaluation of the accuracy of RFM and SVMM by receiver operating characteristic (ROC) diagram (the larger the area is, the higher the accuracy is). (D) The number of optimal trees in the verification error analysis of the random forest tree map (selecting the tree value with the lowest error). (E) The importance score of m6A regulators. (F) The correction curve of the prediction model (the closer to the ideal dotted line, the more reliable the result). (G) Clinical impact curve to judge the accuracy of the prediction model (red line for the model to predicted high-risk patients, blue dotted line for actual high-risk patients). (H) The accuracy of the decision curve detection model (the farther the end point of the red line is from the gray line, the higher the accuracy is). (I) OA prediction model based on m6A regulators.
Expression of m6A regulator in two chondrocyte lines after the treatment of IL-1β
After we found that m6A regulators play an important role in OA, we established an in vitro cell model of OA by treating SW1353 cells and ATDC5 cells with IL-1β. The differences in m6A regulator gene expression before and after cell treatment were assessed. After treatment of IL-1β, three m6A regulators (IGFBP3, RBM15, and WTAP) were down-regulated and two m6A regulators (METTL3 and YTHDC1) were up-regulated in ATDC5. In SW1353 cells after treatment with IL-1β, the expression of FTO, HNRNPC, and IGFBP1 was down-regulated, and the expression of WTAP was up-regulated (Figures 9A, B). It appeared that the gene expression in the OA model established with cell lines is similar to that of the m6A cluster B. These may be related to the accumulation of macrophages in the m6A cluster B, and IL-1 is mainly secreted by macrophages.
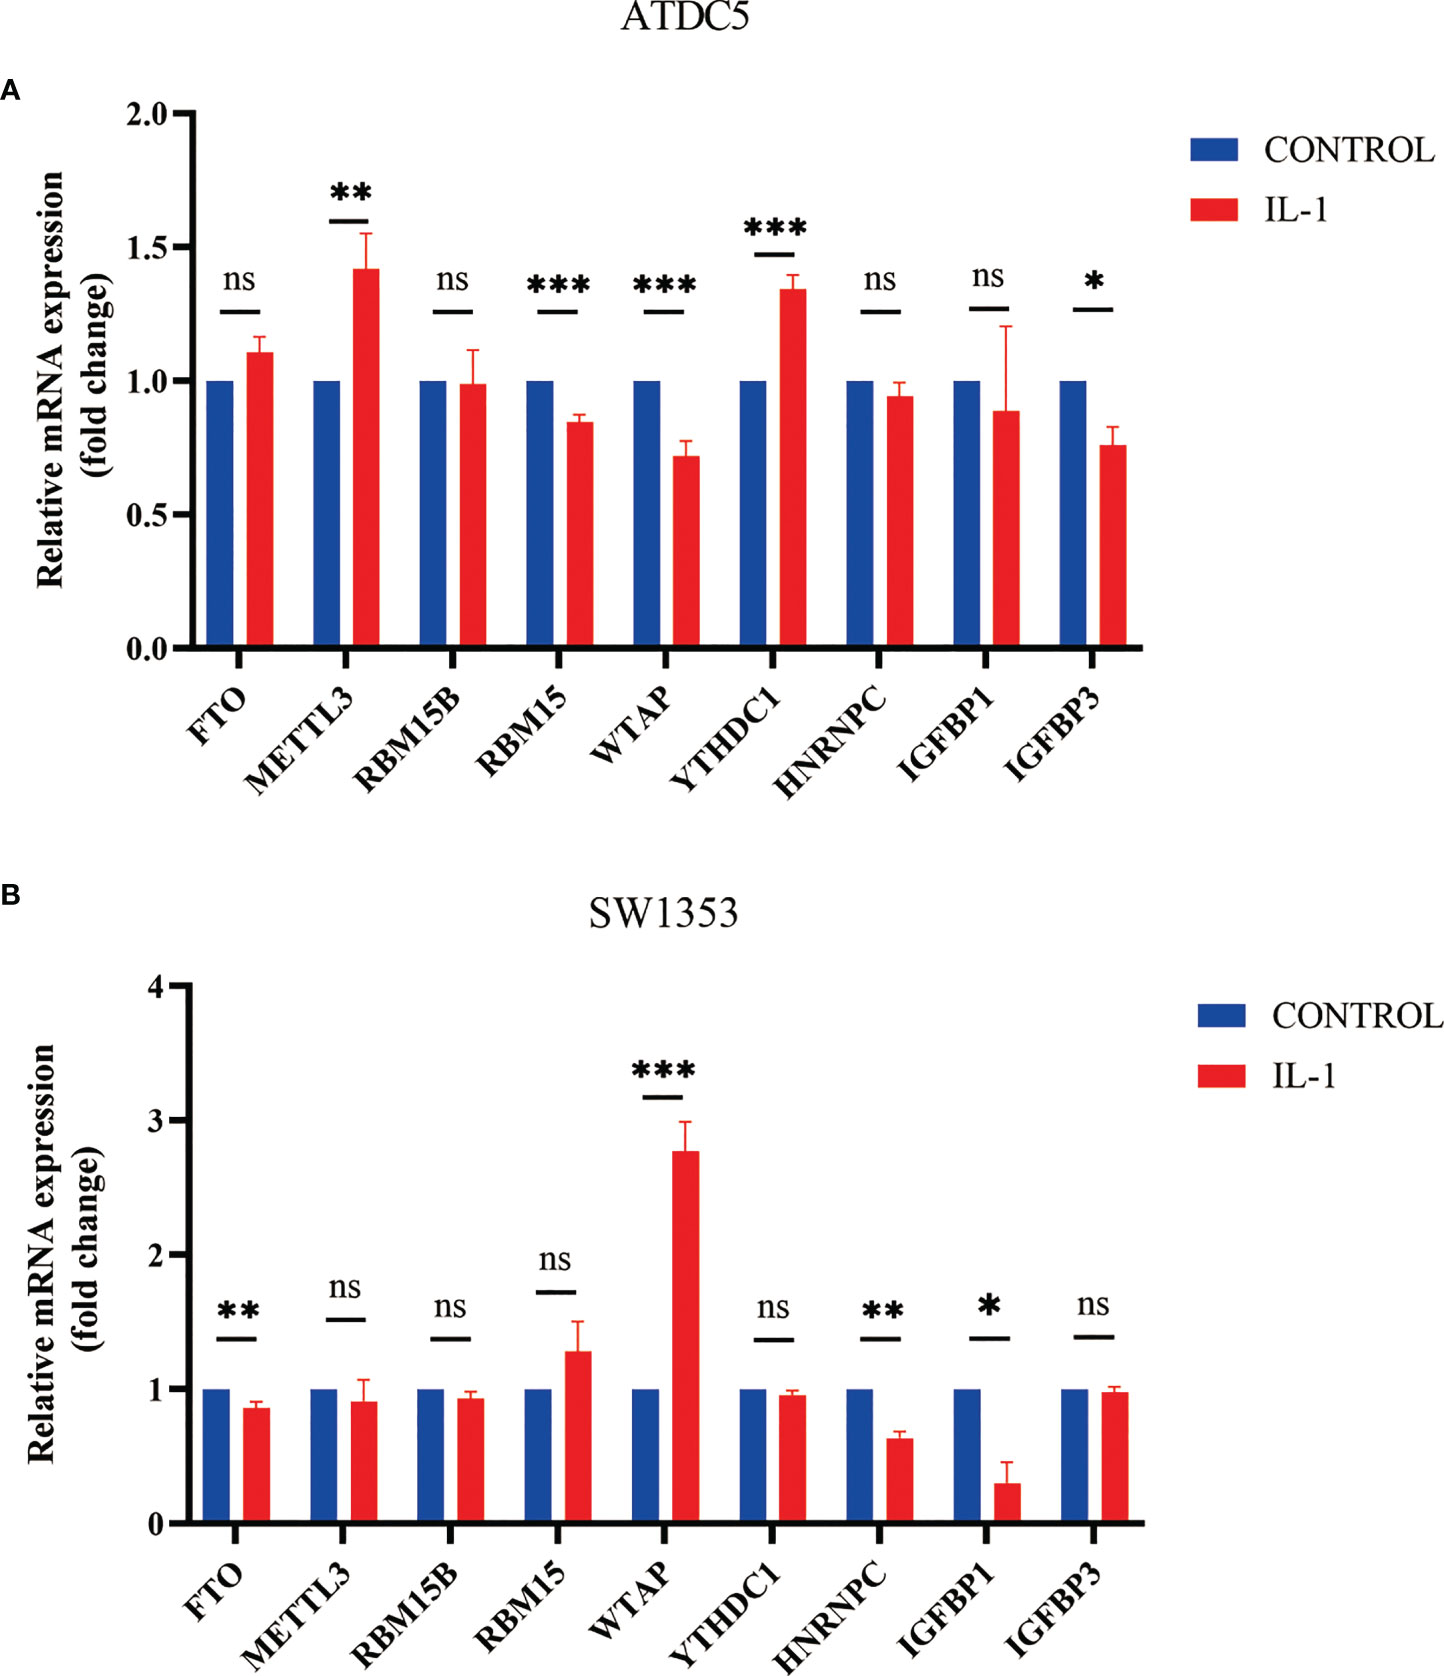
Figure 9 Expression of m6A regulator in cell model of OA. (A) Column diagram of m6A regulator in ATDC5 before and after treatment by IL-1β (*P<0.05, **P<0.01, ***P<0.001). (B) Column diagram of m6A regulator in SW1353 before and after treatment by IL-1β ns, P<0.05, No statistical difference,*P>0.05, **P>0.01, ***P>0.001.
Discussion
OA is a prevalent degenerative joint disease that can be painful and uncomfortable (36). Increasing evidence shows that m6A modification is critical for inflammation and innate immunity by interacting with a variety of m6A regulators. Abnormal modification of the m6A gene may lead to disorders of important genes and dynamic balance, resulting in disease (37). In recent years, there have been many discussions about the relationship between inflammatory factors and the pathogenesis and progression of OA. OA is now regarded as an inflammatory illness defined by inflammatory factors rather than a degenerative disease (38). The inflammatory environment is critical to the progression of OA (39). At present, researchers are interested in the association between m6A modifications and OA. Thus, future studies will focus on the link between epigenetic regulation and inflammatory factors in OA.
We systematically investigated the mechanism of the modification mode of m6A in the immune microenvironment of OA. First, we discovered that the expression of the majority of m6A regulators changed between healthy controls and OA patients, indicating that m6A regulators were implicated in the occurrence and progression of OA. Previous studies have indicated that METTL3 plays a significant role in the pathogenesis of osteoarthritis. Liu’s study demonstrated that METTL3 regulates OA pathogenesis by promoting inflammation and extracellular matrix (ECM) synthesis (7). Jiangdong Ren showed that METTL3-mediated LINC00680 accelerates OA (40). However, Sang. W showed that overexpression of METTL3 leads to reduced inflammatory cytokine levels and regulates the TIMP/MMP balance (14). There are a few studies on the relationship between FTO and OA. However, there is also controversy between these studies (41, 42). In our study, both FTO and METTL3 were found to be key m6A regulators in OA. Our study shows that METTL3 is downregulated and FTO is upregulated in OA.
We further classified OA patients according to the screening results for 9 key m6A regulators. Furthermore, several m6A regulators exhibited expression correlations with each other, which revealed the m6A modification regulatory network. Third, the impact of m6A modification patterns on immunocytes infiltration was determined to strengthen the knowledge of the interaction between m6A RNA and the immunological response. We found that IGFBP1 and RBM15B were strongly correlated with infiltrating immunocytes in OA. Lange-Brokaar’s study showed that the immunocytes participating in cartilage injury and repair mostly comprise T cells, B cells, NK cells, DCs and macrophages (43). Our study also showed that these immunocytes play a significant role in distinct m6A modification patterns. The m6A cluster B had more kinds of infiltrating immunocytes than cluster A, and the degree of immune cell infiltration could not be judged. However, these validated the accuracy of our immunophenotypic categorization through key m6A regulators. It also showed that there is a certain correlation between the m6A regulator and immune infiltration. Different immune microenvironments has different effects on osteoarthritis, which also provides a basis for immune research in osteoarthritis.
Furthermore, the m6A phenotype-related DEGs and their biological functions were identified. Our study confirmed that m6A phenotype-related DEGs were significantly related to immune cell infiltration. We further found that the different expression levels of immune regulatory and immune checkpoints in different m6A clusters and gene clusters. This finding may provide new ideas for the study on treatment of OA. We set up an m6A score model to assess m6A modifications in individual OA patients. We also found that the m6A clusters and gene clusters contained almost the same sets of patients. Then, we established a prediction model that can predict the occurrence and progression of OA. We can score patients according to the expression of the m6A regulator, and then get the probability of OA by score. Finally, we tried to use the OA cell model to verify whether the changes in the m6A gene were consistent with our bioinformatics analysis. The results of real-time PCR analysis were not consistent with the differences in m6A regulator expression between OA patients and healthy patients. This may be due to the fact that the cell model was different from the human body and that the samples came from the peripheral blood of the patient. But the change of m6A regulators’ expression proved that these genes play a role in the progression of OA. More importantly, we found the change in gene expression in the OA cell model was almost consistent with that of the m6A cluster B. We believed that this phenomenon is due to the fact that we used IL-1β for cell modeling, and the macrophages that mainly secrete IL-1 were mainly enriched in the B cluster.
The study of m6A regulators is widely used in the field of oncology, and better treatment can be achieved through molecular subtyping (44, 45). In the field of OA, however, few studies have focused on the mechanism of m6A regulators. We are the first to systematically analyze the mechanism of m6A in OA. We proved that m6A modification has a role in regulating the OA immune microenvironment.
Limitations of the study
These results will provide new inspiration for the study of the pathogenesis and treatment of OA. However, there are still some deficiencies in our research. First, our study is based on bioinformatics analysis, and although our results are accurate and reliable in theory, they need to be verified by more experiments. In the future, we hope that single-cell RNA seq can be performed to better understand how m6A modification affects immune cell infiltration in OA patients. In addition, the expression profile dataset (GSE48556) contains only 139 samples, and a larger sample size would be more beneficial for bioinformatics analysis. Therefore, we hope that more OA expression profile data and studies with larger sample sizes will become available. Third, because OA is a nonneoplastic disease, its survival curve is rarely studied, so it is impossible to establish a model considering the m6A score and survival. However, the severity of knee joint damage can be studied, and more clinical data will establish the relationship between the m6A score and disease progression. In this way, m6A score will be critical in predicting the progression of the disease. But the accuracy of m6A scoring model need validated by a large number of patient samples. Finally, there were few genes in the GO and KEGG analyses of m6A phenotype-related DEGs, which could be due to the limited sample size. However, some of the enriched biological functions mentioned in our study have been proven to participate in OA by other studies, which indicates that our results are worth using for reference. We hope that the expression profile datasets with a larger sample size become available.
Conclusion
In summary, our study reveals for the first time the potential regulatory mechanism of m6A methylation modification in the immune microenvironment of OA. This study also sheds new light on the pathogenesis of OA. The difference in m6A modification mode is a significant contributor to the complexity of the OA microenvironment. Individual OA patients can utilize the m6A score to assess their m6A modification pattern and immune cell infiltration features. The prediction model we have established is helpful in predicting disease development in OA patients. Additional studies are needed to fully clarify the molecular mechanisms of m6A regulation and biological function during OA.
Data availability statement
Publicly available datasets were analyzed in this study. This data can be found here: The GSE48556 datasets were obtained from the GEOdatabase(https://www.ncbi.nlm.nih.gov/geo/query/acc.cgi?acc=GSE48556).
Author contributions
GS and YO designed this study. TW, HF and SC conducted literature searches and management. YO, YT and HM were responsible for data management and statistical analysis. GZ, ZW, WY interpreted the findings. YO performed the manuscript writing. The manuscript was revised by all authors, and the final version was approved by all. All authors contributed to the article and approved the submitted version.
Funding
This work was supported by the National Natural Science Foundation of China (NO.81960881), which was hosted by GS. The funders were not involved in the study design, data collection, statistical analysis or writing of the manuscript. The GSE48556 datasets were obtained from the GEO database (https://www.ncbi.nlm.nih.gov/geo/query/acc.cgi?acc=GSE48556).
Conflict of interest
The authors declare that the research was conducted in the absence of any commercial or financial relationships that could be construed as a potential conflict of interest.
Publisher’s note
All claims expressed in this article are solely those of the authors and do not necessarily represent those of their affiliated organizations, or those of the publisher, the editors and the reviewers. Any product that may be evaluated in this article, or claim that may be made by its manufacturer, is not guaranteed or endorsed by the publisher.
Supplementary material
The Supplementary Material for this article can be found online at: https://www.frontiersin.org/articles/10.3389/fimmu.2022.1018701/full#supplementary-material
Figure 1S | The best m6A cluster number was evaluated by the CCM. (A–G) K=3-9 CCM.
Figure 2S | The best gene cluster number was evaluated by the CCM. (A–I) K=2-9 CCM. (J) Relative change in the area under the CDF curve for k from 2 to 9.
References
1. Glyn-Jones S, Palmer AJ, Agricola R, Price AJ, Vincent TL, Weinans H, et al. Osteoarthritis. Lancet (2015) 386:376–87. doi: 10.1016/S0140-6736(14)60802-3
2. Nelson AE. Osteoarthritis year in review 2017: clinical. Osteoarthritis Cartilage (2018) 26:319–25. doi: 10.1016/j.joca.2017.11.014
4. Hunter DJ, Schofield D, Callander E. The individual and socioeconomic impact of osteoarthritis. Nat Rev Rheumatol (2014) 10:437–41. doi: 10.1038/nrrheum.2014.44
5. Li KC, Hu YC. Cartilage tissue engineering: recent advances and perspectives from gene regulation/therapy. Adv Healthc Mater (2015) 4:948–68. doi: 10.1002/adhm.201400773
6. Woodell-May JE, Sommerfeld SD. Role of inflammation and the immune system in the progression of osteoarthritis. J Orthop Res (2020) 38:253–7. doi: 10.1002/jor.24457
7. Liu Q, Li M, Jiang L, Jiang R, Fu B. METTL3 promotes experimental osteoarthritis development by regulating inflammatory response and apoptosis in chondrocyte. Biochem Biophys Res Commun (2019) 516:22–7. doi: 10.1016/j.bbrc.2019.05.168
8. Harvey ZH, Chen Y, Jarosz DF. Protein-based inheritance: Epigenetics beyond the chromosome. Mol Cell (2018) 69:195–202. doi: 10.1016/j.molcel.2017.10.030
9. Teng PC, Liang Y, Yarmishyn AA, Hsiao YJ, Lin TY, Lin TW, et al. RNA Modifications and epigenetics in modulation of lung cancer and pulmonary diseases. Int J Mol Sci (2021) 22:(19):10592. doi: 10.3390/ijms221910592
10. Zhang W, He L, Liu Z, Ren X, Qi L, Wan L, et al. Multifaceted functions and novel insight into the regulatory role of RNA N(6)-methyladenosine modification in musculoskeletal disorders. Front Cell Dev Biol (2020) 8:870. doi: 10.3389/fcell.2020.00870
11. Zhang X, Zhang S, Yan X, Shan Y, Liu L, Zhou J, et al. m6A regulator-mediated RNA methylation modification patterns are involved in immune microenvironment regulation of periodontitis. J Cell Mol Med (2021) 25:3634–45. doi: 10.1111/jcmm.16469
12. Huang X, Lv D, Yang X, Li M, Zhang H. m6A RNA methylation regulators could contribute to the occurrence of chronic obstructive pulmonary disease. J Cell Mol Med (2020) 24:12706–15. doi: 10.1111/jcmm.15848
13. Li H, Xiao W, He Y, Wen Z, Cheng S, Zhang Y, et al. Novel insights into the multifaceted functions of RNA n(6)-methyladenosine modification in degenerative musculoskeletal diseases. Front Cell Dev Biol (2021) 9:766020. doi: 10.3389/fcell.2021.766020
14. Sang W, Xue S, Jiang Y, Lu H, Zhu L, Wang C, et al. METTL3 involves the progression of osteoarthritis probably by affecting ECM degradation and regulating the inflammatory response. Life Sci (2021) 278:119528. doi: 10.1016/j.lfs.2021.119528
15. Yi L, Wu G, Guo L, Zou X, Huang P. Comprehensive analysis of the PD-L1 and immune infiltrates of m(6)A RNA methylation regulators in head and neck squamous cell carcinoma. Mol Ther Nucleic Acids (2020) 21:299–314. doi: 10.1016/j.omtn.2020.06.001
16. Yang Y, Hsu PJ, Chen YS, Yang YG. Dynamic transcriptomic m(6)A decoration: writers, erasers, readers and functions in RNA metabolism. Cell Res (2018) 28:616–24. doi: 10.1038/s41422-018-0040-8
17. Shulman Z, Stern-Ginossar N. The RNA modification N(6)-methyladenosine as a novel regulator of the immune system. Nat Immunol (2020) 21:501–12. doi: 10.1038/s41590-020-0650-4
18. Liu ZX, Li LM, Sun HL, Liu SM. Link between m6A modification and cancers. Front Bioeng Biotechnol (2018) 6:89. doi: 10.3389/fbioe.2018.00089
19. Ma X, Li Y, Wen J, Zhao Y. m6A RNA methylation regulators contribute to malignant development and have a clinical prognostic effect on cervical cancer. Am J Transl Res (2020) 12:8137–46.
20. Shen S, Zhang R, Jiang Y, Li Y, Lin L, Liu Z, et al. Comprehensive analyses of m6A regulators and interactive coding and non-coding RNAs across 32 cancer types. Mol Cancer (2021) 20:67. doi: 10.1186/s12943-021-01362-2
21. Wang J, Gao F, Zhao X, Cai Y, Jin H. Integrated analysis of the transcriptome-wide m6A methylome in preeclampsia and healthy control placentas. PeerJ (2020) 8:e9880. doi: 10.7717/peerj.9880
22. Sun D, Yang H, Fan L, Shen F, Wang Z. m6A regulator-mediated RNA methylation modification patterns and immune microenvironment infiltration characterization in severe asthma. J Cell Mol Med (2021) 25:10236–47. doi: 10.1111/jcmm.16961
23. Wang J, Wang K, Liu W, Cai Y, Jin H. m6A mRNA methylation regulates the development of gestational diabetes mellitus in han Chinese women. Genomics (2021) 113:1048–56. doi: 10.1016/j.ygeno.2021.02.016
24. Han D, Liu J, Chen C, Dong L, Liu Y, Chang R, et al. Anti-tumour immunity controlled through mRNA m(6)A methylation and YTHDF1 in dendritic cells. Nature (2019) 566:270–4. doi: 10.1038/s41586-019-0916-x
25. Wang L, Wen M, Cao X. Nuclear hnRNPA2B1 initiates and amplifies the innate immune response to DNA viruses. Science (2019) 365(6454):eaav0758. doi: 10.1126/science.aav0758
26. Lin S, Xu H, Zhang A, Ni Y, Xu Y, Meng T, et al. Prognosis analysis and validation of m(6)A signature and tumor immune microenvironment in glioma. Front Oncol (2020) 10:541401. doi: 10.3389/fonc.2020.541401
27. Jin Y, Wang Z, He D, Zhu Y, Hu X, Gong L, et al. Analysis of m6A-related signatures in the tumor immune microenvironment and identification of clinical prognostic regulators in adrenocortical carcinoma. Front Immunol (2021) 12:637933. doi: 10.3389/fimmu.2021.637933
28. Li M, Yin H, Yan Z, Li H, Wu J, Wang Y, et al. The immune microenvironment in cartilage injury and repair. Acta Biomater (2022) 140:23–42. doi: 10.1016/j.actbio.2021.12.006
29. Ramos YF, Bos SD, Lakenberg N, Böhringer S, Den Hollander WJ, Kloppenburg M, et al. Genes expressed in blood link osteoarthritis with apoptotic pathways. Ann Rheum Dis (2014) 73:1844–53. doi: 10.1136/annrheumdis-2013-203405
30. Wu H, Dong H, Fu Y, Tang Y, Dai M, Chen Y, et al. Expressions of m6A RNA methylation regulators and their clinical predictive value in cervical squamous cell carcinoma and endometrial adenocarcinoma. Clin Exp Pharmacol Physiol (2021) 48:270–8. doi: 10.1111/1440-1681.13412
31. Xiong W, Li C, Wan B, Zheng Z, Zhang Y, Wang S, et al. N6-methyladenosine regulator-mediated immue patterns and tumor microenvironment infiltration characterization in glioblastoma. Front Immunol (2022) 13:819080. doi: 10.3389/fimmu.2022.819080
32. Charoentong P, Finotello F, Angelova M, Mayer C, Efremova M, Rieder D, et al. Pan-cancer immunogenomic analyses reveal genotype-immunophenotype relationships and predictors of response to checkpoint blockade. Cell Rep (2017) 18:248–62. doi: 10.1016/j.celrep.2016.12.019
33. Sotiriou C, Wirapati P, Loi S, Harris A, Fox S, Smeds J, et al. Gene expression profiling in breast cancer: understanding the molecular basis of histologic grade to improve prognosis. J Natl Cancer Inst (2006) 98:262–72. doi: 10.1093/jnci/djj052
34. Zeng D, Li M, Zhou R, Zhang J, Sun H, Shi M, et al. Tumor microenvironment characterization in gastric cancer identifies prognostic and immunotherapeutically relevant gene signatures. Cancer Immunol Res (2019) 7:737–50. doi: 10.1158/2326-6066.CIR-18-0436
35. Legendre F, Baugé C, Roche R, Saurel AS, Pujol JP. Chondroitin sulfate modulation of matrix and inflammatory gene expression in IL-1beta-stimulated chondrocytes–study in hypoxic alginate bead cultures. Osteoarthritis Cartilage (2008) 16:105–14. doi: 10.1016/j.joca.2007.05.020
36. Bloomfield RA, Fennema MC, Mcisaac KA, Teeter MG. Proposal and validation of a knee measurement system for patients with osteoarthritis. IEEE Trans BioMed Eng (2019) 66:319–26. doi: 10.1109/TBME.2018.2837620
37. Liu Y, Guo X, Zhao M, Ao H, Leng X, Liu M, et al. Contributions and prognostic values of m(6) a RNA methylation regulators in non-small-cell lung cancer. J Cell Physiol (2020) 235:6043–57. doi: 10.1002/jcp.29531
38. Jiang Y. Osteoarthritis year in review 2021: biology. Osteoarthritis Cartilage (2022) 30:207–15. doi: 10.1016/j.joca.2021.11.009
39. Wang P, Meng Q, Wang W, Zhang S, Xiong X, Qin S, et al. Icariin inhibits the inflammation through down-regulating NF-κB/HIF-2α signal pathways in chondrocytes. Biosci Rep (2020) 40(11):BSR20203107. doi: 10.1042/BSR20203107
40. Ren J, Li Y, Wuermanbieke S, Hu S, Huang G. N(6)-methyladenosine (m(6)A) methyltransferase METTL3-mediated LINC00680 accelerates osteoarthritis through m(6)A/SIRT1 manner. Cell Death Discovery (2022) 8:240. doi: 10.1038/s41420-022-00890-0
41. Panoutsopoulou K, Metrustry S, Doherty SA, Laslett LL, Maciewicz RA, Hart DJ, et al. The effect of FTO variation on increased osteoarthritis risk is mediated through body mass index: a mendelian randomisation study. Ann Rheum Dis (2014) 73:2082–6. doi: 10.1136/annrheumdis-2013-203772
42. Dai J, Ying P, Shi D, Hou H, Sun Y, Xu Z, et al. FTO variant is not associated with osteoarthritis in the Chinese han population: replication study for a genome-wide association study identified risk loci. J Orthop Surg Res (2018) 13:65. doi: 10.1186/s13018-018-0769-2
43. De Lange-Brokaar BJ, Ioan-Facsinay A, Van Osch GJ, Zuurmond AM, Schoones J, Toes RE, et al. Synovial inflammation, immune cells and their cytokines in osteoarthritis: a review. Osteoarthritis Cartilage (2012) 20:1484–99. doi: 10.1016/j.joca.2012.08.027
44. Li B, Cui Y, Nambiar DK, Sunwoo JB, Li R. The immune subtypes and landscape of squamous cell carcinoma. Clin Cancer Res (2019) 25:3528–37. doi: 10.1158/1078-0432.CCR-18-4085
Keywords: m6A regulator, immune microenvironment, osteoarthritis, RNA methylation, immunocytes
Citation: Ouyang Y, Tu Y, Chen S, Min H, Wen Z, Zheng G, Wan T, Fan H, Yang W and Sun G (2022) Characterization of immune microenvironment infiltration and m6A regulator-mediated RNA methylation modification patterns in osteoarthritis. Front. Immunol. 13:1018701. doi: 10.3389/fimmu.2022.1018701
Received: 13 August 2022; Accepted: 31 October 2022;
Published: 23 November 2022.
Edited by:
Feng Lai Yuan, The Third Hospital Affiliated to Nantong University, ChinaReviewed by:
Rio Sugimura, The University of Hong Kong, Hong Kong SAR, ChinaMing Zhou, Cancer Research Institute, Central South University, China
Copyright © 2022 Ouyang, Tu, Chen, Min, Wen, Zheng, Wan, Fan, Yang and Sun. This is an open-access article distributed under the terms of the Creative Commons Attribution License (CC BY). The use, distribution or reproduction in other forums is permitted, provided the original author(s) and the copyright owner(s) are credited and that the original publication in this journal is cited, in accordance with accepted academic practice. No use, distribution or reproduction is permitted which does not comply with these terms.
*Correspondence: Guicai Sun, 13657000633@139.com