 Marilena P. Etna1*
 Martina Severa1
 Valerio Licursi2
 Manuela Pardini1
 Melania Cruciani1
 Fabiana Rizzo1
 Elena Giacomini1
 Gianfranco Macchia3
 Orazio Palumbo4Raffaella Stallone4
 Massimo Carella4Mark Livingstone5
 Rodolfo Negri2
 Sandra Pellegrini5
 Eliana M. Coccia1*
- 1Department of Infectious Diseases, Istituto Superiore di Sanità, Rome, Italy
- 2Department of Biology and Biotechnology, Sapienza University, Rome, Italy
- 3Proteomics Core Facility, Istituto Superiore di Sanità, Rome, Italy
- 4Division of Medical Genetics, Fondazione IRCCS-Casa Sollievo della Sofferenza, San Giovanni Rotondo, Italy
- 5Cytokine Signaling Unit, Inserm, Institut Pasteur, Paris, France
In human primary dendritic cells (DC) rapamycin—an autophagy inducer and protein synthesis inhibitor—overcomes the autophagy block induced by Mycobacterium tuberculosis (Mtb) and promotes a Th1 response via IL-12 secretion. Here, the immunostimulatory activity of rapamycin in Mtb-infected DC was further investigated by analyzing both transcriptome and translatome gene profiles. Hundreds of differentially expressed genes (DEGs) were identified by transcriptome and translatome analyses of Mtb-infected DC, and some of these genes were found further modulated by rapamycin. The majority of transcriptome-associated DEGs overlapped with those present in the translatome, suggesting that transcriptionally stimulated mRNAs are also actively translated. In silico analysis of DEGs revealed significant changes in intracellular cascades related to cytokine production, cytokine-induced signaling and immune response to pathogens. In particular, rapamycin treatment of Mtb-infected DC caused an enrichment of IFN-β, IFN-λ and IFN-stimulated gene transcripts in the polysome-associated RNA fraction. In addition, rapamycin led to an increase of IL-12, IL-23, IL-1β, IL-6, and TNF-α but to a reduction of IL-10. Interestingly, upon silencing or pharmacological inhibition of GSK-3β, the rapamycin-driven modulation of the pro- and anti-inflammatory cytokine balance was lost, indicating that, in Mtb-infected DC, GSK-3β acts as molecular switch for the regulation of the cytokine milieu. In conclusion, our study sheds light on the molecular mechanism by which autophagy induction contributes to DC activation during Mtb infection and points to rapamycin and GSK-3β modulators as promising compounds for host-directed therapy in the control of Mtb infection.
Introduction
As reported by World Health Organization, millions of people in the world continue to fall ill each year with tuberculosis (TB), one of the top killer infectious disease caused by Mycobacterium tuberculosis (Mtb) (1). The reasons behind Mtb capacity to maintain this sad primacy must be sought in the different strategies employed by this pathogen to survive inside the host, ranging from the establishment of a latent infection to several mechanisms for evading the immune response (2). In this context, the host innate immune system and its plethora of defense mechanisms critically influence the fate of the infection (2). Among innate immune cells, macrophages and dendritic cells (DC) are early infected by Mtb and, in turn, these cells orchestrate the immune response against the pathogen. In particular, DC, as professional antigen presenting cells (APC), undergo phenotypic modifications and produce a panel of pro-inflammatory and regulatory cytokines which tune the immune response by acting on different cell populations, including naïve T cells (3). A critical prerequisite for DC activation is the sensing of Mtb-associated molecular structures by pattern recognition receptors whose stimulation leads to a range of cellular events that contribute to host mycobacterial control. However, during its co-evolution with the host, Mtb has evolved numerous evasion mechanisms to hijack innate immune response, such as cytosolic escape, block of phagosome maturation, apoptosis, inflammasome activation/modulation as well as autophagy inhibition (4). In particular, the relevance of autophagy in the anti-mycobacterial response is well documented. Indeed, it was shown that, in order to promote its own survival, virulent Mtb impairs phagosome maturation by altering the acidic, hydrolytic environment of the intracellular compartment (5), it compromises the autophagy-mediated antigen-processing capacity of macrophages and DC (6, 7) and blocks autophagosome formation and maturation (2, 8, 9). Interestingly, in the last decade many authors have investigated the effect of autophagy modulators to improve anti-mycobacterial host cell functions and proposed their use as potential therapeutic treatment. Since autophagy is regulated by several intracellular pathways and some of them converge on the master regulatory kinase mammalian target of rapamycin (mTOR), autophagy-targeting strategies can either inhibit mTOR or can be mTOR-independent (10). In this context, we previously showed that the block of autophagy caused by Mtb in human DC is overcome by rapamycin, an autophagy inducer and mTOR inhibitor. Moreover, treatment with rapamycin leads also to increased expression of interferon-β (IFN-β) and increased production of the pro-Th1 cytokine, interleukin 12 (IL-12) (9).
In the current study, we investigated the molecular mechanisms underlying rapamycin-mediated immune-stimulatory action, by studying both transcriptome and translatome gene profiles of DC infected with Mtb in presence or absence of rapamycin. We found that, during Mtb infection, the drug can act as a selective inducer of protein translation, by promoting the association of type I and type III IFN mRNAs to polysomes and by preventing the inhibition of the constitutively active glycogen synthase kinase 3 beta (GSK-3β) through which rapamycin impinges on the balance of secreted pro- and anti-inflammatory cytokines.
Materials and Methods
Ethics Statement
Istituto Superiore di Sanità Review Board approved the present research project (CE/13/387). No informed consent was given since the data were analyzed anonymously. Peripheral blood mononuclear cells were isolated from freshly collected buffy coats obtained from healthy voluntary blood donors (Blood Bank of University “La Sapienza”, Rome, Italy).
DC Preparation and Cell Culture
DC were prepared as previously described (11). Briefly, DC were generated by culturing CD14+ monocytes with 50 ng/ml GM-CSF and 1000 U/ml IL-4 (R&D Systems, Minneapolis, MN, USA) for 5 days at 0.5x10⁶ cells/ml in RPMI 1640 (Lonza, Basel, Switzerland), supplemented with 2 mM L-glutamine and 15% Fetal Bovine Serum (FBS) (Lonza). At day 5 the cells were tested for their differentiation status by evaluating CD1a expression (>90% CD1a+) and lack of CD14 (>95% CD14-). Before infection, the medium was replaced with RPMI without antibiotics and supplemented with 2 mM L-glutamine and 15% FBS. Cytokine deprivation did not affect DC survival rate, which was >90%.
Antibodies (Abs) and Other Reagents
For immunoblotting analysis, rabbit anti-phospho-p70S6K (S371), rabbit anti-phospho- p70S6K (T389), rabbit anti-GSK-3β, rabbit anti-phospho-GSK-3β (S9), rabbit anti-phospho-GS (S641), rabbit-anti-p38, rabbit-anti-phospho-p44/42 (T202/Y204), rabbit anti-phospho-p38 (T180/Y182) (Cell Signaling, Danvers, MA, USA), mouse anti-actin (Sigma-Aldrich, St. Louis, MO, USA), and horseradish peroxidase-conjugate secondary anti-mouse and anti-rabbit Abs (Santa Cruz Biotechnology) were used. Rapamycin (0.2 µM, Sigma-Aldrich) or Torin 1 (0.5 µM Tocris, Bristol, UK) were added to DC culture 4 h after Mtb-infection for studying mammalian target of rapamycin complex 1 (mTORC1) and mTOR inhibition respectively. For the selective inhibition of GSK-3β and p70S6K1 respectively, SB216763 (5 µM, Sigma-Aldrich) and PF4708671 (0.1 µM, Sigma-Aldrich) were used to treat DC 30 min before infection and rapamycin treatment. To evaluate rapamycin bystander effect, DC were treated for 30 min before infection and rapamycin treatment with SB203580 (10 µM, Sigma-Aldrich) or SB202129 (10 µM, Sigma-Aldrich) to inhibit p38 or with PD980509 (0.1 µM, Sigma-Aldrich) to block p44/42.
Bacterial Strain Description and Preparation
Mtb H37Rv (ATCC 27294; American Type Culture Collection) was grown as previously described (8). Logarithmically growing cultures were centrifuged at 800 rpm for 10 min to eliminate clumped mycobacteria and then washed three times in RPMI 1640. Mycobacteria were re-suspended in RPMI 1640 containing 10% FBS and then stored at - 80°C. Bacterial frozen vials were thawed and bacterial viability was determined by counting the number of colony forming units. All bacterium preparations were tested for endotoxin contamination (<1 Endotoxin Unit/ml) by the Limulus lysate assay (Lonza). DC cultures were then infected with a multiplicity of infection (MOI) of 1 bacterium/cell as previously described (8).
Total RNA Extraction, Quantification, and Quality Assessment
Total RNA was isolated from 10x106 infected or not infected DC, treated or not with rapamycin using Trizol (Invitrogen, Thermo Fisher Scientific) and by following manufacturer’s recommendations. RNA was quantified using a Nanodrop 2000 spectrophotometer (Thermo Fisher Scientific, Waltham, MA, USA) and quality assessed with an established cut-off of 1.8 for both the 260/280 and 260/270 absorbance ratios. RNA integrity was instead inspected by bioanalyzer analysis (Agilent Technologies, Santa Clara, CA, USA) considering a cut-off of 1.8 for 28S/18S ratio.
Isolation of Polysome-Associated RNA
For RNA fraction isolation, 10×106 cells for untreated DC (CTRL), DC treated for 12 h with rapamycin (0.2 µM) and DC infected for 16 h with Mtb (MOI 1) and treated or not with rapamycin (12 h, 0.2 µM) were used. Polysome-associated RNA were prepared as previously described (8). Briefly, each gradient was fractionated in BSL3 facility by hand collection from the top of the gradient into 2 samples, light phase (low polysome occupancy) and heavy phase (high polysome occupancy). The hand collection method was previously tested to parallel with fraction collection using a fractionator coupled with an UV optical reader (A 254nm). The obtained fractions were immediately mixed with an equal volume of Trizol (Invitrogen, Thermo Fisher Scientific) for later RNA isolation following Trizol manufacturing instructions.
Microarray Analysis
Gene expression profiling was performed using the GeneChip® Human Transcriptome Array 2.0 (Thermo Fisher Scientific, Waltham, MA, USA) including more than 6.0 million distinct probes covering both coding and non-coding genes built on transcript mappings from hg19 human reference sequence (GRCh37). A total of 400,000 full length transcripts were combined from available public data sources: RefSeq NCBI, UCSC Genes, Vega, GENCODE, Ensembl, Mammalian Gene Collection. Additional long non-coding content was combined from the UCSC genome browser, noncode.org, Broad Human Body Map. Probes are distributed across the full length of the gene including specific probes (>339.000 probe sets) covering splice junction, providing a complete and accurate picture of overall gene expression with the additional ability for transcript isoform analysis.
For each sample enrolled for the study, 100 ng of total RNA were processed according to the GeneChip Whole Transcript Sense Target Labeling Assay following the manufacturer’s instructions (Thermo Fisher Scientific, Waltham, MA, USA). Briefly, a random priming method was used to generate cDNA from all RNA transcripts present in a sample. The random primers incorporate a T7 promoter sequence, which is subsequently used in an in vitro transcription to produce antisense cRNA fragments. Single stranded cDNA complementary to the cRNA is then produced, in the sense orientation, where a modified dUTP is incorporated instead of dTTP. The modified dUTP is subsequently recognized by the enzymes Uracil-DNA glycosylase and human apurinic/apyrimidinic endonuclease 1 which will cut the DNA, resulting in fragmentation of the cDNA. Each DNA fragment is end-labelled with biotin using terminal deoxynucleotidyltransferase before being hybridized to the arrays for 16 h at 45°C in a GeneChip Hybridization Oven 640. Following hybridization and post hybridization washes each array were scanned using the GeneChip Scanner 3000 7G to generate the raw data (.CEL file). The QC steps of the experiment were performed using Expression Console v1.4 (Thermo Fisher Scientific, Waltham, MA, USA) software.
CEL files were first processed with the Affymetrix collection of command line programs Analysis Power Tools (APT, v1.16.0) using the apt-probeset-summarize command in order to estimate the intensity at gene level with the RMA-sketch normalization. In this step background corrected raw data were Log2-transformed and quantile-normalized following the Robust Multichip Average (RMA) procedure as described in Irizarry et al. (12). For gene annotation the file “HTA-2_0.na34.hg19.transcript” (obtained from Affymetrix) was used. R v3.1.2 (www.r-project.org) environment and Bioconductor (www.bioconductor.org) packages were used for the following preprocessing and statistical analysis. PCA was performed with the native R function prcomp on RMA-normalized data and the first two principal components were plotted with ggplot2 package functions. Hierarchical clustering of sample Euclidean distances was performed with hclust and dist native R functions and the resulting heatmap was plotted with gplots package heatmap.2 function. Finally, tRanslatome package pipeline was used to find out the probe sets that showed significant (FDR < 0.01) differential expression between experimental conditions and to perform the Gene Ontology (GO) Database (13) enrichment analysis, internally using the limma - Linear Models for Microarray Data - (14) and topGO methods, respectively. The GO and pathway enrichment analysis were obtained using clusterProfiler (15) package with annotation of KEGG (16) and Reactome (17) databases.
Microarray data accompanying this paper are available through NCBI Gene Expression Omnibus (GEO) repository, under accession number GSE163531.
Quantitative Real-Time PCR and Digital PCR
For the analysis of IL12p40 and IL-10 mRNA levels, total RNA was reverse transcribed as previously described (11) and then analyzed using the appropriate TaqMan assay (Applied Biosystems) and TaqMan Universal Master Mix II (Applied Biosystems) according to the manufacturer’s instructions. Transcripts expression were normalized to the GAPDH level by using the equation 2-ΔCt; the values are mean ± SEM of triplicate determinations.
The validation of translatome data was conducted by Digital PCR on total and heavy phase-associated RNA that was reverse transcribed as previously described (8). In particular, experiments were carried out to test the mRNA copy number of IFNA1, IFNB1, IFNL1 and some IFN stimulated genes (ISGs). Among ISGs we tested CXCL9, CXCL11, two chemokines involved in T cell recruitment; IFN induced with helicase C domain 1 (IFIH1, alias MDA5) - an RNA sensing molecule recently proposed as innate restriction factor for Mtb growth (18), IFN induced protein with tetratricopeptide repeats (IFIT3) - the bridging adapter of TANK binding kinase 1 (TBK1)/mitochondrial antiviral signaling protein (MAVS) implicated in TBK1 activation and IFN regulatory factor 3 (IRF3) phosphorylation (19) - and IRF7 - a transcription factor stimulated by the autocrine action of IFN-β induced in STING/IRF3-dependent manner (20). Digital PCR experiments were carried out on the BioMark HD System (Fluidigm, San Francisco, CA, USA) by loading cDNA samples into Fluidigm’s 37K Digital Array microfluidic chip as previously described (8). Briefly, Fluidigm’s 37K Digital Array consists of 48 panels, each of which is further partitioned into 770 reaction chambers. The reaction for each panel was set up with the specific TaqMan assay probe and with TaqMan Universal Master Mix II (Applied Biosystems) into a final volume of 5 μl. For each sample, six serial dilutions were loaded in triplicate reactions and the chip was then thermocycled and imaged on Fluidigm’s BioMark HD real-time PCR system. Positive chambers that originally contained 1 or more molecules has been counted by the Digital PCR analysis software (Fluidigm) and only templates that yielded 150–360 amplified molecules per panel were chosen for technical replication in order to obtain absolute quantification of target RNA copy number.
DC Transfection and Gene Silencing by siRNA
Predesigned siRNA oligonucleotide for GSK-3β (iGSK-3β) was obtained from Ambion (Thermo Fisher Scientific). A negative-control siRNA oligonucleotide [neg ctrl (Ambion, Thermo Fisher Scientific)] was used to address the specificity of the observed effect to the specific GSK-3β sequence. SiRNA transfection efficiency was determined as previously described (8). For each condition, 4x10⁵ DC were plated in a 12-well plate. Lipoplexes were prepared in Opti-MEM serum-free medium (Invitrogen, Thermo Fisher Scientific) at 1:1 ratio. Briefly, siRNA plus fluorescent oligonucleotide and 10 μl of Lipofectamine (1 mg/mL) were diluted separately in 250 μl of Opti-MEM medium.
The Lipofectamine solution was added to the siRNA solution and placed for 5 min at room temperature and then added to DC. Four hours (h) after incubation, medium was replaced with fresh Opti-MEM medium supplemented with 15% FCS and 2 mM L-glutamine for at least 8 h. After the indicated time, cells were infected with Mtb and, where required, treated with rapamycin. After the indicated time, DC were harvested to recover culture supernatants and to isolate RNA. Transfection effect on DC viability, maturation and activation was evaluated as previously described (8).
Immunoblotting Analysis
Total protein extracts were prepared from 1x10⁶ infected or not infected DC, treated or not with rapamycin by using the CelLytic cell lysis reagent (Sigma-Aldrich) supplemented with protease and phosphatase inhibitor cocktails and by following manufacturer’s recommendations.
For P-p70S6K S371, P-p70S6K T389, total GSK-3β, P-GSK-3β S9, P-GS S641, P-p44/42 T202/Y204, total p38 and P-p38 Y180/Y182 determination 25 μg of total protein extract were separated on 10% NuPAGE Bis-Tris gel (Invitrogen, Thermo Fisher Scientific) and electroblotted onto nitrocellulose membranes (GE Healthcare, Pittsburgh, PA, USA). Blots were incubated with primary Abs in 5% nonfat dry milk in TBS plus 0.1% Tween20 (Sigma-Aldrich) overnight at 4°C. Detection was achieved using horseradish peroxidase-conjugate anti-rabbit or anti-mouse or anti-goat (Santa Cruz) secondary Abs and visualized with Clarity Western ECL Substrate (Bio-Rad, Segrate, Italy). The quantifications of P-p70S6K S371, P-p70S6K T389, total GSK-3β, P-GSK-3β S9, P-GS S641, P-p44/42 T202/Y204, total p38 and P-p38 Y180/Y182 were performed by calculating their ratio compared to the actin level by using ImageLab software (Bio-Rad) and then calculating the ratio among infected/treated vs uninfected conditions.
Cytokine Determination
Supernatants of DC cultures were harvested 24 h after infection, filtered (0.2 μm) and stored at −80°C. The production of IL-1β, TNF-α, IL-6, IL-12, and IL-10 was measured by human Inflammatory Cytokine bead array kit (BD Bioscience). IL-23 release was instead assayed by ELISA (R&D Systems).
Statistical Analysis
Statistical analysis was performed using One-way Repeated-Measures ANOVA. In case of significant ANOVA, the pairwise comparisons were carried out by the use of the post-hoc Tukey’s test, in order to test the significance of the difference between two stimulation effects. In all the cases above, a p value < 0.05 was considered statistically significant: “*” refers to the p-value ≥ 0.01 and < 0.05; “**” refers to the p-value is ≥ 0.001 and < 0.01; “***” the p-value is <0.001. Data analysis was carried out using native functions of R language version 4.0.3.
Results
Profiling of Human Primary DC Infected With Mtb and Treated With Rapamycin
We have previously shown that in human primary DC the autophagy inducer rapamycin overcomes the block exerted by Mtb on autophagosome/lysosome fusion, and enhances IL-12 secretion driving a protective Th1 response (9). Here, to further investigate how rapamycin, known to inhibit translation by blocking mTORC1, impacts on the immunoregulatory properties of Mtb-infected DC, a comparative analysis of global transcriptome and translatome profiles was conducted (Supplementary Figure 1).
Total and polysome-associated (heavy) RNA samples were prepared from uninfected DC or DC infected for 16 h with live H37Rv Mtb alone or in combination with rapamycin. Principal component analysis and sample correlation/clustering study of our gene expression profiles clearly showed a distinct pattern of total and heavy RNA samples and of Mtb-infected vs uninfected DC for the four analyzed donors (Figure 1). In particular, the MA-plots displaying the logged intensity ratio (M) vs the mean logged intensities (A) of mRNAs whose profiles were significantly modulated in treated and/or infected DC vs uninfected cells (adjusted p-value [FDR] < 0.01 and at least 1.5-log2 fold change), revealed 228 and 404 differentially expressed genes (DEGs) in transcriptome and translatome of Mtb-infected DC, respectively. No difference was observed in uninfected cells treated with rapamycin vs control cells. When rapamycin was added to Mtb-infected DC, DEGs increased to 378 in the transcriptome and 729 in the translatome (Supplementary Figure 2). Interestingly, the majority of genes identified in the transcriptome were found in the list of translatome-modulated genes, suggesting that host mRNAs induced by Mtb alone or in combination with rapamycin are efficiently loaded on polysomes, where actively translated mRNAs reside.
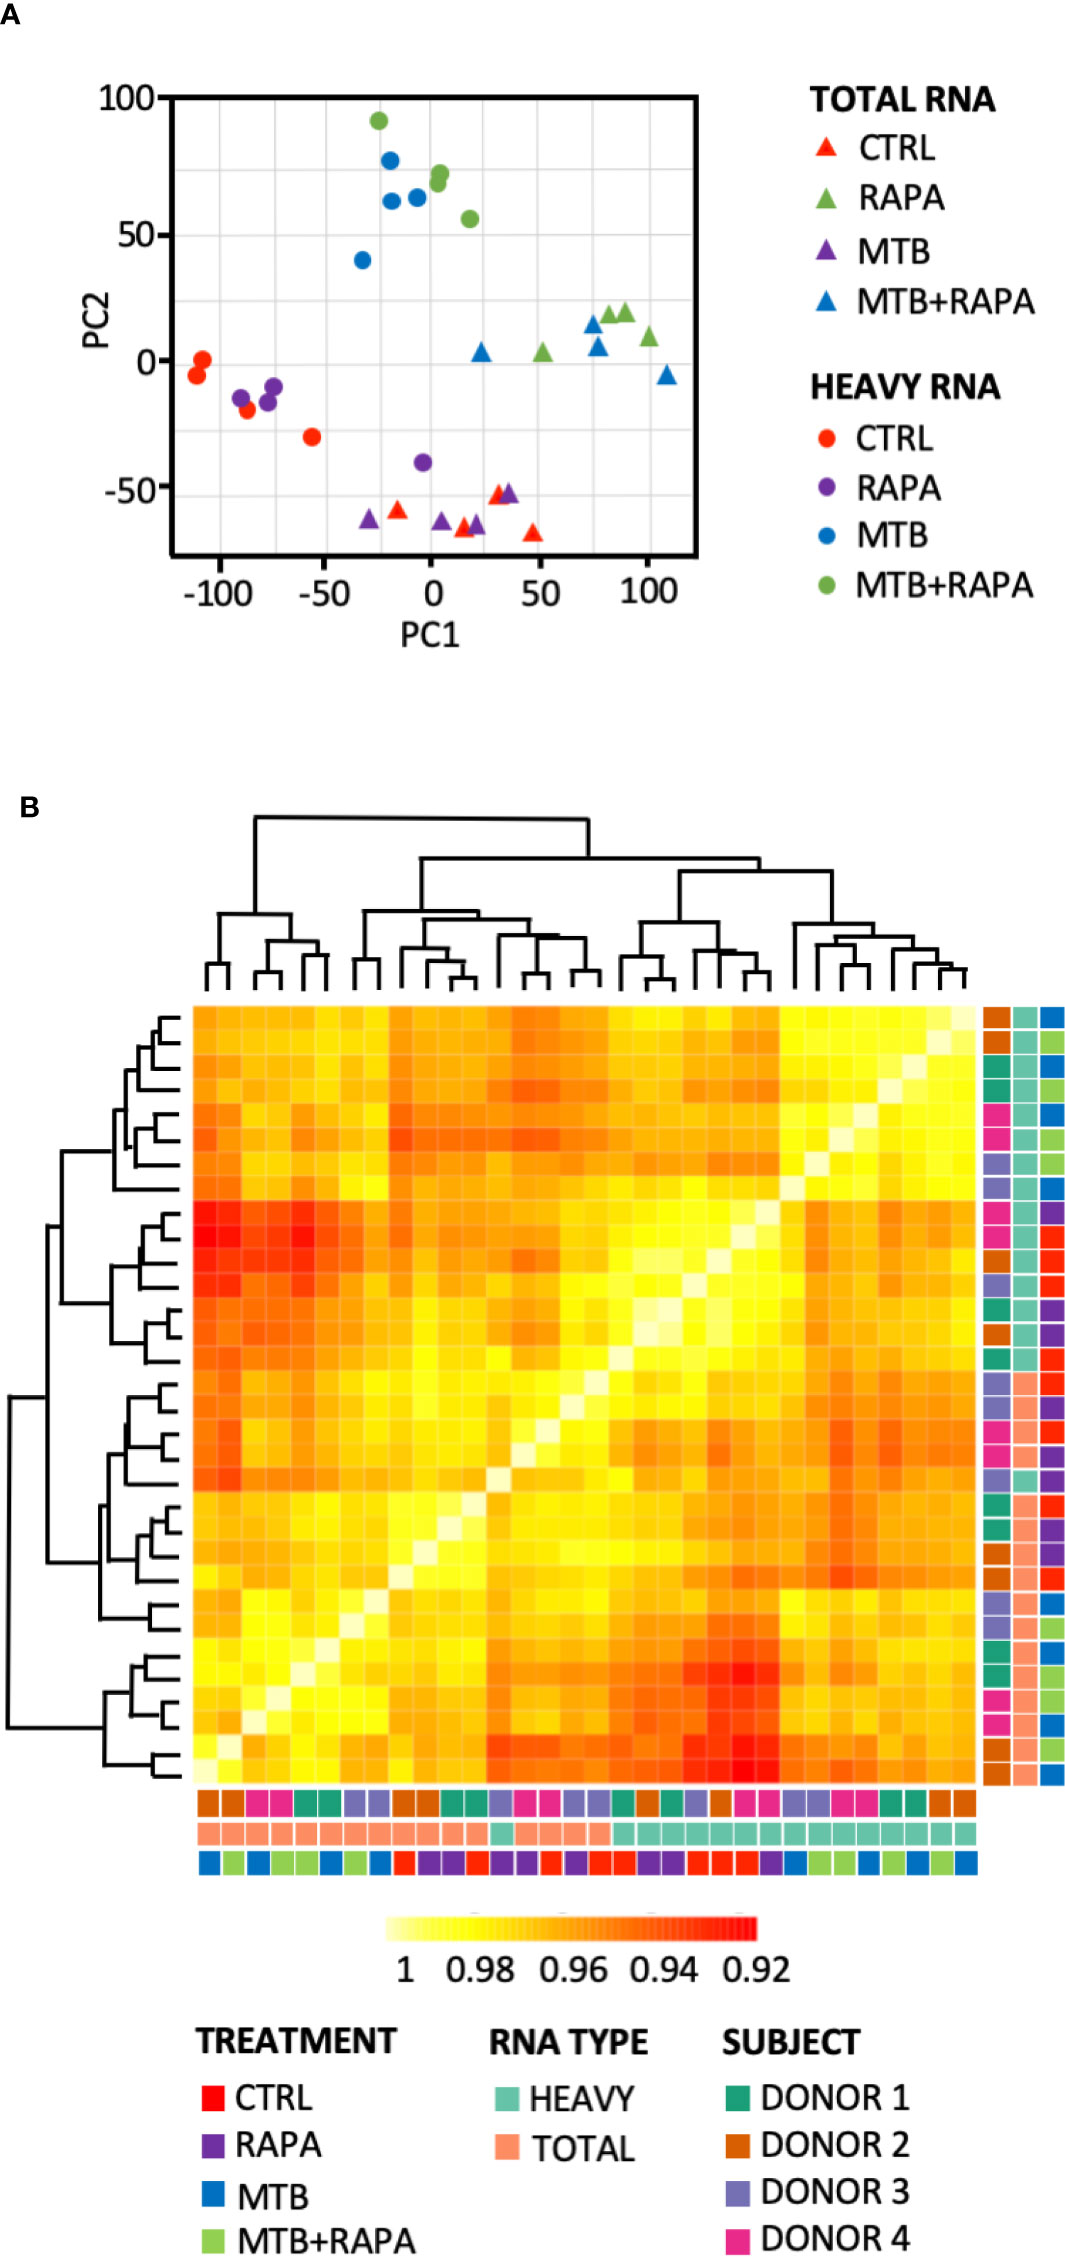
Figure 1 Analysis of transcriptome and translatome of human DC infected with Mtb and treated with rapamycin. DC isolated from 4 healthy donors were left unstimulated (CTRL), treated with rapamycin (RAPA) or infected with Mtb alone (MTB) or in presence of rapamycin added 4 h post infection (MTB+RAPA). Cells were harvested 16 h post infection for total and polysome-associated RNA isolation and microarray analysis. (A) Principal component analysis of gene expression profile of samples. Triangles indicate total RNA samples (TOTAL), circles refer to RNA fraction associated with polysome chains (HEAVY). (B) Heatmap showing hierarchical clustering of sample correlation. The dendrogram clusters together the significantly regulated treatment conditions with most similar expression profiles among the 4 donors. Correlation is represented by a color code according to the legend where yellow indicates higher correlation. A color code was used to distinguish among treatment conditions (CTRL, RAPA; MTB, MTB+RAPA), RNA type (TOTAL vs HEAVY) and DC culture prepared from different subjects (D1, D2, D3, D4).
Functional GO annotation study and pathway enrichment analysis were performed on the transcriptome- or translatome-associated DEGs and revealed biological processes and signaling cascades associated to Mtb infection and rapamycin treatment (Figures 2, 3). In particular, in the transcriptomes of both Mtb-infected DC and Mtb-infected DC treated with rapamycin there was an enrichment in GO terms related to cytokine production, cytokine signaling and innate immune response (Figure 2A). In the GO enrichment profile of the translatome, in addition to innate immune response, biological processes linked to type I interferon (IFN) signaling and defense response to other organisms were found (Figure 2B).
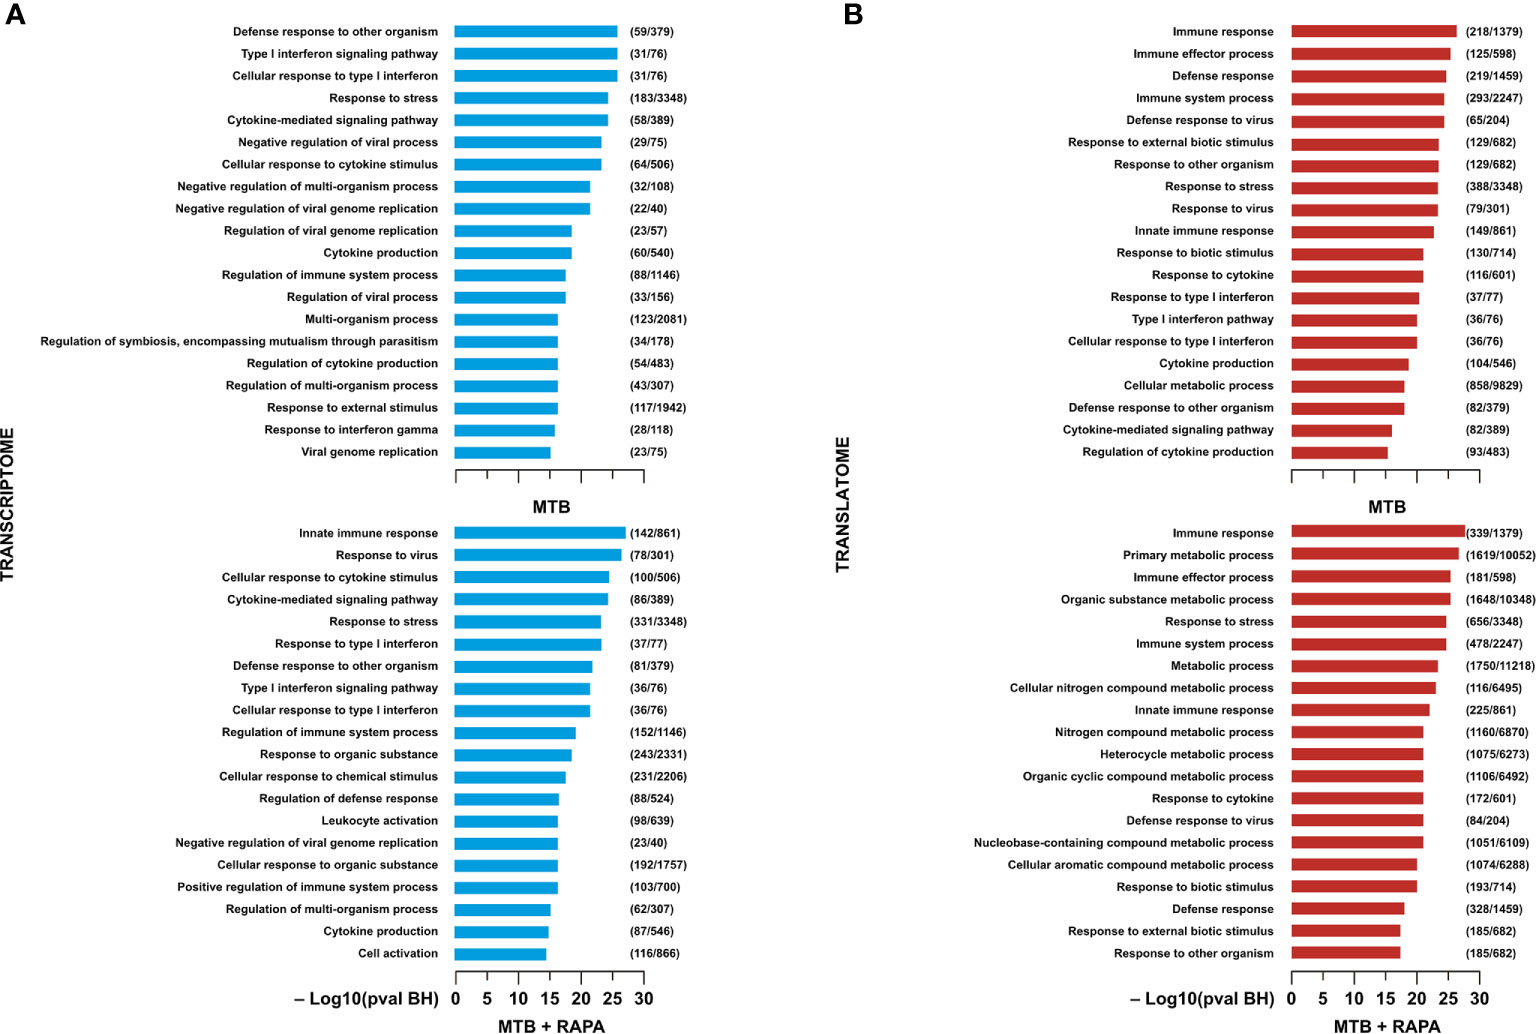
Figure 2 Gene ontology analysis of genes regulated/modulated in transcriptome and in translatome of human DC infected with Mtb alone or in presence of rapamycin. Top 20 gene ontology (GO) terms within the biological process (BP) branch emerged from the list of genes found de-regulated (log2 FC > 1.5; FDR < 0.01) in transcriptome (A) (blue panels) and translatome (B) (red panels) of human DC infected with Mtb (MTB) and treated with rapamycin (MTB+RAPA). Relevant BP have been graphed by using the formula -log10 of their Benjamini-Hochberg false discovery rate adjusted p-values. The numbers next to BP name, represent the total number of genes that may be significantly involved in the corresponding biological processes. The graph displays the classification term enrichment status and term hierarchy.
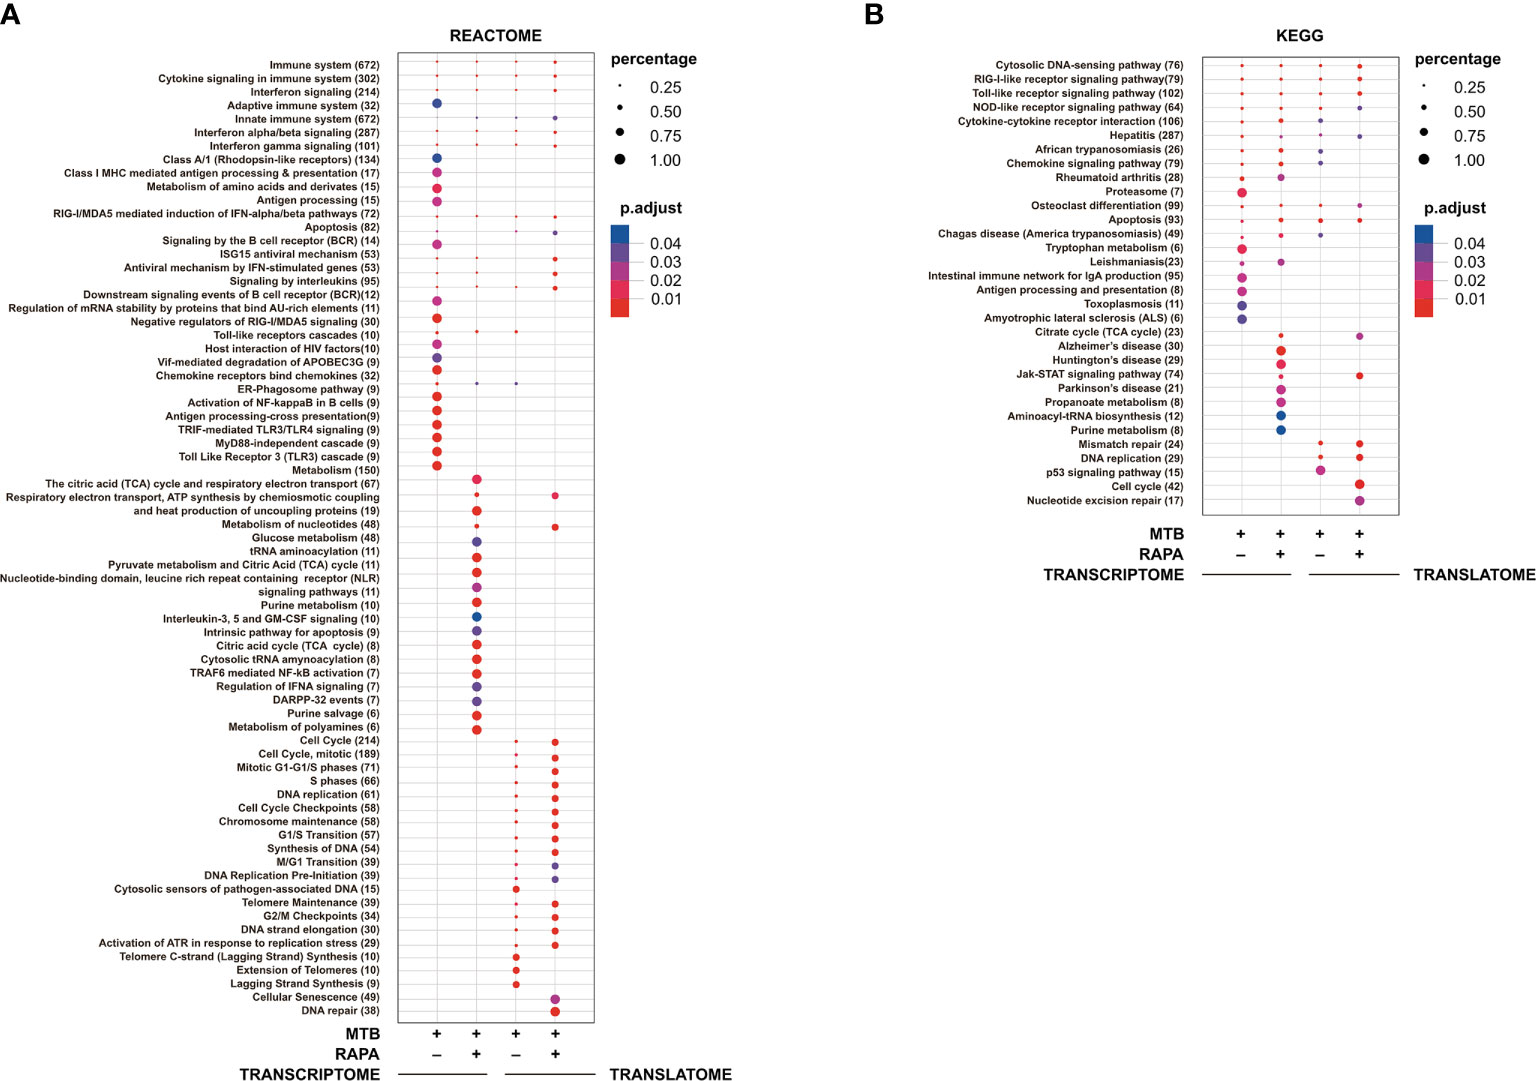
Figure 3 Pathway enrichment analysis of genes modulated in transcriptome and in translatome of human DC infected with Mtb alone or in presence of rapamycin. Pathway enrichment analysis performed using Reactome (A) and KEGG (B) databases on the list of genes found de-regulated (log2 FC > 1.5; FDR < 0.01) in transcriptome and translatome of human DC infected with Mtb and treated with rapamycin. Dot size is correlated with the ratio between the total number of differentially expressed genes and the number of genes that belong to a pathway. Dots are colored according to the Benjamini-Hochberg false discovery rate adjusted p-values (p adjust) from blue (higher p-value) to red (lower p-value).
Pathway enrichment analysis was performed with both Reactome and KEGG databases and, in line with GO study results, the modulation of signaling cascades related to antigen processing and presentation, TLR receptors signaling, cytosolic nucleic acid sensors and cytokine-cytokine receptors was highlighted at transcriptome level for Mtb-infected DC in a rapamycin-independent manner (Figure 3). However, while the transcriptome profile of Mtb-infected DC was enriched for the TRIF-mediated TLR signaling pathway, mostly involved in CREB-binding protein (CBP)/p300 nuclear translocation for anti-inflammatory cytokine production, the profile of infected DC treated with rapamycin pointed to the TRAF6-mediated NF-kB activation, notably involved in the transcription of regulatory and pro-inflammatory cytokines. Interestingly, the analysis of signaling cascades enriched in the translatome of Mtb-infected DC and more pronounced in the presence of rapamycin, revealed modulation of IFN signaling and antiviral mechanism by IFN-stimulated genes. The addition of rapamycin to infected DC impacted, as expected, on different metabolic pathways, and on JAK/STAT signaling at both transcriptome and translatome levels.
Rapamycin Promotes the Association of type I and III IFNs and ISG mRNAs With Polysomes
In silico analysis of translatome-associated DEGs indicated that rapamycin up-regulated anti-microbial factors. Among the top genes up-regulated in the translatome of Mtb-infected DC alone or in presence of rapamycin, type I and III IFNs and several ISGs encoding for chemokines, transcription factors, innate immune receptors and antimicrobial guanylate binding proteins were found. All the above proteins are involved in host protection against microbial injuries (Table 1).
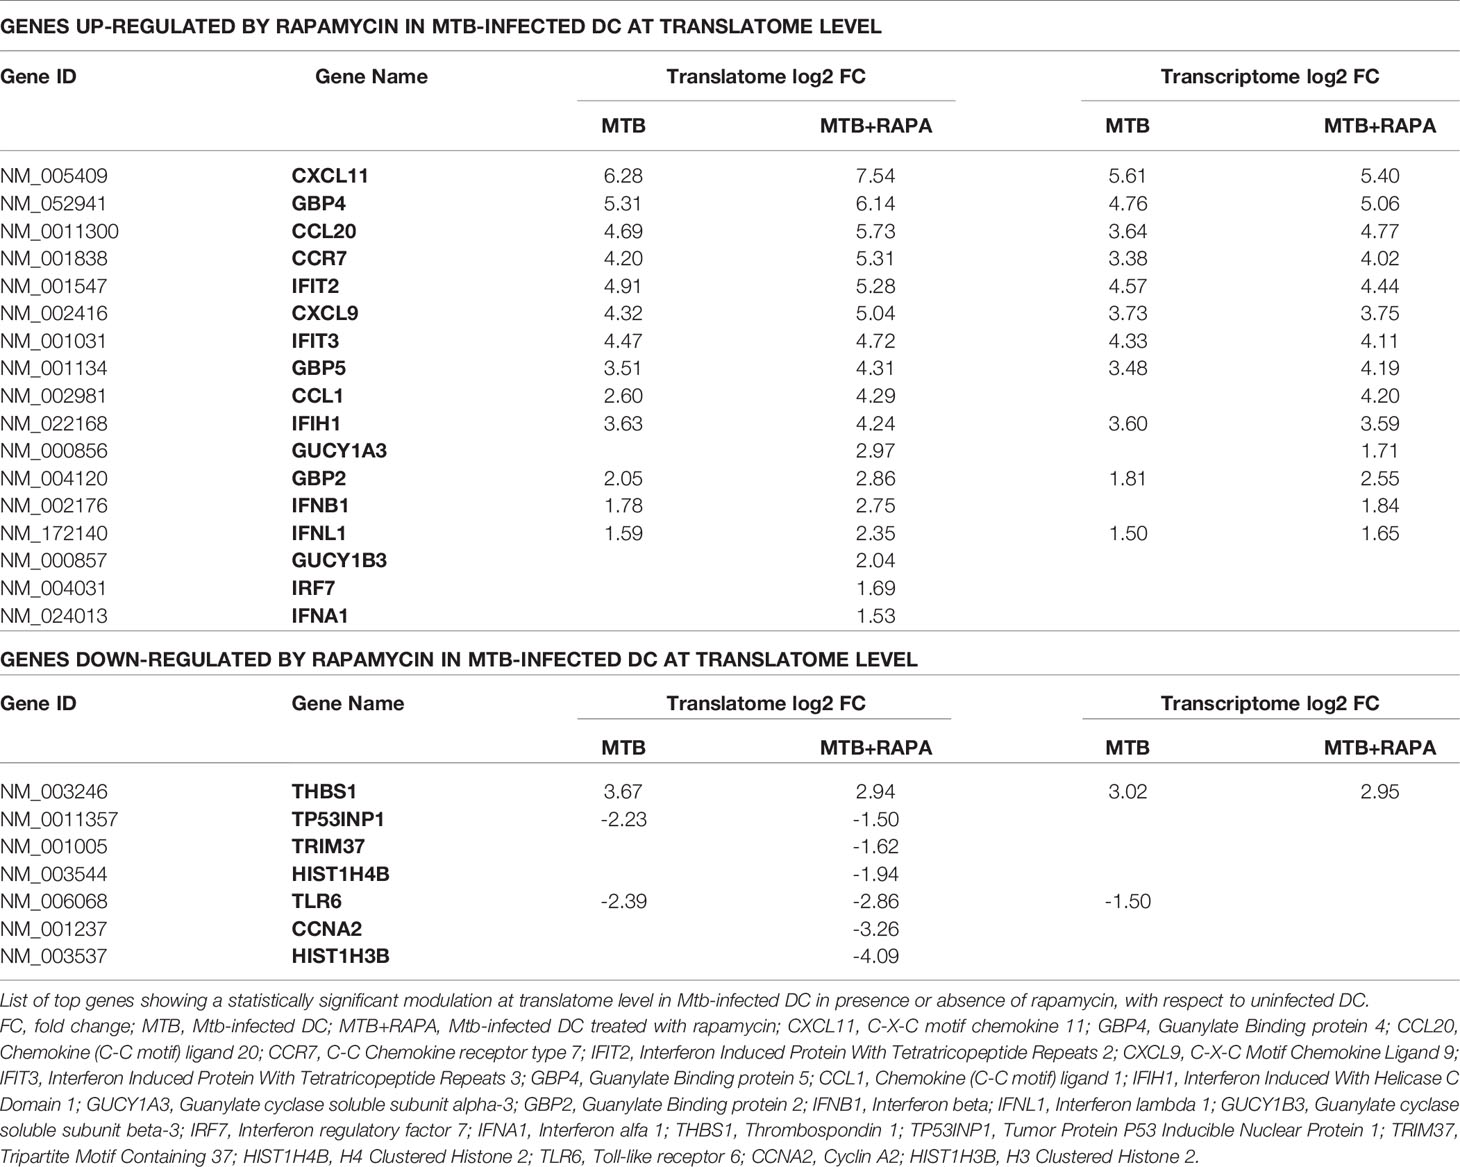
Table 1 List of top genes de-regulated at the translatome level in human DC after Mtb infection and rapamycin treatment.
Considering that the majority of translatome DEGs were also modulated at the transcriptome level (Table 2), to identify mRNAs influenced by rapamycin at the translational level, we determined by quantitative digital PCR the copy number of relevant top genes in total RNA and polysome-associated RNA fraction (heavy) (Figure 4). We found higher levels of IFNB1 and IFNL1 mRNA copies associated to polysomes in Mtb-infected DC in presence of rapamycin, in accordance with the microarray data (Figures 3A and 4A). Some discrepancies with microarray data were instead observed in the number of IFNA1, CXCL9 and CXCL11 mRNA copies detected in the polysome heavy fraction that were reduced upon rapamycin treatment of Mtb-infected DC (Figures 4A, B). Yet, rapamycin weakly and not significantly reduced the level of CXCL9 and CXCL11 (Figure 4B and Supplementary Figure 3).
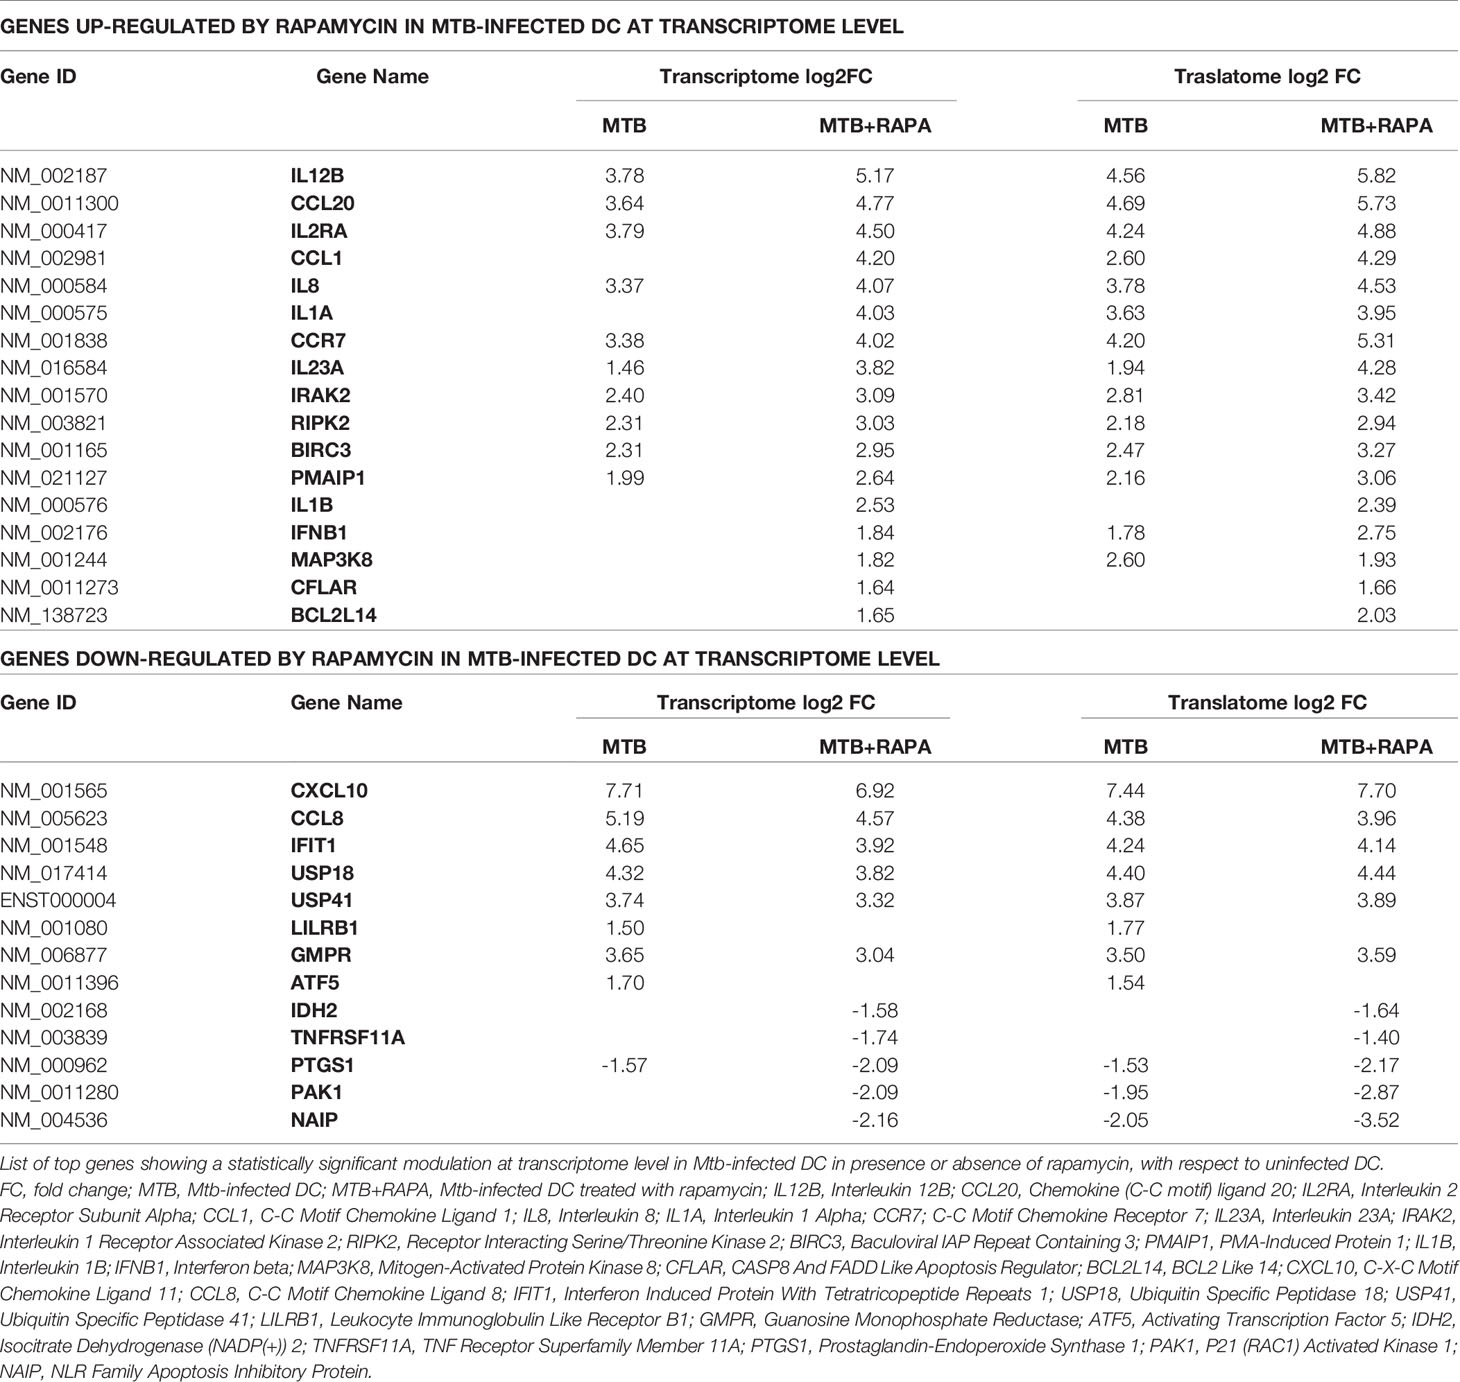
Table 2 List of top genes de-regulated at the transcriptome level in human DC after Mtb infection and rapamycin treatment.
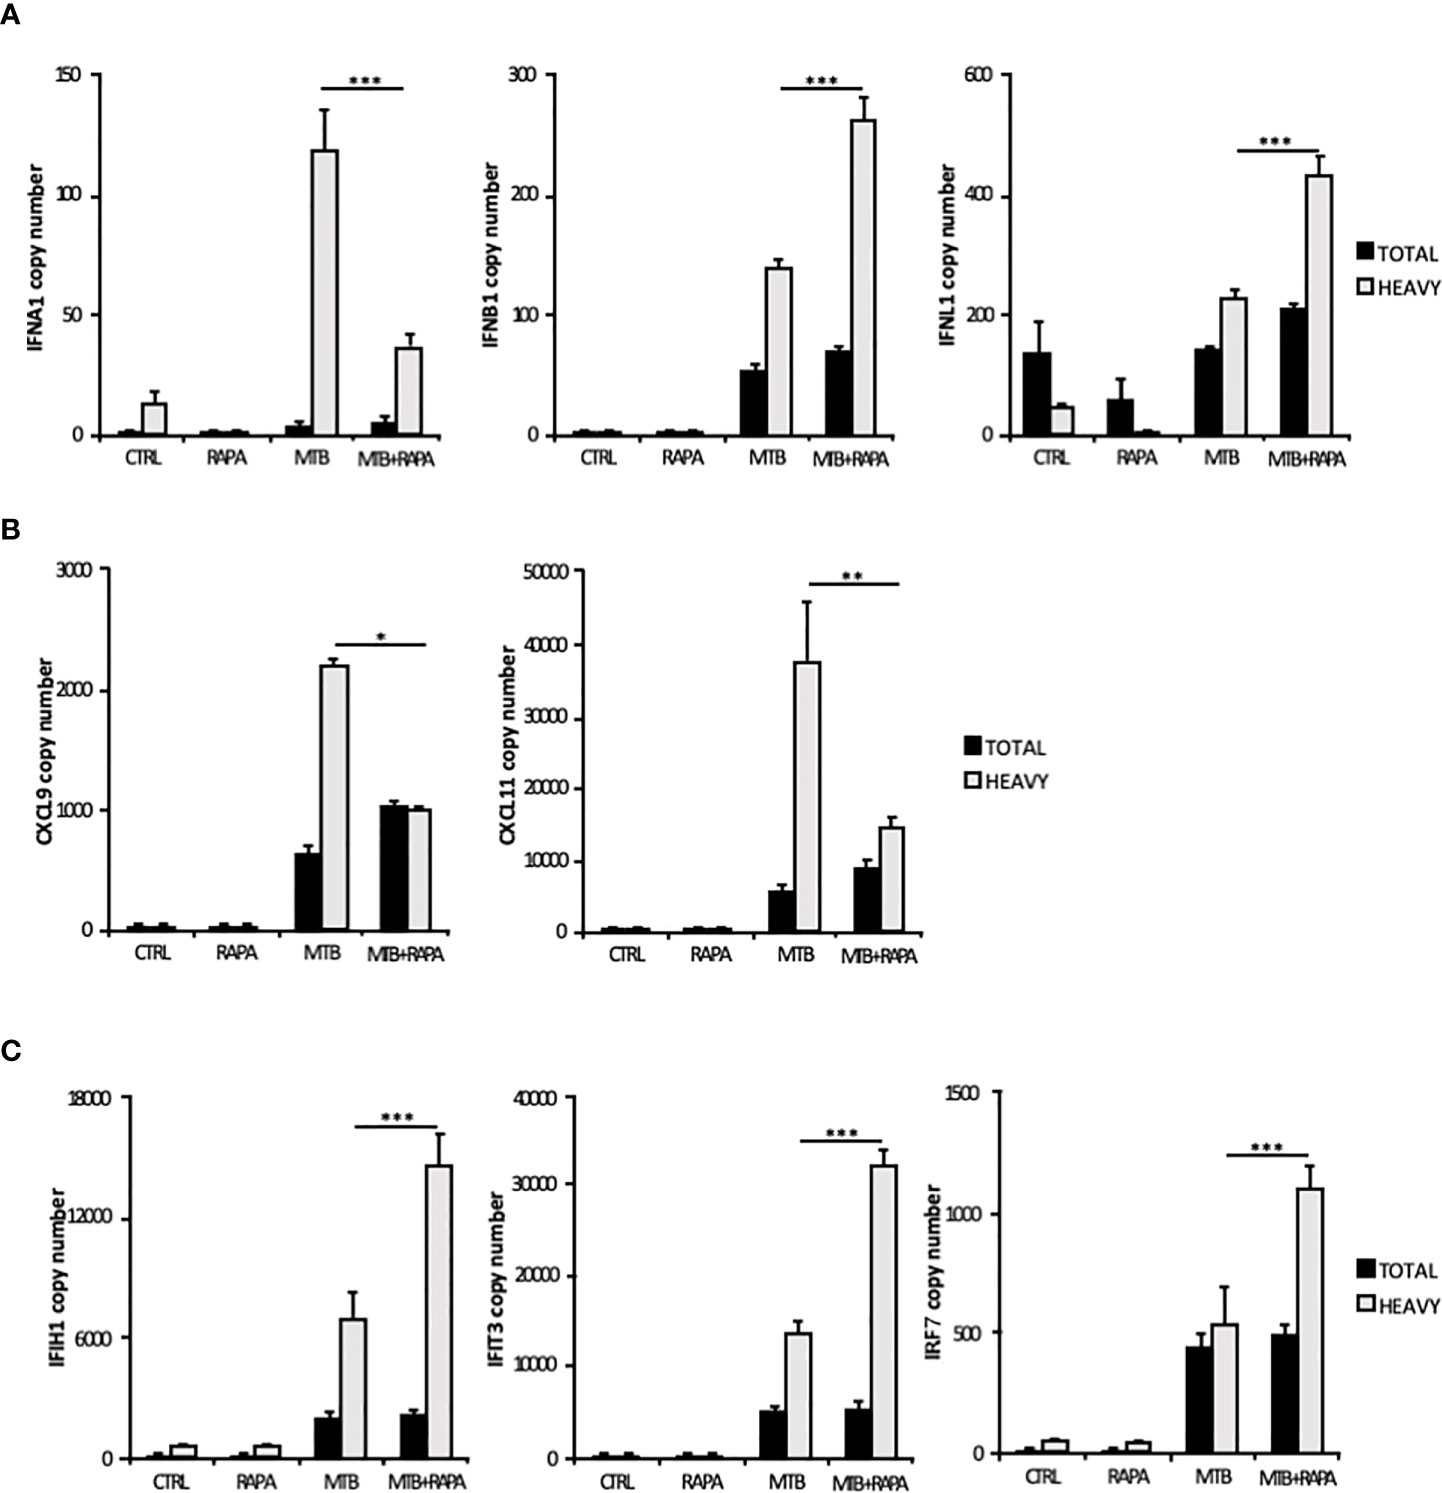
Figure 4 Validation of translatome data on IFNs and IFN-induced gene expression. Total RNA (Total) and high occupancy (Heavy) polysome-associated mRNAs were extracted from untreated DC (CTRL), DC stimulated with rapamycin for 12 h (RAPA) or DC infected for 16 h with Mtb alone (MTB) or in combination with rapamycin (MTB+RAPA, added 4 h after infection). (A) IFNA1, IFNB1 and IFNL1, (B) CXCL9 and CXCL11, (C) IFIH1, IFIT3 and IRF7 copy numbers were determined by digital PCR. Data are represented as the mean copy number per sample ± standard error of 4 experiments performed with RNAs derived from a set of experiments independent than those used in transcriptome/translatome studies and that yielded similar results. Significance was calculated by analysis of variance (ANOVA) followed by multiple comparison performed with Tukey’s test as specified in Materials and Methods section.
Among the ISGs whose expression was promoted by rapamycin during Mtb infection, IFIH1, IFIT3 and IRF7 were validated by digital PCR (Figure 4C). As expected, the levels of IFIH1, IFIT3 and IRF7 mRNAs were induced by Mtb and further enhanced by rapamycin in polysome-associated RNA fraction only.
The Mtb-Driven Pro-Inflammatory/Regulatory DC Phenotype Is Enhanced by Rapamycin
From the in silico analysis of transcriptome data, IL-12B (also known as IL12p40), IL-23A (also known as IL23p19), IL-1A, IL-1B, IL-8, IRAK2, RIPK2 and MAP3K8 were the top genes induced by Mtb and further stimulated by rapamycin. In addition, USP18 - a key negative regulator of type I IFN signaling (21) - was found among genes transcriptionally down-regulated by rapamycin in Mtb-infected DC (Table 2). Validation by qRT-PCR was obtained for USP18 and for IL12p40 and IL23p19 (encoding the IL-23 subunits) (Figure 5A).
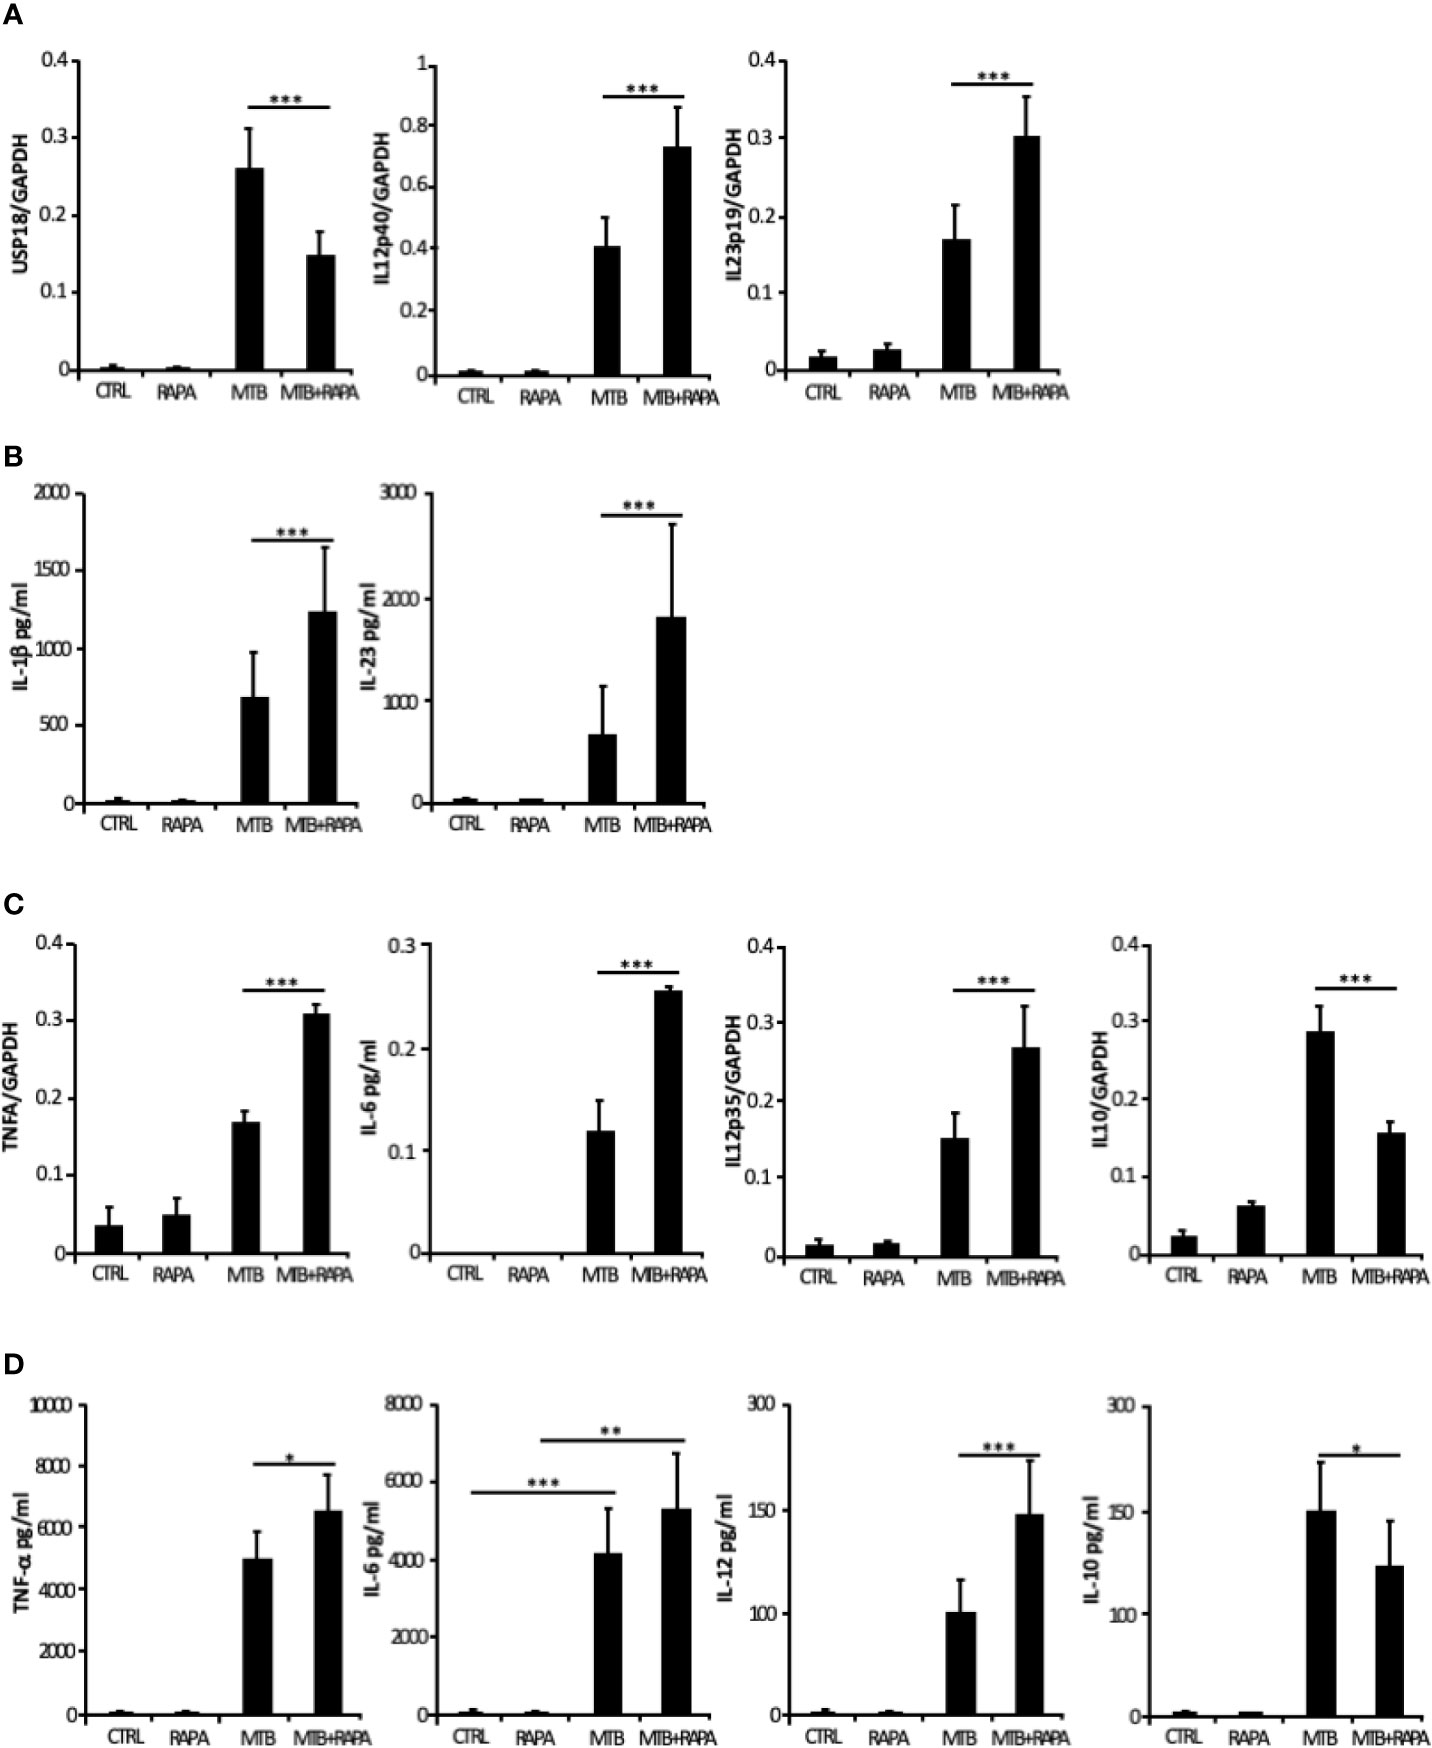
Figure 5 Validation of transcriptome data on cytokine expression and production. Total RNA was extracted from untreated DC (CTRL), DC stimulated for 12 h with rapamycin (RAPA) or infected for 16 h with Mtb alone (MTB) or in combination with rapamycin added 4 h post infection (MTB+RAPA). For protein determination in culture supernatants, DC were left untreated (CTRL) or stimulated for 20 h with rapamycin (RAPA) or infected for 24 h with Mtb alone (MTB) or in combination with rapamycin added 4 h post infection (MTB+RAPA). (A) USP18, IL12p40, and IL23p19 levels were evaluated by quantitative real time PCR. Data are represented as the mean copy number per sample ± standard error of 4 experiments performed with RNAs derived from a set of experiments independent than those used in transcriptome/translatome studies and that yielded similar results. (B) IL-1β production was evaluated by Inflammatory Cytokine bead array kit, while IL-23 release was measured by ELISA. The results represent mean values ± standard error of 8 independent experiments. (C) TNFA, IL6, IL12p35, and IL10 levels were analyzed as described in (A). (D) The secretion of TNF-α, IL-6, IL-12, and IL-10 was quantified by using Inflammatory Cytokine bead array kit. The results represent mean values ± standard error of 8 independent experiments. Significance was calculated by analysis of variance (ANOVA) followed by multiple comparison performed with Tukey’s test as specified in Materials and Methods section.
Consistent with the gene expression results, the release of IL-1β and IL-23 was robustly increased when rapamycin was added to Mtb-infected DC (Figure 5B). Similarly, TNF-α and IL-6 mRNAs were up-regulated upon Mtb infection and further enhanced by rapamycin. Yet, rapamycin significantly promoted TNF-α release, while IL-6 production was not significantly regulated. As expected (9), the expression of IL12p35 subunit and the secretion of IL-12 doubled following rapamycin addition to infected cells (Figures 5C, D). To better define the involvement of mTOR in cytokine regulation during Mtb infection, Torin1, an inhibitor of both mTORC1 and mTORC2, was used. The secretion of IL-12 was not significantly altered when Torin1 was added to infected cells (Figure 6A). Interestingly, the Mtb-induced expression of the anti-inflammatory cytokine IL-10 was reduced by rapamycin and enhanced by Torin1 (Figures 5C, D and Figure 6B). All together these data indicate that Mtb mainly impinges on the balance of pro- and anti-inflammatory cytokines via mTORC1 signaling.
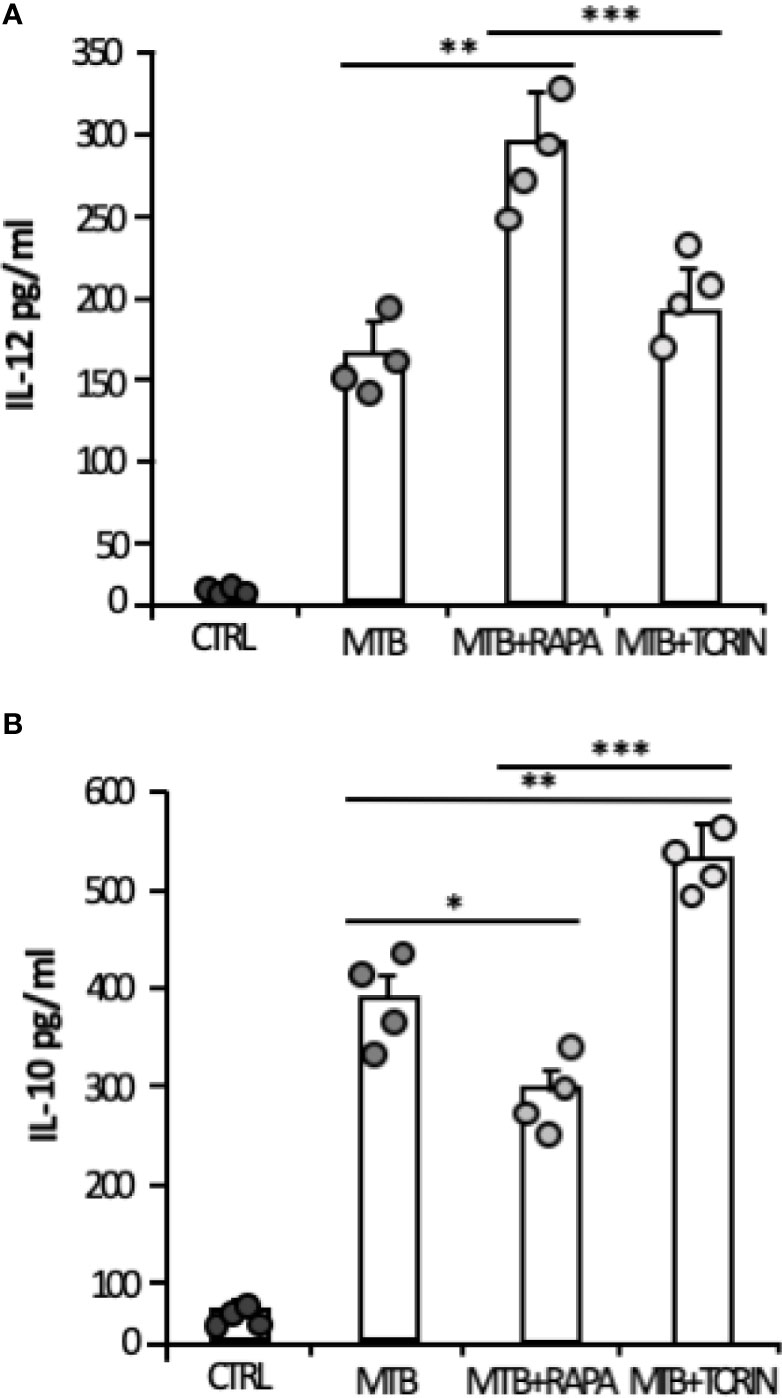
Figure 6 Effect of mTORC1 or mTORC1/mTORC2 inhibition on IL-12 and IL-10 cytokine production in Mtb-infected DC. DC were left untreated (CTRL) or stimulated for 20 h with rapamycin (RAPA) or infected for 24 h with Mtb (MTB) and treated or not with rapamycin (MTB+RAPA, added 4 h post infection) or with Torin1 (MTB+TORIN, added 4 h after infection). Secreted IL-12 (A) and IL-10 (B) were quantified by using Inflammatory Cytokine bead array kit. The results represent mean values ± standard error of 4 independent experiments. Circles represents values obtained, for the specified cytokine, from each single donor/experiment. Significance was calculated by analysis of variance (ANOVA) followed by multiple comparison performed with Tukey’s test as specified in Materials and Methods section.
GSK-3β Behaves as Molecular Switch of Rapamycin-Driven Cytokine Expression During Mtb Infection
Next, we performed a kinetic study to monitor the activation status of the 70 kDa ribosomal S6 kinase 1 (p70S6K), a Ser/Thr kinase and critical effector of the mTOR and the phosphoinositide-3 kinase (PI3K) signaling cascades (Figure 7), whose activation requires a multi-site phosphorylation (22, 23). We measured the level of phosphorylation at S371 and T389. While the level of phosphorylation at S371 was only slightly modulated by Mtb, a two-fold induction in p70S6K-T389 phosphorylation was observed at 4 h post-infection and lasted at least 24 h (Figure 7A). The time-dependent reduction of p70S6K-T389 phosphorylation in control cells was likely due to deprivation of GM-CSF (24) before the infection.
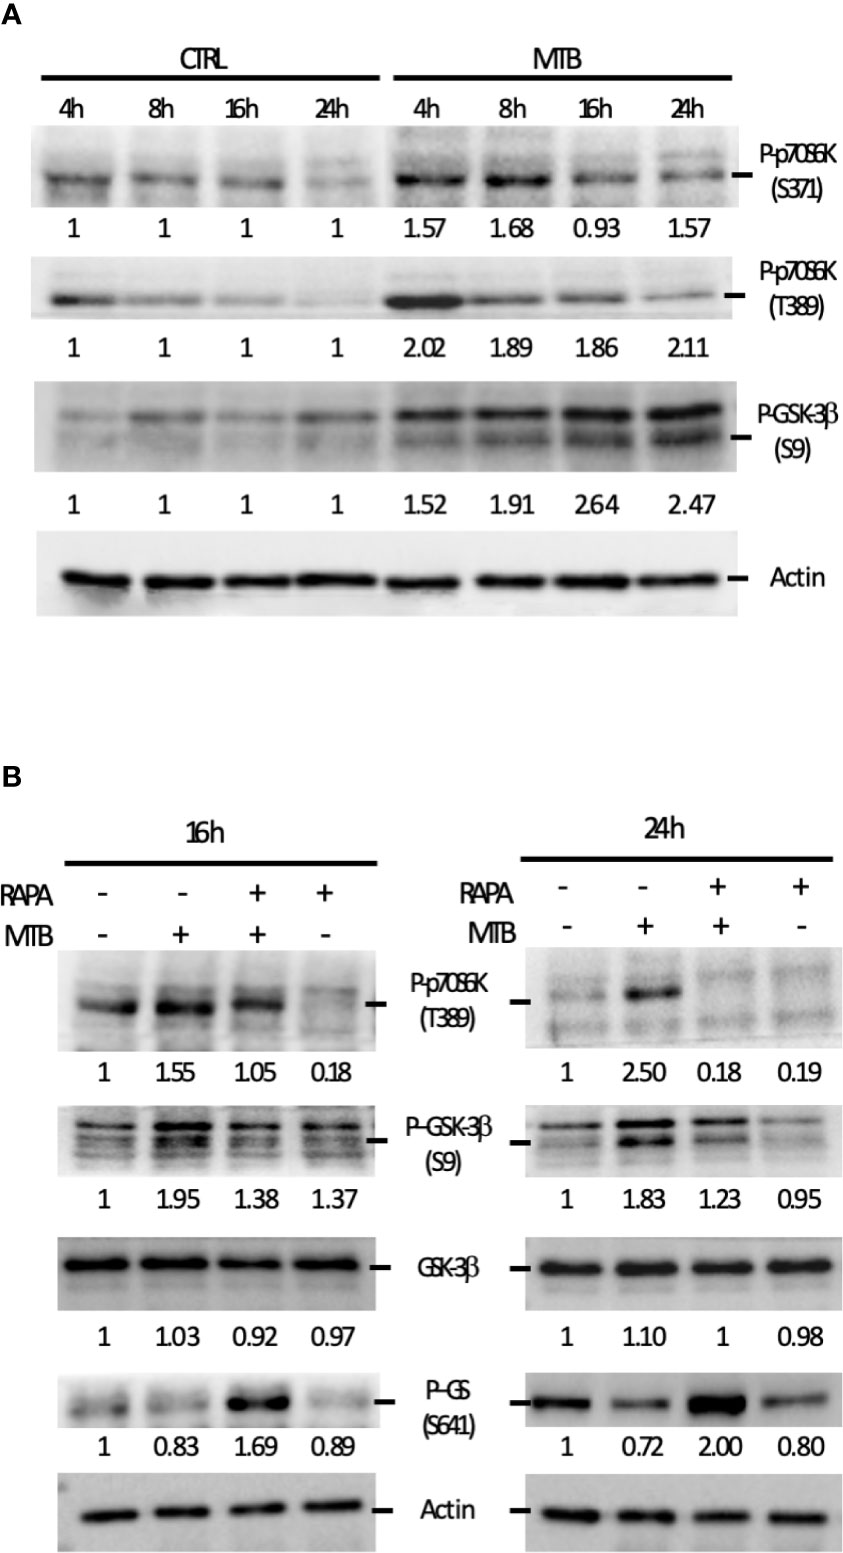
Figure 7 Analysis of the signaling cascades modulated by Mtb alone or in combination with rapamycin and leading to cytokine production. (A) DC were left untreated (CTRL) or infected with Mtb (MTB) in kinetic. Activation of p70S6K and GSK-3β was investigated by western blotting on whole cell extracts. Quantification of the phospho-p70S6K (S371 and T389) and phospho-GSK-3β (S9) bands is shown below each immunoblot. (B) The impact of rapamycin on p70S6K and GSK-3β was investigated at the indicated time points in DC left unstimulated (CTRL) or infected with Mtb alone (MTB) or in presence of rapamycin added 4 h after infection (MTB+RAPA). Quantification of phospho-p70S6K (S371 and T389), total GSK-3β, phospho-GSK-3β (S9) and phospho-GS (S641) is shown below each immunoblot. Actin levels were analyzed to verify protein content. A representative experiment out of 3 experiments that yielded similar results is shown.
These data prompted us to investigate whether the fine modulation of pro- and anti-inflammatory cytokine levels in our experimental model involved GSK-3β, a constitutively active Ser/Thr kinase, which, when phosphorylated at the inhibitory S9 site by p70S6K, undergoes proteasomal degradation (25–27). To address this hypothesis, GSK-3β phosphorylation status was investigated. A gradual increase in the phosphorylation level at S9 site was revealed indicating that, in DC, GSK-3β is rapidly and persistently turned off upon Mtb infection (Figure 7A). Interestingly, phosphorylation of p70S6K at T389 was lowered by the addition of rapamycin in both control and Mtb-infected DC at 16 and 24 h, with a more pronounced effect in infected cells at the latter time point (Figure 7B). Similarly, GSK-3β phosphorylation at S9 site was abrogated by rapamycin, which in turn promoted also the phosphorylation of glycogen synthase (GS), one of the canonical substrates of GSK-3β. All together, these results indicate that rapamycin prevents the inhibition of GSK-3β.
Next, we studied whether the activation of the mitogen-activated protein kinases (MAPK) p44/42 and p38 - well-known regulators of the pro- and anti-inflammatory cytokines during Mtb infection (11, 28, 29) - was influenced by rapamycin in Mtb-infected DC. A kinetic analysis was performed to monitor the phosphorylation/activation status of these proteins (Supplementary Figure 4). An increase in p38 phosphorylation at T180/Y182 was observed as early as 4 h post-infection, while p44/42 activation was unchanged. Rapamycin weakly increased p38 phosphorylation in both control and Mtb-infected DC (Supplementary Figures 4A, B).
The rapamycin effect on the p70S6K/GSK-3β axis was further investigated by analyzing the release of the pro-inflammatory/regulatory cytokines in the presence of a GSK-3β chemical inhibitor, SB216763. In this experimental setting, rapamycin lost its impact on cytokine secretion. In contrast, the inhibition of p70S6K by PF4708671 cooperated with rapamycin in enhancing pro-inflammatory cytokine expression in Mtb-infected DC (Figure 8A and Supplementary Figure 5A).
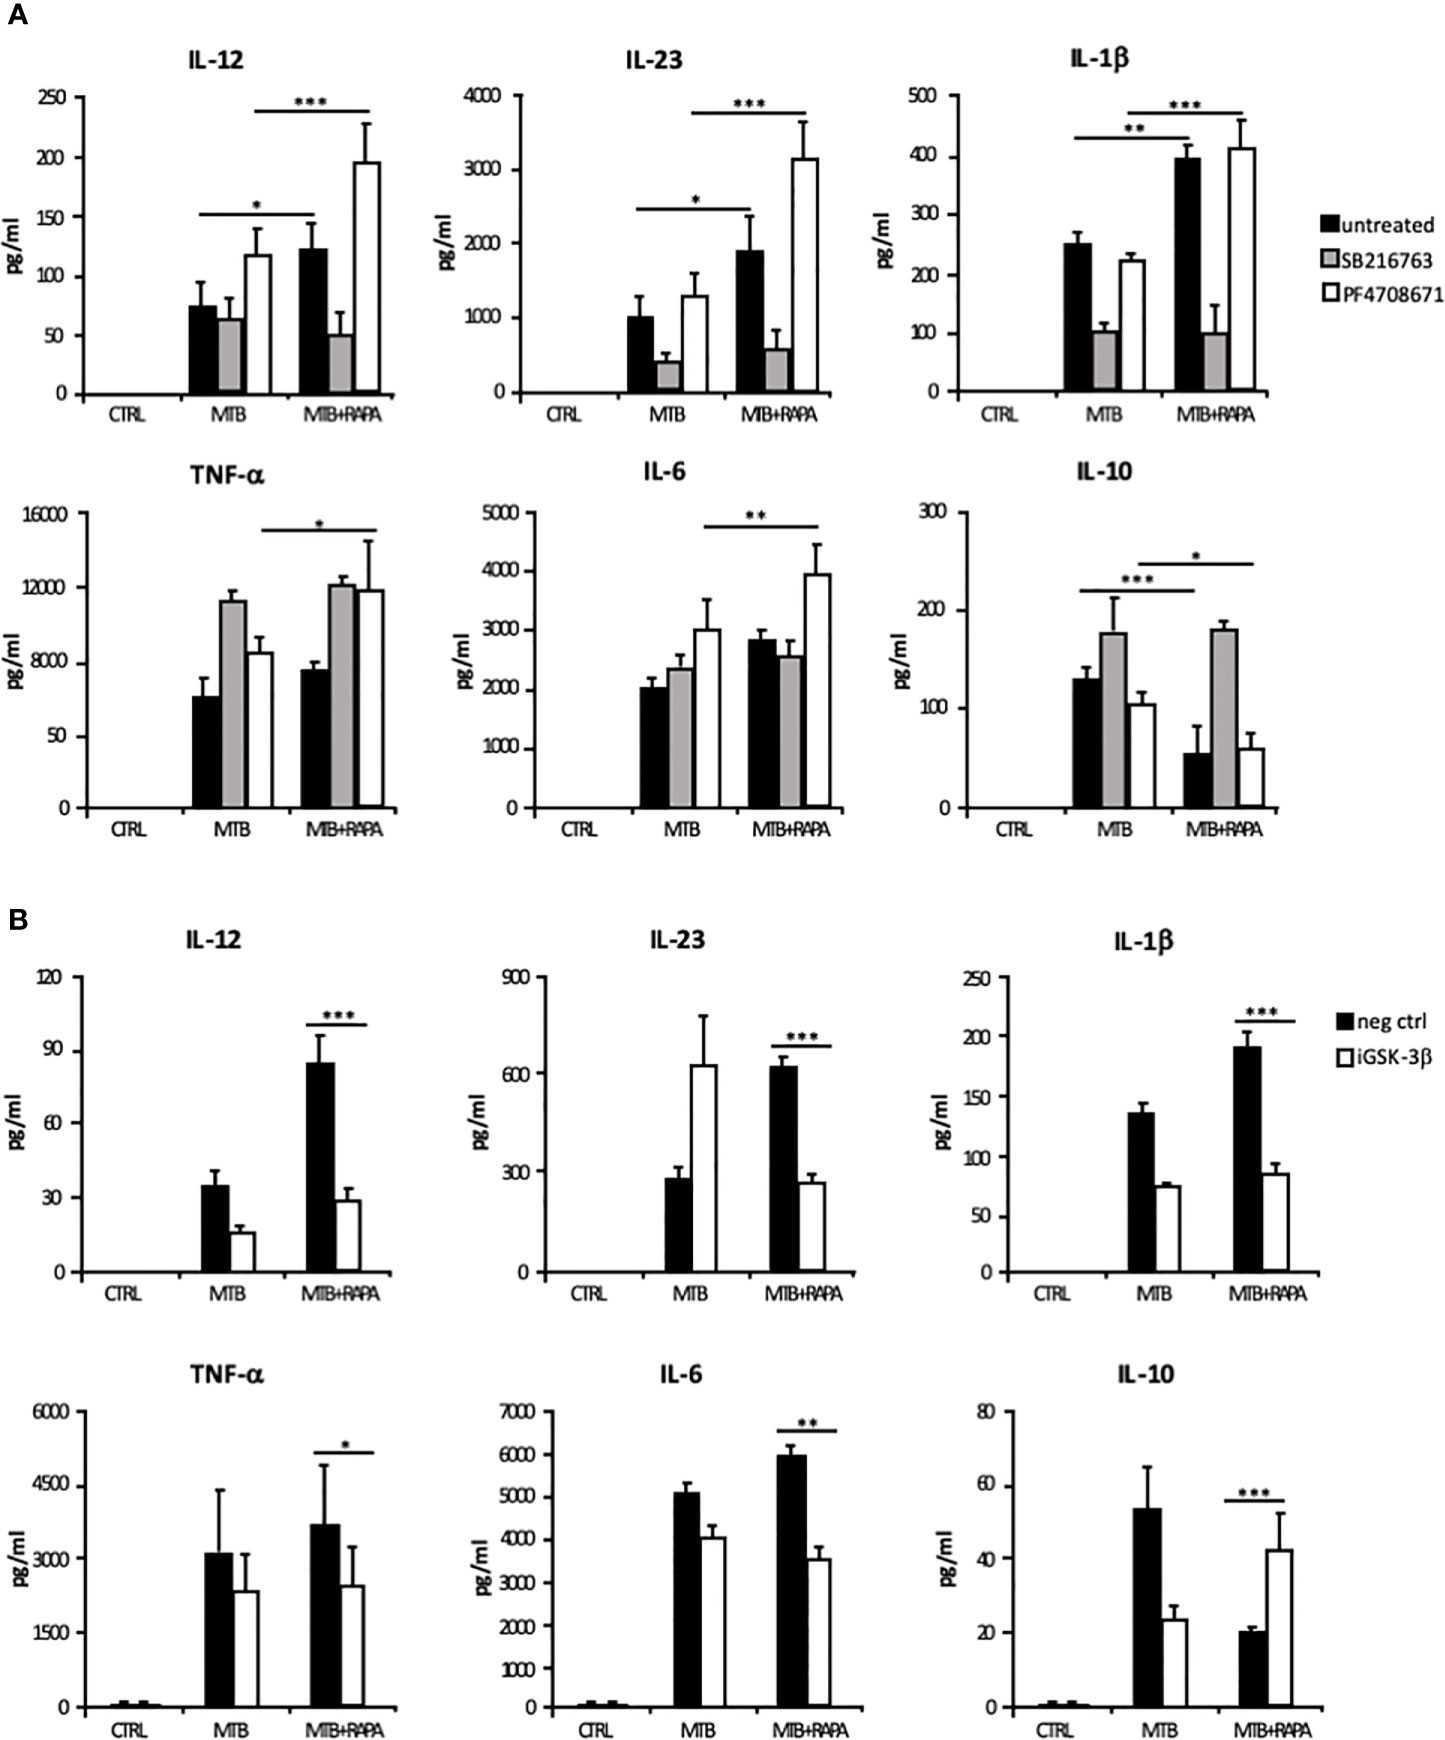
Figure 8 Characterization of GSK-3β and p70S6K involvement in Mtb-mediated cytokine production during rapamycin treatment of human DC. (A) DC were left unstimulated (CTRL) or infected for 24 h with Mtb alone (MTB) or in combination with rapamycin added 4 h post infection (MTB+RAPA), with or without the GSK-3β (SB216763) or the p70S6K (PF4708671) inhibitors. IL-12, IL-1β, TNF-α, IL-6 and IL-10 production was evaluated by Inflammatory Cytokine bead array kit, while IL-23 release was measured by ELISA. (B) DC were transfected with 100 nM of siRNA specific for GSK-3β (iGSK-3β) or with a control siRNA (neg ctrl) for 8 h and then left unstimulated (CTRL) or infected for 24 h with Mtb alone or in combination with rapamycin. Cytokine amount was determined as in (A). The results represent mean values ± standard error of 4 independent experiments. Significance was calculated by analysis of variance (ANOVA) followed by multiple comparison performed with Tukey’s test as specified in Materials and Methods section.
The inhibition of p38 signaling by SB203580 or SB202129 also mitigated the production of IL-12 and IL-10 induced by Mtb alone or in presence of rapamycin. On the other hand, p44/42 inhibition by PD980509 did not affect IL-12 production, but it reduced IL-10 secretion by Mtb-infected DC irrespective of the presence of rapamycin (Supplementary Figure 4C).
The involvement of GSK-3β in the rapamycin effect on cytokine expression was further analyzed by silencing GSK-3β in Mtb-infected DC with a specific siRNA (iGSK-3β) (Figure 8B and Supplementary Figure 5B). DC were also transfected with a non-specific siRNA as negative control (neg ctrl). Upon GSK-3β silencing, the levels of IL-12, IL-23, IL1β, TNF-α and IL-6 were not further enhanced by rapamycin, while the level of IL-10 was increased. As observed for the chemical inhibition (Supplementary Figure 5A), GSK-3β silencing impacted also on IL-12 and IL-10 mRNA levels (Supplementary Figure 5B). Taken together, these results support the view that in Mtb-infected DC rapamycin modulates pro- and anti-inflammatory cytokine production through the regulation of mTOR/GSK-3β axis.
Discussion
For several decades major efforts in TB treatment have focused on the development of antibiotics targeting Mtb. The current regimens for drug-susceptible TB requires the administration of a cocktail of antibiotics for at least 6 months, thus making the cure complicated to administer, lengthy, hepatotoxic and not well tolerated by the patients. These drawbacks lead to poor adherence to the cure, low success rates and, consequently, high risk of development of drug-resistant TB (2, 30). Indeed, recently, the burden of TB disease has been exacerbated by the emergence of rifampicin-resistant, multidrug-resistant and extensively-drug resistant Mtb strains whose treatment requires the administration of second-line drugs for at least 9 months and even up to 20 months (1). In this scenario, the host-directed therapies (HDT) have garnered international interest, moving from the concept that the modulation of host defense contributes to the control and resolution of the infection, overcoming the problem of acquired resistance to pathogen-directed therapies (31). Moreover, HDT can control the antimicrobial resistance by either boosting host-cellular responses or activating innate and adaptive immunity and, thus, immunological memory against the pathogens (32). Therefore, the development of HDT is particularly useful for diseases like TB, where the host immune response can successfully limit infection in the majority of latently infected individuals. In this context, there is growing evidence that HDT, such as those based on autophagy enhancement, could be successfully employed as therapeutics for Mtb treatment (10).
Among autophagy inducers, rapamycin and its analogs (rapalogs) have been shown to possess interesting immunoregulatory properties and their use is of interest to the field (33). However, the precise molecular mechanism by which rapamycin exerts its function has not been fully elucidated. In line with evidences demonstrating a multi-level regulation of immune cell activity, including RNA transcription and stability as well as translation (34, 35), the transcriptome and the translatome profiles were obtained to study in depth the effect of rapamycin in human primary DC infected with Mtb. Our data show for the first time that rapamycin selectively tunes cytokine production in Mtb-infected DC by two mechanisms: i) promoting the association of type I and III IFN mRNAs to polysome chains and, in turn, their translation; ii) preventing the inhibition of GSK-3β to tune pro- and anti-inflammatory cytokine production. In this scenario, mTOR plays a central role in the transcriptional and translational regulation of immune cell function (34, 35). Indeed, mTOR regulates p70S6K1 phosphorylation, which in turn blocks the activity of the eukaryotic translation initiation factor 4E-binding protein 1 (4E-BP1) and promotes mRNA translation. Yet, the contribution of mTOR to phagocytic cell functions during Mtb infection is poorly defined (36, 37). Our translatome analysis of Mtb-infected DC identified, among the rapamycin-induced mRNAs efficiently loaded on polysome, IFNB1 and IFNL1, as well as three ISG - IFIH1, IFIT3 and IRF7 - whose role in Mtb infection was recently described (18, 20, 38).
Interestingly, in addition to activating host DNA sensors, like cyclic GMP-AMP synthase and stimulator of IFN genes (39, 40), Mtb RNA may trigger also through RNA sensing molecules (18, 20, 41, 42). Moreover, few studies reported that Mtb RNA is present in endosome-derived membrane vesicles, is released into macrophage cytosol by means of SecA and ESX-1 secretion systems and stimulates IFN-β production through of retinoic acid-inducible gene (RIG-I), IFIH1, MAVS, protein kinase R (PKR) and IRF7 signaling cascades (18, 20). In this context, we found that the level of USP18 - encoding a factor limiting long-lasting IFN response (21, 43) - was reduced by rapamycin in Mtb-infected DC, further suggesting a link between IFN signaling activation and mTOR inhibition. Collectively, the enhanced polysome loading of the above mentioned ISGs, combined with the reduced expression of USP18, suggested that mTORC1 inhibition by rapamycin promotes an IFN signature in Mtb-infected DC. Thus, in addition to the well-known effect of PI3K-mTOR pathway on IFN signature (44, 45), our data suggest a detrimental mTORC1 effect on ISG induction, and likely a beneficial mTORC2 activity as shown in previous studies (46, 47).
The unexpected role of mTOR in the control of cytokine production in human DC infected with Mtb was further analyzed through a global transcriptome. This study showed that rapamycin likely promotes transcription of a panel of pro-inflammatory/regulatory cytokines including IL-23, TNF-α, IL-1β and IL-6 in addition to IL-12 and inhibits the expression of the anti-inflammatory IL-10. These findings mirror previous data on rapamycin-driven CD4+ T-cell activation and differentiation via IL-12/IL10 release from LPS-stimulated DC (48). Our data were validated by measuring the level of secreted cytokines. In addition to the PI3K/mTOR pathway, it has been shown that the constitutively active kinase GSK-3β contributes to the balance of pro- and anti-inflammatory cytokines in LPS- or Listeria monocytogenes-stimulated APC (25, 37, 49, 50). In particular, the mTOR-dependent inhibition of GSK-3β favors nuclear translocation of CREB and in turn its binding to the coactivator of transcription CBP, while it reduces the amount of NF-kB p65 associated with CBP, thus impacting on the balance of pro- and anti-inflammatory cytokines (25, 26). In line with these evidences, our results indicate that: i) Mtb inactivates GSK-3β by acting on mTOR/p70S6K; ii) rapamycin overturns this block by suppressing the inhibitory phosphorylation of GSK-3β; iii) in Mtb-infected DC, rapamycin promotes the release of pro-inflammatory/regulatory cytokines while it reduces the secretion of IL-10 (Figure 9). The key function of GSK-3β was confirmed by lower levels of secreted IL-12, IL-23 and IL-1β and higher level of IL-10 following silencing or pharmacological inhibition of GSK-3β in Mtb-infected DC.
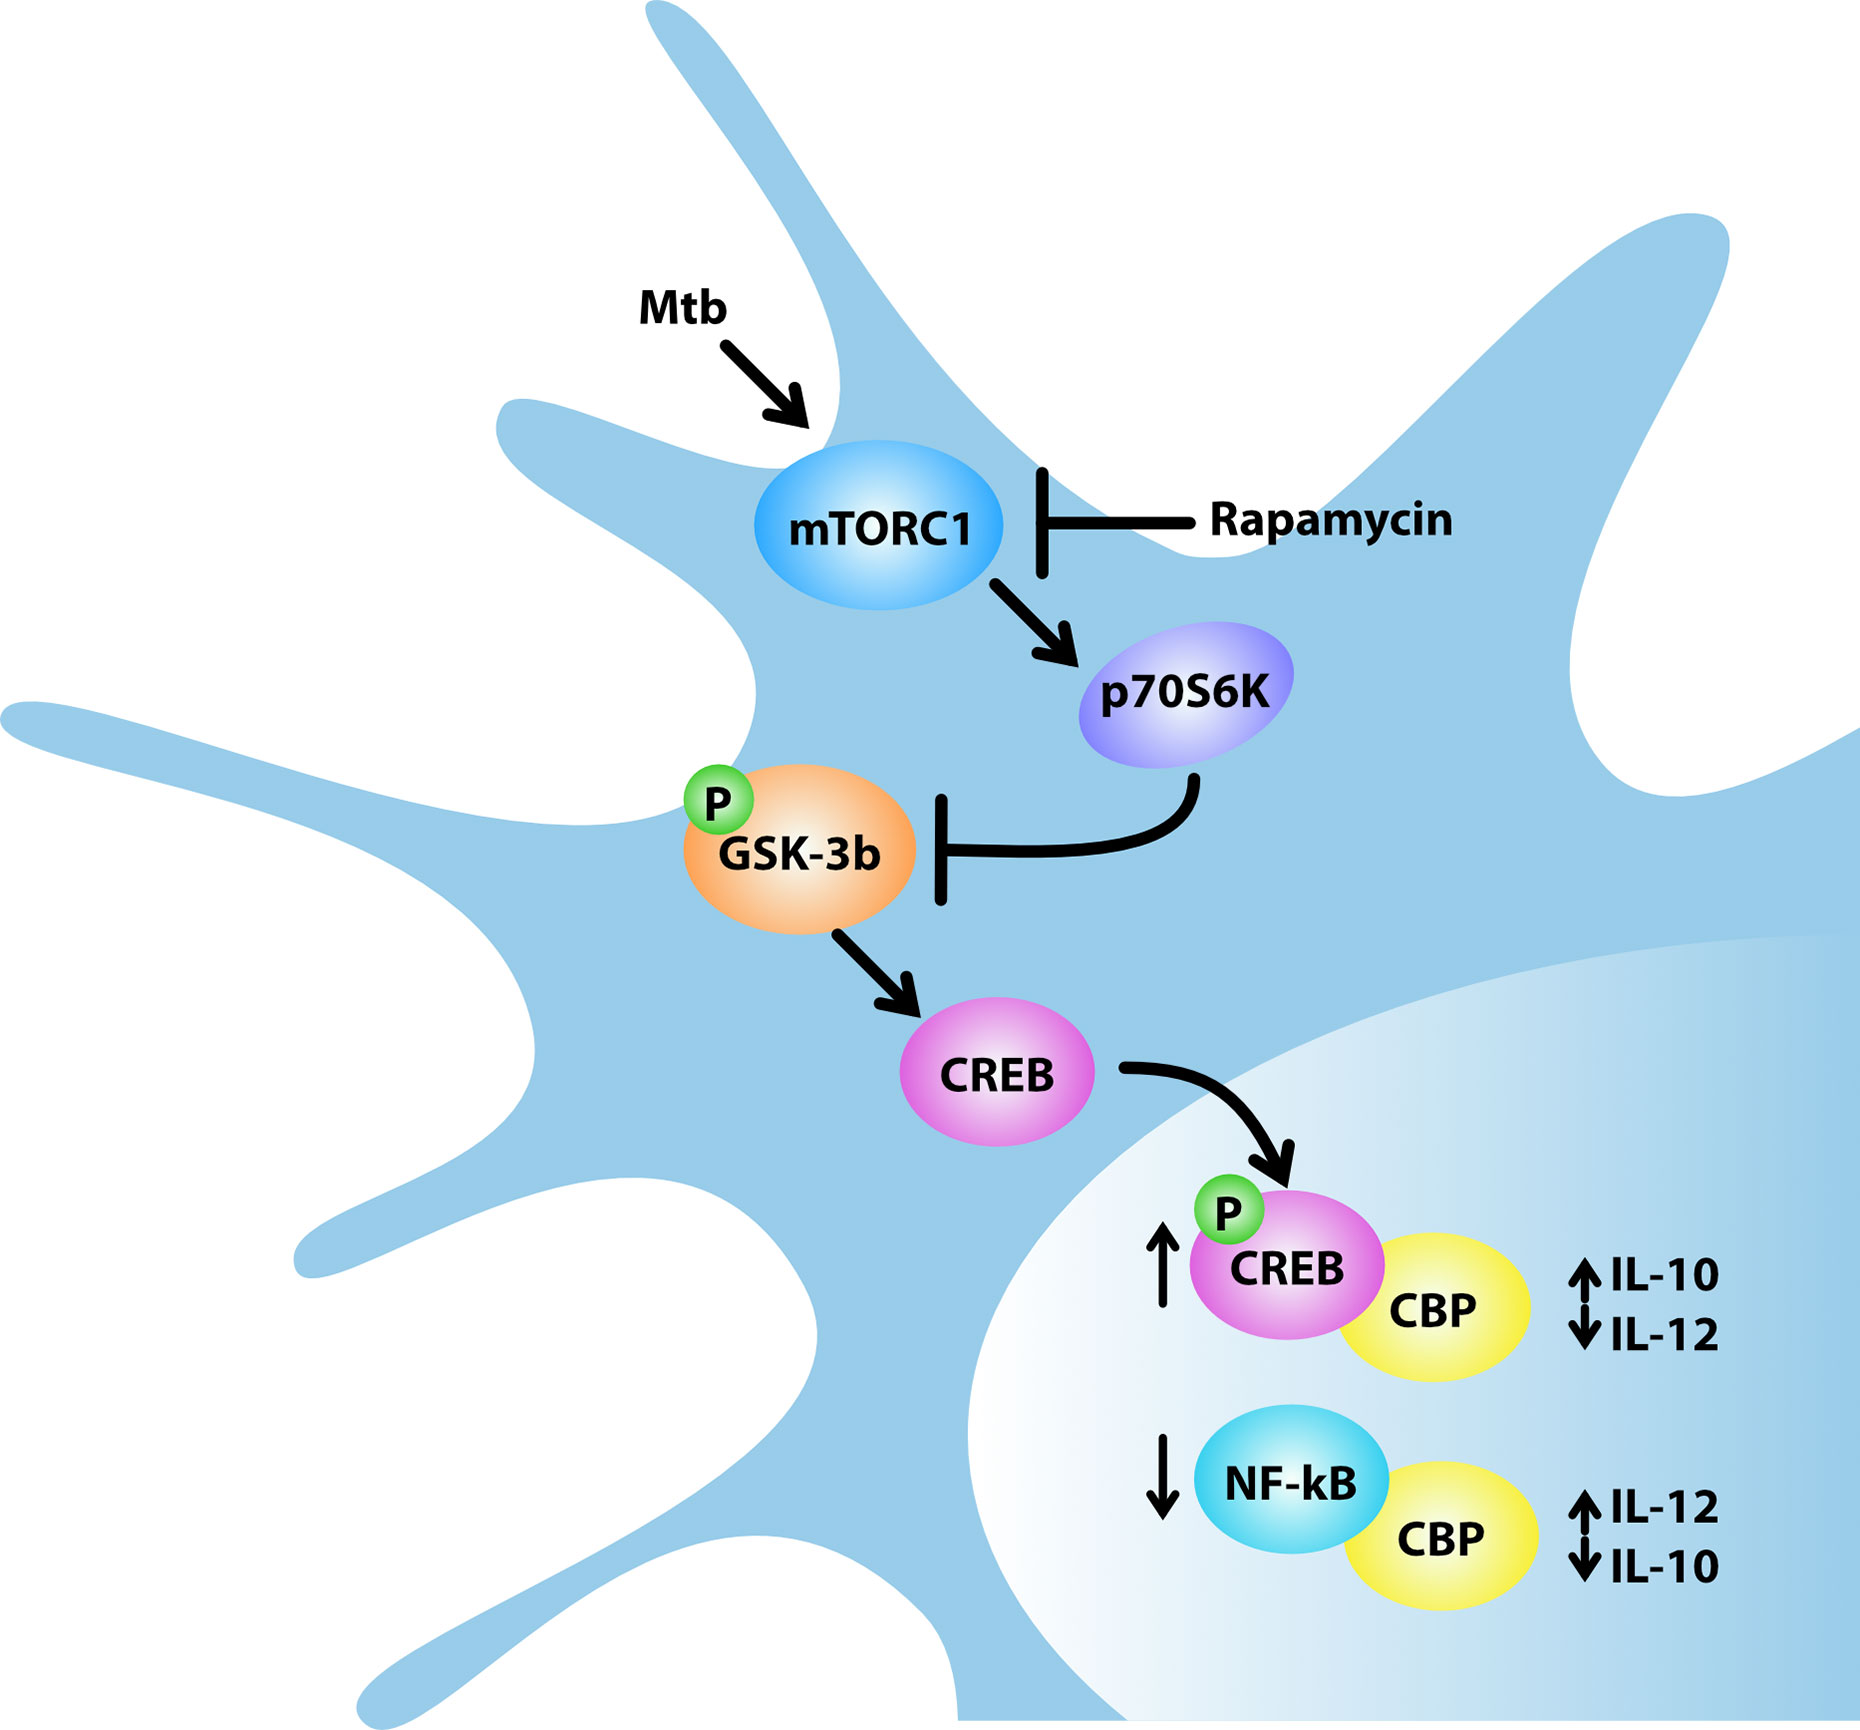
Figure 9 Model for rapamycin-triggered cytokine regulation during Mtb infection. Mtb infection of human DC activates mTORC1/p70S6K axis that phosphorylates and, in turn, inhibits the multifunctional protein kinase GSK-3β. The mTORC1/p70S6K-mediated suppression of GSK-3β favors the nuclear translocation of CREB and in turn its binding to the coactivator of transcription CBP, while it reduces the amount of NF-kB p65 associated with CBP. In Mtb-infected DC, rapamycin, by blocking mTORC1, prevents GSK-3β inhibition thus impinging on IL-12/IL-10 expression and production.
Given the relevance of the IL-12/IL-23 axis in driving the differentiation of CD4+ T-cells towards a protective Th1 phenotype (9, 51–53), our data suggest that GSK-3β may be a potential target for the development of novel HDT to fight Mtb infection. This possibility is relevant also in light of the rapamycin-driven reduction of IL-10, a cytokine detrimental in TB, acting on the stability of TB granuloma, on Mtb persistence into the host,and promoting Mtb evasion from the autophagic machinery (54–56). Consistent with these observations, the use of inhalable particles containing rapamycin in combination with anti-TB drugs may contribute to lung tissue regeneration and, at the same time, to Mtb killing (57). Accordingly, the combined analysis of DC transcriptome and translatome corroborates the exploitation of molecules, such as rapamycin or GSK-3β modulators, as novel HDT to treat TB. Finally, these findings might be relevant for other respiratory infections, including those caused by coronaviruses, where the aerosol delivery of molecules tuning autophagy and mTOR/GSK-3β axis might exert a therapeutic effect.
Data Availability Statement
The data sets presented in this study can be found in online repositories. The names of the repository/repositories and accession number(s) can be found in the article/supplementary material.
Author Contributions
ME participated in experimental design, performed experiments, analyzed data, and prepared the manuscript. MS and VL performed experiments and analyzed data. MP, MCr, FR, EG, GM, OP, and RS performed experiments. ML discussed the data. MCa and RN contributed to data interpretation. SP contributed to data interpretation and manuscript writing. EC participated in experimental design, data analysis, and manuscript writing. All authors contributed to the article and approved the submitted version.
Funding
This work was supported by grant RF-2010-235199 (to EC) from Italian Ministry of Health and grant FILAS-RU-2014-1036 (to EC) from Lazio Region. The funders had no role in study design, data collection and analysis, decision to publish, or preparation of the manuscript.
Conflict of Interest
The authors declare that the research was conducted in the absence of any commercial or financial relationships that could be construed as a potential conflict of interest.
Supplementary Material
The Supplementary Material for this article can be found online at: https://www.frontiersin.org/articles/10.3389/fimmu.2021.649475/full#supplementary-material
References
1. WHO. Global Tuberculosis Report 2020. (2020). Available at: https://apps.who.int/iris/bitstream/handle/10665/336069/9789240013131-eng.pdf.
2. Chai Q, Wang L, Liu CH, Ge B. New insights into the evasion of host innate immunity by Mycobacterium tuberculosis. Cell Mol Immunol (2020) 17(9):901–13. doi: 10.1038/s41423-020-0502-z
3. Pulendran B. The varieties of immunological experience: of pathogens, stress, and dendritic cells. Annu Rev Immunol (2015) 33:563–606. doi: 10.1146/annurev-immunol-020711-075049
4. Liu CH, Liu H, Ge B. Innate immunity in tuberculosis: host defense vs pathogen evasion. Cell Mol Immunol (2017) 14(12):963–75. doi: 10.1038/cmi.2017.88
5. Simeone R, Bobard A, Lippmann J, Bitter W, Majlessi L, Brosch R, et al. Phagosomal rupture by Mycobacterium tuberculosis results in toxicity and host cell death. PLoS Pathog (2012) 8(2):e1002507. doi: 10.1371/journal.ppat.1002507
6. Ramachandra L, Noss E, Boom WH, Harding CV. Processing of Mycobacterium tuberculosis antigen 85B involves intraphagosomal formation of peptide-major histocompatibility complex II complexes and is inhibited by live bacilli that decrease phagosome maturation. J Exp Med (2001) 194(10):1421–32. doi: 10.1084/jem.194.10.1421
7. Saini NK, Baena A, Ng TW, Venkataswamy MM, Kennedy SC, Kunnath-Velayudhan S, et al. Suppression of autophagy and antigen presentation by Mycobacterium tuberculosis PE_PGRS47. Nat Microbiol (2016) 1(9):16133. doi: 10.1038/nmicrobiol.2016.133
8. Etna MP, Sinigaglia A, Grassi A, Giacomini E, Romagnoli A, Pardini M, et al. Mycobacterium tuberculosis-induced miR-155 subverts autophagy by targeting ATG3 in human dendritic cells. PLoS Pathog (2018) 14(1):e1006790. doi: 10.1371/journal.ppat.1006790
9. Romagnoli A, Etna MP, Giacomini E, Pardini M, Remoli ME, Corazzari M, et al. ESX-1 dependent impairment of autophagic flux by Mycobacterium tuberculosis in human dendritic cells. Autophagy (2012) 8(9):1357–70. doi: 10.4161/auto.20881
10. Cerni S, Shafer D, To K, Venketaraman V. Investigating the Role of Everolimus in mTOR Inhibition and Autophagy Promotion as a Potential Host-Directed Therapeutic Target in Mycobacterium tuberculosis Infection. J Clin Med (2019) 8(2):232. doi: 10.3390/jcm8020232
11. Etna MP, Giacomini E, Pardini M, Severa M, Bottai D, Cruciani M, et al. Impact of Mycobacterium tuberculosis RD1-locus on human primary dendritic cell immune functions. Sci Rep (2015) 5:17078. doi: 10.1038/srep17078
12. Irizarry RA, Bolstad BM, Collin F, Cope LM, Hobbs B, Speed TP. Summaries of Affymetrix GeneChip probe level data. Nucleic Acids Res (2003) 31(4):e15. doi: 10.1093/nar/gng015
13. Ashburner M, Ball CA, Blake JA, Botstein D, Butler H, Cherry JM, et al. Gene ontology: tool for the unification of biology. The Gene Ontology Consortium. Nat Genet (2000) 25(1):25–9. doi: 10.1038/75556
14. Ritchie ME, Phipson B, Wu D, Hu Y, Law CW, Shi W, et al. limma powers differential expression analyses for RNA-sequencing and microarray studies. Nucleic Acids Res (2015) 43(7):e47. doi: 10.1093/nar/gkv007
15. Yu G, Wang LG, Han Y, He QY. clusterProfiler: an R package for comparing biological themes among gene clusters. OMICS (2012) 16(5):284–7. doi: 10.1089/omi.2011.0118
16. Kanehisa M, Goto S. KEGG: kyoto encyclopedia of genes and genomes. Nucleic Acids Res (2000) 28(1):27–30. doi: 10.1093/nar/28.1.27
17. Croft D, Mundo AF, Haw R, Milacic M, Weiser J, Wu G, et al. The Reactome pathway knowledgebase. Nucleic Acids Res (2014) 42(Database issue):D472–7. doi: 10.1093/nar/gkt1102
18. Ranjbar S, Haridas V, Nambu A, Jasenosky LD, Sadhukhan S, Ebert TS, et al. Cytoplasmic RNA Sensor Pathways and Nitazoxanide Broadly Inhibit Intracellular Mycobacterium tuberculosis Growth. iScience (2019) 22:299–313. doi: 10.1016/j.isci.2019.11.001
19. Liu XY, Chen W, Wei B, Shan YF, Wang C. IFN-induced TPR protein IFIT3 potentiates antiviral signaling by bridging MAVS and TBK1. J Immunol (2011) 187(5):2559–68. doi: 10.4049/jimmunol.1100963
20. Cheng Y, Schorey JS. Mycobacterium tuberculosis-induced IFN-beta production requires cytosolic DNA and RNA sensing pathways. J Exp Med (2018) 215(11):2919–35. doi: 10.1084/jem.20180508
21. Francois-Newton V, Magno de Freitas Almeida G, Payelle-Brogard B, Monneron D, Pichard-Garcia L, Piehler J, et al. USP18-based negative feedback control is induced by type I and type III interferons and specifically inactivates interferon alpha response. PLoS One (2011) 6(7):e22200. doi: 10.1371/journal.pone.0022200
22. Weng QP, Kozlowski M, Belham C, Zhang A, Comb MJ, Avruch J. Regulation of the p70 S6 kinase by phosphorylation in vivo. Analysis using site-specific anti-phosphopeptide antibodies. J Biol Chem (1998) 273(26):16621–9. doi: 10.1074/jbc.273.26.16621
23. Shin S, Wolgamott L, Yu Y, Blenis J, Yoon SO. Glycogen synthase kinase (GSK)-3 promotes p70 ribosomal protein S6 kinase (p70S6K) activity and cell proliferation. Proc Natl Acad Sci U S A (2011) 108(47):E1204–13. doi: 10.1073/pnas.1110195108
24. Lehman JA, Calvo V, Gomez-Cambronero J. Mechanism of ribosomal p70S6 kinase activation by granulocyte macrophage colony-stimulating factor in neutrophils: cooperation of a MEK-related, THR421/SER424 kinase and a rapamycin-sensitive, m-TOR-related THR389 kinase. J Biol Chem (2003) 278(30):28130–8. doi: 10.1074/jbc.M300376200
25. Wang H, Brown J, Gu Z, Garcia CA, Liang R, Alard P, et al. Convergence of the mammalian target of rapamycin complex 1- and glycogen synthase kinase 3-beta-signaling pathways regulates the innate inflammatory response. J Immunol (2011) 186(9):5217–26. doi: 10.4049/jimmunol.1002513
26. Martin M, Rehani K, Jope RS, Michalek SM. Toll-like receptor-mediated cytokine production is differentially regulated by glycogen synthase kinase 3. Nat Immunol (2005) 6(8):777–84. doi: 10.1038/ni1221
27. Yang D, Li S, Duan X, Ren J, Liang S, Yakoumatos L, et al. TLR4 induced Wnt3a-Dvl3 restrains the intensity of inflammation and protects against endotoxin-driven organ failure through GSK3beta/beta-catenin signaling. Mol Immunol (2020) 118:153–64. doi: 10.1016/j.molimm.2019.12.013
28. Gagliardi MC, Teloni R, Giannoni F, Mariotti S, Remoli ME, Sargentini V, et al. Mycobacteria exploit p38 signaling to affect CD1 expression and lipid antigen presentation by human dendritic cells. Infect Immun (2009) 77(11):4947–52. doi: 10.1128/IAI.00607-09
29. Surewicz K, Aung H, Kanost RA, Jones L, Hejal R, Toossi Z. The differential interaction of p38 MAP kinase and tumor necrosis factor-alpha in human alveolar macrophages and monocytes induced by Mycobacterium tuberculois. Cell Immunol (2004) 228(1):34–41. doi: 10.1016/j.cellimm.2004.03.007
30. Tiberi SdP N, Walzl G, Vjecha MJ, Rao M, Ntoumi F, Mfinanga S, et al. Tuberculosis: progress and advances in development of new drugs, treatment regimens, and host-directed therapies. Lancet Infect Dis (2018) 18(7):E183–98. doi: 10.1016/S1473-3099(18)30110-5
31. Gygli SM, Borrell S, Trauner A, Gagneux S. Antimicrobial resistance in Mycobacterium tuberculosis: mechanistic and evolutionary perspectives. FEMS Microbiol Rev (2017) 41(3):354–73. doi: 10.1093/femsre/fux011
32. Baindara P. Host-directed therapies to combat tuberculosis and associated non-communicable diseases. Microb Pathog (2019) 130:156–68. doi: 10.1016/j.micpath.2019.03.003
33. Jones RG, Pearce EJ. MenTORing Immunity: mTOR Signaling in the Development and Function of Tissue-Resident Immune Cells. Immunity (2017) 46(5):730–42. doi: 10.1016/j.immuni.2017.04.028
34. Snyder JP, Amiel E. Regulation of Dendritic Cell Immune Function and Metabolism by Cellular Nutrient Sensor Mammalian Target of Rapamycin (mTOR). Front Immunol (2018) 9:3145. doi: 10.3389/fimmu.2018.03145
35. Piccirillo CA, Bjur E, Topisirovic I, Sonenberg N, Larsson O. Translational control of immune responses: from transcripts to translatomes. Nat Immunol (2014) 15(6):503–11. doi: 10.1038/ni.2891
36. Paik S, Jo EK. An Interplay Between Autophagy and Immunometabolism for Host Defense Against Mycobacterial Infection. Front Immunol (2020) 11:603951. doi: 10.3389/fimmu.2020.603951
37. Weichhart T, Costantino G, Poglitsch M, Rosner M, Zeyda M, Stuhlmeier KM, et al. The TSC-mTOR signaling pathway regulates the innate inflammatory response. Immunity (2008) 29(4):565–77. doi: 10.1016/j.immuni.2008.08.012
38. Hare NJ, Chan B, Chan E, Kaufman KL, Britton WJ, Saunders BM. Microparticles released from Mycobacterium tuberculosis-infected human macrophages contain increased levels of the type I interferon inducible proteins including ISG15. Proteomics (2015) 15(17):3020–9. doi: 10.1002/pmic.201400610
39. Watson RO, Bell SL, MacDuff DA, Kimmey JM, Diner EJ, Olivas J, et al. The Cytosolic Sensor cGAS Detects Mycobacterium tuberculosis DNA to Induce Type I Interferons and Activate Autophagy. Cell Host Microbe (2015) 17(6):811–9. doi: 10.1016/j.chom.2015.05.004
40. Collins AC, Cai H, Li T, Franco LH, Li XD, Nair VR, et al. Cyclic GMP-AMP Synthase Is an Innate Immune DNA Sensor for Mycobacterium tuberculosis. Cell Host Microbe (2015) 17(6):820–8. doi: 10.1016/j.chom.2015.05.005
41. Choudhary E, Bullen CK, Goel R, Singh AK, Praharaj M, Thakur P, et al. Relative and Quantitative Phosphoproteome Analysis of Macrophages in Response to Infection by Virulent and Avirulent Mycobacteria Reveals a Distinct Role of the Cytosolic RNA Sensor RIG-I in Mycobacterium tuberculosis Pathogenesis. J Proteome Res (2020) 19(6):2316–36. doi: 10.1021/acs.jproteome.9b00895
42. Burkert S, Schumann RR. RNA Sensing of Mycobacterium tuberculosis and Its Impact on TB Vaccination Strategies. Vaccines (Basel) (2020) 8(1):67. doi: 10.3390/vaccines8010067
43. Francois-Newton V, Livingstone M, Payelle-Brogard B, Uze G, Pellegrini S. USP18 establishes the transcriptional and anti-proliferative interferon alpha/beta differential. Biochem J (2012) 446(3):509–16. doi: 10.1042/BJ20120541
44. Livingstone M, Sikstrom K, Robert PA, Uze G, Larsson O, Pellegrini S. Assessment of mTOR-Dependent Translational Regulation of Interferon Stimulated Genes. PLoS One (2015) 10(7):e0133482. doi: 10.1371/journal.pone.0133482
45. Joshi S, Kaur S, Kroczynska B, Platanias LC. Mechanisms of mRNA translation of interferon stimulated genes;. Cytokine (2010) 52(1-2):123–7. doi: 10.1016/j.cyto.2010.03.019
46. Kaur S, Kroczynska B, Sharma B, Sassano A, Arslan AD, Majchrzak-Kita B, et al. Critical roles for Rictor/Sin1 complexes in interferon-dependent gene transcription and generation of antiproliferative responses. J Biol Chem (2014) 289(10):6581–91. doi: 10.1074/jbc.M113.537852
47. Kaur S, Sassano A, Majchrzak-Kita B, Baker DP, Su B, Fish EN, et al. Regulatory effects of mTORC2 complexes in type I IFN signaling and in the generation of IFN responses. Proc Natl Acad Sci U S A (2012) 109(20):7723–8. doi: 10.1073/pnas.1118122109
48. Turnquist HR, Cardinal J, Macedo C, Rosborough BR, Sumpter TL, Geller DA, et al. mTOR and GSK-3 shape the CD4+ T-cell stimulatory and differentiation capacity of myeloid DCs after exposure to LPS. Blood (2010) 115(23):4758–69. doi: 10.1182/blood-2009-10-251488
49. Rodionova E, Conzelmann M, Maraskovsky E, Hess M, Kirsch M, Giese T, et al. GSK-3 mediates differentiation and activation of proinflammatory dendritic cells. Blood (2007) 109(4):1584–92. doi: 10.1182/blood-2006-06-028951
50. Park DW, Kim JS, Chin BR, Baek SH. Resveratrol inhibits inflammation induced by heat-killed Listeria monocytogenes. J Med Food (2012) 15(9):788–94. doi: 10.1089/jmf.2012.2194
51. Etna MP, Giacomini E, Severa M, Coccia EM. Pro- and anti-inflammatory cytokines in tuberculosis: a two-edged sword in TB pathogenesis. Semin Immunol (2014) 26(6):543–51. doi: 10.1016/j.smim.2014.09.011
52. Abebe F. Synergy between Th1 and Th2 responses during Mycobacterium tuberculosis infection: A review of current understanding. Int Rev Immunol (2019) 38(4):172–9. doi: 10.1080/08830185.2019.1632842
53. Lyadova IV, Panteleev AV. Th1 and Th17 Cells in Tuberculosis: Protection, Pathology, and Biomarkers. Mediators Inflamm (2015) 2015:854507. doi: 10.1155/2015/854507
54. O’Leary S, O’Sullivan MP, Keane J. IL-10 blocks phagosome maturation in mycobacterium tuberculosis-infected human macrophages. Am J Respir Cell Mol Biol (2011) 45(1):172–80. doi: 10.1165/rcmb.2010-0319OC
55. Duan L, Yi M, Chen J, Li S, Chen W. Mycobacterium tuberculosis EIS gene inhibits macrophage autophagy through up-regulation of IL-10 by increasing the acetylation of histone H3. Biochem Biophys Res Commun (2016) 473(4):1229–34. doi: 10.1016/j.bbrc.2016.04.045
56. Upadhyay R, Sanchez-Hidalgo A, Wilusz CJ, Lenaerts AJ, Arab J, Yeh J, et al. Host Directed Therapy for Chronic Tuberculosis via Intrapulmonary Delivery of Aerosolized Peptide Inhibitors Targeting the IL-10-STAT3 Pathway. Sci Rep (2018) 8(1):16610. doi: 10.1038/s41598-018-35023-0
Keywords: host-directed therapy, Mycobacterium tuberculosis, tuberculosis, rapalogs, IFN, autophagy, transcriptome, translatome
Citation: Etna MP, Severa M, Licursi V, Pardini M, Cruciani M, Rizzo F, Giacomini E, Macchia G, Palumbo O, Stallone R, Carella M, Livingstone M, Negri R, Pellegrini S and Coccia EM (2021) Genome-Wide Gene Expression Analysis of Mtb-Infected DC Highlights the Rapamycin-Driven Modulation of Regulatory Cytokines via the mTOR/GSK-3β Axis. Front. Immunol. 12:649475. doi: 10.3389/fimmu.2021.649475
Received: 04 January 2021; Accepted: 10 March 2021;
Published: 16 April 2021.
Edited by:
Jere W. McBride, University of Texas Medical Branch at Galveston, United StatesReviewed by:
Carlos Arterio Sorgi, University of São Paulo Ribeirão Preto, BrazilStefan Oehlers, Royal Prince Alfred Hospital, Australia
Copyright © 2021 Etna, Severa, Licursi, Pardini, Cruciani, Rizzo, Giacomini, Macchia, Palumbo, Stallone, Carella, Livingstone, Negri, Pellegrini and Coccia. This is an open-access article distributed under the terms of the Creative Commons Attribution License (CC BY). The use, distribution or reproduction in other forums is permitted, provided the original author(s) and the copyright owner(s) are credited and that the original publication in this journal is cited, in accordance with accepted academic practice. No use, distribution or reproduction is permitted which does not comply with these terms.
*Correspondence: Marilena P. Etna, marilenapaola.etna@iss.it; Eliana M. Coccia, eliana.coccia@iss.it