 Alexandra Franziska Gülich1Teresa Preglej1‡Patricia Hamminger1‡Marlis Alteneder1
 Caroline Tizian1†Maria Jonah Orola1†Sawako Muroi2
 Ichiro Taniuchi2
 Wilfried Ellmeier1*
 Shinya Sakaguchi1*
- 1Division of Immunobiology, Institute of Immunology, Center for Pathophysiology, Infectiology and Immunology, Medical University of Vienna, Vienna, Austria
- 2Laboratory for Transcriptional Regulation, RIKEN Center for Integrative Medical Sciences (IMS), Yokohama, Japan
CD8 expression in T lymphocytes is tightly regulated by the activity of at least six Cd8 enhancers (E8I-E8VI), however their complex developmental stage-, subset-, and lineage-specific interplays are incompletely understood. Here we analyzed ATAC-seq data on the Immunological Genome Project database and identified a similar developmental regulation of chromatin accessibility of a subregion of E8I, designated E8I-core, and of E8VI. Loss of E8I-core led to a similar reduction in CD8 expression in naïve CD8+ T cells and in IELs as observed in E8I−/− mice, demonstrating that we identified the core enhancer region of E8I. While E8VI−/− mice displayed a mild reduction in CD8 expression levels on CD8SP thymocytes and peripheral CD8+ T cells, CD8 levels were further reduced upon combined deletion of E8I-core and E8VI. Moreover, activated E8I-core−/−E8VI−/− CD8+ T cells lost CD8 expression to a greater degree than E8I-core−/− and E8VI−/− CD8+ T cells, suggesting that the combined activity of both enhancers is required for establishment and maintenance of CD8 expression before and after TCR activation. Finally, we observed a severe reduction of CD4 CTLs among the TCRβ+CD4+ IEL population in E8I-core−/− but not E8VI−/− mice. Such a reduction was not observed in Cd8a−/− mice, indicating that E8I-core controls the generation of CD4 CTLs independently of its role in Cd8a gene regulation. Further, the combined deletion of E8I-core and E8VI restored CD4 CTL subsets, suggesting an antagonistic function of E8VI in the generation of CD4 CTLs. Together, our study demonstrates a complex utilization and interplay of E8I-core and E8VI in regulating CD8 expression in cytotoxic lineage T cells and in IELs. Moreover, we revealed a novel E8I-mediated regulatory mechanism controlling the generation of intestinal CD4 CTLs.
Introduction
CD8 plays an important role in the activation of cytotoxic T cells by serving as a coreceptor for MHC class I-restricted T cell receptors via its binding to the invariant α3 domain of MHC class I (1). The expression of the CD8 coreceptor is therefore closely linked with the development and function of the cytotoxic T cell lineage and has to be tightly controlled (2, 3). Whereas, double-positive (DP) thymocytes, CD8 single-positive (SP) and almost all peripheral conventional cytotoxic T cells express CD8 as a heterodimer consisting of the CD8α and CD8β chains (encoded by the closely linked Cd8a and Cd8b1 genes), some subsets of intraepithelial lymphocytes (IELs) in the gut (4, 5) and CD8+ dendritic cells (DCs) (6) express CD8 as a CD8αα homodimer. Moreover, a fraction of activated cytotoxic T cells upregulates Cd8a gene expression, leading to the formation of CD8αα in addition to CD8αβ heterodimers (7). Therefore, both genes are coordinately as well as independently regulated in different cell lineages and T cell subsets. The dynamic and complex pattern of CD8 expression is regulated by at least six Cd8 enhancers, designated E8I to E8VI, located within the Cd8ab gene complex. A series of transgenic reporter gene expression assays as well as the analyses of mice harboring single and combinatorial deletion of Cd8 enhancers revealed developmental stage-, lineage-, and subset-specific activities of these enhancers. Together, these studies revealed a highly complex and partially also synergistic network of cis-regulatory elements driving CD8 expression (8–10).
Among the Cd8 enhancers identified, E8I is the most intensively studied enhancer. E8I directs expression in cytotoxic lineage cells (i.e., mature CD8 SP thymocytes and cytotoxic T cells) as well as in CD8αα+ and CD8αβ+ IELs in the gut (11, 12). In line with its enhancer activity in IELs, the analysis of E8I−/− mice revealed a severe reduction in CD8αα expression on E8I−/− IELs, particularly in CD8αα+TCRγδ+ IELs (13, 14). In contrast, there is normal CD8 expression in E8I−/− cytotoxic lineage cells, except of a mild reduction of CD8 expression in mature CD8SP thymocytes, suggesting compensatory mechanisms by other Cd8 enhancer(s) (13, 14). Subsequent studies revealed additional important roles for E8I in the regulation of CD8 expression and hence also in the control of T cell effector function. It was shown that cytotoxic T cells start to express CD8αα homodimers on their surface (in addition to CD8αβ heterodimer) upon viral and bacterial infection (7, 15–17). The upregulation of Cd8a gene expression leading to CD8αα homodimer formation, which was postulated to be required for the generation of memory cytotoxic T cells, is largely mediated by E8I (7, 15). Moreover, we demonstrated that E8I is required for the maintenance of Cd8a expression during T cell activation, in part by epigenetic programing of the Cd8ab gene complex and via Runx3 recruitment, since activated E8I−/− cytotoxic T cells downmodulate CD8 expression, leading to impaired effector function (18). In addition to its important role in CD8 lineage T cells, E8I functions unexpectedly also in CD4 lineage T cells. While conventional CD4+ T cells express high levels of ThPOK and low levels of Runx3 (3, 10), a fraction of intestinal intraepithelial CD4+ helper T cells displays a ThPOKloRunx3hi transcription factor expression pattern. This is accompanied with the upregulation of cytotoxic features, such as the expression of CD8αα homodimers, Granzyme B, CD103 and 2B4 proteins (19, 20). It was shown that the induction of CD8αα expression in these CD4 CTLs is largely dependent on the activity of E8I (20). Further, CD4+ T cells lacking HDAC1 and HDAC2 upregulate several cytotoxic features including CD8, and the upregulation of CD8 is also dependent on E8I (21). Thus, while CD8 expression is largely dependent on E8I in activated/effector T cells as well as in IELs, the Cd8 enhancers essential for CD8 expression in naïve CD8+ T cells and/or that compensate for loss of E8I have not been identified. Moreover, E8I-deficient mice harbor a deletion of a 7.6 kb genomic region (13, 14) and it is not known whether the various activities of E8I in CD8+ T cells as well as in CD4 CTLs reside within the same regions of the larger genomic fragment.
In this study we revisited the Cd8ab1 gene complex and analyzed publically available ATAC-seq data on the Immunological Genome Project (ImmGen) database (22). This revealed a similar developmental regulation and opening of chromatin accessibility in mature CD8+ T cells of a subregion within E8I (designated E8I-core) and of Cd8 enhancer E8VI, which displays also enhancer activity in mature cytotoxic T cells (23). Transgenic reporter gene expression assays with a 554bp fragment containing E8I-core demonstrated a similar enhancer activity as shown for the large genomic E8I fragment. To test the potential interplay between E8I-core and E8VI, we generated E8I-core, E8VI, and E8I-core/E8VI-doubly-deficient mice. Our data revealed that E8I-core−/− mice “phenocopied” the alterations in CD8 expression in the cytotoxic lineage and in intestinal IELs as observed in E8I−/− mice, while activated E8I-core-deficient CD8+ T cells maintained CD8 expression to a greater extent than E8I-deficient CD8+ T cells. This suggests the existence of an additional regulatory element in addition to E8I-core that functions in activated CD8+ T cells within E8I. E8VI−/− mice displayed a mild reduction in CD8 expression levels on CD8SP thymocytes and peripheral CD8+ T cells, while CD8α expression levels in IELs remained unchanged in the absence of E8VI. Compared to single E8I-core and E8VI mutant mice, the combined deletion of both E8I-core and E8VI led to a further reduction of CD8 expression in cytotoxic lineage cells. Moreover, anti-CD3/CD28-stimulated E8I-core−/−E8VI−/− CD8+ T cells down-modulated CD8 expression to a greater degree than E8I-core−/− and E8VI−/− CD8+ T cells, suggesting that the combined activity of both enhancers is required for establishment and maintenance of CD8 expression before and after TCR activation. Finally, E8I-core−/− but not E8VI−/− TCRβ+CD8β−CD4+ IELs displayed a severe reduction in the percentages of the ThPOKloRunx3hi subset, characteristic for cytotoxic CD4+ T cells (CD4 CTLs). Such a reduction was not seen in Cd8a−/− mice, indicating that E8I-core controls the generation of CD4 CTLs, independently of its role in Cd8a gene regulation. Of note, the combined deletion of both E8I-core and E8VI led to the appearance of CD4 CTLs with a similar frequency as observed in WT mice, suggesting an antagonistic interplay between E8I-core and E8VI in the generation of CD4 CTLs. Together, our study genetically demonstrates that CD8 expression in cytotoxic lineage T cells and IELs is directed by a complex utilization and interplay of E8I-core and E8VI. Moreover, our data indicate a novel role for E8I in regulating the differentiation of CD4 CTLs in the gut.
Materials and Methods
Mice
ECR-8 transgenic mice were generated at the Japan SLC, Inc. (Hamamatsu-shi, Shizuoka, Japan), and E8I-core−/−, E8VI−/−, and E8I-core−/−E8VI−/− were generated at the Animal Facility Group at the RIKEN IMS (Yokohama, Japan). E8I−/− (13), Cd8a−/− (24), E8I-Cre (25), Rosa26-stop-YFP reporter (26) mice have been described previously. Mice used for experiments were 6–10 weeks old and were maintained in the preclinical research facility of the Medical University of Vienna and in the animal facility of the RIKEN IMS. Animal husbandry and experimentation was performed under the national laws (Federal Ministry for Science and Research, Vienna, Austria) and ethics committees of the Medical University of Vienna and according to the guidelines of FELASA, which match that of ARRIVE. Animal husbandry and experimentation at the RIKEN IMS was approved by IACUC of RIKEN Yokohama Branch.
Generation of Transgenic Mice
The basic Cd8a promoter-human CD2 (hCD2) reporter construct was previously described (11). The E8I-core fragment was amplified by PCR, and subcloned into EcoRI and HindIII sites upstream of the Cd8a promoter. The following primers were used for PCR (the EcoRI site was added for cloning purposes, whereas the HindIII site was encoded in endogenous Cd8ab gene complexes. These restriction sites are underlined): E8Icore-F: 5′- TAGAATTCGGCTACCTCTGTCTCCC-3′ and E8Icore-R: 5′- TATGGATCCAAGCTTGTGAATGGACCACTGAG-3′. Eggs from C57BL/6 mice were injected with the transgenic construct according to standard procedures. Transgenic founders were identified by PCR and either analyzed or backcrossed onto the C57BL/6 background. A total of 11 founders were generated, of which 5 expressed the hCD2 reporter gene. Transgenic lines #1 and #2 were generated from two founders (founders 1–3 and 1–1, respectively).
Generation of Cd8 Enhancer-Deficient Mice
pBluescript (pBS: Startagene) plasmids harboring various genomic fragments from the murine Cd8a and Cd8b1 loci (11) were used as template for PCR amplifications during the construction of the targeting vector. E8I-core region (to which a loxP site was added at the 5′ end) and part of the long arm were PCR amplified, and were ligated using an additionally generated EcoRI site. A 5.6 kb BamHI/FspI fragment was cut out from pWE216 plasmid harboring E8I and surrounding genomic regions (unpublished), and was inserted upstream of the aforementioned DNA sequence. The short arm (to which XhoI and KpnI/XbaI sites were added at the 5′ and 3′ end, respectively) was PCR amplified, and was ligated into the XhoI and XbaI sites of pL2Neo2 plasmid containing the neomycin resistance gene cassette (Neor) flanked by two loxP sites (floxed) (27). Finally, a BamHI/SalI fragment (harboring the long arm, a loxP site and the E8I-core region) and a SalI/KpnI fragment (harboring the floxed Neor and the short arm) were inserted into pBS by tri-molecular ligation. The targeting vector was linearized by SacII digestion and was transfected into the M1 ES cell line as previously described (28). Homologous recombination in ES cells was screened by PCR with primers indicated in Figure S2. The aggregation of ES cell clone was performed as previously described (28). Subsequently, mice with the targeted allele were bred with CMV-Cre transgenic mice to delete the Neor. The genotyping of E8I-core−/− mice was carried out by PCR using the following three primers: E8I-Lox5: 5′-TTCCCATGAGGAACAGAGCTGG-3′, E8I-core F1: 5′-GACCTGACTTAACCTATGAGTGG-3′ and E8I-D3-3: 5′-CCATACTCAGCTTCTGACTCTCTGGC-3′ (the wild-type allele: 214 bp, the deleted allele: 301 bp). E8VI−/− and E8I-core−/−E8VI−/− mice were generated using the CRISPR/Cas9 system. Cas9 mRNA and the following guide RNAs were injected into the cytoplasm of C57BL/6 as well as E8I-core−/− fertilized eggs as previously described (29): E8VI-gRNA-5: 5'-CAGCCCUGAGCUGACAUUCAUGG-3′ and E8VI-gRNA-3: 5′-UCUGAGUUUAAGCAGCAGUGUGG-3′. Resultant offspring were screened by PCR using the following primers: E8VI-F: 5′-CCATCAGGTACTTGGGAATGCTCAG-3′ and E8VI-R: 5′-CACAAAGTAGATCACAGGATATGGG-3′, and the successful deletion of E8VI was confirmed by sequencing. Mice carrying the desired mutation were bred with C57BL/6 mice to confirm germline transmission, and were subsequently intercrossed to obtain E8VI−/− and E8I-core−/−E8VI−/− mice. The genotyping PCR was performed using E8VI-F and E8VI-R primers (the wild-type allele: 749 bp, the deleted allele: 225 bp).
Cell Preparation
Single cell suspensions of thymocytes and splenocytes were prepared as previously described (30). DCs were isolated according to a published protocol with minor modifications (31). In brief, spleens were injected with RPMI 1640 medium (Sigma) containing 600 U/ml Collagenase D (Roche), 20 U/ml DNase I (Roche) and 20 mM HEPES (Sigma), and cut into small pieces using sterile scissors. Subsequently, spleen samples were incubated in 5 ml of the same RPMI 1640 medium at 37°C for 30 min at 180 rpm in a shaker. Splenocytes were pushed through a 70 μm cell strainer (BD Biosciences), suspended in 2 ml of Lymphoprep (STEMCELL technologies) and centrifuged at 1,700 rpm for 15 min at room temperature. Cells at the low-density fraction were isolated and stained with appropriate antibodies. For the stimulation of DCs, low-density cells were incubated in 1 ml of complete RPMI1640 medium [Sigma, supplemented with 10% FCS (Sigma), 100 U/ml penicillin-streptomycin (GE Healthcare), 2 mM L-glutamin (Sigma), 0.1 mM non-essential amino acid (Lonza), 1 mM sodium pyruvate (GE Healthcare), 55 μM of β-mercaptoethanol (Sigma)] containing 500 ng/ml Lipopolysaccharide (LPS) (InvivoGen) at 37°C for 24 h. For most of the experiments IELs were isolated as previously described (11). In brief, small intestines were removed from the peritoneum of euthanized mice and the gut lumen was flushed with RPMI 1640 medium supplemented with 2% FCS. The intestine was turned “inside-out” over a polyethylene tube and incubated in 50 ml of RPMI supplemented with 10% FCS and 20 mM HEPES at 37°C for 1 h at 100 rpm in a shaker to release IELs into the medium. IELs were centrifuged at 1,700 rpm for 5 min at room temperature, suspended in RPMI 1640/2% FCS medium containing 37% Percoll (GE Healthcare) and were centrifuged at 1,700 rpm for 30 min at room temperature. Subsequently, cells were suspended in BD Pharm Lyse buffer (BD Biosciences) to remove red blood cells, washed with PBS/2% FCS and stained with the appropriate antibodies. To examine Cd8a gene expression in TCRβ+CD8β−CD4+ IELs, IELs were isolated by collagenase digestion (20). Briefly, small intestines were isolated, Peyer's batches were removed and tissue was cut into small pieces. The tissue pieces were incubated with HBSS buffer (Sigma) supplemented with 5 mM EDTA (Sigma) at 37°C for 15 min at 200 rpm in a shaker. Subsequently, cells were pelleted and further digested with HBSS buffer supplemented with 100 U/ml collagenase D at 37°C for 30 min at 200 rpm in a shaker. After digestion cells were resuspended in HBSS buffer containing 40% Percoll, layered over HBSS/80% Percoll and centrifuged at room temperature for 30 min at 2,000 rpm. Cells from the 40/80% interface were collected, washed and resuspended in PBS/2% FCS. CD19−TCRγδ−TCRβ+CD8β−CD4+ IEL subset was sorted with a SH800S Cell Sorter (Sony Biotechnology) and used for subsequent gene expression analysis.
Isolation and Activation of CD4+ and CD8+ T Cells
CD4+ and CD8+ T cells were first enriched by negative depletion before cell sorting. In brief, after red blood cell lysis, splenocytes (5–10 × 107 cells) were incubated with biotinylated (bio)-anti-Gr1 (RB6-8C5, final concentration 4 μg/ml), bio-anti-CD45R (RA3-6B2, 4 μg/ml), bio-anti-Ter119 (Ter119, 1 μg/ml), bio-anti-NK1.1 (PK136, 1 μg/ml), bio-anti-CD11b (M1/70, 1 μg/ml), bio-anti-CD11c (HL3, 1 μg/ml), bio-anti-CD8α (53–6.7, 2 μg/ml, for CD4+ T cell enrichment) and bio-anti-CD4 (RM4-5, 3μg/ml, for CD8+ T cell enrichment) in 0.5 ml PBS/2% FCS for 30 min at ice. The biotinylated antibodies were purchased from Biolegend and BD Biosciences. Subsequently, cells were washed and purified by negative depletion using streptavidin beads (BD Biosciences) according to the manufacturer's protocol. Enriched CD4+ and CD8+ T cells were sorted with a SH800S Cell Sorter for the CD4+CD8α−CD62L+CD44−CD25− and CD4−CD8α+CD62L+CD44− populations, respectively. Sorted naïve CD4+ and CD8+ T cells were stained with Cell Proliferation Dye eFluor 450 (Thermo Fisher Scientific) according to the manufacturer's protocol, and were stimulated (0.3–0.5 × 10⁶ cells/well) with plate-bound anti-CD3ε (145-2C11, 2 μg/ml; BD Biosciences) and anti-CD28 (37.51, 2 μg/ml; BD Biosciences) on 48 well plates in the presence of rhIL-2 (20 U/ml: Peprotech). CD8+ T cell cultures were split 1:2 48 h after activation, and cells were cultured for additional 24 h in the presence of 100 U/ml rhIL-2. For the treatment of CD4+ T cells with HDAC inhibitor, either MS-275 (Selleck Chemicals, used at a final concentration of 10 μM) or DMSO (as a carrier control) was added to CD4+ T cell culture 24 h after activation, and cells were cultured for additional 24 h.
Antibodies and Flow Cytometry
Antibodies used in this study are listed in Table S1. Thymocytes, splenocytes, IELs and activated T cells were first incubated with Fixable Viability Dye eFluor 506 (Thermo Fisher Scientific) as well as purified anti-CD16/CD32 antibody (BD Biosciences) to avoid unspecific antibody binding. Subsequently, cells were incubated with appropriate antibodies against surface markers on ice for 30 min. For the intracellular staining of transcription factors Foxp3/Transcription Factor Staining Buffer Kit (Thermo Fisher Scientific) was used according to manufacturer's instructions. Intracellular ThPOK and Runx3 expression was detected either by Alexa Fluor 647 anti-mouse Zbtb7b (T43-94) and PE anti-Runx3 (R3-5G4: BD Biosciences) antibodies or by anti-ThPOK (D9V5T: Cell Signaling Technology) and anti-Runx3 (R3-5G4: BD Biosciences) antibodies, followed by Alexa Fluor 647 anti-mouse IgG1 (RMG1-1: Biolegend) and PE anti-rabbit IgG (H+L) (#8885, Cell Signaling Technology) antibody staining, respectively. Flow cytometric data were collected with LSRII or Fortessa (BD Biosciences), and were analyzed with Flowjo software (Treestar).
cDNA Synthesis and Quantitative Real-Time PCR (qRT-PCR)
Total RNA was isolated using RNeasy Kits (Quiagen) according to manufacturer's instructions. RNA was reverse-transcribed using SuperScript III Reverse Transcriptase and Oligo(dT)18 Primer (Thermo Fisher Scientific). The majority of qRT-PCR was performed using iTaq Universal SYBR Green Supermix on the CFX 96 Real-Time PCR detection system (Bio-Rad). Primer pairs to detect Cd8a, Cd8b1, and Hprt gene expression were previously described (21). For the detection of Cd8a gene expression in TCRβ+CD8β−CD4+ IELs, TaqMan gene expression assays were performed using probes for Cd8a (Mm01182107_g1) and Hprt (Mm01182107_g1) genes (Thermo Fisher Scientific).
Analysis of Publically Available ATAC-Seq Data
ATAC-seq data of the ImmGen database (22) were directly downloaded from Gene Expression Omnibus database (GEO accession: GSE100738). For the analysis of ATAC-seq data of TCRγδ+ IELs (GEO accession: GSE89646) (32), raw sequencing reads were downloaded from NCBI SRA database, and were retrieved using SraTailor software package (33).
Statistical Analysis
The statistical analyses were performed using Prism 6 software (GraphPad). As indicated in each figure legend, p-values were calculated with either an unpaired Student's t-test, a one-sample t-test or a one-way ANOVA analysis followed by Tukey's multiple-comparison test. The p-values were defined as following: *, p < 0.05; **, p < 0.01; ***, p < 0.001. Differences that did not reach a statistically significant level (i.e., p ≥ 0.05) were either indicated as “n.s.” for two group comparisons or not indicated for multiple group comparisons.
Results
Evolutionary Conserved Regions at the Cd8ab1 Gene Complex Overlap With Open Chromatin Regions in Cytotoxic Lineage Cells
Our previous studies demonstrated compensatory mechanisms between developmental stage-specific Cd8 enhancers E8I and E8II (34) and E8II and E8III (35) in the regulation of CD8 expression at various stages of T cell development. However, E8I,E8II-doubly-deficient CD8SP thymocytes and naïve CD8+ T cells still express ~70% of CD8 levels compared to WT CD8+ T cells (34), suggesting that other (unknown) Cd8 enhancer(s) are active in these subsets. In order to obtain additional insight into the complex regulation of CD8 expression during T cell development, we searched in the ImmGen ATAC-seq database (22) for developmental stage-specific open chromatin regions at the Cd8ab1 loci. As expected, the ATAC-seq peaks nicely overlapped with previously identified DNase I hypersensitive sites at the Cd8ab1 gene loci (11, 36) (Figures 1A,B). Moreover, five ATAC-seq peaks mapped to the evolutionary conserved regions (ECR)−3, −4, −7, −8, and −10, respectively (Figure 1B), which we have identified in a previous study (23) using the MULAN algorithm (37). Interestingly, two ATAC-seq peaks that overlap with ECR-8 and ECR-4 show a similar developmental regulation and appeared only in CD8SP thymocytes and CD8+ T cells (Figure 1B). Indeed, ECR-8 and ECR-4 mapped within E8I and E8VI, respectively, both of which display enhancer activity in mature CD8SP thymocytes and in naive CD8+ T cells (11, 12, 23). Thus, ATAC-seq analysis revealed a strong correlation between enhancer activity and the chromatin status of E8I and E8VI, suggesting that part of E8I (i.e., ECR-8) and E8VI (i.e., ECR-4) might synergistically regulate CD8 expression once the cytotoxic lineage has been specified.
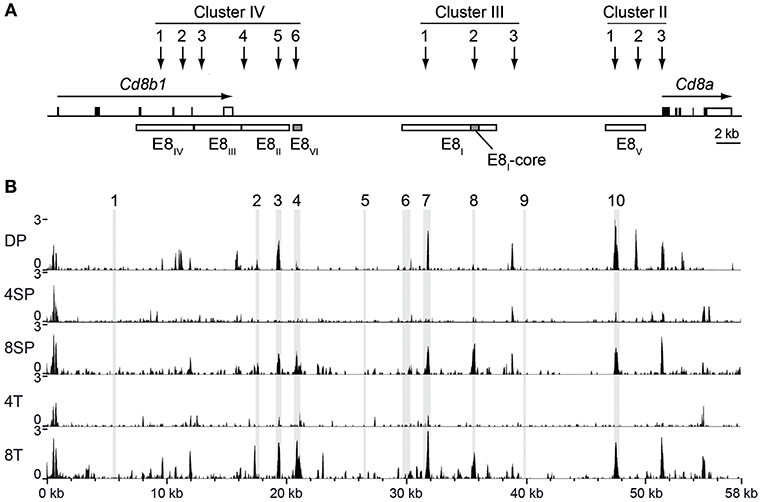
Figure 1. Chromatin accessibility at the Cd8ab1 gene complex in the T cell lineage. (A) Schematic map of the Cd8a and Cd8b1 gene loci [after Gorman et al. (38)]. Horizontal arrows indicate the transcriptional orientation of the Cd8a and Cd8b1 genes. Vertical arrows indicate the localization of DNase I hypersensitivity sites that constitute clusters II, III, and IV (11, 36). The boxes below the Cd8ab1 gene complex indicate the location of Cd8 enhancers E8I to E8VI. The E8-core and E8VI regions are indicated as shaded boxes. (B) UCSC genome browser snapshots showing the ATAC-seq signals at the Cd8ab1 gene complex (GRCm38/mm10, chr6: 71322001-71380000) in double-positive (DP), CD4 single-positive (4SP), CD8 single-positive (8SP) thymocytes, CD4+ T (4T) and CD8+ T (8T) cells. The ATAC-seq data were obtained from the Immunological Genome Project (ImmGen) (22). Shaded bars indicate the location of ECR1 to ECR10 as previously described (23).
ECR-8 Represents the Core Enhancer Region of E8I
The E8I enhancer activity has been initially identified within a 7.6 kb genomic fragment (11, 12) and subsequently mapped to a 1.6 kb genomic sub-fragment (13) that displayed identical enhancer activity (Figure S1A). Since ECR-8 is located within the 1.6 kb genomic sub-fragment and becomes accessible in cytotoxic lineage cells (Figure S1A), we performed transgenic reporter expression assays to test whether ECR-8 displays enhancer activity. A 544 bp fragment containing ECR-8 and the downstream open chromatin region was inserted into the previously generated basic reporter expression construct harboring the minimal Cd8a promoter (P8a) and a human CD2 (hCD2) reporter gene (Figures S1A,B and Table S2). From 11 transgenic founders identified, 5 displayed expression in CD8+ peripheral blood T lymphocytes, but none of these 5 founders displayed expression in CD4+ PBLs (data not shown). A more detailed analysis of 2 transgenic founders revealed that ECR-8 directed transgene expression in mature CD8SP thymocytes, in CD8+ T cells and in CD8αα+ IEL (Figures S1C–E). Thus, ECR-8 displays a similar activity as the initially described 7.6 kb genomic E8I enhancer (11, 12) and the 1.6 kb genomic sub-fragment of E8I (13). This suggests that ECR-8 represents the core enhancer region of the E8I (hereafter designated as E8I-core, see also Figure 1A).
To study the role of E8I-core in the regulation of CD8 expression in more detail, we generated E8I-core-deficient mice (E8I-core−/−) using standard gene-targeting approaches (Figure S2, Tables S2, S3). E8I-core−/−mice displayed no obvious alterations in the percentages and numbers of major T cell subsets in thymus and spleen (Figures S3A–D and data not shown). However, CD8 expression on CD8SP thymocytes as well as CD8+ T cells was slightly reduced in the absence of E8I-core to a similar degree as observed in E8I−/− mice (Figures 2A,B) (13, 14), indicating that the enhancer activity of E8I in the cytotoxic lineage is largely attributed to the E8I-core region. E8I has been shown to control CD8 expression in IEL subsets, particularly in CD8αα homodimers-expressing IELs (13, 14). Similar to the observation made in E8I−/− mice, the deletion of E8I-core led to a substantial reduction in the percentage of CD8αα+ cells within TCRγδ+ IELs, and the residual TCRγδ+CD8αα+ IELs express CD8αα homodimers at a lower level compared to WT cells (Figures 2C,D). Together, these data indicate that E8I-core represents the core enhancer region of E8I, and that E8I-core regulates CD8 expression in cytotoxic lineage cells.
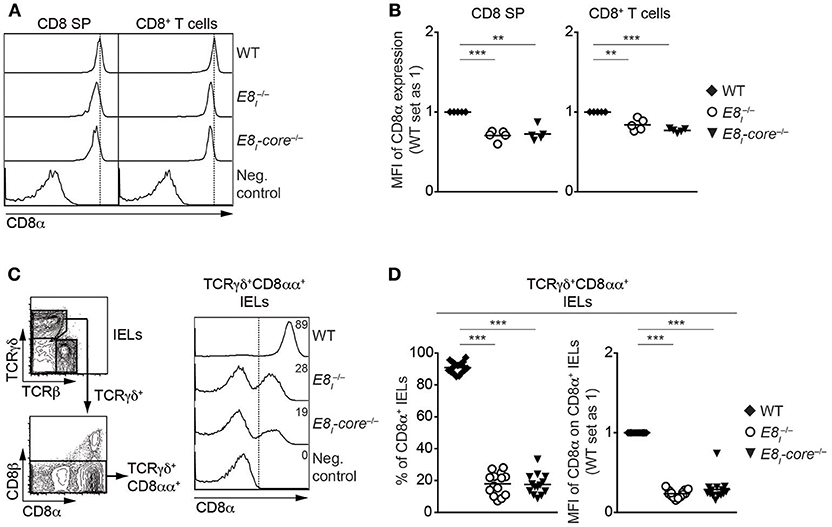
Figure 2. E8I-core represents the core enhancer region of E8I. (A) Histograms showing CD8α expression on CD8SP thymocytes and splenic CD8+ T cells isolated from wild-type (WT), E8I−/− and E8I-core−/− mice. The gating strategy is shown in Figures S3A,C. Dotted vertical lines indicate the peaks of CD8α expression on WT cells. CD8α expression on WT CD4SP thymocytes (left panel) or CD4+ T cells (right panel) is shown as negative staining control. (B) Diagrams showing the relative mean fluorescence intensity (MFI) of CD8α expression on CD8SP thymocytes (left) and splenic CD8+ (right) T cells isolated from wild-type (WT), E8I−/− and E8I-core−/− mice. (C) Representative gating strategy for the analysis of CD8α expression on TCRγδ+CD8αα+ IELs (left panel) and histograms showing CD8α expression on TCRγδ+CD8αα+ IELs isolated from wild-type (WT), E8I−/− and E8I-core−/− mice (right panel). CD8α expression on WT CD19+ B cells is shown as a negative staining control. Dotted lines and numbers indicate gating region for the CD8α+ population and the percentages of the CD8α+ population, respectively. (D) Diagrams showing the percentage of the CD8α+ population (left panel) and MFI CD8α expression levels (right panel) within TCRγδ+CD8αα+ IELs isolated from wild-type (WT), E8I−/− and E8I-core−/−mice. Each dot represents one mouse. Horizontal bars indicate mean values. A one-way ANOVA analysis followed by Tukey's multiple-comparison test was performed for statistical analysis. (B,D) The MFI values of WT cells were set as 1. Each dot represents one mouse. Horizontal bars indicate mean values. A one-sample t-test was performed for statistical analysis, where the values obtained from each group of the mutant mice were compared to the WT ones. The p-values were defined as following: **, p < 0.01; ***, p < 0.001. Data are representative of 5–6 mice (A,C) or show the summary of 5–6 mice (B) mice, 14–17 mice (D) analyzed in 5 (A,B) and 16 (C,D) independent experiments.
Deletion of E8VI Leads to a Reduction in CD8 Expression in Cytotoxic Lineage T Cells
The analysis of ATACseq peaks in the ImmGen database revealed a similar developmental regulation of chromatin accessibility at E8I-core and E8VI (Figure 1), suggesting that E8VI might compensate for loss of E8I. Previous transgenic reporter gene expression assays revealed that E8VI, which overlaps with ECR-4, is active in mature CD8SP thymocytes and cytotoxic T cells, particularly in CD44hiCD62L+ effector CD8+ T cells, as well as in CD8αα+ DCs (23). However, whether E8VI is essential for CD8 expression has not been analyzed by genetic approaches. In order to delete the genomic region harboring E8VI we utilized the CRISPR/Cas9 system. Two guide RNAs complementary to upstream and downstream sequences of E8VI were injected into fertilized eggs together with Cas9 mRNA (Table S4). The resulting offspring were screened by PCR (Figure S4A) and successful deletion was confirmed by sequencing (Table S5). Mice containing the E8VI-deficient allele were crossed with C57BL/6 mice, and were subsequently intercrossed to generate E8VI−/− mice (Figure S2C). E8VI−/− mice displayed no obvious alteration in the percentage and number of major thymic and splenic T cell subsets compared to littermate control wild-type (WT) mice, indicating that T cell development is largely intact in the absence of E8VI (Figures S4B–D, and data not shown). However, we noticed a mild reduction in CD8 expression levels on E8VI-deficient CD8SP thymocytes (Figures 3A,B and Figure S4B), while CD8 expression level on HSAhiTCRβlo DP thymocytes in the absence E8VI was unchanged (Figures S4E,F). A similar mild reduction in CD8 expression levels was also observed in E8VI-deficient splenic CD8+ T cells (Figures 3A,B), indicating that E8VI contributes to the induction and/or maintenance of CD8 expression in cytotoxic lineage cells. We previously observed a preferential activity of E8VI in the effector/memory CD44hiCD62L+ subset within the peripheral CD8+ T cell compartment (23), therefore we examined CD8 expression on splenic CD8+CD44hiCD62L+ T cells in the absence of E8VI. E8VI-deficient CD8+CD44hiCD62L+ T cells also showed a reduction in CD8 expression levels, although to a similar degree as observed in total CD8+ T cells (Figures 3A,B, and Figure S4C). This indicates that E8VI is not preferentially utilized by effector/memory T cells to drive CD8 expression. Since E8VI is also active in CD8αα+ DCs (23), we assessed CD8 expression in splenic E8VI−/− CD11c+ DCs (Figures 3C,D and Figure S4G). WT and E8VI-deficient DC cells, both ex vivo analyzed and after LPS-stimulation, had a similar fraction of the CD4−CD8α+ subset, suggesting a dispensable role of E8VI for CD8 expression in DCs. Together, these results indicate that E8VI is required for appropriate CD8 expression in cytotoxic lineage T cells and that loss of E8VI cannot be fully compensated by other Cd8 enhancers.
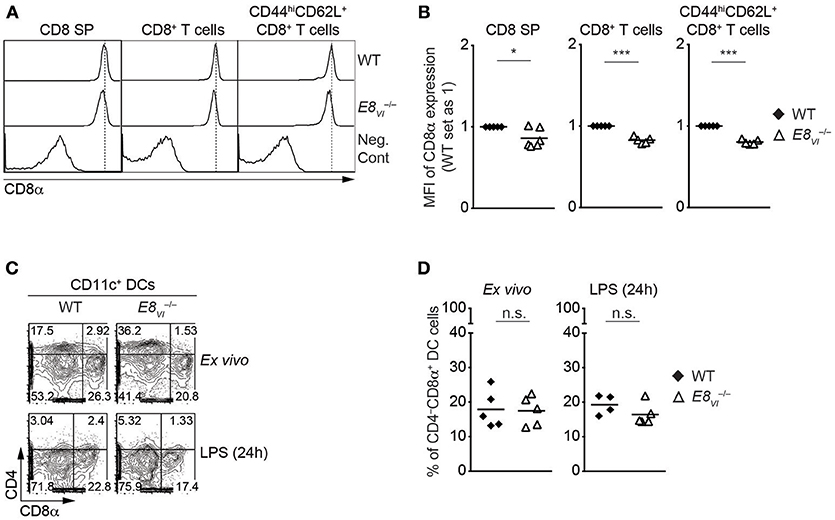
Figure 3. Deletion of E8VI leads to a reduction in CD8 expression in cytotoxic lineage cells. (A) Histograms showing CD8α expression on CD8SP thymocytes, splenic CD8+ and CD8+CD44hiCD62L+ T cells isolated from wild-type (WT) and E8VI−/− mice. The gating strategy is shown in Figures S4B,C. Dotted vertical lines indicate the peaks of CD8α expression on WT cells. CD8α expression on WT CD4SP thymocytes (left panel) or CD4+ T cells (middle and right panels) is shown as negative staining control. (B) Diagrams showing the relative mean fluorescence intensity (MFI) of CD8α expression on CD8SP thymocytes (left), splenic CD8+ (middle) and CD8+CD44hiCD62L+ (right) T cells isolated from wild type (WT) and E8VI−/− mice. The MFI values of WT cells were set as 1 for each experiment. Each dot represents one mouse. Horizontal bars indicate mean values. A one-sample t-test was performed for statistical analysis, where the values obtained from E8VI−/− mice were compared to the WT ones (i.e., 1). The p-values were defined as following: *, p < 0.05; ***, p < 0.001. (C) Flow cytometry analysis showing CD8α and CD4 expression on wild-type (WT) and E8VI−/− splenic dendritic cells (DCs), which were either freshly isolated (upper panel) or stimulated with LPS for 24 h (lower panel). The gating strategy for DCs is shown in Figure S4G. Numbers indicate the percentages within the respective regions. Data are representative of 4–5 mice analyzed in 4 independent experiments. (D) Diagrams showing the percentage of the CD4−CD8α+ population within wild-type (WT) and E8VI−/− splenic dendritic cells (DCs), which were either freshly isolated (left) or stimulated with LPS for 24 h (right). Each dot represents one mouse. Horizontal bars indicate mean values. An unpaired Student's t-test was performed for statistical analysis. n.s., not significant. Data are representative (A,C) or show the summary (B,D) of 5–6 mice (B) and 4–5 mice (B) analyzed in 5 (A,B) and 4 (C,D) independent experiments.
E8I-Core and E8VI Synergistically Regulate CD8 Expression in Cytotoxic Lineage T Cells
To investigate potential synergistic and/or redundant activities of E8I-core and E8VI, we next targeted the E8VI region in E8I-core−/− embryos by using the same CRISPR/Cas9 approach as described above, resulting in the generation of E8I-core/E8VI-doubly deficient mice (E8I-core−/−E8VI−/−) (Figure S2C, Tables S4, S5). These mice were then analyzed and compared to WT, the “original” E8I-deficient (), E8I-core−/− and E8VI−/− mice. While T cell development is largely intact in E8I-core−/−E8VI−/− mice (Figures S5A,B and data not shown), the combined deletion of E8I-core and E8VI led to a further reduction in CD8 expression levels compared to the individual E8I-core and E8VI mutant mice, indicating that E8I-core and E8VI synergistically regulate CD8 expression in CD8SP thymocytes (Figures 4A,B). A similar pattern of CD8 downmodulation was also observed in splenic total and effector/memory (CD44hiCD62L+) CD8+ T cell populations in E8I-core−/−, E8VI−/−and E8I-core−/−E8VI−/− mice, while CD8+CD44hiCD62L+ T cells did not show a reduction in CD8 expression compared to WT cells (Figures 4A,B). The CD8 coreceptor on CD8+ T cells consists of CD8α and CD8β chains, and CD8β requires CD8α expression for cell surface expression (38). In order to examine whether the downmodulation of CD8 in the mutant CD8+ T cells is due to impaired transcription of either Cd8a only or of both Cd8a and Cd8b1 we analyzed mRNA expression of these two genes. qRT-PCR analysis revealed reduced expression of Cd8a and also a strong tendency of reduced Cd8b1 expression in naïve E8I-core−/−E8VI−/− CD8+ T cells compared to WT cells (Figure 4C), indicating that the combined deletion of E8I-core−/− and of E8VI−/− affects the whole Cd8ab1 gene complex. Of note, we observed only a tendency of reduced Cd8a expression levels in the individual mutant mice based on the mean relative expression levels. This is most likely due to experimental variance when comparing 5 groups that makes it difficult to detect a 20% difference on protein level also on RNA level. Finally, we analyzed CD8 expression in ex vivo and LPS-stimulated CD11c+ DCs isolated from WT, E8I−/−, E8I-core−/−, E8VI−/−, and E8I-core−/−E8VI−/− mice, and observed no alteration in the proportion of the CD8α+CD4− subset in all the mutant mice (Figures S5C,D). Together, these data suggest that E8I-core and E8VI synergistically regulate CD8 expression in cytotoxic lineage cells. However, both enhancers are not essential for directing CD8α expression in DCs.
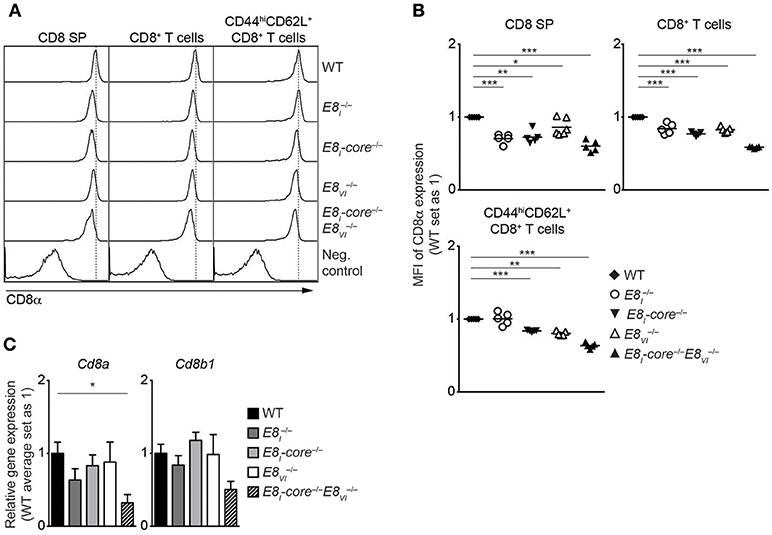
Figure 4. E8I-core and E8VI synergistically regulate CD8 expression in cytotoxic lineage cells. (A) Histograms depict CD8α expression on CD8SP thymocytes, splenic CD8+ and CD8+CD44hiCD62L+ T cells isolated from wild-type (WT), E8I−/−, E8I-core−/−, E8VI−/− and E8I-core−/−E8VI−/− mice. The gating strategy is shown in Figures S4B,D. Dotted vertical lines indicate the peaks of CD8α expression on WT cells. CD8α expression on WT CD4SP thymocytes (left panel) or CD4+ T cells (middle and right panels) is shown as negative staining controls. (B) Diagrams showing the relative mean fluorescence intensity (MFI) of CD8α expression on CD8SP thymocytes (left), splenic CD8+ (middle) and CD8+CD44hiCD62L+ (right) T cells isolated from wild type (WT), E8I−/−, E8I-core−/−, E8VI−/−, and E8I-core−/−E8VI−/− mice. Data obtained from the analysis of WT, E8I−/−, E8I-core−/− and E8VI−/− mice (already shown in Figures 2B, 3B) were included in the respective diagrams. The MFI values of WT cells are set as 1. Each dot represents one mouse. Horizontal bars indicate mean values. A one-sample t-test was performed for statistical analysis, where the values obtained from each group of the mutant mice were compared to the WT ones (i.e., 1). Only the comparisons that reached statistically significant levels (i.e., p < 0.05) are indicated in the diagrams. (C) qRT-PCR analysis showing Cd8a (left) and Cd8b1 (right) gene expression levels (normalized to the Hprt gene expression levels) in wild-type (WT), E8I−/−, E8I-core−/−, E8VI−/− and E8I-core−/−E8VI−/− naive CD44loCD62L+CD8+ T cells. The average expression levels in WT cells were set as 1. Error bars indicate SEM. A one-way ANOVA analysis followed by Tukey's multiple-comparison test was performed for statistical analysis. (B,C) The p-values were defined as following: *, p < 0.05; **, p < 0.01; ***, p < 0.001. Data are representative (A) or show the summary (B,C) of 5–6 mice (A,B) or 4–5 independent biological samples (C) analyzed in 5 (A,B) and 5 (C) independent experiments.
Synergistic Activity of E8I-Core and E8VI Is Required for the Maintenance of CD8 Expression on Activated CD8+ T Cells
Our previous study has demonstrated that E8I is required for the maintenance of CD8 expression on CD8+ T cells upon activation (18). We therefore examined the individual and combinatorial roles of E8I-core and E8VI in activated CD8+ T cells. Naïve CD8+ T cells from WT, , E8I-core−/−, , and E8I-core−/− mice were stimulated with anti-CD3/CD28, and were analyzed for CD8 expression 48 h after activation. The mutant CD8+ T cells displayed comparable proliferative capacity to WT cells (Figure 5A). Consistent with our previous study (18), almost half of CD8+ T cells downmodulate CD8 expression 48 h after activation (Figures 5A,B). Interestingly, E8I-core−/− cells displayed a milder CD8 downmodulation compared to cells, suggesting that another region within E8I contributes to the maintenance of CD8 expression. In addition, while E8VI−/− CD8+ T cells maintained CD8 expression at a similar level as WT cells (albeit a tendency toward a lower proportion of CD8hi cells was observed), the deletion of both E8I-core and E8VI led to enhanced CD8 downmodulation, compared to the single mutant cells. qRT-PCR analysis showed that the combined deletion of E8I-core−/− and E8VI−/− led to a reduced expression of both Cd8a and Cd8b1 in activated CD8+ T cells (Figure 5C). Together, these data indicate that the maintenance of CD8 expression is regulated by E8I-core and an additional cis-region within E8I, and that the synergistic activity of E8I-core and E8VI plays an important role for the maintenance of CD8 expression upon activation.
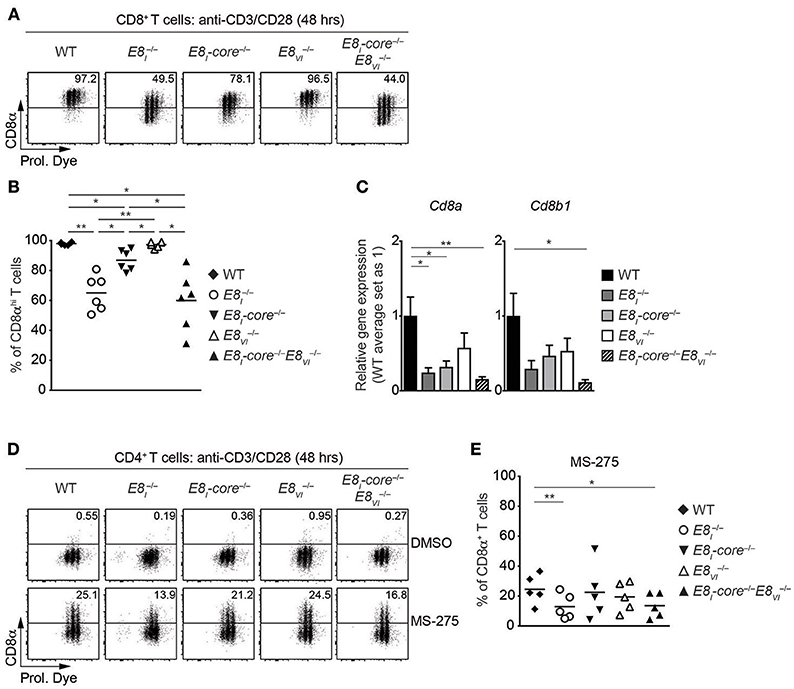
Figure 5. E8I-core and E8VI function in activated CD8+ and HDAC inhibitor-treated CD4+ T cells. (A) Flow cytometry analysis showing CD8α expression and Cell proliferation dye (Prol. Dye) dilution on activated CD8+ T cells isolated from wild-type (WT), E8I−/−, E8I-core−/−, E8VI−/−, and E8I-core−/−E8VI−/− mice. Naïve CD8+ T cells were stimulated with plate-bound anti-CD3 and anti-CD28 antibodies for 48 h. Numbers indicate the percentages of the CD8αhi population. (B) Diagrams showing the percentages of CD8αhi population within activated CD8+ T cells (48 h after activation), isolated from wild-type (WT), E8I−/−, E8I-core−/−, E8VI−/− and E8I-core−/−E8VI−/− mice. (C) qRT-PCR analysis showing Cd8a (left) and Cd8b1 (right) gene expression levels (normalized to the Hprt gene expression levels) in wild-type (WT), E8I−/−, E8I-core−/−, E8VI−/− and E8I-core−/−E8VI−/− activated CD8+ T cells (72 h after activation). The average expression levels in WT cells were set as 1. The summary of 5–6 biologically independent experiments is shown. Error bars indicate SEM. A one-way ANOVA analysis with repeated measures followed by Tukey's multiple-comparison test was performed for statistical analysis. (D) Naïve CD4+ T cells were stimulated with plate-bound anti-CD3 and anti-CD28 antibodies for 48 h, and were cultured in the presence of DMSO or MS-275 for the last 24 h. Flow cytometry analysis showing CD8α expression and Cell Proliferation Dye (Prol. Dye) dilution in DMSO- (upper panel) and MS-275-treated (lower panel) activated CD4+ T cells isolated from wild-type (WT), E8I−/−, E8I-core−/−, E8VI−/−, and E8I-core−/−E8VI−/− mice. Numbers indicate the percentages of CD8α+ cells. (E) Diagrams showing the percentage of CD8α+ cells within MS-275-treated activated CD4+ T cells isolated from wild-type (WT), E8I−/−, E8I-core−/−, E8VI−/− and E8I-core−/−E8VI−/− mice. (B,E) Each dot represents one mouse. Horizontal bars indicate mean values. A one-way ANOVA analysis with repeated measures followed by Tukey's multiple-comparison test was performed for statistical analysis. (B,C,E) The p-values were defined as following: *, p < 0.05; **, p < 0.01; ***, p < 0.001. Data are representative (A,D) or show the summary (B,C,E) of 6 mice (A,B), 5–6 samples (C) and 5 mice (D,E) analyzed in 6 (A,B), 5–6 (C), and 4 (D,E) independent experiments.
E8I-Core and E8VI Contribute to Class I HDAC Inhibitor Treatment-Induced CD8 Expression in CD4+ T Cells
In addition to its role in regulating CD8 expression in cytotoxic T cells, E8I displays also activity in helper lineage T cells. We have previously demonstrated that HDAC1 and HDAC2 are required for the maintenance of the lineage integrity of CD4+ T cells, and that treatment with class I HDAC inhibitor MS-275 of activated CD4+ T cells leads to the induction of CD8α and CD8β expression in an E8I-dependent manner (21). In order to test the role of E8I-core and E8VI for CD8 induction in CD4+ T cells, we activated E8I−/−, E8I-core−/−, E8VI−/− and E8I-core−/− CD4+ T cells in the presence of MS-275, and analyzed CD8 expression (Figures 5D,E). As observed previously, E8I-deficient CD4+ T cells displayed an impaired upregulation of CD8 compared to WT cells. While E8I-core−/− and CD4+ T cells upregulated CD8 expression to a similar degree as WT cells, the combined deletion of E8I-core and E8VI led to a reduction in the proportion of CD4+ T cells that expressed CD8. This indicates a synergistic activity of E8I-core and E8VI in HDAC inhibitor-mediated CD8 induction in CD4+ T cells.
E8I-Core and E8VI Regulate CD8 Expression in IEL Subsets
The IEL population consists of both γδ and αβ T cell lineages. Whereas, TCRγδ+ IELs predominantly express CD8αα homodimers, TCRαβ+CD8α+ IELs express either CD8αα homodimers or CD8αβ heterodimers (39). Since E8I controls CD8α expression in IELs (13, 14), we performed a comprehensive analysis of CD8 expression on these IEL subsets isolated from WT, E8I−/−, E8I-core−/−, E8VI−/− and E8I-core−/− mice (Figure 6A). Unlike E8I- or E8I-core-deficient TCRγδ+CD8αα+ IELs (Figures 2C,D, 6B, left column, and Figure 6C), E8VI−/− TCRγδ+CD8αα+ IELs showed no alterations in the proportion of CD8-expressing cells (Figure 6B, left column, and Figure 6C), although a mild reduction in CD8α expression levels was observed (Figure 6D). In contrast, the combined deletion of both E8I-core and E8VI led to an almost complete loss of CD8 expression (Figure 6B, left column, and Figures 6C,D), suggesting that these two enhancers control CD8αα expression in TCRγδ+ IELs synergistically. In the TCRβ+CD4−CD8αα+ IEL population, E8I-core−/− mice displayed a similar reduction of CD8 expression levels as observed in E8I−/− cells (Figure 6B, middle column, and Figures 6C,D), indicating that the E8I enhancer activity directing CD8αα expression in TCRγδ+ and TCRαβ+ IELs resides predominantly in the E8I-core region. In mice, there was no reduction of the percentage of TCRαβ+ CD8αα-expressing IELs (Figure 6B, middle column, and Figure 6C), although a mild reduction in CD8α expression levels was observed in the absence of E8VI (Figure 6D). However, unlike in E8I-core−/−E8VI−/− TCRγδ+CD8αα+ IELs, E8I-core−/−E8VI−/− TCRβ+CD4−CD8αα+ IELs displayed no further reduction in CD8αα expression in comparison to E8I-core−/− cells (Figure 6B, middle column, and Figures 6C,D), suggesting that E8VI plays only a minor role in the regulation of CD8 expression in TCRβ+CD4−CD8αα+ IELs. Finally, we investigated CD8αβ expression on TCRβ+CD4−CD8αβ+ IELs in the various mutant mice (Figure 6B, right column, and Figure 6D). In the absence of either E8I-core or E8VI, the CD8αβ expression level was reduced, and CD8αβ levels were further reduced upon combined loss of both enhancers (Figure 6D), which is reminiscent of the expression pattern on peripheral CD8+ T cells (Figures 4A,B). Together, these analyses revealed that CD8αα expression in IELs (particularly on TCRγδ+CD8αα+ IELs) largely depends on E8I-core enhancer activity, whereas E8VI provides a minor contribution to CD8α expression.
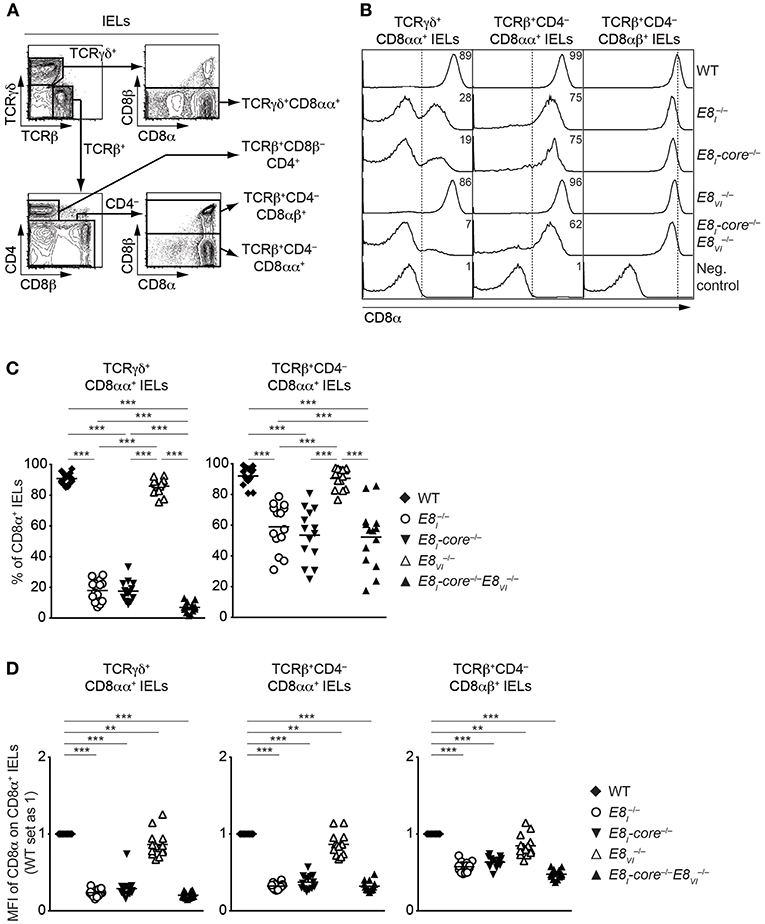
Figure 6. CD8αα expression on IELs is predominantly regulated by E8I-core. (A) Representative gating strategy for the analysis of CD8α expression on TCRγδ+CD8αα+, TCRβ+CD8β−CD4+, TCRβCD4−CD8αα+, TCRβ+CD4−CD8αβ+, and IELs. (B) Histograms showing CD8α expression on TCRγδ+CD8αα+, TCRβ+CD4−CD8αα+, and TCRβ+CD4−CD8αβ+ IELs isolated from wild-type (WT), E8I−/−, E8I-core−/−, E8VI−/− and E8I-core−/−E8VI−/− mice. CD8α expression on WT CD19+ B cells is shown as a negative staining control. Dotted lines indicate either gating region for the CD8α+ population (TCRγδ+CD8αα+ and TCRβ+CD4−CD8αα+ IELs) or the peak of CD8α expression on WT cells (TCRβ+CD4−CD8αβ+ IELs). Numbers indicate the percentages of CD8α+ cells. (C) Diagrams showing the percentage of CD8α+ cells within TCRγδ+CD8αα+, and TCRβ+CD4−CD8αα+ IELs isolated from wild-type (WT), E8I−/−, E8I-core−/−, E8VI−/− and E8I-core−/−E8VI−/− mice. Data obtained from the analysis of WT, E8I−/−, E8I-core−/− TCRγδ+CD8αα+ IELs (as shown in Figure 2D, left panel) were included in the corresponding diagram. Each dot represents one mouse. Horizontal bars indicate mean values. A one-way ANOVA analysis followed by Tukey's multiple-comparison test was performed for statistical analysis. (D) Diagrams showing the relative mean fluorescence intensity (MFI) of CD8α expression within the CD8α+ population of TCRγδ+CD8αα+, TCRβ+CD4−CD8αα+, and TCRβ+CD4−CD8αβ+ IELs isolated from wild type (WT), E8I−/−, E8I-core−/−, E8VI−/− and E8I-core−/−E8VI−/− mice. The MFI values of WT cells are set as 1. Data obtained from the analysis of WT, E8I−/−, E8I-core−/− TCRγδ+CD8αα+ IELs (shown in Figure 2D, right panel) were included in the corresponding diagrams. Each dot represents one mouse. Horizontal bars indicate mean values. A one-sample t-test was performed for statistical analysis, where the values obtained from each group of the mutant mice were compared to the WT ones (i.e., 1). (C,D) The p-values were defined as following: **, p < 0.01; ***, p < 0.001. Data are representative (B) or show the summary (C,D) of 14–17 mice (B,C,D) analyzed in 16 (B,C,D) independent experiments.
E8I-Core Is Required for the Acquisition of Cytotoxic Features of TCRαβ+ CD4+ IELs
It has been shown that a fraction of mature TCRαβ+CD4+ T cells acquires cytotoxic features in the intestine. The generation of these CD4 CTLs from CD4+ T cells is controlled by a transcriptional reprogramming of ThPOK and Runx3 expression that leads to the downmodulation of ThPOK and the upregulation of Runx3 (19, 20). Since E8I is required for the induction of CD8αα in CD4 CTLs (20), we investigated CD8αα expression in TCRβ+CD8β−CD4+ IELs isolated from WT, E8I−/−, E8I-core−/−, E8VI−/− and E8I-core−/−E8VI−/− mice (Figures 7A,B). Similar to the phenotype observed in E8I−/− mice, the deletion of E8I-core led to an almost complete loss of CD8αα-expressing subsets within TCRβ+CD8β−CD4+ IELs and the few cells that still expressed CD8α displayed reduced CD8α expression levels (Figures 7A,B). We also observed reduced levels of Cd8a gene expression in total and E8I-core−/− TCRβ+CD8β−CD4+ IELs (p = 0.0563 and p = 0.0759, respectively; based on an unpaired two-tailed Student's t-test) (Figure 7C). TCRβ+CD8β−CD4+ IELs displayed an approx. 1.8-fold reduction in the proportion of CD8αα+ cells in comparison to WT cells (Figures 7A,B). This suggests that E8VI contributes to the induction of CD8αα expression in TCRβ+ CD4+ IELs, although the CD8α+ cells expressed CD8α at the same level as WT cells (Figures 7A,B) and there was also no detectable difference in Cd8a gene expression levels in TCRβ+CD8β−CD4+ IELs (Figure 7C). Of note, the combined deletion of both E8I-core and E8VI resulted in the appearance of CD8αα-expressing TCRβ+CD8β−CD4+ IEL subsets with a similar frequency as observed in IELs, although CD8αα expression levels in those cells that express CD8α remained at similar low levels as observed in E8I-core−/− IELs (Figures 7A,B). In agreement with the low CD8α protein expression levels, we also observed a tendency that Cd8a gene expression is reduced in TCRβ+CD8β−CD4+ IELs (Figure 7C).
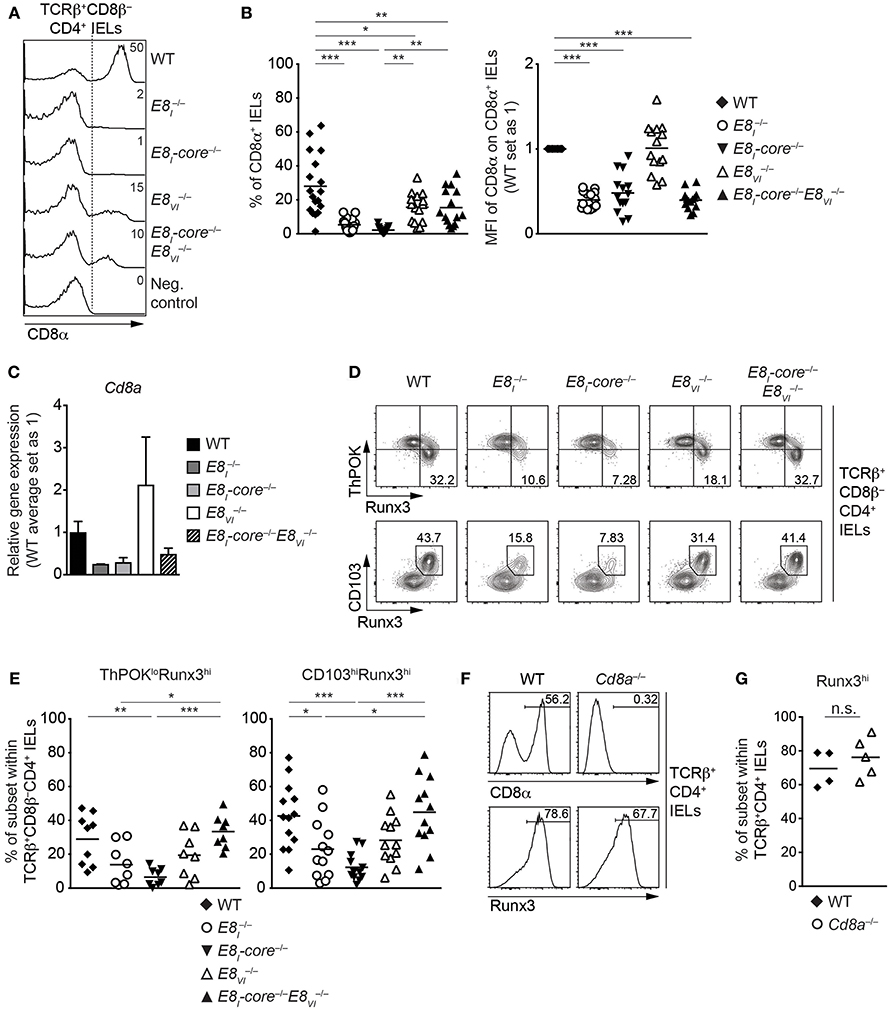
Figure 7. E8I-core is required for the generation of CD4+ CTLs in the small intestine. (A) Histograms showing CD8α expression on TCRβ+CD8β−CD4+ IELs isolated from wild-type (WT), E8I−/−, E8I-core−/−, E8VI−/− and E8I-core−/−E8VI−/− mice. The gating strategy is shown in Figure 6A. CD8α expression on WT CD19+ B cells is shown as a negative control for the staining. Dotted lines and numbers indicate gating region for the CD8α+ population and the percentages of the CD8α+ population, respectively. (B) Diagrams showing the percentage of the CD8α+ population (left) and the relative mean fluorescence intensity (MFI) of CD8α expression on the CD8α+ population (right) within TCRβ+CD8β−CD4+ IELs isolated from wild type (WT), E8I−/−, E8I-core−/−, E8VI−/− and E8I-core−/−E8VI−/− mice. Each dot represents one mouse. Horizontal bars indicate mean values. The MFI values of WT cells are set as 1. A one-way ANOVA analysis followed by Tukey's multiple-comparison test (left) or a one-sample t-test, where the values obtained from each group of the mutant mice were compared to the WT ones (i.e., 1) (right), was performed. (C) qRT-PCR analysis showing Cd8a gene expression levels (normalized to the Hprt gene expression levels) in sorted TCRβ+CD8β−CD4+ IELs from wild-type (WT), E8I−/−, E8I-core−/−, E8VI−/−, and E8I-core−/−E8VI−/− mice. The average expression levels in WT cells were set as 1. Error bars indicate SEM. A one-way ANOVA analysis followed by Tukey's multiple-comparison test was performed for statistical analysis. (D) Flow cytometry analysis showing Runx3 and ThPOK (upper panel) and Runx3 and CD103 (lower panel) expression on TCRβ+CD8β−CD4+ IELs isolated from wild type (WT), E8I−/−, E8I-core−/−, E8VI−/− and E8I-core−/−E8VI−/− mice. Numbers indicate the percentages of ThPOKloRunx3hi subsets (upper panel) and CD103hiRunx3hi subset (lower panel). (E) Diagrams showing the percentages of the ThPOKloRunx3hi (left panel) and CD103hiRunx3hi (right panel) subsets within TCRβ+CD8β−CD4+ IELs isolated from wild type (WT), E8I−/−, E8I-core−/−, E8VI−/− and E8I-core−/−E8VI−/− mice. Each dot represents one mouse. Horizontal bars indicate mean values. A one-way ANOVA analysis followed by Tukey's multiple-comparison test was performed for statistical analysis. (B,E) The p-values were defined as following: *, p < 0.05; **, p < 0.01; ***, p < 0.001. (F) Histograms showing CD8α (upper panel) and Runx3 (lower panel) expression on TCRβ+CD8β−CD4+ IELs isolated from wild type (WT) and Cd8a−/− mice. Numbers indicate the percentages of respective regions. (G) Diagrams showing the percentages of the Runx3hi subset within TCRβ+CD8β−CD4+ IELs isolated from wild type (WT) and Cd8a−/− mice. Each dot represents one mouse. Horizontal bars indicate mean values. An unpaired Student's t-test was performed for statistical analysis. n.s., not significant. Data are representative (A,D,F) or show the summary of 15-18 mice (A,B), 3–4 independent biological samples (C), 8–13 mice (D,E) and 4–5 mice (F,G) analyzed in 16 (A,B), 2 (C) 8–12 (D,E), and 2 (F,G) independent experiments.
The increase in the percentage of CD8αα-expressing TCRβ+CD8β−CD4+ IELs in E8I-core−/−E8VI−/− mice in comparison to E8I-core−/− mice was unexpected, since E8I-core and E8VI showed synergistic activities in conventional CD8+ T cells (Figure 4). Since CD8α expression is a marker for the appearance of CD4 CTLs, we next analyzed the expression of CD103, ThPOK, and Runx3 in the various Cd8 enhancer mutant TCRβ+CD8β−CD4+ IELs (Figures 7D,E). The deletion of E8I-core led to a reduction in the percentage of ThPOKloRunx3hi cells in comparison to WT cells (Figure 7D, upper panel, and Figure 7E), In addition, the frequency of CD103hiRunx3hi cells was reduced in E8I−/− and E8I-core−/− TCRβ+CD8β−CD4+ IELs (Figure 7D, lower panel, and Figure 7E), indicating that not only CD8α expression but also the generation of CD4 CTLs is impaired in the absence of E8I-core. In contrast, the deletion of E8VI did not alter the fraction of ThPOKloRunx3hi or CD103hiRunx3hi cells. Interestingly, the combined deletion of E8I-core and E8VI reverted the impaired CD4 CTL differentiation caused by loss of E8I-core. To test whether the inhibition of CD4 CTL differentiation was caused by impaired CD8αα expression in the absence of the Cd8 enhancers, we assessed the appearance of Runx3hi cells as a marker for CD4 CTLs in TCRβ+CD4+ IELs isolated from Cd8a−/− mice (Figures 7F,G). Strikingly, Cd8a−/− TCRβ+CD4+ IELs contained similar percentages of Runx3hi cells compared to WT cells, demonstrating that the induction of CD4 CTLs is not dependent on CD8αα expression. Together, these results suggest that loss of E8I-core impairs not only the expression of CD8α but also the differentiation of intestinal CD4 CTLs in a CD8α-independent manner, and that this phenotype is converted upon additional loss of E8VI.
Discussion
The expression of CD8 is regulated by a complex regulatory network formed by at least 6 developmental stage and lineage-specific Cd8 enhancers (8, 9, 23). Among those, the mature enhancer E8I, initially identified on a 7.6 kb genomic fragment, is required for CD8α expression in IELs as well as for the maintenance of CD8α expression in activated CD8+ T cells (13, 18). In this study we first dissected the activity of a 544 bp genomic region within E8I that becomes accessible only in mature CD8 lineage T cells, as identified by searching the ImmGen ATAC-seq database (22). Results from transgenic reporter gene expression assays strongly indicated that this region represents the core enhancer region of E8I. Furthermore, using genetic loss of function approaches, we demonstrated an essential role for E8I-core in driving the expression of CD8α in IELs, while E8I-core contributes to the maintenance of CD8 expression in activated CD8+ T cells to a lesser extent in comparison to the full-length E8I. This suggests that beside E8I-core other regions within the 7.6kb E8I enhancer are required for the maintenance of CD8 expression in activated CD8+ T cells (Figure 8). Interestingly, the ATAC-seq ImmGen database reveals another open chromatin region upstream of the E8I-core region within E8I, which overlaps with the previously identified ECR-7 (Figure 1) (23). This open chromatin region within E8I is, in addition to DP thymocytes, detected in cytotoxic lineage cells. Thus, ECR-7 might act as an enhancer that maintains CD8 expression in naïve and/or activated cytotoxic T cells and that potentially controls CD8 expression in synergy with E8I-core. Previous transgenic reporter gene expression assays revealed only a marginal enhancer activity of ECR-7 in cytotoxic T cells (11), however its activity upon activation of cytotoxic T cells has not been investigated. It would be therefore interesting to further elucidate the role of ECR-7 by targeting ECR-7 alone and in combination with E8I-core.
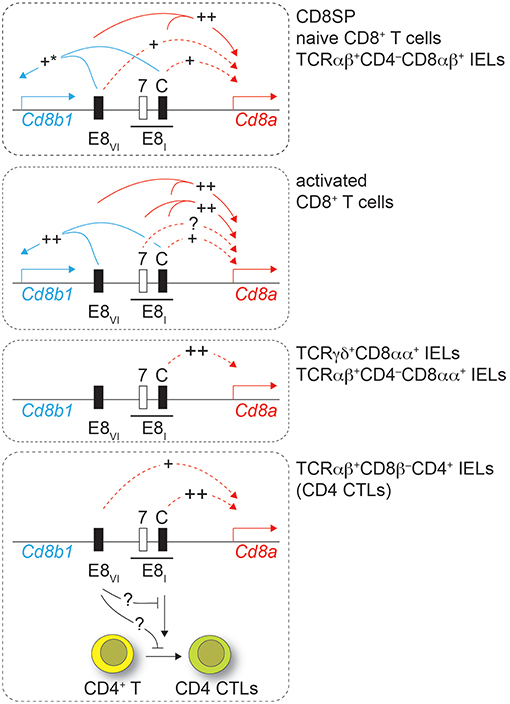
Figure 8. Working model. Drawings depict the Cd8ab1 gene complex (not in scale) in various T cell subsets as depicted on the right. For simplicity, only E8I and E8VI are shown. The black bar above E8I indicates the 7.6 kb genomic region containing the core region of E8I (C) and ECR-7 (7). Solid lines indicate synergy of E8I-core and E8VI as revealed by combined deletion of the respective regions, while dotted lines show the effect of the individual enhancer regions. “++” indicates a strong impact on Cd8 gene expression, while “+” indicates a moderate impact. “+*” in the upper panel indicates a tendency that did not reach statistical significance. Lowest panel: loss of E8I affects also the differentiation of CD4+ T cell into intestinal CD4 CTLs, which is partially reverted upon additional loss of E8VI. See text for more details.
Another interesting aspect with respect to E8I function addresses the activation of E8I during IEL differentiation. TCRαβ+CD8αα+ IELs, in which E8I directs expression, develop from TCRβ+CD5+ DN thymocytes progenitors (40). In order to test whether E8I is already active in the precursor population (despite the lack of CD8α expression), we took advantage of E8I-Cre reporter mice that have been crossed on a Rosa26-stop-YFP reporter allele (E8IRosaYfp) (25). In these mice, the expression of Cre is driven by a 1.6 kb genomic subfragment of E8I, which includes also E8I-core, and that has the same enhancer activity as the initially described 7.6 kb E8I enhancer (13). While TCRβ+CD8αα+ IELs in E8IRosaYfp mice expressed YFP, there were no YFP+ cells within the thymic IEL precursors (Figure S6). This indicates that E8I is not active in thymic TCRαβ+ IEL precursor cells and that E8I must be activated at a later stage of TCRαβ+CD8αα+ IEL differentiation.
In this study, we also characterized the Cd8 enhancer E8VI by using CRISPR/Cas9-mediated gene targeting approaches. In line with our previous transgenic reporter gene expression study that revealed a cytotoxic lineage-specific activity of E8VI (23), the deletion of E8VI led to a reduction in CD8 expression levels in cytotoxic lineage cells. The observed CD8 expression phenotype in the absence of E8VI was rather mild, in part due to the compensatory activity of E8I-core, since the combined deletion of E8VI and E8I-core resulted in a stronger downregulation of CD8 in the cytotoxic lineage compared to the individual deletion of either E8I or E8VI. However, E8I-core−/−E8VI−/− cytotoxic lineage cells still expressed CD8 approximately at half the levels observed in WT cells, suggesting that other known/unknown Cd8 enhancers are active in naïve CD8+ T cells in the absence of E8I and E8VI. Candidate enhancer region(s) might be ECR-7, as discussed above, or E8II, since E8II is active in mature CD8+ T cells (13). We previously demonstrated that loss of both E8I and E8II leads to variegated expression of CD8 expression in DP thymocytes, leading to the development of CD8-negative DP cells. Those E8I,E8II-doubly-deficient DP cells that express CD8 have the potential to develop into CD8+ T cells, however mature cytotoxic lineage T cells in the absence of E8I and E8II display only ~70% of the CD8 levels in comparison to WT CD8+ T cells (34). This demonstrates a role for E8II in mature CD8+ T cells. Targeting of E8II or ECR-7 in mice that lack E8I-core and E8VI is required to address this issue in more detail. Of note, deletion of E8VI did not affect CD8α expression in TCRγδ+ IELs. This is consistent with the observation that the chromatin region surrounding E8VI is not open TCRγδ+ IELs as revealed by ATAC-seq (32) (Figure S7).
E8VI was the first Cd8 enhancer described to direct expression in CD8αα+ DCs (23). However, our current study showed that E8VI−/− CD8αα+ DCs displayed normal CD8 expression. It is likely that this is due to a compensatory activity of other enhancers. Our results further revealed that E8I-core did not compensate for loss of E8VI in DCs, indicating that other enhancers might compensate. Of note, based on the ImmGen ATAC-seq database there is no prominent open chromatin region detectable in the Cd8ab1 gene complex in CD8αα+ DCs, except for a region around the Cd8a promoter (Figure S7). This might indicate a differential regulatory mechanism of CD8α expression in DCs compared to CD8+ T cells. One might speculate that a CD8αα+ DCs precursor requires the activity of known/unknown enhancer(s) during a certain developmental window for the establishment of CD8α expression, and that mature CD8αα+ DCs maintain CD8α expression in an enhancer-independent manner, possibly through epigenetic mechanisms. Further studies including ATAC-seq experiments in DC precursors are required to elucidate the underlying mechanisms for Cd8a gene expression in DCs.
Previous studies indicated an unexpected role for Cd8 enhancer E8I in CD4 lineage T cells. HDAC1 and HDAC2 control the lineage integrity of helper T cells. HDAC1/HDAC2-doubly-deficient CD4+ T cells or WT CD4+ T cells treated with the HDAC inhibitor MS-275 upregulate cytotoxic features, including the expression of CD8, which is dependent on Cd8 enhancer E8I (21). While we confirmed the role of E8I in these CD4 CTLs in this study, loss of E8I-core did not affect the upregulation of CD8 in MS-275-treated CD4+ T cells, indicating that another cis-region, perhaps ECR-7, within E8I is sufficient to induce CD8 in CD4 CTLs. Similarly, MS-275-treated E8VI-deficient CD4+ T cells upregulated CD8, indicating that E8VI is not essential in CD4 lineage T cells for the induction of CD8. However, the regulatory interactions and compensatory pathways among Cd8 enhancers are more complex in CD4+ T cells, since the combined deletion of E8I-core and E8VI led to a reduction in the proportion of MS-275-treated CD4+ T cells that upregulated CD8. This indicates a synergistic activity of E8I-core and E8VI in MS-275-mediated CD8 induction on CD4+ T cells. Moreover, these data indicate that at least three cis-regions contribute to the upregulation of CD8 expression in CD4+ T cells, two within E8I and one within E8VI, and that as long as two of these three regions are present CD8 is upregulated (Figure 8).
Finally, our study also revealed that E8I not only directs the expression of CD8α during the differentiation of CD4+ T cells into CTLs, but also that E8I has an important function during the generation of CD4 CTLs. This conclusion is based on the observation that TCRβ+CD8β−CD4+ IELs contained a reduced population into ThPOKloRunx3hi CD4+ CTLs in the absence of E8I-core (and to a lesser extent also in the absence of E8I). Since we observed ThPOKloRunx3hi CD4 CTLs within TCRβ+CD8β−CD4+ IELs even in the absence of the Cd8a gene, the role of E8I in the differentiation of CD4 CTLs is not directly linked to its enhancer function for CD8 expression. This finding is in line with our recent study showing intact CD4 CTL generation in mice with a severe reduction of CD8αα expression levels in TCRβ+CD8β−CD4+ IEL subsets due to the deletion of introns at the Cd8a locus (Cd8aΔint/Δint) (24). It has been shown that the Cd8ab1 gene complex can physically interact with the Cd4 gene locus and that Cd4 cis-elements influence Cd8 expression. This interaction is mediated in part by E8I and by Runx3, which binds to E8I, while ThPOK antagonized the association of the Cd4 and Cd8ab1 gene loci (41). It is therefore tempting to speculate that a similar mechanism might control CD4 CTL generation. A gene locus essential for CD4 CTL differentiation might require an E8I-mediated interaction with the Cd8ab1 loci for activation, thereby also ensuring co-regulation of Cd8a gene expression with the induction of intestinal CD4 CTLs. Of note, the E8I-mediated association might be antagonized by E8VI, since CD4 CTL generation is restored in E8I,E8VI-doubly-deficient CD4+ T cells. Further studies that include a transcriptome analysis as well as an analysis of the nuclear organization of the Cd8ab1 gene complex in intestinal CD4+ T cells and in CD4 CTLs are required to address the mechanism of how E8I controls the generation of CD4 CTLs.
Taken together, our study demonstrated a complex utilization and interplay of Cd8 enhancers in cytotoxic T cells and in intestinal IELs. Moreover, we revealed that E8I-core controls the generation of intestinal CD4 CTLs by a mechanism independent of its enhancer function for CD8 expression.
Data Availability
The datasets generated for this study are available on request to the corresponding author.
Author Contributions
AFG, TP, PH, MA, CT, and MO performed experiments and analyzed the data; SM and IT generated E8I-core−/−, E8VI−/− and E8I-core−/−E8VI−/− mice and analyzed Cd8a−/− mice; WE designed the research and wrote the manuscript; SS designed the research, performed experiments, analyzed the data and wrote the manuscript.
Funding
SS has been supported by Austrian Science Fund (FWF) projects: P23669 and P27747. WE has been supported by Austrian Science Fund (FWF) projects: P19930, P23641, P29790 and I698. PH is supported by a DOC fellowship of the Austrian Academy of Sciences. Work in the laboratory of IT was supported by JSPS Bilateral Joint Research Projects.
Conflict of Interest Statement
The authors declare that the research was conducted in the absence of any commercial or financial relationships that could be construed as a potential conflict of interest.
Acknowledgments
This work benefited from ATAC-seq data assembled by the ImmGen consortium. We thank the NIH Tetramer Facility for providing PBS57-loaded CD1d-tetramers, Dr. Hilde Cheroutre (La Jolla Institute For Allergy and Immunology, La Jolla, CA, USA) for discussion, Dr. Shinya Oki (Kyushu University, Fukuoka, Japan) for help with the analysis of publically available ATAC-seq data and Dr. Dagmar Stoiber-Sakaguchi (Medical University of Vienna, Vienna, Austria) for critical reading of the manuscript.
Supplementary Material
The Supplementary Material for this article can be found online at: https://www.frontiersin.org/articles/10.3389/fimmu.2019.00409/full#supplementary-material
References
1. Rossjohn J, Gras S, Miles JJ, Turner SJ, Godfrey DI, McCluskey J. T cell antigen receptor recognition of antigen-presenting molecules. Annu Rev Immunol. (2015) 33:169–200. doi: 10.1146/annurev-immunol-032414-112334
2. Singer A, Adoro S, Park JH. Lineage fate and intense debate: myths, models and mechanisms of CD4- versus CD8-lineage choice. Nat Rev Immunol. (2008) 8:788–801. doi: 10.1038/nri2416
3. Carpenter AC, Bosselut R. Decision checkpoints in the thymus. Nat Immunol. (2010) 11:666–73. doi: 10.1038/ni.1887
4. Jarry A, Cerf-Bensussan N, Brousse N, Selz F, Guy-Grand D. Subsets of CD3+ (T cell receptor alpha/beta or gamma/delta) and CD3- lymphocytes isolated from normal human gut epithelium display phenotypical features different from their counterparts in peripheral blood. Eur J Immunol. (1990) 20:1097–103. doi: 10.1002/eji.1830200523
5. Moebius U, Kober G, Griscelli AL, Hercend T, Meuer SC. Expression of different CD8 isoforms on distinct human lymphocyte subpopulations. Eur J Immunol. (1991) 21:1793–800. doi: 10.1002/eji.1830210803
6. Vremec D, Zorbas M, Scollay R, Saunders DJ, Ardavin CF, Wu L, et al. The surface phenotype of dendritic cells purified from mouse thymus and spleen: investigation of the CD8 expression by a subpopulation of dendritic cells. J Exp Med. (1992) 176:47–58.
7. Madakamutil LT, Christen U, Lena CJ, Wang-Zhu Y, Attinger A, Sundarrajan M, et al. CD8alphaalpha-mediated survival and differentiation of CD8 memory T cell precursors. Science. (2004) 304:590–3. doi: 10.1126/science.1092316
8. Ellmeier W, Haust L, Tschismarov R. Transcriptional control of CD4 and CD8 coreceptor expression during T cell development. Cell Mol Life Sci. (2013) 70:4537–53. doi: 10.1007/s00018-013-1393-2
9. Issuree PD, Ng CP, Littman DR. Heritable gene regulation in the CD4:CD8 T cell lineage choice. Front Immunol. (2017) 8:291. doi: 10.3389/fimmu.2017.00291
10. Taniuchi I, Ellmeier W. Transcriptional and epigenetic regulation of CD4/CD8 lineage choice. Adv Immunol. (2011) 110:71–110. doi: 10.1016/B978-0-12-387663-8.00003-X
11. Ellmeier W, Sunshine MJ, Losos K, Hatam F, Littman DR. An enhancer that directs lineage-specific expression of CD8 in positively selected thymocytes and mature T cells. Immunity. (1997) 7:537–47.
12. Hostert A, Tolaini M, Roderick K, Harker N, Norton T, Kioussis D. A region in the CD8 gene locus that directs expression to the mature CD8 T cell subset in transgenic mice. Immunity. (1997) 7:525–36.
13. Ellmeier W, Sunshine MJ, Losos K, Littman DR. Multiple developmental stage-specific enhancers regulate CD8 expression in developing thymocytes and in thymus-independent T cells. Immunity. (1998) 9:485–96.
14. Hostert A, Garefalaki A, Mavria G, Tolaini M, Roderick K, Norton T, et al. Hierarchical interactions of control elements determine CD8alpha gene expression in subsets of thymocytes and peripheral T cells. Immunity. (1998) 9:497–508.
15. Chandele A, Kaech SM. Cutting edge: memory CD8 T cell maturation occurs independently of CD8alphaalpha. J Immunol. (2005) 175:5619–23. doi: 10.4049/jimmunol.175.9.5619
16. Huang Y, Park Y, Wang-Zhu Y, Larange A, Arens R, Bernardo I, et al. Mucosal memory CD8(+) T cells are selected in the periphery by an MHC class I molecule. Nat Immunol. (2011) 12:1086–95. doi: 10.1038/ni.2106
17. Zhong W, Reinherz EL. CD8 alpha alpha homodimer expression and role in CD8 T cell memory generation during influenza virus A infection in mice. Eur J Immunol. (2005) 35:3103–10. doi: 10.1002/eji.200535162
18. Hassan H, Sakaguchi S, Tenno M, Kopf A, Boucheron N, Carpenter AC, et al. Cd8 enhancer E8I and Runx factors regulate CD8alpha expression in activated CD8+ T cells. Proc Natl Acad Sci USA. (2011) 108:18330–5. doi: 10.1073/pnas.1105835108
19. Reis BS, Rogoz A, Costa-Pinto FA, Taniuchi I, Mucida D. Mutual expression of the transcription factors Runx3 and ThPOK regulates intestinal CD4(+) T cell immunity. Nat Immunol. (2013) 14:271–80. doi: 10.1038/ni.2518
20. Mucida D, Husain MM, Muroi S, van Wijk F, Shinnakasu R, Naoe Y, et al. Transcriptional reprogramming of mature CD4(+) helper T cells generates distinct MHC class II-restricted cytotoxic T lymphocytes. Nat Immunol. (2013) 14:281–9. doi: 10.1038/ni.2523
21. Boucheron N, Tschismarov R, Goeschl L, Moser MA, Lagger S, Sakaguchi S, et al. CD4(+) T cell lineage integrity is controlled by the histone deacetylases HDAC1 and HDAC2. Nat Immunol. (2014) 15:439–48. doi: 10.1038/ni.2864
22. Heng TS, Painter MW. The immunological genome project: networks of gene expression in immune cells. Nat Immunol. (2008) 9:1091–4. doi: 10.1038/ni1008-1091
23. Sakaguchi S, Hombauer M, Hassan H, Tanaka H, Yasmin N, Naoe Y, et al. A novel Cd8-cis-regulatory element preferentially directs expression in CD44hiCD62L+ CD8+ T cells and in CD8alphaalpha+ dendritic cells. J Leukoc Biol. (2015) 97:635–44. doi: 10.1189/jlb.1HI1113-597RR
24. Wada H, Yasmin N, Kakugawa K, Ohno-Oishi M, Nieke S, Miyamoto C, et al. Requirement for intron structures in activating the Cd8a locus. Proc Natl Acad Sci USA. (2018) 115:3440–5. doi: 10.1073/pnas.1718837115
25. Maekawa Y, Minato Y, Ishifune C, Kurihara T, Kitamura A, Kojima H, et al. Notch2 integrates signaling by the transcription factors RBP-J and CREB1 to promote T cell cytotoxicity. Nat Immunol. (2008) 9:1140–7. doi: 10.1038/ni.1649
26. Srinivas S, Watanabe T, Lin CS, William CM, Tanabe Y, Jessell TM, et al. Cre reporter strains produced by targeted insertion of EYFP and ECFP into the ROSA26 locus. BMC Dev Biol. (2001) 1:4. doi: 10.1186/1471-213X-1-4
27. Gu H, Zou YR, Rajewsky K. Independent control of immunoglobulin switch recombination at individual switch regions evidenced through Cre-loxP-mediated gene targeting. Cell. (1993) 73:1155–64.
28. Muroi S, Naoe Y, Miyamoto C, Akiyama K, Ikawa T, Masuda K, et al. Cascading suppression of transcriptional silencers by ThPOK seals helper T cell fate. Nat Immunol. (2008) 9:1113–21. doi: 10.1038/ni.1650
29. Tenno M, Kojo S, Lawir DF, Hess I, Shiroguchi K, Ebihara T, et al. Cbfbeta2 controls differentiation of and confers homing capacity to prethymic progenitors. J Exp Med. (2018) 215:595–610. doi: 10.1084/jem.20171221
30. Bilic I, Koesters C, Unger B, Sekimata M, Hertweck A, Maschek R, et al. Negative regulation of CD8 expression via Cd8 enhancer-mediated recruitment of the zinc finger protein MAZR. Nat Immunol. (2006) 7:392–400. doi: 10.1038/ni1311
31. Vremec D, Pooley J, Hochrein H, Wu L, Shortman K. CD4 and CD8 expression by dendritic cell subtypes in mouse thymus and spleen. J Immunol. (2000) 164:2978–86. doi: 10.4049/jimmunol.164.6.2978
32. Semenkovich NP, Planer JD, Ahern PP, Griffin NW, Lin CY, Gordon JI. Impact of the gut microbiota on enhancer accessibility in gut intraepithelial lymphocytes. Proc Natl Acad Sci USA. (2016) 113:14805–10. doi: 10.1073/pnas.1617793113
33. Oki S, Maehara K, Ohkawa Y, Meno C. SraTailor: graphical user interface software for processing and visualizing ChIP-seq data. Genes Cells. (2014) 19:919–26. doi: 10.1111/gtc.12190
34. Ellmeier W, Sunshine MJ, Maschek R, Littman DR. Combined deletion of CD8 locus cis-regulatory elements affects initiation but not maintenance of CD8 expression. Immunity. (2002) 16:623–34. doi: 10.1016/S1074-7613(02)00309-6
35. Feik N, Bilic I, Tinhofer J, Unger B, Littman DR, Ellmeier W. Functional and molecular analysis of the double-positive stage-specific CD8 enhancer E8III during thymocyte development. J Immunol. (2005) 174:1513–24. doi: 10.4049/jimmunol.174.3.1513
36. Hostert A, Tolaini M, Festenstein R, McNeill L, Malissen B, Williams O, et al. A CD8 genomic fragment that directs subset-specific expression of CD8 in transgenic mice. J Immunol. (1997) 158:4270–81.
37. Loots GG, Ovcharenko I. Mulan: multiple-sequence alignment to predict functional elements in genomic sequences. Methods Mol Biol. (2007) 395:237–54. doi: 10.1007/978-1-59745-514-5_15
38. Gorman SD, Sun YH, Zamoyska R, Parnes JR. Molecular linkage of the Ly-3 and Ly-2 genes. Requirement of Ly-2 for Ly-3 surface expression. J Immunol. (1988) 140:3646–53.
39. Cheroutre H, Lambolez F, Mucida D. The light and dark sides of intestinal intraepithelial lymphocytes. Nat Rev Immunol. (2011) 11:445–56. doi: 10.1038/nri3007
40. Ruscher R, Kummer RL, Lee YJ, Jameson SC, Hogquist KA. CD8alphaalpha intraepithelial lymphocytes arise from two main thymic precursors. Nat Immunol. (2017) 18:771–9. doi: 10.1038/ni.3751
Keywords: T cell development, gene regulation, CD8, enhancer, transgenic/knockout mice, cytotoxic T cells, IELs, CD4 CTLs
Citation: Gülich AF, Preglej T, Hamminger P, Alteneder M, Tizian C, Orola MJ, Muroi S, Taniuchi I, Ellmeier W and Sakaguchi S (2019) Differential Requirement of Cd8 Enhancers E8I and E8VI in Cytotoxic Lineage T Cells and in Intestinal Intraepithelial Lymphocytes. Front. Immunol. 10:409. doi: 10.3389/fimmu.2019.00409
Received: 08 October 2018; Accepted: 15 February 2019;
Published: 11 March 2019.
Edited by:
Wanjun Chen, National Institutes of Health (NIH), United StatesReviewed by:
Koji Yasutomo, Tokushima University, JapanAvinash Bhandoola, National Institutes of Health (NIH), United States
Copyright © 2019 Gülich, Preglej, Hamminger, Alteneder, Tizian, Orola, Muroi, Taniuchi, Ellmeier and Sakaguchi. This is an open-access article distributed under the terms of the Creative Commons Attribution License (CC BY). The use, distribution or reproduction in other forums is permitted, provided the original author(s) and the copyright owner(s) are credited and that the original publication in this journal is cited, in accordance with accepted academic practice. No use, distribution or reproduction is permitted which does not comply with these terms.
*Correspondence: Wilfried Ellmeier, wilfried.ellmeier@meduniwien.ac.at
Shinya Sakaguchi, shinya.sakaguchi@meduniwien.ac.at
†Present Address: Caroline Tizian, Institute of Microbiology, Infectious Diseases and Immunology, Charité—University Medicine Berlin, Berlin, Germany
Maria Jonah Orola, Institute of Specific Prophylaxis and Tropical Medicine, Center for Pathophysiology, Infectiology and Immunology, Medical University of Vienna, Vienna, Austria
‡These authors have contributed equally to this work