 Zheng Wei
 Dengju Yao
 Xiaojuan Zhan1,2
- 1School of Computer Science and Technology, Harbin University of Science and Technology, Harbin, China
- 2College of Computer Science and Technology, Heilongjiang Institute of Technology, Harbin, China
More and more studies have proved that microRNAs (miRNAs) play a critical role in gene expression regulation, and the irregular expression of miRNAs tends to be associated with a variety of complex human diseases. Because of the high cost and low efficiency of identifying disease-associated miRNAs through biological experiments, scholars have focused on predicting potential disease-associated miRNAs by computational methods. Considering that the existing methods are flawed in constructing negative sample set, we proposed a clustering-based sampling method for miRNA-disease association prediction (CSMDA). Firstly, we integrated multiple similarity information of miRNA and disease to represent miRNA-disease pairs. Secondly, we performed a clustering-based sampling method to avoid introducing potential positive samples when constructing negative sample set. Thirdly, we employed a random forest-based feature selection method to reduce noise and redundant information in the high-dimensional feature space. Finally, we implemented an ensemble learning framework for predicting miRNA-disease associations by soft voting. The Precision, Recall, F1-score, AUROC and AUPR of the CSMDA achieved 0.9676, 0.9545, 0.9610, 0.9928, and 0.9940, respectively, under five-fold cross-validation. Besides, case study on three cancers showed that the top 20 potentially associated miRNAs predicted by the CSMDA were confirmed by the dbDEMC database or literatures. The above results demonstrate that the CSMDA can predict potential disease-associated miRNAs more accurately.
1 Introduction
MicroRNAs (miRNAs) are a kind of non-coding RNAs with a length of 20–24 nucleotides, which play a critical role in gene expression regulation (Lee et al., 1993; Wightman et al., 1993; He & Hannon, 2004). Accumulating evidences have showed that the dysregulation of miRNA is associated with human complex diseases (Hwang & Mendell, 2006; Mattick & Makunin, 2006; Jonas & Izaurralde, 2015). Wang et al. have proved that the expression level of hsa-mir20b-5p is associated with the pathogenesis of Alzheimer’s disease (Wang et al., 2022). Taverner et al. have proposed that microRNA-425–5p and microRNA-451 can be used as the risk biomarkers of cardiovascular disease (Taverner et al., 2021). Ma et al. have showed that the overexpression of microRNA-10b promotes invasion and metastasis of mammary tumor cells (Ma et al., 2007). Hashimoto et al. have demonstrated that the abnormal expression of miR-1307–3p in human serum is associated with a variety of malignant tumors (Hashimoto et al., 2021). Therefore, accurately identifying disease-associated miRNAs can facilitate the study of the mechanism of miRNA in complex diseases. To guide complex biological experiments, many computational models have been developed for predicting miRNA-disease associations (Chen et al., 2019a).
Thus far, scholars have proposed a series of network-based miRNA-disease association prediction models (Bandyopadhyay et al., 2010). Jiang et al. integrated a human miRNA-phenome network and a miRNA function-related network for predicting disease-associated miRNAs (Jiang et al., 2010). Shi et al. mapped the pathogenic disease genes and miRNA target genes into the protein-protein interaction network, and employed the random walk with restart to identify miRNA-disease associations (Shi et al., 2013). Zeng et al. implemented a structural perturbation approach for miRNA-disease association prediction on a bilayer network which integrated the known miRNA-disease associations and miRNA (disease) similarity network (Zeng et al., 2018). Xiao et al. first calculated the weighted K nearest neighbor profiles of miRNAs and diseases, and then used graph regularized matrix factorization to predict miRNA-disease associations (Xiao et al., 2018). Zhong et al. proposed a global method based on non-negative matrix factorization, which could simultaneously predict all disease-related miRNAs (Zhong et al., 2018). Ma et al. presented a miRNA-disease association prediction model which did not depend on any known miRNA-disease associations (Ma et al., 2019). Li et al. constructed a heterogeneous bilayer network by integrating similarity networks and interaction network, and then utilized the algorithm faster randomized partial matrix completion to infer latent disease-lncRNA associations (Li et al., 2019). Yu et al. proposed a knowledge-driven method to predict disease-miRNA associations (KDFGMDA) (Yu et al., 2022). Based on dynamic neighborhood regularized logistic matrix factorization, Yan et al. proposed a method (DNRLMF-MDA) to predict miRNA-disease associations (Yan et al., 2019). Qu et al. proposed a biased random walk computational method for miRNA-disease association prediction (BRWRMHMDA), which was restarted on multilayer heterogeneous networks (Qu et al., 2021). Jiang and Zhu proposed a model of decision template-based miRNA-disease association prediction (DTMDA) (Jiang & Zhu, 2020).
In recent decades, dozens of miRNA-disease association prediction models based on machine learning have been proposed. One of the major challenges facing these models is how to construct negative samples set. Yao et al. implemented an improved random forest-based model for miRNA-disease association prediction (IRFMDA) which constructed negative samples by randomly combining miRNAs and diseases (Yao et al., 2019). Zhao et al. proposed an adaptive boosting model (ABMDA) which employed the k-means algorithm to cluster the unlabeled samples and selected negative samples randomly from each cluster (Zhao et al., 2019). Zhou et al. designed a miRNA-disease association prediction model based on gradient boosting decision tree and logistic regression (GBDT-LR) which applied the k-means algorithm to cluster the unlabeled samples and extracted negative samples from each cluster by the ratio of the size of each cluster to the entire unlabeled sample set size (Zhou et al., 2020). Li et al. proposed a graph auto-encoder-based miRNA-disease association prediction model (GAEMDA) which randomly selected 5,430 unlabeled samples as negative samples (Li et al., 2021). Chen et al. proposed an anti-noise miRNA-disease association prediction algorithm (ANMDA) which applied the k-means algorithm to cluster the unlabeled samples and selected negative samples equally from each cluster to reduce the noise (Chen et al., 2021). Dai et al. presented a resampling-based ensemble framework (ERMDA) which constructed multiple balanced training subsets by resampling and obtained the final prediction result by soft voting strategy (Dai et al., 2022). Liu et al. proposed a new novel method via deep forest ensemble learning based on autoencoder (DFELMDA) to predict miRNA-disease associations (Liu et al., 2022). Chen et al. presented a model of extreme gradient boosting machine for miRNA-disease association (EGBMMDA), which calculated the statistical measures and matrix factorization results for each miRNA-disease pair to form an information feature vector (Chen et al., 2018). The above methods inevitably introduced potential positive samples into negative sample set, which limited the prediction performance of these models (Rayhan et al., 2017).
In this paper, we proposed a novel clustering-based sampling method for miRNA-disease association prediction (CSMDA) which could construct more reliable negative sample set. Firstly, the CSMDA integrated a variety of similarity information of miRNA and disease to represent the feature vector of miRNA-disease pairs. Secondly, the CSMDA constructed negative sample set based on MiniBatchKMeans clustering to reduce the proportion of potentially positive samples in the negative samples set. Thirdly, the CSMDA generated numerous training subsets through multiple rounds of sampling on the negative sample set to reduce the bias caused by single small-scale sampling. Fourthly, the CSMDA applied a random forest-based feature selection approach to reduce noise and redundant information in the high-dimensional feature space. Finally, a set of base classifiers were trained on the training subsets after feature selection and the final prediction result was obtained by soft voting. The Precision, Recall, F1-score, AUROC and AUPR of the CSMDA achieved 0.9676, 0.9545, 0.9610, 0.9928 and 0.9940 under 5-fold cross-validation, which was significantly higher than that of the existing methods. Besides, case study on three cancers showed that all the top 20 miRNAs predicted to be most likely associated with these cancers by the CSMDA were confirmed by the dbDEMC database or literatures.
2 Materials and methods
2.1 Experimentally confirmed miRNA-disease associations
Experimentally confirmed 5,430 miRNA-disease associations were obtained from the HMDD (Human microRNA Disease Database) (Li et al., 2014), including 495 miRNAs and 383 diseases. Here, we stored these miRNA-disease associations by a matrix
Here,
2.2 Disease semantic similarity
The descriptors of 383 diseases mentioned above were obtained from the MeSH (Medical Subject Headings) database and Directed Acyclic Graphs (DAGs) for each disease were constructed by the previous methods (Wang et al., 2010; Xuan et al., 2013). In a
Here,
Here,
Considering two different diseases in the same layer of a
Similarly, the disease semantic value
Then, the disease semantic similarity between disease
Finally, we combined the above two methods to calculate the disease semantic similarity of disease
2.3 Gaussian interaction profile kernel similarity for diseases
Based on the assumption that miRNAs with similar functions tend to be related to diseases with similar phenotypes (van Laarhoven et al., 2011), Gaussian interaction profile kernel (GIPK) similarity for diseases was introduced to represent the relationship between diseases from another perspective. Here, let
In Eq. 9, parameter
According to the previous study (Chen & Yan, 2013; Chen et al., 2016),
2.4 Integrated similarity of diseases
Since there may be no semantic similarity between two diseases, we integrated semantic similarity and GIPK similarity of disease here. Inspired by previous works (Dai et al., 2022), the integrated disease similarity between
2.5 MiRNA functional similarity
Based on the hypothesis that miRNAs with similar functions tend to be associated with diseases with similar phenotypes, miRNA functional similarity can be calculated (Wang et al., 2010). Here, we directly obtained miRNA functional similarity from the MISIM database (http://www.cuilab.cn/fi les/images/cuilab/misim.zip) and represented them by
2.6 Gaussian interaction profile kernel similarity for miRNAs
Similar to disease, the GIPK similarity between miRNA
Here,
2.7 Integrated similarity of miRNAs
Since there may be no functional similarity between two miRNAs, we integrated the miRNA functional similarity and the GIPK similarity of miRNA
2.8 Sample representation
Here, a miRNA-disease pair was taken as a sample. The feature vector of disease
Similarly, the feature vector of miRNA
Then, the feature vector of a sample (
The method of sample representation is shown in Figure 1.
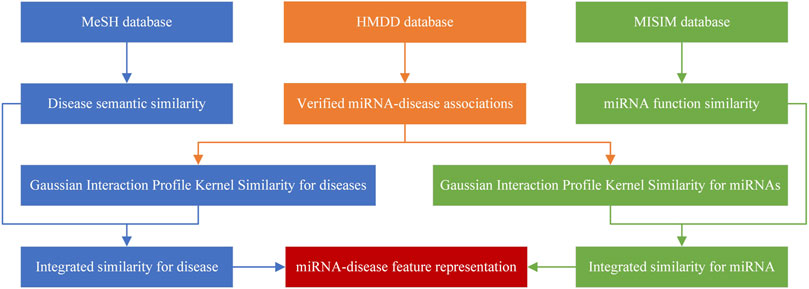
FIGURE 1. The method of sample representation.
2.9 Constructing negative sample set
In this work, the 5,430 experimentally confirmed miRNA-disease associations were taken as positive samples and the 184,155 unverified miRNA-disease pairs as unlabeled samples. Most methods (Yao et al., 2019; Zhao et al., 2019; Zhou et al., 2020; Chen et al., 2021; Li et al., 2021; Dai et al., 2022) of constructing negative sample set are to randomly select some unlabeled samples as negative samples, or apply k-means clustering on the unlabeled samples and sample negative examples from the resulted clusters. However, these methods may introduce potential positive samples into negative sample set and lead to the performance degradation of the trained model (Chen et al., 2021). Here, we proposed a novel and effective method to construct negative sample set from the total sample set. Firstly, we defined the positive sample set
And we defined the total sample set
Secondly, according to the hypothesis that in the total sample set, the smaller the Minkowski distance between the two samples, the more likely they are to be the same kind of samples (Hartigan & Wong, 1979), we clustered
MiniBatchkmeans is an optimization of K-Means algorithm. It uses mini-batches to reduce the amount of computation required to converge to a local solution, thereby reducing the computing time required for clustering the large-scale dataset. To ensure the accuracy of clustering results, we repeated clustering ten times. Then, we denoted the
The proportion of positive samples in the
Thirdly, we ranked all clusters by
Here,
Finally, we defined the
Here,
Then, we constructed the total negative sample set
The number of samples in the negative sample
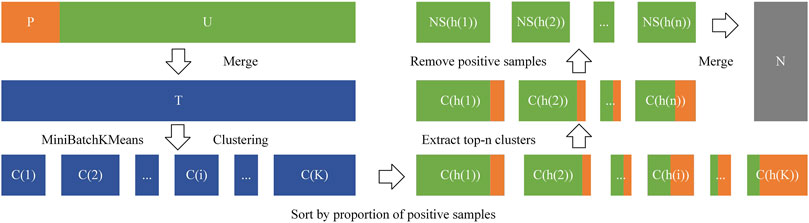
FIGURE 2. The method of constructing a negative sample set.
2.10 Ensemble learning framework
In this work, we implemented an ensemble learning framework for miRNA-disease association prediction. Inspired by the previous research (Chen et al., 2019b; Dai et al., 2020; Sherazi et al., 2021; Wang et al., 2021; Zeng et al., 2021), we built the CSMDA through the following three stages: 1) construct multiple training subsets to increase the diversity of base classifiers by randomly sampling from
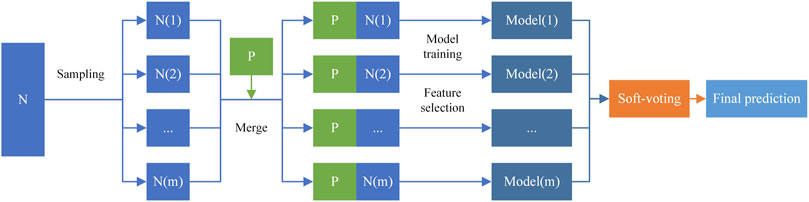
FIGURE 3. Ensemble learning framework.
2.10.1 Constructing training subsets
In this work, we constructed multiple different training subsets and balanced them to improve the prediction performance of the CSMDA. On the one hand, the diversity of subsets makes base classifiers discrepant from each other and improves the generalization ability of the CSMDA. On the other hand, multiple disparate training subsets can make full use of all negative samples. Here, we defined the size of the
2.10.2 Feature selection on each training subset
In the CSMDA, each miRNA-disease feature vector has 878 dimensions, which may contain a large amount of noise and redundant information. Inspired by previous research (Yao et al., 2019; Dai et al., 2022), we performed feature selection based on random forest variable importance score on each training subset. First, we trained a random forest model on each training subset and sorted all features by the variable importance scores which were generated by the random forest. Then, we selected the top
2.10.3 Soft voting strategy
In this work, the Extreme Gradient Boosting (XGBoost) (Chen & Guestrin, 2016) was used as base classifier. Here, let
Here,
3 Results
3.1 Performance evaluation criteria
In this work, we employed five-fold cross-validation to evaluate the performance of the CSMDA. Firstly, we adopted the known 5,430 miRNA-disease association pairs as positive samples and randomly selected an equal number of samples from the negative sample set
The Precision-Recall (PR) curves were obtained by plotting the Precision and Recall rates under different levels of thresholds, and then the area under of PR curve (AUPR) was computed (Saito & Rehmsmeier, 2015). Similarly, the higher the turning point of the PR curve to the upper right, the closer the AUPR is to 1, indicating that the model has a better performance in predicting. The formulae for computing Precision and Recall were as following Eq. 30 and Eq. 31.
Furthermore, F1-Score, as a comprehensive metric, is a toned-down average of precision and recall and is used to balance the effects of precision and recall and evaluate a classifier more comprehensively. In addition, the Accuracy is the result of the correct classification of the response model. The F1-Score and Accuracy can be calculated as Eq. 32 and Eq. 33 as followed.
3.2 Performance analysis of clustering
In constructing the negative sample set, the number of clusters K is the key factor affecting the effectiveness of the final clustering. In this work, the silhouette coefficient (SC) (Rousseeuw, 1987) was adopted as the cluster validity index to evaluate the validity of clustering results with different cluster numbers. The silhouette coefficient is a kind of internal index to judge criteria of clustering result and it is calculated as follows:
Here,
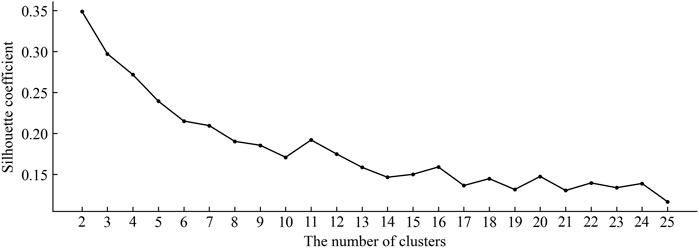
FIGURE 4. The silhouette coefficient of clustering results under different numbers of clusters.
3.3 Performance analysis of base classifier
Base classifier plays an importance role in the prediction performance of the ensemble learning framework. In this work, we compared the performance of four base classifiers: AdaBoost, Random Forest (RF), Extreme Gradient Boosting (XGBoost) and Extremely Randomized Trees (ExtRa Trees). For optimal performance, we optimized the hyper-parameters of each model. The prediction performance of the CSMDA using different base classifiers are listed in Table 1. As one can see, the Precision of the XGBoost is 0.9674, the Recall is 0.9543, the F1-score is 0.9608, the AUROC is 0.9927 and the AUPR is 0.9939. The XGBoost is lower than the RF in terms of Precision, but it is higher than other models in all other metrics. Therefore, the XGBoost was employed in the CSMDA.
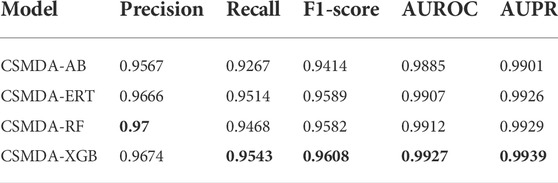
TABLE 1. Performance comparison of the CSMDA using different base classifiers.
3.4 Feature dimension analysis of samples
In the feature selection, according to the variable importance scores, 100, 75, 50, and 25% features were selected from the original feature space to construct the training set, denoted as CSMDA-NOFS, CSMDA-FS75, CSMDA-FS50, and CSMDA-FS25, respectively. Then, we evaluated the prediction performance of the CSMDA with different number of features, and the results were listed in Table 2. As one can see, when the dimension of the training sample is 75% of the length of the original feature vector, the effect of feature selection on improving the performance of the CAMDA is optimum. Therefore, we set the feature dimension of the training set to 75% of the length of the original feature vector. We further analyzed the contribution of miRNA and disease to the feature vector, the distribution of features from miRNAs and diseases among the
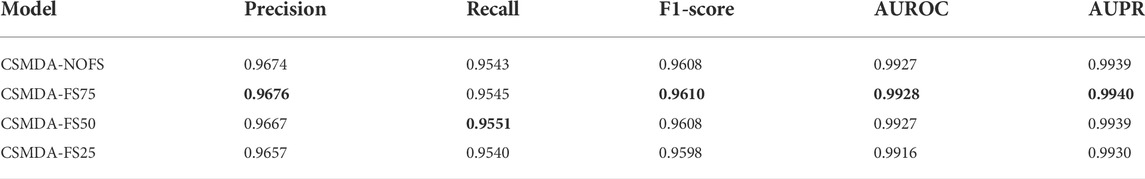
TABLE 2. Performance comparison of the CSMDA under different dimension training samples.
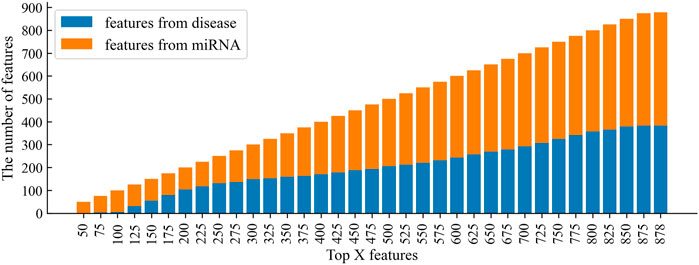
FIGURE 5. The distribution of features from miRNAs and diseases among the top X features.
3.5 Performance comparison between clustering-based sampling method for miRNA-disease association prediction and other miRNA-disease association prediction models
To prove the ability of the CSMDA to predict potential disease-associated miRNAs, we compared it with six state-of-the-art MDA prediction models, including ABMDA (Zhao et al., 2019), ANMDA (Chen et al., 2021), GAEMDA (Li et al., 2021), GBDT-LR (Zhou et al., 2020), IRFMDA (Yao et al., 2019) and ERMDA (Dai et al., 2022). First, the CSMDA and other MDA prediction models constructed negative sample set by their respective methods. Secondly, we used the recommended hyper-parameters for these models. Finally, we performed 500 times five-fold cross-validation for each model. The performance of the above MDA prediction models are shown in Table 3. As one can see, the Precision, Recall, F1-score, AUC and AUPR of the CSMDA is 0.9676 ± 0.0052, 0.9545 ± 0.0059, 0.9610 ± 0.0042, 0.9928 ± 0.0012, and 0.9940 ± 0.0009 respectively, which superior to other methods in all metrics. The results proved the outstanding prediction performance of the CSMDA.
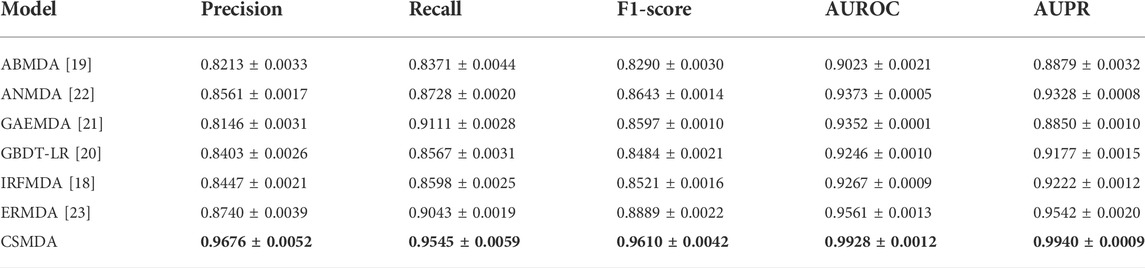
TABLE 3. Performance comparison of the CSMDA with other MDA prediction models.
3.6 Case studies
To prove the application value of the CSMDA in guiding biological experiments, we performed case studies on three common cancers, including breast cancer, colon cancer and lung cancer. Firstly, we combined the 5,430 positive samples verified by the experiment and the 5,430 negative samples randomly selected from the negative sample set
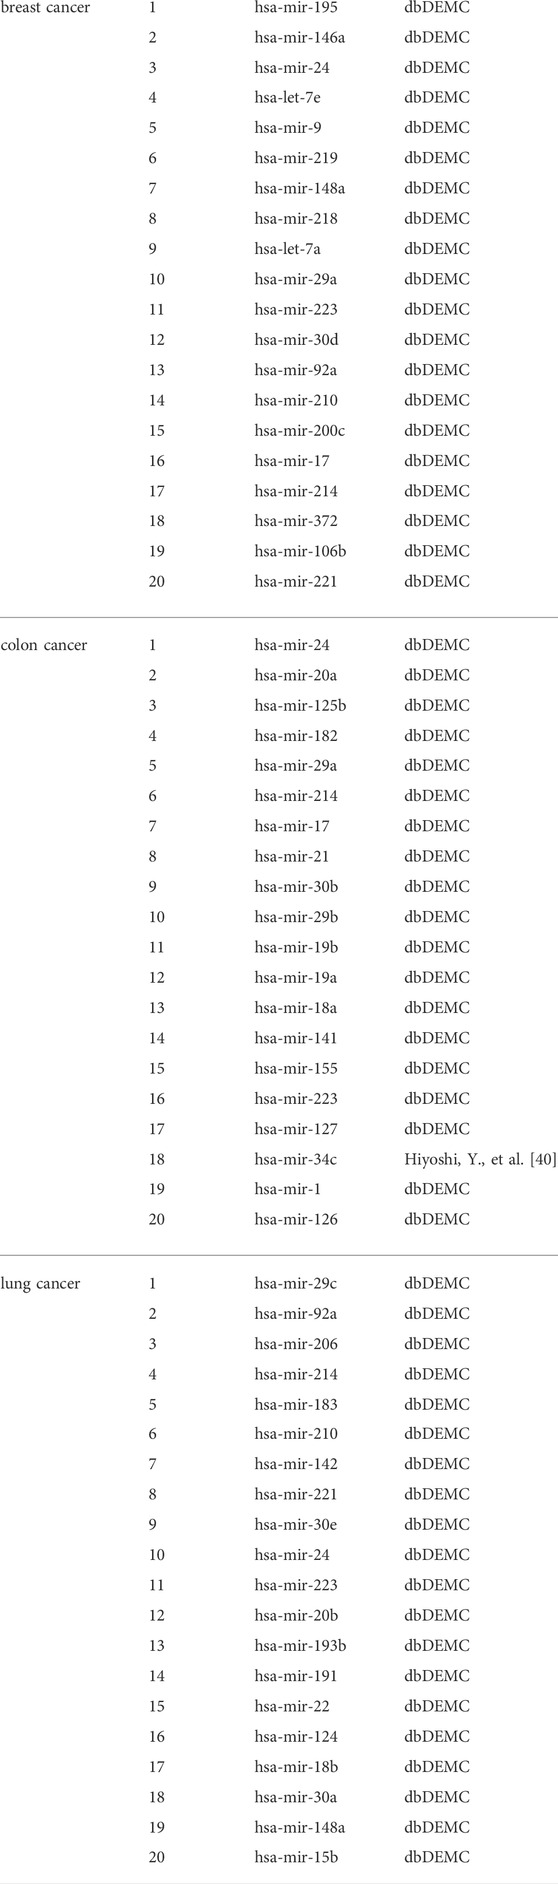
TABLE 4. The top 20 miRNAs for three cancers predicted by the CSMDA.
4 Conclusion
In this work, we presented a clustering-based sampling method for predicting miRNA-disease associations, named CSMDA. Firstly, the CSMDA integrated similarity of disease and miRNA to represent samples. Secondly, the CSMDA implemented an effective clustering-based sampling method to construct negative sample set. Thirdly, the CSMDA employed a random forest-based feature selection method to reduce noise and redundant information in the high-dimensional feature space. Finally, the CSMDA implemented an ensemble learning framework for predicting miRNA-disease associations by soft voting. The experimental results and case studies on the three cancers demonstrate that the CSMDA is a reliable model to predict disease-associated miRNAs. The main contribution of the CSMDA is to propose a new method to construct a more effective negative sample set, which avoids the possibility of introducing potential positive samples into negative sample set as much as possible. The negative sample set constructed by our method not only makes CSMDA perform well, but also improves the performance of other MDA prediction models. However, it should be noted that there are several limitations to the CSMDA. First, it is still inevitable to introduce potential positive samples in the stage of constructing the negative sample set. Second, the clustering algorithm used in the CSMDA is MiniBatchKMeans which showed good clustering effect, but other clustering algorithms may make the negative sample set purer. We will study the clustering effect of other clustering algorithms on the total sample set in the next work. Finally, in current work, the information associated with miRNA and disease is limited, which may result in the essential features that are helpful to identify miRNA-disease associations not being extracted in the CSDMA. In the future, we will integrate more features related to disease and miRNA into the CSMDA. In summary, we hope that the CSMDA can help researchers make breakthroughs in the treatment of complex human diseases at the miRNA level.
Data availability statement
The original contributions presented in the study are included in the article/Supplementary Material, further inquiries can be directed to the corresponding author.
Author contributions
ZW and DY designed the experiments and analyzed the data. ZW performed the experiments. ZW and DY wrote the paper. XZ and SZ reviewed and revised the paper. All authors read and approved the final manuscript.
Funding
This work is supported by the National Natural Science Foundation of China (Grant No. 62172128), the Postdoctoral Research Start Fund of Heilongjiang Province (LBH-Q20098), and the Innovation and Entrepreneurship Training Program for College Students in Heilongjiang Province (s202110214009). The funding body did not play any roles in the design of the study and collection, analysis, and interpretation of data and in writing the manuscript.
Acknowledgments
We would like to thank reviewers for their comments and suggestions.
Conflict of interest
The authors declare that the research was conducted in the absence of any commercial or financial relationships that could be construed as a potential conflict of interest.
Publisher’s note
All claims expressed in this article are solely those of the authors and do not necessarily represent those of their affiliated organizations, or those of the publisher, the editors and the reviewers. Any product that may be evaluated in this article, or claim that may be made by its manufacturer, is not guaranteed or endorsed by the publisher.
References
Bandyopadhyay, S., Mitra, R., Maulik, U., and Zhang, M. Q. (2010). Development of the Human Cancer microRNA Network. Silence 1 (1), 6. doi:10.1186/1758-907x-1-6
Chen, T., and Guestrin, C. (2016). “XGBoost: A Scalable Tree Boosting System,” in Proceedings of the 22nd ACM SIGKDD International Conference on Knowledge Discovery and Data Mining, San Francisco, California, USA. doi:10.1145/2939672.2939785
Chen, X., Huang, L., Xie, D., and Zhao, Q. (2018). EGBMMDA: Extreme Gradient Boosting Machine for MiRNA-Disease Association Prediction. Cell. Death Dis. 9 (1), 3. doi:10.1038/s41419-017-0003-x
Chen, X. J., Hua, X. Y., and Jiang, Z. R. (2021). ANMDA: Anti-noise Based Computational Model for Predicting Potential miRNA-Disease Associations. BMC Bioinforma. 22 (1), 358. doi:10.1186/s12859-021-04266-6
Chen, X., Xie, D., Zhao, Q., and You, Z. H. (2019a). MicroRNAs and Complex Diseases: from Experimental Results to Computational Models. Brief. Bioinform. 20 (2), 515–539. doi:10.1093/bib/bbx130
Chen, X., Yan, C. C., Zhang, X., You, Z. H., Deng, L., Liu, Y., et al. (2016). WBSMDA: Within and between Score for MiRNA-Disease Association Prediction. Sci. Rep. 6, 21106. doi:10.1038/srep21106
Chen, X., and Yan, G. Y. (2013). Novel Human lncRNA-Disease Association Inference Based on lncRNA Expression Profiles. Bioinformatics 29 (20), 2617–2624. doi:10.1093/bioinformatics/btt426
Chen, X., Zhu, C. C., and Yin, J. (2019b). Ensemble of Decision Tree Reveals Potential miRNA-Disease Associations. PLoS Comput. Biol. 15 (7), e1007209. doi:10.1371/journal.pcbi.1007209
Dai, Q., Wang, Z., Liu, Z., Duan, X., Song, J., and Guo, M. (2022). Predicting miRNA-Disease Associations Using an Ensemble Learning Framework with Resampling Method. Brief. Bioinform. 23 (1), bbab543. doi:10.1093/bib/bbab543
Dai, Q., Wang, Z., Song, J., Duan, X., Guo, M., and Tian, Z. (2020). “A Stacked Ensemble Learning Framework with Heterogeneous Feature Combinations for Predicting ncRNA-Protein Interaction”. in 2020 IEEE International Conference on Bioinformatics and Biomedicine (BIBM).
Hajian-Tilaki, K. (2013). Receiver Operating Characteristic (ROC) Curve Analysis for Medical Diagnostic Test Evaluation. Casp. J. Intern Med. 4 (2), 627–635.
Hartigan, J. A., and Wong, M. A. (1979). Algorithm AS 136: A K-Means Clustering Algorithm. Appl. Stat., 28(1), 100–108. doi:10.2307/2346830
Hashimoto, K., Inada, M., Yamamoto, Y., and Ochiya, T. (2021). Preliminary Evaluation of miR-1307-3p in Human Serum for Detection of 13 Types of Solid Cancer Using microRNA Chip. Heliyon 7 (9), e07919. doi:10.1016/j.heliyon.2021.e07919
He, L., and Hannon, G. J. (2004). MicroRNAs: Small RNAs with a Big Role in Gene Regulation. Nat. Rev. Genet. 5 (7), 522–531. doi:10.1038/nrg1379
Hiyoshi, Y., Schetter, A. J., Okayama, H., Inamura, K., Anami, K., Nguyen, G. H., et al. (2015). Increased microRNA-34b and -34c Predominantly Expressed in Stromal Tissues Is Associated with Poor Prognosis in Human Colon Cancer. PloS one 10 (4), e0124899. doi:10.1371/journal.pone.0124899
Hwang, H. W., and Mendell, J. T. (2006). MicroRNAs in Cell Proliferation, Cell Death, and Tumorigenesis. Br. J. Cancer 94 (6), 776–780. doi:10.1038/sj.bjc.6603023
Jiang, L., and Zhu, J. (2020). Review of MiRNA-Disease Association Prediction. Curr. Protein Pept. Sci. 21 (11), 1044–1053. doi:10.2174/1389203721666200210102751
Jiang, Q., Hao, Y., Wang, G., Juan, L., Zhang, T., Teng, M., et al. (2010). Prioritization of Disease microRNAs through a Human Phenome-microRNAome Network. BMC Syst. Biol. 4, S2. doi:10.1186/1752-0509-4-s1-s2
Jonas, S., and Izaurralde, E. (2015). Towards a Molecular Understanding of microRNA-Mediated Gene Silencing. Nat. Rev. Genet. 16 (7), 421–433. doi:10.1038/nrg3965
Lee, R. C., Feinbaum, R. L., and Ambros, V. (1993). The C. elegans Heterochronic Gene Lin-4 Encodes Small RNAs with Antisense Complementarity to Lin-14. Cell. 75 (5), 843–854. doi:10.1016/0092-8674(93)90529-y
Li, W., Wang, S., Xu, J., Mao, G., Tian, G., and Yang, J. (2019). Inferring Latent Disease-lncRNA Associations by Faster Matrix Completion on a Heterogeneous Network. Front. Genet. 10, 769. doi:10.3389/fgene.2019.00769
Li, Y., Qiu, C., Tu, J., Geng, B., Yang, J., Jiang, T., et al. (2014). HMDD v2.0: a Database for Experimentally Supported Human microRNA and Disease Associations. Nucleic Acids Res. 42, D1070–D1074. doi:10.1093/nar/gkt1023
Li, Z., Li, J., Nie, R., You, Z. H., and Bao, W. (2021). A Graph Auto-Encoder Model for miRNA-Disease Associations Prediction. Brief. Bioinform. 22 (4), bbaa240. doi:10.1093/bib/bbaa240
Liu, W., Lin, H., Huang, L., Peng, L., Tang, T., Zhao, Q., et al. (2022). Identification of miRNA-Disease Associations via Deep Forest Ensemble Learning Based on Autoencoder. Brief. Bioinform. 23 (3), bbac104. doi:10.1093/bib/bbac104
Ma, L., Teruya-Feldstein, J., and Weinberg, R. A. (2007). Tumour Invasion and Metastasis Initiated by microRNA-10b in Breast Cancer. Nature 449 (7163), 682–688. doi:10.1038/nature06174
Ma, Y., He, T., Ge, L., Zhang, C., and Jiang, X. (2019). MiRNA-disease Interaction Prediction Based on Kernel Neighborhood Similarity and Multi-Network Bidirectional Propagation. BMC Med. Genomics 12, 185. doi:10.1186/s12920-019-0622-4
Mattick, J. S., and Makunin, I. V. (2006). Non-coding RNA. Hum. Mol. Genet. 1, R17–R29. doi:10.1093/hmg/ddl046
Pedregosa, F., Varoquaux, G., Garmfort, A., Michel, V., Thirion, B., Grisel, O., et al. (2011). Scikit-learn: Machine Learning in python. J. Mach. Learn. Res. 12, 2825–2830.
Qu, J., Wang, C. C., Cai, S. B., Zhao, W. D., Cheng, X. L., and Ming, Z. (2021). Biased Random Walk with Restart on Multilayer Heterogeneous Networks for MiRNA-Disease Association Prediction. Front. Genet. 12, 720327. doi:10.3389/fgene.2021.720327
Rayhan, F., Ahmed, S., Shatabda, S., Farid, D. M., Mousavian, Z., Dehzangi, A., et al. (2017). iDTI-ESBoost: Identification of Drug Target Interaction Using Evolutionary and Structural Features with Boosting. Sci. Rep. 7 (1), 17731. doi:10.1038/s41598-017-18025-2
Rousseeuw, P. J. (1987). Silhouettes: A Graphical Aid to the Interpretation and Validation of Cluster Analysis. J. Comput. Appl. Math., 20, 53–65. doi:10.1016/0377-0427(87)90125-7
Saito, T., and Rehmsmeier, M. (2015). The Precision-Recall Plot Is More Informative Than the ROC Plot when Evaluating Binary Classifiers on Imbalanced Datasets. PloS one 10 (3), e0118432. doi:10.1371/journal.pone.0118432
Sherazi, S. W. A., Bae, J. W., and Lee, J. Y. (2021). A Soft Voting Ensemble Classifier for Early Prediction and Diagnosis of Occurrences of Major Adverse Cardiovascular Events for STEMI and NSTEMI during 2-year Follow-Up in Patients with Acute Coronary Syndrome. PloS one 16 (6), e0249338. doi:10.1371/journal.pone.0249338
Shi, H., Xu, J., Zhang, G., Xu, L., Li, C., Wang, L., et al. (2013). Walking the Interactome to Identify Human miRNA-disease Associations through the Functional Link between miRNA Targets and Disease Genes. BMC Syst. Biol. 7, 101. doi:10.1186/1752-0509-7-101
Taverner, D., Llop, D., Rosales, R., Ferré, R., Masana, L., Vallvé, J. C., et al. (2021). Plasma Expression of microRNA-425-5p and microRNA-451a as Biomarkers of Cardiovascular Disease in Rheumatoid Arthritis Patients. Sci. Rep. 11 (1), 15670. doi:10.1038/s41598-021-95234-w
van Laarhoven, T., Nabuurs, S. B., and Marchiori, E. (2011). Gaussian Interaction Profile Kernels for Predicting Drug-Target Interaction. Bioinformatics 27 (21), 3036–3043. doi:10.1093/bioinformatics/btr500
Wang, C., Ju, Y., Zou, Q., and Lin, C. (2021). DeepAc4C: A Convolutional Neural Network Model with Hybrid Features Composed of Physicochemical Patterns and Distributed Representation Information for Identification of N4-Acetylcytidine in mRNA. Bioinformatics 38, 52–57. doi:10.1093/bioinformatics/btab611
Wang, D., Wang, J., Lu, M., Song, F., and Cui, Q. (2010). Inferring the Human microRNA Functional Similarity and Functional Network Based on microRNA-Associated Diseases. Bioinformatics 26 (13), 1644–1650. doi:10.1093/bioinformatics/btq241
Wang, R., Chopra, N., Nho, K., Maloney, B., Obukhov, A. G., Nelson, P. T., et al. (2022). Human microRNA (miR-20b-5p) Modulates Alzheimer's Disease Pathways and Neuronal Function, and a Specific Polymorphism Close to the MIR20B Gene Influences Alzheimer's Biomarkers. Mol. Psychiatry 27 (2), 1256–1273. doi:10.1038/s41380-021-01351-3
Wightman, B., Ha, I., and Ruvkun, G. (1993). Posttranscriptional Regulation of the Heterochronic Gene Lin-14 by Lin-4 Mediates Temporal Pattern Formation in C. elegans. Cell. 75 (5), 855–862. doi:10.1016/0092-8674(93)90530-4
Xiao, Q., Luo, J., Liang, C., Cai, J., and Ding, P. (2018). A Graph Regularized Non-negative Matrix Factorization Method for Identifying microRNA-Disease Associations. Bioinformatics 34 (2), 239–248. doi:10.1093/bioinformatics/btx545
Xuan, P., Han, K., Guo, M., Guo, Y., Li, J., Ding, J., et al. (2013). Prediction of microRNAs Associated with Human Diseases Based on Weighted K Most Similar Neighbors. PloS one 8 (8), e70204. doi:10.1371/journal.pone.0070204
Yan, C., Wang, J., Ni, P., Lan, W., Wu, F. X., and Pan, Y. (2019). DNRLMF-MDA:Predicting microRNA-Disease Associations Based on Similarities of microRNAs and Diseases. IEEE/ACM Trans. Comput. Biol. Bioinform. 16 (1), 233–243. doi:10.1109/tcbb.2017.2776101
Yang, Z., Wu, L., Wang, A., Tang, W., Zhao, Y., Zhao, H., et al. (2017). dbDEMC 2.0: Updated Database of Differentially Expressed miRNAs in Human Cancers. Nucleic Acids Res. 45, D812–D818. doi:10.1093/nar/gkw1079
Yao, D., Zhan, X., and Kwoh, C. K. (2019). An Improved Random Forest-Based Computational Model for Predicting Novel miRNA-Disease Associations. BMC Bioinforma. 20 (1), 624. doi:10.1186/s12859-019-3290-7
Yu, S., Wang, H., Liu, T., Liang, C., and Luo, J. (2022). A Knowledge-Driven Network for Fine-Grained Relationship Detection between miRNA and Disease. Brief. Bioinform. 23 (3), bbac058. doi:10.1093/bib/bbac058
Zeng, K., Xu, Y., Lin, G., Liang, L., and Hao, T. (2021). Automated Classification of Clinical Trial Eligibility Criteria Text Based on Ensemble Learning and Metric Learning. BMC Med. Inf. Decis. Mak. 21, 129. doi:10.1186/s12911-021-01492-z
Zeng, X., Liu, L., Lü, L., and Zou, Q. (2018). Prediction of Potential Disease-Associated microRNAs Using Structural Perturbation Method. Bioinformatics 34 (14), 2425–2432. doi:10.1093/bioinformatics/bty112
Zhao, Y., Chen, X., and Yin, J. (2019). Adaptive Boosting-Based Computational Model for Predicting Potential miRNA-Disease Associations. Bioinformatics 35 (22), 4730–4738. doi:10.1093/bioinformatics/btz297
Zhong, Y., Xuan, P., Wang, X., Zhang, T., Li, J., Liu, Y., et al. (2018). A Non-negative Matrix Factorization Based Method for Predicting Disease-Associated miRNAs in miRNA-Disease Bilayer Network. Bioinformatics 34 (2), 267–277. doi:10.1093/bioinformatics/btx546
Keywords: miRNA-disease association, ensemble learning, clustering, sampling, computational methods
Citation: Wei Z, Yao D, Zhan X and Zhang S (2022) A clustering-based sampling method for miRNA-disease association prediction. Front. Genet. 13:995535. doi: 10.3389/fgene.2022.995535
Received: 16 July 2022; Accepted: 08 August 2022;
Published: 13 September 2022.
Edited by:
Rui Yin, Harvard Medical School, United StatesReviewed by:
Jia Qu, Changzhou University, ChinaZhanchao Li, Guangdong Pharmaceutical University, China
JunLin Xu, Hunan University, China
Copyright © 2022 Wei, Yao, Zhan and Zhang. This is an open-access article distributed under the terms of the Creative Commons Attribution License (CC BY). The use, distribution or reproduction in other forums is permitted, provided the original author(s) and the copyright owner(s) are credited and that the original publication in this journal is cited, in accordance with accepted academic practice. No use, distribution or reproduction is permitted which does not comply with these terms.
*Correspondence: Dengju Yao, ydkvictory@hrbust.edu.cn