 Hao Li
 ShiQi Zhang
 Lei Chen
 Xiaoyong Pan
 ZhanDong Li
 Tao Huang
 Yu-Dong Cai
- 1College of Biological and Food Engineering, Jilin Engineering Normal University, Changchun, China
- 2Department of Biostatistics, University of Copenhagen, Copenhagen, Denmark
- 3College of Information Engineering, Shanghai Maritime University, Shanghai, China
- 4Institute of Image Processing and Pattern Recognition, Shanghai Jiao Tong University, and Key Laboratory of System Control and Information Processing, Ministry of Education of China, Shanghai, China
- 5Bio-Med Big Data Center, CAS Key Laboratory of Computational Biology, Shanghai Institute of Nutrition and Health, University of Chinese Academy of Sciences, Chinese Academy of Sciences, Shanghai, China
- 6CAS Key Laboratory of Tissue Microenvironment and Tumor, Shanghai Institute of Nutrition and Health, University of Chinese Academy of Sciences, Chinese Academy of Sciences, Shanghai, China
- 7School of Life Sciences, Shanghai University, Shanghai, China
In current biology, exploring the biological functions of proteins is important. Given the large number of proteins in some organisms, exploring their functions one by one through traditional experiments is impossible. Therefore, developing quick and reliable methods for identifying protein functions is necessary. Considerable accumulation of protein knowledge and recent developments on computer science provide an alternative way to complete this task, that is, designing computational methods. Several efforts have been made in this field. Most previous methods have adopted the protein sequence features or directly used the linkage from a protein–protein interaction (PPI) network. In this study, we proposed some novel multi-label classifiers, which adopted new embedding features to represent proteins. These features were derived from functional domains and a PPI network via word embedding and network embedding, respectively. The minimum redundancy maximum relevance method was used to assess the features, generating a feature list. Incremental feature selection, incorporating RAndom k-labELsets to construct multi-label classifiers, used such list to construct two optimum classifiers, corresponding to two key measurements: accuracy and exact match. These two classifiers had good performance, and they were superior to classifiers that used features extracted by traditional methods.
1 Introduction
Protein is a major component associated with the maintenance of normal physical functions in cells (Milo, 2013). As the essential regulator and effector for almost all living creatures with cellular structures, proteins participate in physical biological processes in two major approaches (Aebersold and Mann, 2016). First, proteins contribute to the regulation of essential biological functions. According to recent publications, proteins are associated with various biological processes, including cell proliferation (Üretmen Kagıalı et al., 2017), enzyme-mediated metabolic processes (Davidi and Milo, 2017), DNA replication (Mughal et al., 2019), cell signaling via ligand binding (Hotamisligil and Davis, 2016), and responses to internal or external stimulations (Chivasa and Slabas, 2012), all of which are quite complex and essential functions for living creatures. In addition, proteins can construct basic cellular structures (Aebersold and Mann, 2016), maintain the stability of cellular microenvironment, and participate in the formation of complex macrostructures of living creatures, such as hairs and nails. Considering the significance of proteins for living creatures, their biological functions and related detailed underlying mechanisms have been widely studied as an irreplaceable field in current biological studies.
Different kinds of proteins in humans are generated by 19823 predicted or confirmed protein-coding genes (Beck et al., 2011; Milo, 2013). For mouse, as a widely used experimental model, several proteins are translated from approximately 12300 specific protein-coding genes and their isoforms (Church et al., 2009). Therefore, considering the large number of proteins in humans and mice, exploring protein functions by analyzing all candidate proteins one by one through traditional experiments is impossible. For the systematic study of protein functions, computational methods and databases are introduced. Early in 2004, Ruepp et al. have already presented an effective and simplified annotation scheme for systematic classification of proteins (Ruepp et al., 2004). Using such annotation tools, proteins can be clustered into 24 functional categories. The final summary of these 24 categories is generated by balancing manual operative convenience, categorial specificity, and adaptability for further downstream analyses. Therefore, annotating proteins with these 24 categories may be an efficient and convenient way for the exploration of initial protein function.
However, in the presence of clusters and related annotated proteins, computational methods for classification may also be necessary for further systematic protein function explorations. In 2011, Hu et al. proposed two computational methods, namely, network-based and hybrid-property methods, to identify the functions of mouse proteins among the aforementioned 24 categories (Hu et al., 2011). The final method integrated these two methods in a way that the network-based method was initially applied to make prediction; if this method cannot provide predicted results, then the hybrid-property method would make further prediction. In addition, Huang et al. provided three computational methods for the prediction of mouse protein functions based on the 24 candidate categories (Huang et al., 2016). Considering the biochemical properties of proteins and specific functioning approaches for most proteins via protein–protein interactions (PPI), three methods were presented for functional annotation/prediction: 1) sequence similarity-based prediction, 2) weighted PPI-based prediction, and 3) sequence recoding-based prediction using PseAAC (Shen and Chou, 2008). The two above-mentioned studies all used mouse proteins and their functional categories reported in the Mouse Functional Genome Database (MfunGD, http://mips.gsf.de/genre/proj/mfungd/) (Ruepp et al., 2006). However, the above-mentioned methods were not absolute multi-label classifiers as they can only provide the category sequence. Moreover, determining predicted categories for a query protein remains a problem. This study continued doing some work in this field. Furthermore, Zhang et al. developed I-TASSER/COFACTOR method for neXtProt project to predict GO functions of proteins based on their structures and interactions (Zhang et al., 2018; Zhang et al., 2019). NetGO (https://issubmission.sjtu.edu.cn/ng2/) predicted protein functions by integrating massive sequence, text, domain/family and network information with Naïve GO term frequency, BLAST-KNN, LR-3mer, LR-InterPro, LR-ProFET, Net-KNN, LR-text and Seq-RNN (You et al., 2019; Yao et al., 2021).
This study also adopted mouse proteins and their function annotations reported in MfunGD. For each protein, we extracted features from two aspects. On the one hand, embedding features derived from functional domains of proteins were extracted, which can indicate the essential properties of proteins. The functional domains were retrieved from the InterPro database (Blum et al., 2021), and features were obtained by a natural language processing method, Word2vec (Mikolov et al., 2013; Church, 2017). On the other hand, other embedding features were obtained from a PPI network, which contained the linkage information to other proteins. We used the PPI network reported in STRING (Szklarczyk et al., 2015), and Node2vec (Grover and Leskovec, 2016) was applied to such network to obtain embedding features. Embedding features were collected to represent all mouse proteins. Afterward, a feature selection procedure, including the minimum redundancy maximum relevance (mRMR) method (Peng et al., 2005) and incremental feature selection (IFS) (Liu and Setiono, 1998), was designed to select essential embedding features. These features were inputted to RAndom k-labELsets (RAKEL) (Tsoumakas and Vlahavas, 2007) using a support vector machine (SVM) (Cortes and Vapnik, 1995) or random forest (RF) (Breiman, 2001) as the base classifier to construct the multi-label classifiers. The comparison results indicated that our classifiers were superior to classifiers using traditional protein features.
2 Methods and Materials
This study aimed to predict the functions of mouse proteins. First, we used Word2vec and Node2vec to obtain embeddings of mouse proteins and identify the essential embedding features via the mRMR method. Then, we applied RAKEL, incorporating SVM or RF as the base classifier, to IFS to construct good multi-label classifiers.
2.1 Dataset
The original mouse proteins and their functions were sourced from a previous study (Hu et al., 2011), which were downloaded from MfunGD (Ruepp et al., 2006). The functions of proteins were determined by manual annotation of the literature and GO annotation (Ashburner and Lewis, 2002; Camon et al., 2003). After excluding proteins without functional domain or interaction information, 9655 proteins were obtained. These mouse proteins were further processed by CD-HIT (Fu et al., 2012) with cutoff of 0.4. 6950 mouse proteins were kept. These proteins were classified into 24 functional categories, which are listed in the second column of Table 1. In this table, the number of proteins in each category is also provided (last column of Table 1). The total number of proteins in all categories was 21584, which was higher than the number of different proteins (6950), indicating that several proteins were in more than one category. Among 6950 proteins, 1299 proteins belonged to exact one functional category, whereas others belonged to two or more categories, and no proteins belonged to more than fifteen categories. The distribution of 6950 proteins based on the number of categories that they belonged to is shown in Figure 1. Accordingly, assigning functional labels to mouse proteins was a multi-label classification problem.
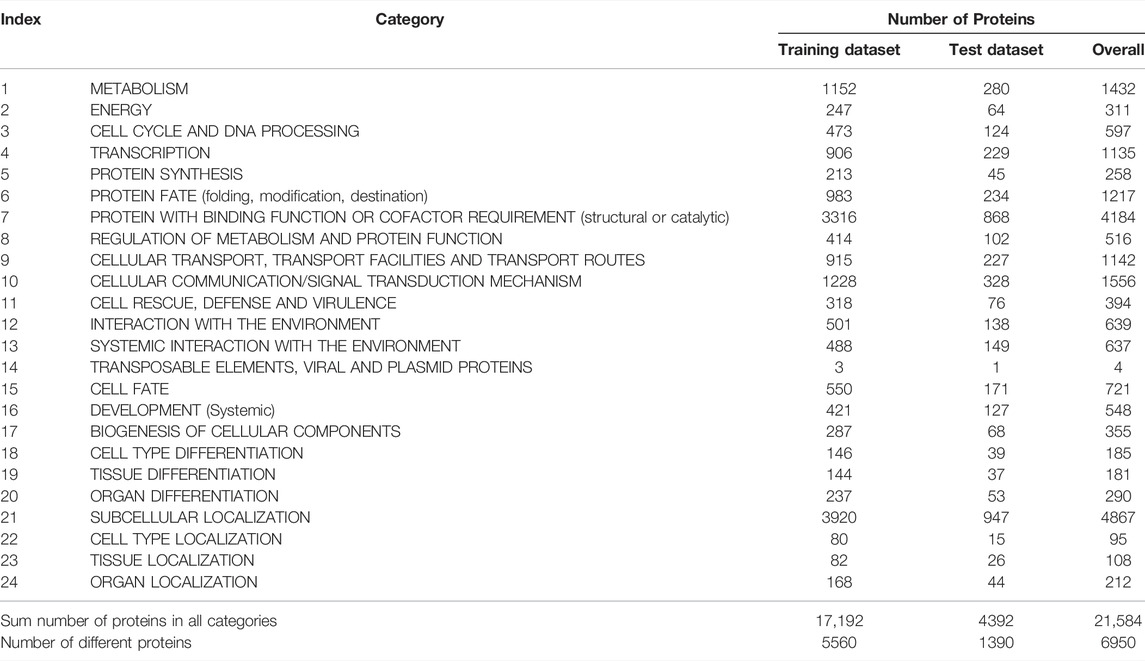
TABLE 1. Number of proteins in each functional category.
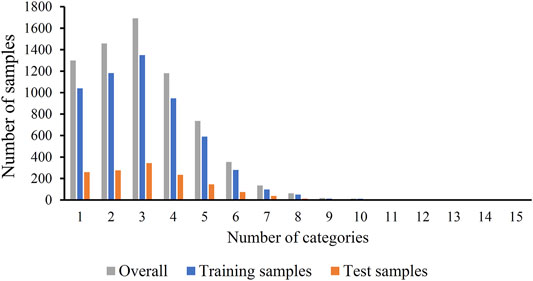
FIGURE 1. Distribution of training, test and overall samples based on the number of categories that they belong to. Several samples belong to two or more categories.
To fully evaluate the final classifiers, 6950 proteins were divided into one training dataset and one test dataset, where the training dataset contained 5560 (80%) mouse proteins and the test dataset consisted of 1390 (20%) proteins. The distribution of proteins in training and test datasets based on the number of categories that they belonged to is shown in Figure 1. For convenience, the training and test datasets were denoted as Str and Ste, respectively. The number of proteins in Str and Ste for each functional category is also listed in Table 1.
2.2 Feature Extraction
In this study, a novel feature representation scheme was presented to encode each mouse protein. This scheme extracted two types of embedding features. The first type of features was derived from functional domains of proteins, whereas the second one was obtained from a PPI network.
2.2.1 Features Derived From a Functional Domain Using Word2vec
Functional domain is a type of information, which is widely used to study various protein-related problems (Cai and Chou, 2005; Xu et al., 2008; Chen et al., 2010; Zhou et al., 2017). One-hot is the classic scheme to extract features from the functional domain. In such scheme, each protein was encoded into a binary vector. However, the model based on features obtained by this scheme was quite sensitive to some domains. Here, we adopted natural language processing to extract features. The functional domain information of all mouse proteins was retrieved from the InterPro database (http://www.ebi.ac.uk/interpro/, October 2020) (Blum et al., 2021). A total of 16,797 domains were involved. Each mouse protein was annotated by at least one domain. Domains were regarded as words and proteins annotated by some domains as sentences. Word2vec (Mikolov et al., 2013; Church, 2017) was used to obtain embedding features of each domain. Its brief description was shown as follows.
Word2vec was widely used to generate word embeddings in natural language processing. It established the mapping of words to part-of-speech relationships and converted words into fixed-length real-valued vectors. The similarity of the words can be measured and characterized by the similarity of vector space. When using Word2vec, the word vector and sentence vector of features must be calculated. The probability of feature
where
The sentence vector of sentence j in category n is given as follows:
where
The feature, whose distance value was within the scale, can be selected on the basis of the ratio of feature selection to achieve the purpose of screening and distinguishing multiple categories.
This study used the Word2vec program reported in genism (https://github.com/RaRe-Technologies/gensim). This program was performed with its default parameters. As mentioned previously, each domain was called as a word. Thus, by applying the Word2vec program, a 256-D feature vector was assigned to each domain. The feature vector of a mouse protein was defined as the average vector of feature vectors of domains, which was annotated on such protein. For convenience, such features were called domain embedding features.
2.2.2 Features Derived From a Protein–Protein Interaction Network Using Node2vec
The above-mentioned embedding features of proteins were extracted from the essential properties of proteins. They cannot reflect the relationship among proteins. Recently, several network embedding algorithms, such as DeepWalk (Perozzi et al., 2014), Node2vec (Grover and Leskovec, 2016), and Mashup (Cho et al., 2016), have been proposed, which can abstract linkages in one or more networks and obtain a feature vector for each node. Features accessed in this way contained quite different information from those derived from essential properties of samples. The combination of these two types of features may fully represent each sample. To date, several models with features derived by network embedding algorithms have been set up to investigate different biological problems (Luo et al., 2017; Zhao et al., 2019; Zhou JP. et al., 2020; Pan et al., 2021a; Pan et al., 2021b; Liu et al., 2021; Zhu et al., 2021; Yang and Chen, 2022). In this study, we selected Node2vec to extract embedding features of pdsluroteins.
A network was necessary to execute Node2vec. Here, we used the PPI network reported in STRING (version 10.0) (Szklarczyk et al., 2015). The PPI information of mouse was first downloaded from STRING. Each PPI contained two proteins, encoded by Emsenbl IDs, and one confidence score. Such score was obtained by investigating several aspects of proteins, such as close neighborhood in genomes, gene fusion, occurrence across different species, gene coexpression, literature description, etc. Thus, it can widely assess the relationship among proteins. Accordingly, the PPI network used proteins as nodes, and two nodes were connected by an edge if and only if their corresponding proteins can constitute a PPI that had a confidence score larger than 0. Furthermore, we placed weight on each edge, which was defined as the confidence score of the corresponding edge. The PPI network contained 20684 nodes and 2849682 edges.
Node2vec was applied to the above-mentioned PPI network to obtain embedding features of proteins. Node2vec can be deemed as a network version of Word2vec. It produced several paths by setting each node in the network as the starting point. Each path was extended by considering the neighbors of the current end point. After generating a predefined number of paths, the nodes in each path were called as words, whereas each path was considered as a sentence. A feature vector was obtained for each node through Word2vec.
In this study, we used the Node2vec program downloaded from https://snap.stanford.edu/node2vec/. For convenience, default parameters were used. Such program was performed on the mouse PPI network. The dimension was set to 500. Finally, each mouse protein was represented by a 500-D feature vector. Features derived from PPI network via Word2vec were called network embedding features.
By combining the domain and network embedding features derived from functional domains of proteins and a PPI network, a 756-D feature vector was obtained to represent each mouse protein.
2.3 Feature Selection
The embedding features obtained by Word2vec and Node2vec were concatenated as the final representation of a protein. We obtained a 756-D vector for each protein. Evidently, some features may be important for assigning functional labels to mouse protein, whereas others were not. Therefore, using a feature selection procedure is necessary to screen out essential features. As several proteins had two or more functional labels, that is, they belonged to two or more functional categories, the original dataset, in which samples were assigned to multiple labels, was transformed into a new dataset in the following manner. If one sample had multiple labels, then this sample would be copied multiple times with different single labels. Then, each sample in the new dataset had only one label.
2.3.1 Minimum Redundancy Maximum Relevance
All features were analyzed by the mRMR method (Peng et al., 2005). Such method evaluated the importance of features by assessing their relevance to class labels and redundancies to other features. A feature list, known as the mRMR feature list, was produced by the mRMR method. This list was produced by selecting features one by one. Initially, the list was empty. A feature with maximum relevance to class labels and minimum redundancies to features already in the list was selected and appended to the list. When all features were in the list, the procedures stopped. Evidently, features with high ranks implied that they had high relevance to class labels and low redundancies to other features. Thus, some top features in such list can comprise a compact feature space for a certain classification algorithm.
The current study used the mRMR program downloaded from http://penglab.janelia.org/proj/mRMR/. It was performed with its default parameters.
2.3.2 Incremental Feature Selection
The mRMR method only generated a feature list. However, selecting the features for constructing the model remained a challenge. Here, IFS (Liu and Setiono, 1998) was used.
Given a feature list (e.g., mRMR feature list), IFS constructed all possible feature subsets. Each subset included some top features in the list. Of each feature subset, a classifier was set up and assessed by a cross-validation method (Kohavi, 1995). The feature subset with the best performance can be obtained. Features in such subset were called optimum features, whereas the classifier using these features was called the optimal classifier.
2.4 Multi-Label Classifier
As mentioned in Section 2.1, several proteins were in multiple functional categories. A multi-label classifier should be constructed to assign mouse proteins into functional categories. In general, two schemes were used to construct multi-label classifiers. The first one was problem transformation. It converted the original multi-label classification problem into some single-label classification problems. The second one was algorithm adaption. It extended specific single-label classifiers to deal with multi-label classification problems. This study adopted the first one to construct the multi-label classifier.
The powerful multi-label classification method, RAKEL (Tsoumakas and Vlahavas, 2007), was used to construct the multi-label classifier. Given a problem containing l labels (l=24 in this study), denoted by
This study used “RAkEL” in Meka (http://waikato.github.io/meka/) (Read et al., 2016). Such tool obtained by the RAKEL method was used to construct multi-label classifiers. The parameters m and k were all set to 10.
2.5 Base Classifiers
In this study, RAKEL was used to construct the multi-label classifier. It needed a base classifier to construct multiple single-label classifiers, which would be integrated into the final multi-label classifier. Here, two classic base classifiers, namely, SVM (Cortes and Vapnik, 1995) and RF (Breiman, 2001), were used, which were widely applied in tackling many biological problems (Kandaswamy et al., 2011; Nguyen et al., 2015; Chen et al., 2017; Zhou JP. et al., 2020; Zhou J.-P. et al., 2020; Liang et al., 2020; Liu et al., 2021; Onesime et al., 2021; Wang et al., 2021; Zhu et al., 2021; Chen et al., 2022; Ding et al., 2022; Li et al., 2022; Wu and Chen, 2022).
2.5.1 Support Vector Machine
SVM was a supervised learning method using statistical learning theory. It can find an optimum hyperplane, which has a maximum margin between the two types of samples, in the N-dimensional space (N represented the number of features) using a Kernel technology (such as a Gaussian kernel), which can map data points to a given category for data classification prediction. The generalization error gradually decreased as the margin increased. A “one-to-one” strategy of SVM corresponded to the binary problem. When the problem extended to multiple classes, the strategy of SVM also changed to a “one-versus-the-rest” strategy.
This study used tool “SMO” integrated in Meka, which implemented a type of SVM. Moreover, this SVM was optimized by Sequential Minimization Optimization (SMO) algorithm (Platt, 1998). Default parameters were adopted. The kernel was a polynomial function and the regularization parameter C was set to 1.
2.5.2 Random Forest
RF was a classic classifier used to process classification and regression problems, which was a general machine learning algorithm widely used in bioinformatics. It contained several decision tree classifiers, and subtle differences can be observed among these decision trees. RF determined its output class by aggregating votes produced by different decision trees. Compared with the decision tree, RF can avoid the overfitting problem and improve the performance.
Likewise, this study used the “RandomForest” tool integrated in Meka, which implemented RF. For convenience, default parameters were used, where the number of decision trees was set to 100.
2.6 Performance Measurement
K-fold cross-validation (Kohavi, 1995) is a widely used method to assess the performance of classifiers. In this method, samples are randomly and equally divided into K partitions. One partition is singled out as test dataset one by one, which is used to test the performance of classifier based on rest partitions. Accordingly, each sample is tested only once. The comparison of predicted labels and true labels can lead to some measurements to indicate the performance of classifiers. In this study, we selected 10-fold cross-validation to test all multi-label classifiers.
After the 10-fold cross-validation, each sample was assigned with one or more labels. Some measurements can be computed to assess the predicted results. As a multi-label classifier, accuracy and exact match were the widely used measurements (Zhou JP. et al., 2020; Zhou J.-P. et al., 2020; Pan et al., 2021b; Chen et al., 2021; Tang and Chen, 2022). They can be calculated using the following equations:
where n stands for the number of samples;
Evidently, the higher the accuracy or exact match, the higher the performance.
3 Results and Discussion
In this study, some novel multi-label classifiers were proposed to identify the functions of mouse proteins. The entire procedures are shown in Figure 2. In this section, we provided the detailed results of all procedures and made some comparisons to elaborate the unity of the classifier.
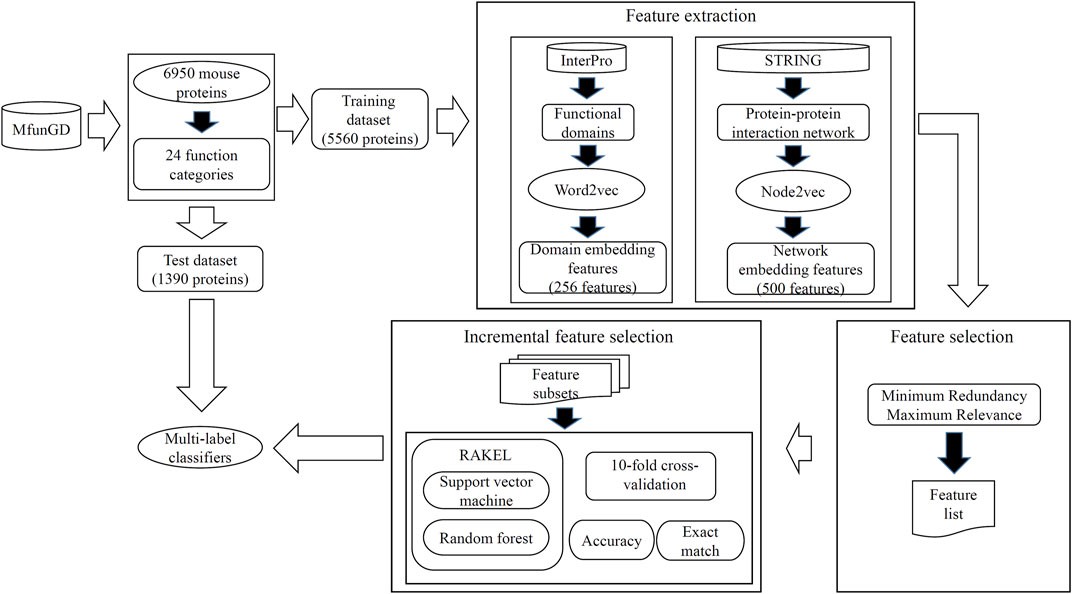
FIGURE 2. Entire procedures to construct the multi-label classifiers for predicting functions of mouse proteins. Mouse proteins and their function annotations are retrieved from MfunGD. These proteins are randomly divided into one training dataset and one test dataset. Embedding features were derived from protein functional domains and protein–protein interaction network through Word2vec and Node2vec, respectively. A feature selection procedure is used to analyze embedding features, and essential features are fed into RAKEL to construct the multi-label classifiers. Proteins in the test dataset are fed into these classifiers to further evaluate their performance.
3.1 Results of the mRMR Method on Training Dataset
Each protein in Str was represented by 756 embedding features. These features were analyzed by the mRMR method, resulting in a feature list, which is called the mRMR feature list. This list is provided in Supplementary Table S1.
3.2 Results of IFS on Training Dataset
Based on the mRMR feature list provided in Supplementary Table S1, IFS was used to construct several feature subsets and set up a multi-label classifier on each feature subset. Each multi-label classifier was set up with RAKEL, and the SVM or RF was selected as the base classifier. 10-fold cross-validation was used to assess the performance of each classifier. The predicted results were assessed by calculating the accuracy and exact match, as mentioned in Section 2.6, which are available in Supplementary Table S2. Some IFS curves are plotted in Figure 3 to show the performance of multi-label classifiers with different base classifiers and feature subsets, where the X-axis represented the number of features, and the Y-axis represented the accuracy or exact match.
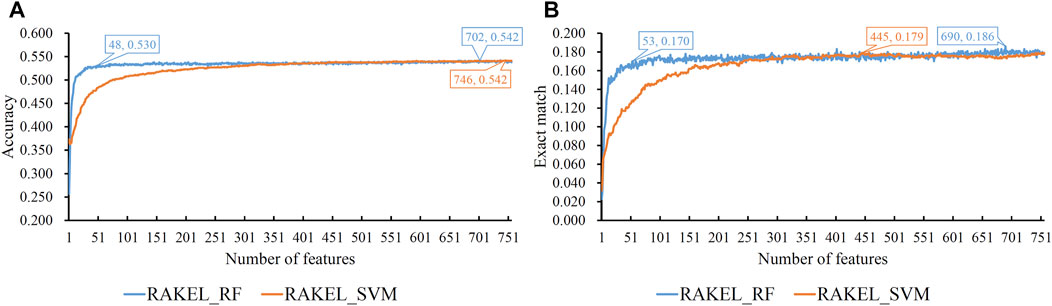
FIGURE 3. IFS curves on embedding features using different classification methods. (A) Accuracy is set to the Y-axis. (B) Exact match is set to the Y-axis. RAKEL_RF/RAKEL_SVM indicates that RAKEL with RF/SVM as the base classifier is used to construct the multi-label classifiers.
As shown in Figure 3A, when the base classifier was RF, the highest accuracy was 0.542, which was produced by using the top 702 features in the list. Thus, we can construct an optimum multi-label classifier with these features and RF. As for another base classifier SVM, the highest accuracy was also 0.542, which was produced by using the top 746 features. An optimum multi-label classifier with SVM can be built using these features. Above two optimum classifiers provided the same accuracy. However, the exact match of the classifier with RF was 0.182 and that of the classifier with SVM was 0.179. Accordingly, the optimum multi-label classifier with RF can be deemed to be superior to the optimum multi-label classifier with SVM. When accuracy was used as the key measurement, we can construct a multi-label classifier using the top 702 features and RF. However, the efficiency of such classifier was not very high because lots of features were involved in such classifier. From Figure 3A, we can see that the IFS curve of RF followed a sharp increasing trend when a few features were used. It can quickly provide a quite high accuracy using much less features than SVM. By carefully checking accuracy listed in Supplementary Table S2 and Figure 3A, we can find that when top 48 features were adopted, the classifier with RF can yield the accuracy of 0.530, which was only a little lower than that of the optimum classifier. Such classifier can be picked up as a tool to predict functions of query mouse proteins.
For the exact match, two IFS curves corresponding to two different base classifiers are plotted in Figure 3B, from which we can see that the base classifier RF generated the highest exact match of 0.186 when the top 690 features were used, whereas SVM yielded the highest exact match of 0.179 when the top 445 features were used. Evidently, the best multi-label classifier with RF was superior to the best multi-label classifier with SVM when exact match was regarded as the key measurement. Accordingly, we can construct a multi-label classifier using the top 690 features and RF. The same problem also existed for such classifier, i.e., low efficiency. It can be observed from Figure 3B that the IFS curve of RF was quite similar to that in Figure 3A. The increasing trend was much sharper at the beginning of the curve than that of IFS curve of SVM. This meant that RF can provide a high exact match using a small number of features. When top 53 features were used, the classifier with RF can produce exact match of 0.170, which was a little lower than that of the best multi-label classifier with RF. Accordingly, such classifier can be an efficient tool to identify functions of mouse proteins.
As previously mentioned, different key measurements can lead to different multi-label classifiers. For different prediction purposes, users can select the key measurement and use the corresponding classifier. The performance of above-mentioned classifiers is listed in Tables 2, 3.
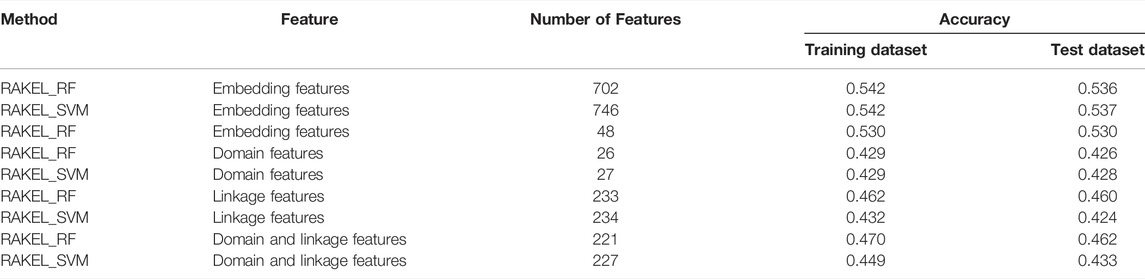
TABLE 2. Accuracy of the important multi-label classifiers with different features on training and test datasets.
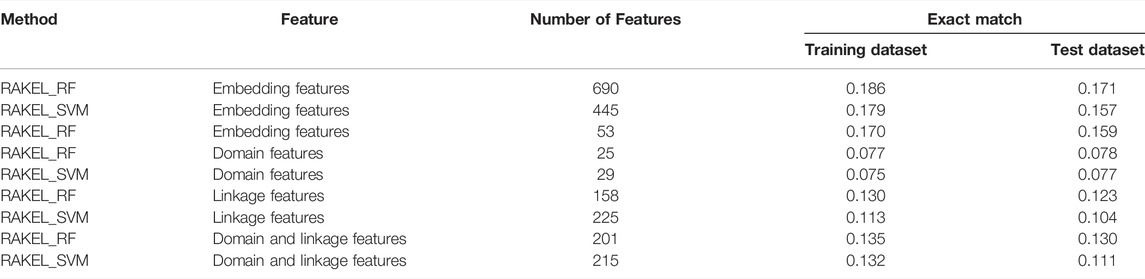
TABLE 3. Exact match of the important multi-label classifiers with different features on training and test datasets.
3.3 Distribution of Embedding Features Used in Two Efficient Classifiers
Two efficient classifiers were constructed as mentioned above, which can be efficient tools for identification of protein functions. 48 and 53 embedding features were involved in these two classifiers, respectively. Their distributions on domain and network embedding features are shown in Figure 4. For the classifier with 48 features, 13 were domain embedding features, whereas 35 were network embedding features. As for that with 53 features, similar results can be observed (14 for domain embedding features and 39 for network embedding features). These results indicated that network embedding features gave more contributions for constructing two classifiers. However, domain embedding features were also important. Their combination was one important reason why these two classifiers yielded such good performance.
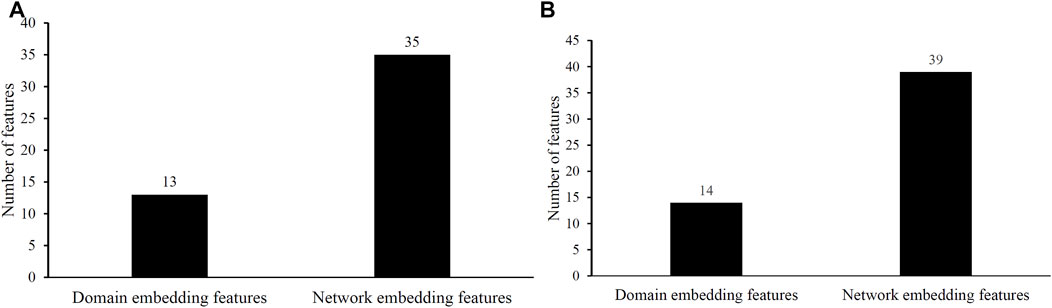
FIGURE 4. Distribution of embedding features used in two efficient classifiers. (A) Distribution of embedding features used in the classifier selected by accuracy. (B) Distribution of embedding features used in the classifier selected by exact match.
3.4 Performance of Classifiers on Test Dataset
Based on accuracy and exact match, three multi-label classifiers were built, respectively. These classifiers were further evaluated on Ste. Their performance is listed in Tables 2, 3. For the three classifiers selected by accuracy, the optimum classifiers with RF or SVM yielded the accuracies of 0.536 and 0.537 (Table 2), respectively, which were slightly lower than those on Str. The accuracy of the efficient classifier with RF produced the accuracy of 0.530 (Table 2), same as that on Str. These results indicated that the generalization of these classifiers was quite good. As for the three classifiers selected by exact match, they provided exact match values of 0.171, 0.157 and 0.159 (Table 3), respectively. They were lower than those on Str. However, the decrease was in an acceptable range. Thus, the generalization of these classifiers was also satisfied.
3.5 Comparison With Other Classifiers
In this study, we adopted a novel set of features to represent each mouse protein and constructed some multi-label classifiers to predict their functions. This section adopted some classic features to construct the classifiers and make some comparisons.
Two types of embedding features were used in this study. They were derived from the protein functional domain and PPI network. For the protein functional domain, the classic usage of encoding proteins was the one-hot scheme. In detail, a protein was encoded into a binary vector under such scheme. Each domain was used as a dimension, and the component was set to one if the protein had the corresponding domain annotation; otherwise, the component was set to zero. Here, 16797 domains were involved, inducing a 16797-D binary vector for each mouse protein. For an easy description, these features were called as domain features in this study. As for the PPI network, such information can be directly used by selecting all linkages between a protein and all proteins in the network and collecting them in a vector to encode the protein. Accordingly, each mouse protein was represented by a 20684-D vector, as 20684 proteins were found in the PPI network. These features were called as linkage features. Each mouse protein was represented by domain features or linkage features or both of them, inducing three representations of proteins. We investigated the performance of classifiers on each protein representation.
As previously mentioned, proteins were represented by lots of features in each representation. A feature selection procedure was necessary. However, given the large number of features, we first adopted Bortua (Kursa and Rudnicki, 2010; Zhang et al., 2021) to exclude irrelevant features. 37 and 243 features were selected by Bortua for domain and linkage feature representations, respectively. When domain and linkage features were combined together to encode mouse proteins, 236 features were kept by Bortua. Then, these remaining features were evaluated by the mRMR method, resulting in an mRMR feature list for each representation. IFS was used to construct optimum multi-label classifiers for accuracy and exact match. We still used RAKEL to construct the classifiers, and SVM or RF was selected as the base classifier. The IFS results are provided in Supplementary Tables S3-S5. Likewise, some IFS curves are plotted in Figures 5–7.

FIGURE 5. IFS curves on domain features using different classification methods. (A) Accuracy is set to the Y-axis. (B) Exact match is set to the Y-axis. RAKEL_RF/RAKEL_SVM indicates that RAKEL with RF/SVM as the base classifier is used to construct the multi-label classifiers.
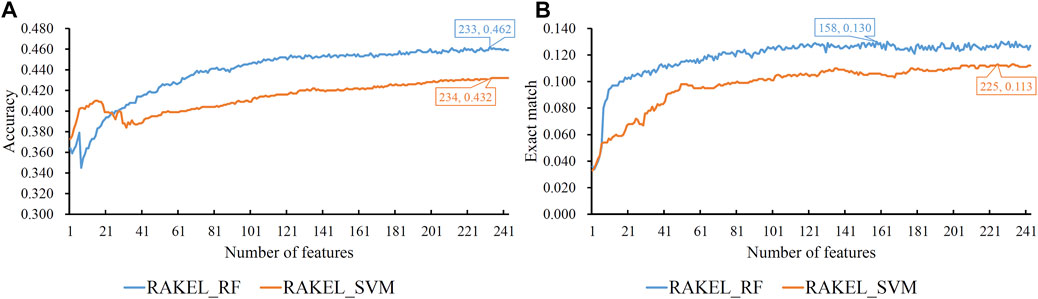
FIGURE 6. IFS curves on linkage features using different classification methods. (A) Accuracy is set to the Y-axis (B) Exact match is set to the Y-axis. RAKEL_RF/RAKEL_SVM indicates that RAKEL with RF/SVM as the base classifier is used to construct the multi-label classifiers.
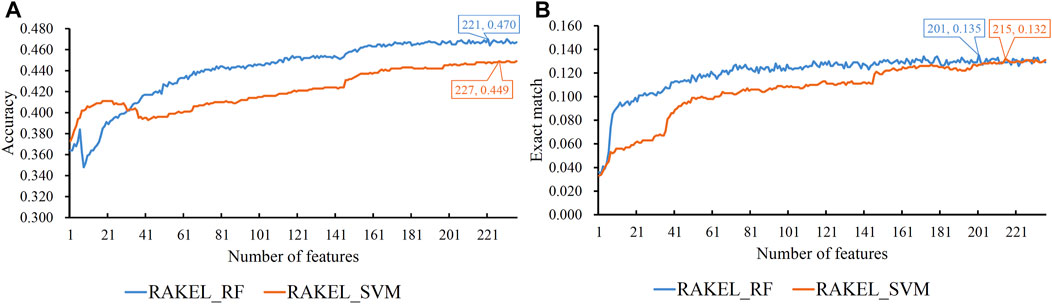
FIGURE 7. IFS curves on domain and linkage features using different classification methods. (A) Accuracy is set to the Y-axis. (B) Exact match is set to the Y-axis. RAKEL_RF/RAKEL_SVM indicates that RAKEL with RF/SVM as the base classifier is used to construct the multi-label classifiers.
The best accuracies for different base classifiers on Str are listed in Table 2, in which those obtained by embedding features are also provided. When the base classifier was RF, the accuracies obtained by domain features, linkage features and both of them were all lower than 0.5, which were much lower than those of the classifiers on embedding features. Furthermore, the base classifier (SVM) yielded similar results (see Table 2). As for the exact match, the best values for different base classifiers are listed in Table 3, in which those obtained by embedding features are also listed. Evidently, the exact match obtained by embedding features was also higher than that obtained by domain features or linkage features or both of them regardless of the base classifier used (RF or SVM). The improvement was at least 3%. Furthermore, from Tables 2, 3, the classifiers with embedding features also yielded better performance on test dataset Ste than those with domain features or linkage features or both of them. All above results indicated that the novel features used in this study were more efficient than the features produced by traditional methods in predicting protein functions. In addition, it can be observed from Tables 2, 3 that when domain and linkage features were combined to represent proteins, the classifiers were always better than those only using domain features or linkage features. This fact indicated that combination of the domain and network information of proteins can improve the performance of classifiers. These two types of information can complement each other in predicting functions of proteins.
4 Conclusion
In this paper, we proposed some multi-label classifiers to predict the functions of mouse proteins. These classifiers adopted novel features, which were derived from protein functional domains and the PPI network via word embedding and network embedding, respectively. The performance of the classifiers was better than those using features extracted by traditional methods, thereby indicating that the novel features have stronger discriminative power. Therefore, the newly proposed classifiers can be used to predict protein functions, and such novel features can be used to tackle other protein-related problems.
Data Availability Statement
Publicly available datasets were analyzed in this study. This data can be found here: http://mips.gsf.de/genre/proj/mfungd.
Author Contributions
TH and Y-DC designed the study. LC and XP performed the experiments. HL, SZ, and ZL analyzed the results. HL, SZ, and LC wrote the manuscript. All authors contributed to the research and reviewed the manuscript.
Funding
This work was supported by the Strategic Priority Research Program of Chinese Academy of Sciences (XDB38050200, XDA26040304), National Key R&D Program of China (2018YFC0910403), the Fund of the Key Laboratory of Tissue Microenvironment and Tumor of Chinese Academy of Sciences (202002).
Conflict of Interest
The authors declare that the research was conducted in the absence of any commercial or financial relationships that could be construed as a potential conflict of interest.
Publisher’s Note
All claims expressed in this article are solely those of the authors and do not necessarily represent those of their affiliated organizations, or those of the publisher, the editors and the reviewers. Any product that may be evaluated in this article, or claim that may be made by its manufacturer, is not guaranteed or endorsed by the publisher.
Supplementary Material
The Supplementary Material for this article can be found online at: https://www.frontiersin.org/articles/10.3389/fgene.2022.909040/full#supplementary-material
Supplementary Table S1 | mRMR feature list yielded by the mRMR method on training dataset.
Supplementary Table S2 | IFS results with embedding features on training dataset.
Supplementary Table S3 | IFS results with domain features on training dataset.
Supplementary Table S4 | IFS results with linkage features on training dataset.
Supplementary Table S5 | IFS results with domain and linkage features on training dataset.
References
Aebersold, R., and Mann, M. (2016). Mass-spectrometric Exploration of Proteome Structure and Function. Nature 537, 347–355. doi:10.1038/nature19949
Ashburner, M., and Lewis, S. (2002). On Ontologies for Biologists: the Gene Ontology-Uuntangling the Web. Novartis Found. Symp. 247, 66244–52252.
Beck, M., Schmidt, A., Malmstroem, J., Claassen, M., Ori, A., Szymborska, A., et al. (2011). The Quantitative Proteome of a Human Cell Line. Mol. Syst. Biol. 7, 549. doi:10.1038/msb.2011.82
Blum, M., Chang, H.-Y., Chuguransky, S., Grego, T., Kandasaamy, S., Mitchell, A., et al. (2021). The InterPro Protein Families and Domains Database: 20 Years on. Nucleic Acids Res. 49, D344–D354. doi:10.1093/nar/gkaa977
Cai, Y.-D., and Chou, K.-C. (2005). Using Functional Domain Composition to Predict Enzyme Family Classes. J. Proteome Res. 4, 109–111. doi:10.1021/pr049835p
Camon, E., Magrane, M., Barrell, D., Binns, D., Fleischmann, W., Kersey, P., et al. (2003). The Gene Ontology Annotation (GOA) Project: Implementation of GO in SWISS-PROT, TrEMBL, and InterPro. Genome Res. 13, 662–672. doi:10.1101/gr.461403
Chen, L., Li, Z., Zhang, S., Zhang, Y. H., Huang, T., and Cai, Y. D. (2022). Predicting RNA 5-methylcytosine Sites by Using Essential Sequence Features and Distributions. Biomed. Res. Int. 2022, 4035462. doi:10.1155/2022/4035462
Chen, L., Feng, K.-Y., Cai, Y.-D., Chou, K.-C., and Li, H.-P. (2010). Predicting the Network of Substrate-Enzyme-Product Triads by Combining Compound Similarity and Functional Domain Composition. Bmc Bioinforma. 11, 293. doi:10.1186/1471-2105-11-293
Chen, L., Wang, S., Zhang, Y.-H., Li, J., Xing, Z.-H., Yang, J., et al. (2017). Identify Key Sequence Features to Improve CRISPR sgRNA Efficacy. IEEE Access 5, 26582–26590. doi:10.1109/access.2017.2775703
Chen, W., Chen, L., and Dai, Q. (2021). iMPT-FDNPL: Identification of Membrane Protein Types with Functional Domains and a Natural Language Processing Approach. Comput. Math. Methods Med. 2021, 7681497. doi:10.1155/2021/7681497
Chivasa, S., and Slabas, A. R. (2012). Plant extracellularATP Signalling: New Insight from Proteomics. Mol. Biosyst. 8, 445–452. doi:10.1039/c1mb05278k
Cho, H., Berger, B., and Peng, J. (2016). Compact Integration of Multi-Network Topology for Functional Analysis of Genes. Cell Syst. 3, 540–548. doi:10.1016/j.cels.2016.10.017
Church, D. M., Goodstadt, L., Hillier, L. W., Zody, M. C., Goldstein, S., She, X., et al. (2009). Lineage-specific Biology Revealed by a Finished Genome Assembly of the Mouse. PLoS Biol. 7, e1000112.doi:10.1371/journal.pbio.1000112
Cortes, C., and Vapnik, V. (1995). Support-vector Networks. Mach. Learn 20, 273–297. doi:10.1007/bf00994018
Davidi, D., and Milo, R. (2017). Lessons on Enzyme Kinetics from Quantitative Proteomics. Curr. Opin. Biotechnol. 46, 81–89. doi:10.1016/j.copbio.2017.02.007
Ding, S., Wang, D., Zhou, X., Chen, L., Feng, K., Xu, X., et al. (2022). Predicting Heart Cell Types by Using Transcriptome Profiles and a Machine Learning Method. Life 12, 228. doi:10.3390/life12020228
Fu, L., Niu, B., Zhu, Z., Wu, S., and Li, W. (2012). CD-HIT: Accelerated for Clustering the Next-Generation Sequencing Data. Bioinformatics 28, 3150–3152. doi:10.1093/bioinformatics/bts565
Grover, A., and Leskovec, J. (2016). “node2vec: Scalable Feature Learning for Networks”, in Proceedings of the 22nd ACM SIGKDD International Conference on Knowledge Discovery and Data Mining (San Francisco, California, USA: ACM), 855–864.
Hanchuan Peng, H. C., Fuhui Long, F. H., and Ding, C. (2005). Feature Selection Based on Mutual Information Criteria of Max-Dependency, Max-Relevance, and Min-Redundancy. IEEE Trans. Pattern Anal. Mach. Intell. 27, 1226–1238. doi:10.1109/tpami.2005.159
Hotamisligil, G. S., and Davis, R. J. (2016). Cell Signaling and Stress Responses. Cold Spring Harb. Perspect. Biol. 8, a006072. doi:10.1101/cshperspect.a006072
Hu, L., Huang, T., Shi, X., Lu, W.-C., Cai, Y.-D., and Chou, K.-C. (2011). Predicting Functions of Proteins in Mouse Based on Weighted Protein-Protein Interaction Network and Protein Hybrid Properties. PLoS One 6, e14556. doi:10.1371/journal.pone.0014556
Huang, G., Chu, C., Huang, T., Kong, X., Zhang, Y., Zhang, N., et al. (2016). Exploring Mouse Protein Function via Multiple Approaches. PLoS One 11, e0166580.doi:10.1371/journal.pone.0166580
Kandaswamy, K. K., Chou, K.-C., Martinetz, T., Möller, S., Suganthan, P. N., Sridharan, S., et al. (2011). AFP-pred: A Random Forest Approach for Predicting Antifreeze Proteins from Sequence-Derived Properties. J. Theor. Biol. 270, 56–62. doi:10.1016/j.jtbi.2010.10.037
Kohavi, R. “(1995). "A Study of Cross-Validation and Bootstrap for Accuracy Estimation and Model Selection”, in Proceedings of the International Joint Conference on Artificial Intelligence (Lawrence Erlbaum Associates), 1137–1145.
Kursa, M., and Rudnicki, W. (2010). Feature Selection with the Boruta Package. J. Stat. Softw. Articles 36, 1–13. doi:10.18637/jss.v036.i11
Li, Z., Wang, D., Liao, H., Zhang, S., Guo, W., Chen, L., et al. (2022). Exploring the Genomic Patterns in Human and Mouse Cerebellums via Single-Cell Sequencing and Machine Learning Method. Front. Genet. 13, 857851. doi:10.3389/fgene.2022.857851
Liang, H., Chen, L., Zhao, X., and Zhang, X. (2020). Prediction of Drug Side Effects with a Refined Negative Sample Selection Strategy. Comput. Math. Methods Med. 2020, 1573543. doi:10.1155/2020/1573543
Liu, H., Hu, B., Chen, L., and Lu, L. (2021). Identifying Protein Subcellular Location with Embedding Features Learned from Networks. Cp 18, 646–660. doi:10.2174/1570164617999201124142950
Liu, H., and Setiono, R. (1998). Incremental Feature Selection. Appl. Intell. 9, 217–230. doi:10.1023/a:1008363719778
Luo, Y., Zhao, X., Zhou, J., Yang, J., Zhang, Y., Kuang, W., et al. (2017). A Network Integration Approach for Drug-Target Interaction Prediction and Computational Drug Repositioning from Heterogeneous Information. Nat. Commun. 8, 573. doi:10.1038/s41467-017-00680-8
Mikolov, T., Chen, K., Corrado, G., and Dean, J. (2013). “Efficient Estimation of Word Representations in Vector Space,” in Proceedings Of theInternational Conference on Learning Representations (Arizona, USA): Scottsdale).
Milo, R. (2013). What Is the Total Number of Protein Molecules Per Cell Volume? A Call to Rethink Some Published Values. Bioessays 35, 1050–1055. doi:10.1002/bies.201300066
Mughal, M. J., Mahadevappa, R., and Kwok, H. F. (2019). DNA Replication Licensing Proteins: Saints and Sinners in Cancer. Seminars Cancer Biol. 58, 11–21. doi:10.1016/j.semcancer.2018.11.009
Nguyen, T.-T., Huang, J. Z., Wu, Q., Nguyen, T. T., and Li, M. J. (2015). Genome-wide Association Data Classification and SNPs Selection Using Two-Stage Quality-Based Random Forests. BMC genomics 16, S5. doi:10.1186/1471-2164-16-s2-s5
Onesime, M., Yang, Z., and Dai, Q. (2021). Genomic Island Prediction via Chi-Square Test and Random Forest Algorithm. Comput. Math. Methods Med. 2021, 9969751. doi:10.1155/2021/9969751
Pan, X., Chen, L., Liu, M., Niu, Z., Huang, T., and Cai, Y. D. (2021a). Identifying Protein Subcellular Locations with Embeddings-Based Node2loc. IEEE/ACM Trans. Comput. Biol. Bioinforma. 19(2):666-675. doi:10.1109/tcbb.2021.3080386
Pan, X., Li, H., Zeng, T., Li, Z., Chen, L., Huang, T., et al. (2021b). Identification of Protein Subcellular Localization with Network and Functional Embeddings. Front. Genet. 11, 626500. doi:10.3389/fgene.2020.626500
Perozzi, B., Al-Rfou, R., and Skiena, S. (2014). "Deepwalk: Online Learning of Social Representations", in:Proceedings Of the 20th ACM SIGKDD International Conference on Knowledge Discovery and Data Mining), 701–710. doi:10.1145/2623330.2623732
Platt, J. (1998). Sequential Minimal Optimizaton: A Fast Algorithm for Training Support Vector Machines,21. Technical Report MSR-TR-98-14.
Read, J., Reutemann, P., Pfahringer, B., and Holmes, G. (2016). MEKA: A Multi-label/Multi-Target Extension to WEKA. J. Mach. Learn. Res. 17, 1–5.
retmen Kagıalı, Z. C., Şentürk, A., zkan Küçük, N. E., Qureshi, M. H., and zlü, N. (2017). Proteomics in Cell Division. Proteomics. 17. 1. doi:10.1002/pmic.201600100
Ruepp, A., Doudieu, O. N., Van Den Oever, J., Brauner, B., Dunger-Kaltenbach, I., Fobo, G., et al. (2006). The Mouse Functional Genome Database (MfunGD): Functional Annotation of Proteins in the Light of Their Cellular Context. Nucleic Acids Res. 34, D568–D571. doi:10.1093/nar/gkj074
Ruepp, A., Zollner, A., Maier, D., Albermann, K., Hani, J., Mokrejs, M., et al. (2004). The FunCat, a Functional Annotation Scheme for Systematic Classification of Proteins from Whole Genomes. Nucleic Acids Res. 32, 5539–5545. doi:10.1093/nar/gkh894
Shen, H.-B., and Chou, K.-C. (2008). PseAAC: a Flexible Web Server for Generating Various Kinds of Protein Pseudo Amino Acid Composition. Anal. Biochem. 373, 386–388. doi:10.1016/j.ab.2007.10.012
Szklarczyk, D., Franceschini, A., Wyder, S., Forslund, K., Heller, D., Huerta-Cepas, J., et al. (2015). STRING V10: Protein-Protein Interaction Networks, Integrated over the Tree of Life. Nucleic Acids Res. 43, D447–D452. doi:10.1093/nar/gku1003
Tang, S., and Chen, L. (2022). iATC-NFMLP: Identifying Classes of Anatomical Therapeutic Chemicals Based on Drug Networks, Fingerprints and Multilayer Perceptron. Curr. Bioinforma. 36(11):3568-3569. doi:10.2174/1574893617666220318093000
Tsoumakas, G., and Vlahavas, I. (2007). Random K-Labelsets: An Ensemble Method for Multilabel Classification. in: 18th European Conference on Machine Learning, 406–417.
Wang, Y., Xu, Y., Yang, Z., Liu, X., and Dai, Q. (2021). Using Recursive Feature Selection with Random Forest to Improve Protein Structural Class Prediction for Low-Similarity Sequences. Comput. Math. Methods Med. 2021, 5529389. doi:10.1155/2021/5529389
Wu, Z., and Chen, L. (2022). Similarity-based Method with Multiple-Feature Sampling for Predicting Drug Side Effects. Comput. Math. Methods Med. 2022, 9547317. doi:10.1155/2022/9547317
Xu, X., Yu, D., Fang, W., Cheng, Y., Qian, Z., Lu, W., et al. (2008). Prediction of Peptidase Category Based on Functional Domain Composition. J. Proteome Res. 7, 4521–4524. doi:10.1021/pr800292w
Yang, Y., and Chen, L. (2022). Identification of Drug-Disease Associations by Using Multiple Drug and Disease Networks. Cbio 17, 48–59. doi:10.2174/1574893616666210825115406
Yao, S., You, R., Wang, S., Xiong, Y., Huang, X., and Zhu, S. (2021). NetGO 2.0: Improving Large-Scale Protein Function Prediction with Massive Sequence, Text, Domain, Family and Network Information. Nucleic Acids Res. 49, W469–w475. doi:10.1093/nar/gkab398
You, R., Yao, S., Xiong, Y., Huang, X., Sun, F., Mamitsuka, H., et al. (2019). NetGO: Improving Large-Scale Protein Function Prediction with Massive Network Information. Nucleic Acids Res. 47, W379–w387. doi:10.1093/nar/gkz388
Zhang, C., Lane, L., Omenn, G. S., and Zhang, Y. (2019). Blinded Testing of Function Annotation for uPE1 Proteins by I-TASSER/COFACTOR Pipeline Using the 2018-2019 Additions to neXtProt and the CAFA3 Challenge. J. Proteome Res. 18, 4154–4166. doi:10.1021/acs.jproteome.9b00537
Zhang, C., Wei, X., Omenn, G. S., and Zhang, Y. (2018). Structure and Protein Interaction-Based Gene Ontology Annotations Reveal Likely Functions of Uncharacterized Proteins on Human Chromosome 17. J. Proteome Res. 17, 4186–4196. doi:10.1021/acs.jproteome.8b00453
Zhang, Y.-H., Zeng, T., Chen, L., Huang, T., and Cai, Y.-D. (2021). Determining Protein-Protein Functional Associations by Functional Rules Based on Gene Ontology and KEGG Pathway. Biochimica Biophysica Acta (BBA) - Proteins Proteomics 1869, 140621. doi:10.1016/j.bbapap.2021.140621
Zhao, X., Chen, L., Guo, Z.-H., and Liu, T. (2019). Predicting Drug Side Effects with Compact Integration of Heterogeneous Networks. Cbio 14, 709–720. doi:10.2174/1574893614666190220114644
Zhou, H., Yang, Y., and Shen, H. B. (2017). Hum-mPLoc 3.0: Prediction Enhancement of Human Protein Subcellular Localization through Modeling the Hidden Correlations of Gene Ontology and Functional Domain Features. Bioinformatics 33, 843–853. doi:10.1093/bioinformatics/btw723
Zhou, J.-P., Chen, L., Wang, T., and Liu, M. (2020b). iATC-FRAKEL: a Simple Multi-Label Web Server for Recognizing Anatomical Therapeutic Chemical Classes of Drugs with Their Fingerprints Only. Bioinformatics 36, 3568–3569. doi:10.1093/bioinformatics/btaa166
Zhou, J. P., Chen, L., and Guo, Z. H. (2020a). iATC-NRAKEL: An Efficient Multi-Label Classifier for Recognizing Anatomical Therapeutic Chemical Classes of Drugs. Bioinformatics 36, 1391–1396. doi:10.1093/bioinformatics/btz757
Keywords: mouse protein, multi-label classification, embedding features, rakel, feature selection
Citation: Li H, Zhang S, Chen L, Pan X, Li Z, Huang T and Cai Y-D (2022) Identifying Functions of Proteins in Mice With Functional Embedding Features. Front. Genet. 13:909040. doi: 10.3389/fgene.2022.909040
Received: 31 March 2022; Accepted: 28 April 2022;
Published: 16 May 2022.
Edited by:
Quan Zou, University of Electronic Science and Technology of China, ChinaReviewed by:
Jing Yang, ShanghaiTech University, ChinaXuefeng Gu, Shanghai University of Medicine and Health Sciences, China
Copyright © 2022 Li, Zhang, Chen, Pan, Li, Huang and Cai. This is an open-access article distributed under the terms of the Creative Commons Attribution License (CC BY). The use, distribution or reproduction in other forums is permitted, provided the original author(s) and the copyright owner(s) are credited and that the original publication in this journal is cited, in accordance with accepted academic practice. No use, distribution or reproduction is permitted which does not comply with these terms.
*Correspondence: Tao Huang, tohuangtao@126.com; Yu-Dong Cai, cai_yud@126.com
†These authors contributed equally to this work