 Hui Min
 Xiao-Hong Xin
 Chu-Qiao Gao
 Likun Wang
 Pu-Feng Du
- 1College of Intelligence and Computing, Tianjin University, Tianjin, China
- 2Institute of Systems Biomedicine, Department of Pathology, School of Basic Medical Sciences, Beijing Key Laboratory of Tumor Systems Biology, Peking-Tsinghua Center of Life Sciences, Peking University Health Science Center, Beijing, China
MicroRNAs (miRNAs) play vital roles in gene expression regulations. Identification of essential miRNAs is of fundamental importance in understanding their cellular functions. Experimental methods for identifying essential miRNAs are always costly and time-consuming. Therefore, computational methods are considered as alternative approaches. Currently, only a handful of studies are focused on predicting essential miRNAs. In this work, we proposed to predict essential miRNAs using the XGBoost framework with CART (Classification and Regression Trees) on various types of sequence-based features. We named this method as XGEM (XGBoost for essential miRNAs). The prediction performance of XGEM is promising. In comparison with other state-of-the-art methods, XGEM performed the best, indicating its potential in identifying essential miRNAs.
Introduction
MicroRNAs (miRNAs) are functional non-coding RNAs of ∼22 nt in length. miRNAs are involved in regulating gene expressions (He and Hannon, 2004) in animals and plants. They have diverse expression patterns and regulate many biological processes, including cell proliferation (Cao et al., 2022), cell differentiation (Martin et al., 2016), cell apoptosis (Zhang et al., 2019), fat metabolism (Nematbakhsh et al., 2021), and development of animals and plants (Zhang et al., 2018). They are also related to many complex diseases (Wojciechowska et al., 2017), including many types of tumors (Zhang et al., 2007; Lee and Dutta, 2009; Fridrichova and Zmetakova, 2019).
lin-4 (Lee et al., 1993) was the first miRNA to be discovered, followed by let-7 (Reinhart et al., 2000). The regulatory roles of miRNAs have been widely studied (Bartel, 2004, 2018). Although miRNAs are small in length, their cellular role is important. Knocking out or knocking down some miRNA genes will result in lethal or infertile phenotypes (Bartel, 2018). These miRNAs genes are thought to be essential for the organism to live or develop. With the progress of miRNA gene annotations, many computational methods were developed to find miRNA genes in the genome (Wang et al., 2019). However, this resulted in many annotated miRNA genes in the database with little or no functional understanding (Bartel, 2018; Ru et al., 2019). As a basis toward the understanding of gene cellular functions, a gene should be determined if it is essential or not (Zeng et al., 2018; Campos et al., 2019).
In the context of miRNA genes, there are two categories of methods for identifying essential miRNAs: experimental methods and computational predictions. The experimental methods usually perform gene knockout or gene expression knockdown experiments on animal or plant models. By observing the phenotypes, the essentiality of the gene in question will be determined (Larrimore and Rancati, 2019). For example, Ahmed et al. (2017) reported that the miR-7a-2 is an essential miRNA gene by knocking out the miR-7a-2 gene in the mouse genome to observe the result that it caused infertility. Since the experimental methods are inevitably time-consuming and labor-intensive, computational predictions are always considered as alternative approaches or, at least, beneficial supplements. Computational prediction methods usually combine machine learning algorithms with statistical features of genomic sequences and structures to construct classifiers. Currently, there is no genome-wide clear set of essential miRNA genes. Therefore, constructing such machine learning-based predictors for essential miRNA genes is still a challenging task. As far as we know, only a handful of studies tried to predict essential miRNAs.
Ru et al. (2019) carried out a study in computationally predicting essential miRNAs. They collected 85 essential miRNAs from the literature (Bartel, 2018). By compensating 88 non-essential miRNAs from their own random selection, they presented a benchmarking dataset for computationally predicting essential miRNAs. They achieved a promising result by applying a simple voting scheme in the ensemble of multiple classifiers. Song et al. (2019) collected 77 essential miRNAs from the same literature (Bartel, 2018). They proposed the miES method based on the logistic regression algorithm. Yan et al. (2020) developed a third method based on the same 77 essential miRNAs, namely, PSEM, for the prediction of essential miRNAs in the mouse genome.
In this study, we applied the XGBoost (extreme gradient boosting) method (Chen and Guestrin, 2016) with classification trees to construct our predictor on various sequences and structural features. By optimizing features and parameters, we achieved better prediction performances than existing studies. We named our method as XGEM (XGBoost for essential miRNAs). We provided genome-wide prediction results in mice as a supplemental annotation to the mouse genome.
Materials and Methods
Experimental Data
We considered the dataset from Ru’s work (Ru et al., 2019), which contains 85 essential and 88 non-essential pre-miRNA sequences. We also obtained the dataset of miES (Song et al., 2019) and PESM (Yan et al., 2020) work, which contains 77 essential miRNAs. To compose a working dataset, we randomly picked up 77 non-essential miRNAs as negative samples for the miES and PESM dataset. We noted the former dataset as Ru’s dataset and the latter dataset as the miES-PESM dataset. Ru’s dataset was used for training and testing the XGEM method, while the miES-PESM dataset was used only for performance comparison.
Feature Extraction Methods
Five sequence feature extraction methods were incorporated in our work. They are k-mer frequencies, sequence mismatch features, subsequence features, PseDSSPC (pseudo-distance structure status pair composition), and triplet compositions. BioSeq-Analysis 2.0 (Liu et al., 2019) and repRNA (Liu et al., 2016b) were used to generate these features. Although the algorithms for generating these features have been elaborated in various works of the literature (Chen et al., 2015, 2018; Liu et al., 2016a, 2019; Zhang et al., 2021), we briefly described them here for the convenience of readers.
Given an RNA sequence R with length l, it can be noted as follows:
where ri (i = 1, 2, 3, … l) ∈ {A, C, G, U} is the i-th residue in R.
The k-mer frequencies are the appearance frequency of 4k type’s k consecutive nucleotides. The sequence R is separated into l–k + 1 k-mers, which are r1r2 … rk, r2r3 … rk+1, … , and rl-k+1rl-k+2rl. We noted the k-mer frequency as a vector of 4k dimensions (Wei et al., 2014), which can be noted as follows:
where f1,i (i = 1, 2, … , 4k) is the frequency of the i-th type of k-mer, and T is the transpose operator.
The mismatch feature is proposed by Leslie et al. as an alternative method of k-mer frequencies (Leslie et al., 2004). The method considers inaccurate matching and calculates the number of occurrences of k consecutive nucleotides that differ by at most m mismatches (m = 0, 1, … , k-1). We define the mismatch feature vector as follows:
where ci,j (i = 1, 2, … , 4k and j = 0, 1, … , m) is the number of occurrence of the ith type k-mer in sequence R with exactly j mismatches.
The subsequence feature is a method that allows non-continuous matching, which considers more matching situations (Lodhi et al., 2002). The value of the feature vector is determined by the number of occurrences of the subsequence and a decay factor δ ∈ [0, 1]. The subsequence feature vector of sequence R is defined as follows:
where ai (i = 1, 2, … , 4k) is a subsequence in R with possibly non-contiguous matching to the ith type of k-mer, and l (ai) a length function can be defined as follows:
|.| is the operator to calculate the length of a string.
Triplet feature is a combination of the primary sequence and secondary structural information of RNA. It was proposed by Xue et al.( 2005). By using the ViennaRNA package (Lorenz et al., 2011), we can estimate the secondary structure of R as follows:
where si (i = 1, 2, .., l) ∈ { ' (', ')', '.' } denotes the secondary structure status of the ith residue. The “ (‘ and ’)” represent the residue in a pairing status, while "." represents the unpairing status. By ignoring the difference between “ (‘ and ’)”, there are eight possible structural statuses of a triplet. Combining the structural status and the centered nucleotide of a triplet, 32 types of possible structural triplets can be obtained. Therefore, a 32-dimensional vector can be constructed to describe the appearance frequency of all structural triplets, which can be noted as follows:
where f4,i (i = 1, 2, … , 32) is the normalized frequency of the i-th structural triplet.
PseDSSPC was proposed by Liu et al. (Liu et al., 2016a). It represents the RNA sequence by considering both local and global information of secondary structures. Let ti (i = 1, 2, … , l) ∈ {A, C, G, U, A-U, U-A, G-C, C-G, G-U, and U-G} be the structural status of the i-th residue, where A, C, G, and U represent the four types of unpaired residues, while A-U, U-A, G-C, C-G, G-U, and U-G represent the six paired status. For every ti, its free energy e (ti) can be calculated. We first computed the raw appearance frequency of each of the 10 structural status, which can be noted as g5,1, g5,2, … g5,10. Given a parameter d, we can calculate the appearance frequency of all structural status pairs with a distance in the range [1, d]. These can be noted as g5,11, g5,12, … , g5,110, g5,111, g5,112, … , g5,210, … , g5,10+(d-1)100+1, g5,10+(d-1)100+2, … , g5,10+100d. After that, with a lag parameter λ, correlation coefficients can be computed for the serial of free energy values. The kth tier correlation coefficient can be defined as follows:
where k = 1, 2, … , λ.
With all aforementioned definitions, we can construct PseDSSPC features as follows:
where T is the transpose operator,
and w is a balancing parameter.
XGBoost With Classification Trees as Base Classifiers
We used CART (Classification and Regression Trees) with the Gini index as the purity function (Grajski et al., 1986) to create base classifiers in this work. Given a sample set D, the Gini function is defined as follows:
where k is the number of classes in the set, and pi is the proportion of the ith class.
Considering an attribute α, the set D is divided into several subsets according to different values of α. The purity at this branching node is defined as follows:
where v is the number of subsets, Dj is the j-th subset, and |.| is the cardinal operator of a set.
XGBoost (Chen and Guestrin, 2016) was used to create ensembles for boosting performances of classification trees.
Performance Measures
Four statistics, including accuracy (Acc), precision (Pre), recall (Rec), and F1-score (F), are used to quantitively describe the performance of our method. They are defined as follows:
where TP, TN, FP, and FN are the number of true positives, true negatives, false positives, and false negatives, respectively. We also used the area under the receiver operating characteristic (AUROC) curve to measure the performance of our model.
Parameter Calibration
We used a grid search strategy with leave-one-out cross-validation to find the optimal parameters. For k-mer features, we scanned k = 1, 2, 3, 4, 5, and 6. For mismatch features, we scanned k = 1, 2, 3, 4, 5, and 6 and m ∈ [0, k-1] with a step of 1. For subsequence features, we scanned k = 2, 3, and 4, and δ ∈ [0.1, 0.9] with a step of 0.1. In PseDSSPC, we scanned d ∈ [1,10] with a step of 1, λ ∈ [1, 20] with a step of 1 and w ∈ [0.1, 0.9] with a step of 0.1.
Different combinations of parameter values in CART and XGBoost are explored. We adjusted three parameters in the CART algorithm, including the randomness of branching (S), the maximum depth (D), and the maximum number of features (M). We scanned S ∈ [“best”, “random”], D ∈ [3,10] with a step of 1 and M ∈ [3, n] with a step of 1, where n is the number of sample features. We adjusted S, D, and M in order; when the former parameters are being scanned, the latter ones are set as default values. The best value of the former is applied to the latter parameter adjustment. We adjusted four parameters in XGBoost, including the number of trees (T), the learning rate (R), the maximum depth of trees (D), and the regularization parameter (λ). We scanned T ∈ [50, 500] with a step of 10, R ∈ [0.1, 0.5] with a step of 0.02, D ∈ [3, 10] with a step of 1, and λ ∈ [0, 2] with a step of 0.1. Similar strategies to the CART parameter optimization were applied.
System Implementation
The CART and XGBoost algorithms are implemented using Python with the scikit-learn package. The whole flowchart of this work is illustrated in Figure 1.
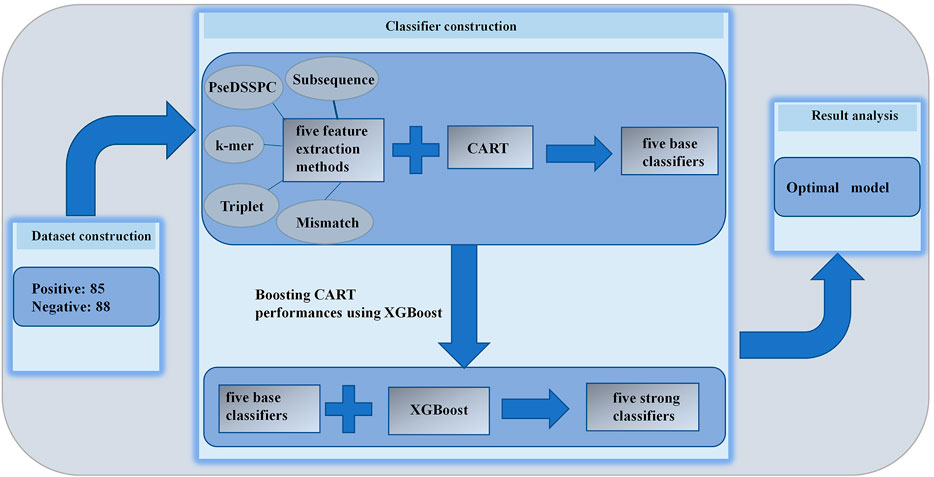
FIGURE 1. Overall flowchart of our method.
Results and Discussions
Performance Analysis by CART
We combined each of the five feature extraction methods with CART. We optimized the parameters of each kind of features. The best performances of each type of features can be found in Figure 2. The evaluation was performed on Ru’s dataset. Leave-one-out cross-validation protocol was applied on each type of features. The entire record of the parameter optimization process can be found in Supplementary Tables S1–S5.
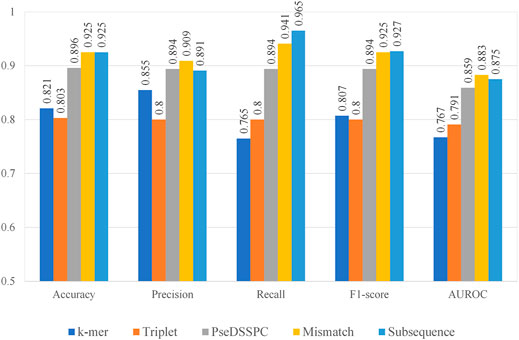
FIGURE 2. Prediction performances using five different types of features with CART.
From Figure 2, the subsequence features seem to have the best performances among the five. It has the highest or second to the highest value in terms of all performance measures. On the contrary, the performances of k-mer features and triplet features seem not as high as the others. The k-mer features have lowest performance values in terms of recall and the AUROC. The triplet features have the lowest performance values in terms of accuracy, precision, and F1-score. However, the precision value of k-mer and the recall value of triplet features are still competitive, which make them still worth a further boosting analysis. It should be noted that the PseDSSPC features, which by design would preserve most of the sequence information, did not give outstanding performances. This may be the result of the CART classifier, which cannot sufficiently utilize the information in this form.
With the optimal features, we analyzed the effect of different parameters in two steps. The first step is to analyze the effect of parameters in features, the latter one for the parameters in CART. When we performed the first step analysis, the parameters in the second step were fixed as their optimal values and vice versa. Figure 3 recorded the effects of parameters on all type of features. On all four types of features, which have at least one parameter each, the prediction accuracy peaks at some combinations of parameters, while it valleys with other combinations. Therefore, the parameters of features affect the performances. Figure 4 recorded the effects of CART parameters on all types of features. The peaks of the parameter D are the most significant. Although the parameter M causes the most fluctuation on performances, it is generally a random oscillation without easily observable patterns. Due to limited figure panel spaces, we only present a subset of performance measures in the figures. As we have mentioned, a comprehensive and quantitative record can be found in Supplementary Tables S1–S5.
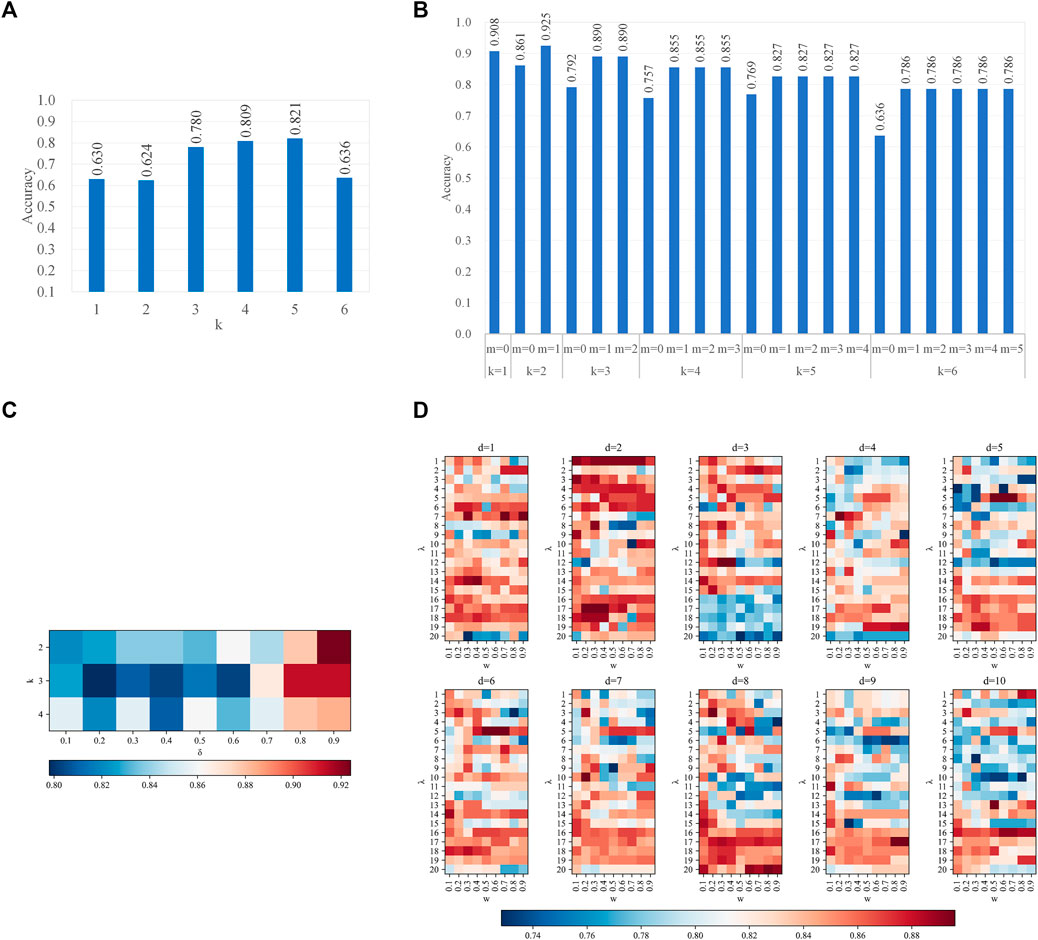
FIGURE 3. Parameter effects on CART with different types of features. Parameters of features are scanned (A). k-mer features (B); mismatch features (C); subsequence features (D); PseDSSPC features. In (A) and (B), the vertical axis is the accuracy in leave-one-out cross-validation. In (C,D), the heat color represents the accuracy in leave-one-out cross-validation. The optimized parameter is k = 5 for the k-mer features, k = 2 and m = 1 for the mismatch features, k = 2 and δ = 0.9 for the subsequence features, and d = 5, λ = 5, and w = 0.5 for the PseDSSPC features.
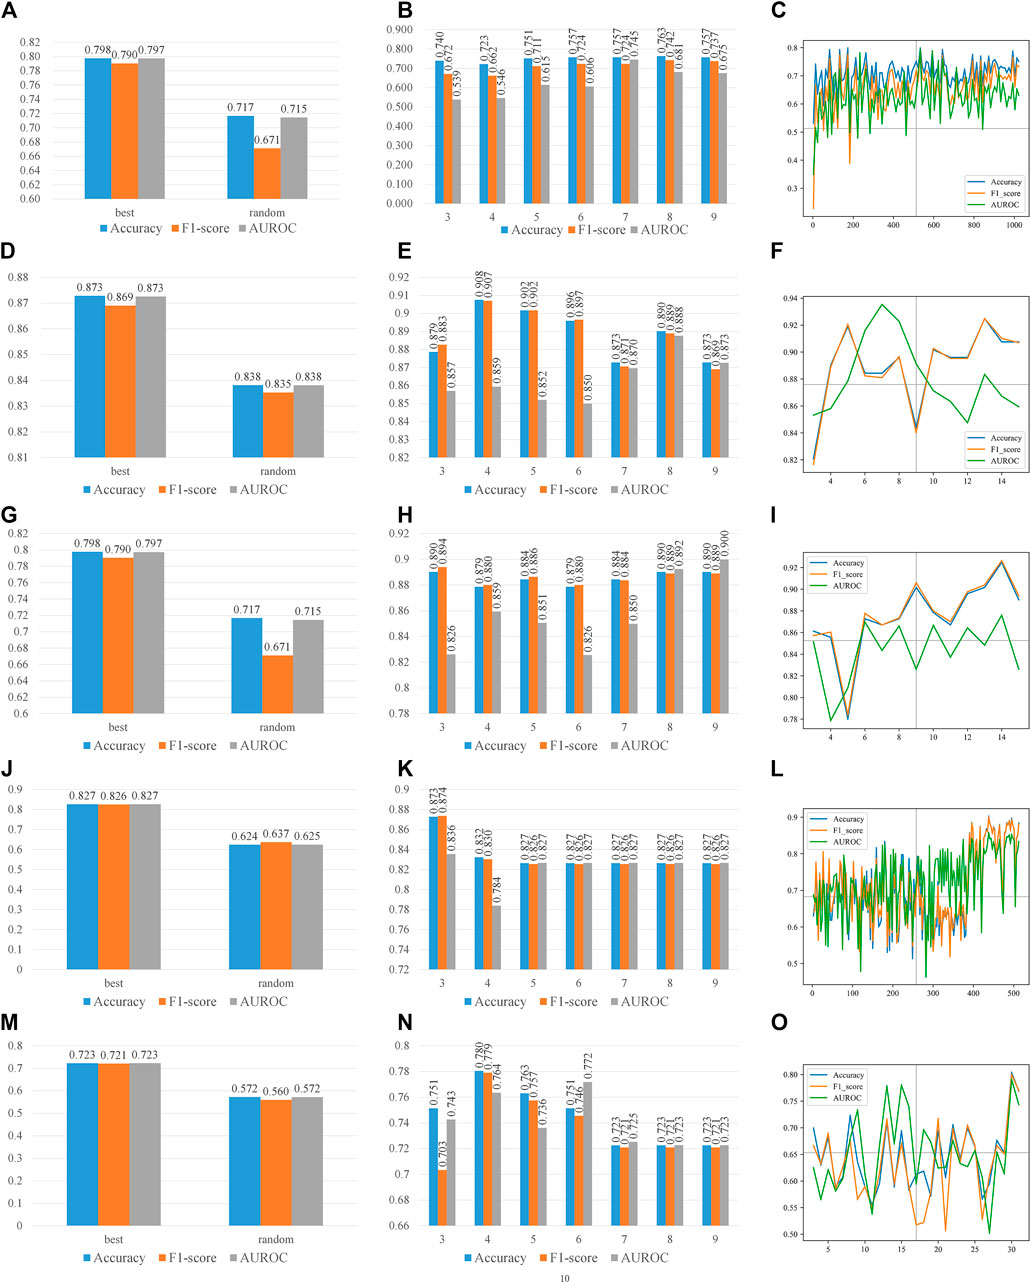
FIGURE 4. Parameter effects on CART with different types of features. Parameters of CART are scanned. The accuracy, F1-score, and AUROC are presented in each panel. (A), (B), and (C) are scanning CART parameters S, D, and M on k-mer features, respectively, and (D), (E), and (F) are scanning CART parameters S, D, and M on mismatch features, respectively; (G), (H), and (I) are scanning CART parameters S, D, and M on subsequence features, respectively; (J), (K), and (L) are scanning CART parameters S, D, and M on PseDSSPC features, respectively; (M), (N), and (O) are scanning CART parameters S, D, and M on the triplet features, respectively. The best parameter for k-mer features is S = ‘best’, D = 8, and M = 490. The best parameter for mismatch features is S = ‘best’, D = 4, and M = 13. The best parameter for subsequence features is S = ‘best’, D = 3, and M = 14. The best parameter for PseDSSPC features is S = ‘best’, D = 3, and M = 460. The best parameter for the triplet features is S = ‘best’, D = 4, and M = 30.
Boosting CART Performances Using XGBoost
We applied XGBoost on the CART classifiers with each of the five types of features. The parameters of XGBoost are optimized to get the best AUROC. Leave-one-out cross-validations were performed on Ru’s dataset. The prediction performances of the best boosted classifiers are listed in Table 1.
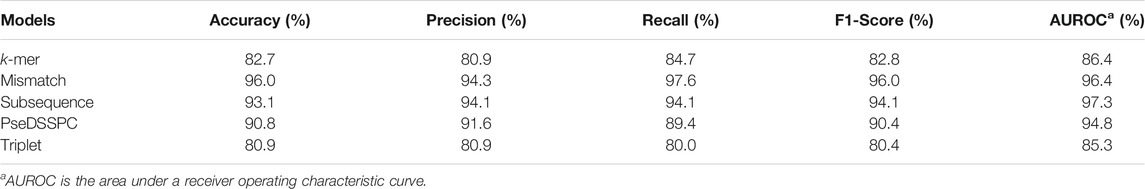
TABLE 1. Performance of the five strong classifiers.
According to Table 1, the subsequence features achieved 97.3% AUROC after boosted by XGBoost, which is the highest AUROC among all five models. However, its performances in terms of other measures are not as high as the mismatch features. The mismatch features achieved the best values in accuracy, precision, recall, and F1-score. Therefore, the mismatch features and the subsequence features with XGBoost are better choices than the other three for predicting essential miRNAs.
Similar to the analysis on non-boosted CART classifiers, we performed an analysis to see the results with different XGBoost parameter values. Figure 5 gives the details of all results when the parameters are adjusted. Due to limited space in the figure panels, we only presented three performance measures. Full records can be found in Supplementary Table S6 . All curves in Figure 5 show that the AUROC is just slightly affected by the parameters of XGBoost. The accuracy and F1-score ride the same tides when parameters are turned. Because of the theoretical relationship between F1-score and the accuracy, this observation indicated that the classifier is boosted in a balanced manner by XGBoost. This is an expected behavior of a good boosting framework on an informative and balanced training dataset.
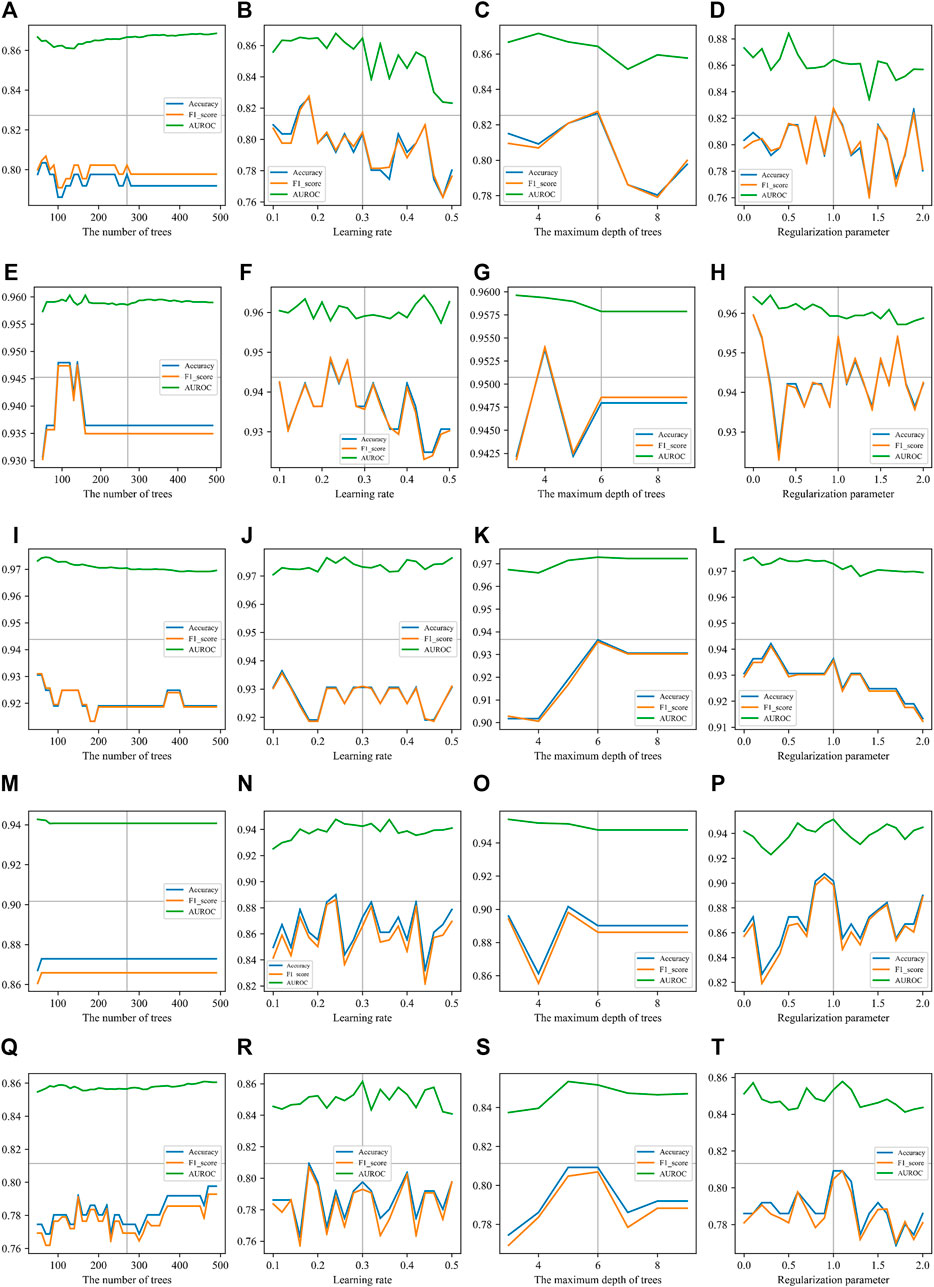
FIGURE 5. Parameter effects on XGBoost with different types of features. Parameters of XGBoost are scanned. The accuracy, F1-score, and AUROC are presented in each panel. The number of trees (T), the learning rate (R), the maximum depth of trees (D), and the regularization parameter (λ) are scanned on each type of sequence features. (A), (B), (C), and (D) are scanning parameters on k-mer features. The best parameter values are T = 60, R = 0.18, D = 6, and λ = 1. (E), (F), (G), and (H) are scanning parameters on mismatch features. The best parameter values are T = 80, R = 0.22, D = 4, and λ = 0. (I), (J), (K), and (L) are scanning parameters on subsequence features. The best parameter values are T = 50, R = 0.12, D = 6, and λ = 0.3. (M), (N), (O), and (P) are scanning parameters on Pse-DSSPC features. The best parameter values are T = 60, R = 0.24, D = 5, and λ = 0.9. (Q) (R), (S), and (T) are scanning parameters on triplet features. The best parameter values are T = 500, R = 0.18, D = 5, and λ = 1.
Independent Dataset Test
We selected mismatch features with XGBoost and subsequence features with XGBoost as the optimal models. We tested the feasibility of the two models in predicting potential essential miRNAs. We collected 16 mouse pre-miRNAs from various works of the literature, which had no overlap with our training dataset, as an independent testing dataset (Supplementary Table S7). Among them, eight were essential, and the others were non-essential. On this testing dataset, the mismatch features with XGBoost achieved 90.6% AUROC. The subsequence features with XGBoost achieved 81.2% AUROC. Therefore, we believe that the mismatch features with XGBoost is the one best choice for predicting essential miRNAs. We named this method XGEM (XGBoost for essential miRNAs).
Genome-wide Prediction
We downloaded all 1,234 mouse pre-miRNA sequences from the miRbase (Kozomara et al., 2019). The 85 essential miRNAs and 88 non-essential miRNAs in the training dataset were removed. The 16 sequences in the testing dataset were also removed, leaving 1,045 sequences with unknown essentiality. XGEM was applied to create predictions for all of them. The results are recorded in Supplementary Table S8. It can provide guidance for the study of miRNA biological function experiments. It should be noticed that XGEM was trained on balanced datasets. However, the real world is highly imbalanced. Therefore, false positives are inevitable in the prediction results. But this does not diminish the value of the results as the prediction shrinks the range of potential essential miRNAs to a much smaller scale, which is exactly the purpose of computational predictions.
Comparison With State-of-the-Art Methods
We compared XGEM to all existing state-of-the-art methods, including Ru’s work (Ru et al., 2019), miES (Song et al., 2019), and PESM (Yan et al., 2020).
The comparisons with miES and PESM were performed on the miES-PESM dataset. A 50-time repetition of 5-fold cross-validation was performed by all three methods on the same dataset. The repetition was used to eliminate inevitable randomness in the process of 5-fold cross-validation. The average performance values of the 50-time repetition were compared. The comparison with Ru’s work was performed on Ru’s dataset. Leave-one-out cross-validation was performed by both methods on the same dataset. The comparison details are depicted in Figure 6. XGEM performed the best in both comparisons. Although the benefits of XGEM is not large enough for us to claim that XGEM is definitely a better choice in predicting essential miRNAs, it is enough to state that XGEM is a better or at least comparable method to all state-of-the-art methods.
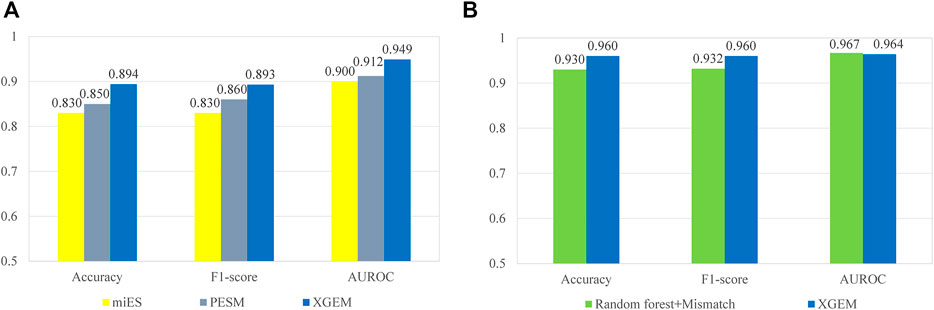
FIGURE 6. Comparison of different methods on mouse pre-miRNA datasets. The accuracy, F1-score, and AUROC are compared. (A) A comparison between the XGEM, miES, and PESM method on the miES-PESM dataset; (B) A comparison between XGEM and Ru’s work on Ru’s dataset.
Conclusion
Determining essentiality of non-coding genes is an important and fruitful research area, particularly for computational biology. In this article, we developed XGEM, which is a computational tool for predicting essential miRNAs. We evaluated the performance of XGEM in the mouse genome, with comparison to other state-of-the-art methods. The results indicated that XGEM has a potential to identify essential miRNAs. This is useful in understanding the biological functions of miRNA genes. We plan to establish a web server for hosting the implementation of XGEM. Due to the availability of limited resources currently, we will do this as a future work. In addition, the technology for developing XGEM can be extended to identify other types of essential non-coding genes, particularly those non-coding small RNA genes.
Data Availability Statement
Publicly available datasets were analyzed in this study. These data can be found here: https://github.com/minhui803/XGEM.
Author Contributions
HM collected the data, implemented the algorithm, performed the experiments, analyzed the results, and partially wrote the manuscript; X-HX helped in designing the algorithm and analyzed the results; C-QG analyzed the results and partially wrote the manuscript; LW and P-FD directed the whole study, conceptualized the algorithm, supervised the experiments, analyzed the results, and wrote the manuscript.
Funding
This work was supported by the National Natural Science Foundation of China (NSFC 61872268) and the National Key R&D Program of China (2018YFC0910405).
Conflict of Interest
The authors declare that the research was conducted in the absence of any commercial or financial relationships that could be construed as a potential conflict of interest.
Publisher’s Note
All claims expressed in this article are solely those of the authors and do not necessarily represent those of their affiliated organizations, or those of the publisher, the editors, and the reviewers. Any product that may be evaluated in this article, or claim that may be made by its manufacturer, is not guaranteed or endorsed by the publisher.
Acknowledgments
We would like to acknowledge Mr. Yunkai Guo for helpful discussions in this work.
Supplementary Material
The Supplementary Material for this article can be found online at: https://www.frontiersin.org/articles/10.3389/fgene.2022.877409/full#supplementary-material
References
Ahmed, K., LaPierre, M. P., Gasser, E., Denzler, R., Yang, Y., Rülicke, T., et al. (2017). Loss of microRNA-7a2 Induces Hypogonadotropic Hypogonadism and Infertility. J. Clin. Invest. 127, 1061–1074. doi:10.1172/JCI90031
Campos, T. L., Korhonen, P. K., Gasser, R. B., and Young, N. D. (2019). An Evaluation of Machine Learning Approaches for the Prediction of Essential Genes in Eukaryotes Using Protein Sequence-Derived Features. Comput. Struct. Biotechnol. J. 17, 785–796. doi:10.1016/j.csbj.2019.05.008
Cao, J., Liu, G.-S., Zou, N.-Z., Zhang, H., He, X.-X., Sun, P.-L., et al. (2022). microRNA-200c-3p Suppresses Proliferation and Invasion of Nephroblastoma Cells by Targeting EP300 and Inactivating the AKT/FOXO1/p27 Pathway. neoplasma. doi:10.4149/neo_2022_210922N1340
Chen, T., and Guestrin, C. (2016).XGBoost, in Proceedings of the 22nd ACM SIGKDD International Conference on Knowledge Discovery and Data Mining, San Francisco California USA (ACM), 785–794. doi:10.1145/2939672.2939785
Chen, W., Zhang, X., Brooker, J., Lin, H., Zhang, L., and Chou, K.-C. (2015). PseKNC-General: a Cross-Platform Package for Generating Various Modes of Pseudo Nucleotide Compositions. Bioinformatics 31, 119–120. doi:10.1093/bioinformatics/btu602
Chen, Z., Zhao, P., Li, F., Leier, A., Marquez-Lago, T. T., Wang, Y., et al. (2018). iFeature: a Python Package and Web Server for Features Extraction and Selection from Protein and Peptide Sequences. Bioinformatics 34, 2499–2502. doi:10.1093/bioinformatics/bty140
Fridrichova, I., and Zmetakova, I. (2019). MicroRNAs Contribute to Breast Cancer Invasiveness. Cells 8, 1361. doi:10.3390/cells8111361
Grajski, K. A., Breiman, L., Di Prisco, G. V., and Freeman, W. J. (1986). Classification of EEG Spatial Patterns with a Tree-Structured Methodology: CART. IEEE Trans. Biomed. Eng. BME-33, 1076–1086. doi:10.1109/TBME.1986.325684
He, L., and Hannon, G. J. (2004). MicroRNAs: Small RNAs with a Big Role in Gene Regulation. Nat. Rev. Genet. 5, 522–531. doi:10.1038/nrg1379
Kozomara, A., Birgaoanu, M., and Griffiths-Jones, S. (2019). miRBase: from microRNA Sequences to Function. Nucleic Acids Res. 47, D155–D162. doi:10.1093/nar/gky1141
Larrimore, K. E., and Rancati, G. (2019). The Conditional Nature of Gene Essentiality. Curr. Opin. Genet. Develop. 58-59, 55–61. doi:10.1016/j.gde.2019.07.015
Lee, Y. S., and Dutta, A. (2009). MicroRNAs in Cancer. Annu. Rev. Pathol. Mech. Dis. 4, 199–227. doi:10.1146/annurev.pathol.4.110807.092222
Lee, R. C., Feinbaum, R. L., and Ambros, V. (1993). The C. elegans Heterochronic Gene Lin-4 Encodes Small RNAs with Antisense Complementarity to Lin-14. Cell 75, 843–854. doi:10.1016/0092-8674(93)90529-Y
Leslie, C. S., Eskin, E., Cohen, A., Weston, J., and Noble, W. S. (2004). Mismatch String Kernels for Discriminative Protein Classification. Bioinformatics 20, 467–476. doi:10.1093/bioinformatics/btg431
Liu, B., Fang, L., Liu, F., Wang, X., and Chou, K.-C. (2016a). iMiRNA-PseDPC: microRNA Precursor Identification with a Pseudo Distance-Pair Composition Approach. J. Biomol. Struct. Dyn. 34, 223–235. doi:10.1080/07391102.2015.1014422
Liu, B., Gao, X., and Zhang, H. (2019). BioSeq-Analysis2.0: an Updated Platform for Analyzing DNA, RNA and Protein Sequences at Sequence Level and Residue Level Based on Machine Learning Approaches. Nucleic Acids Res. 47, e127. doi:10.1093/nar/gkz740
Liu, B., Liu, F., Fang, L., Wang, X., and Chou, K.-C. (2016b). repRNA: a Web Server for Generating Various Feature Vectors of RNA Sequences. Mol. Genet. Genomics 291, 473–481. doi:10.1007/s00438-015-1078-7
Lodhi, H., Saunders, C., Shawe-Taylor, J., Cristianini, N., and Watkins, C. (2002). Text Classification Using String Kernels. J. Machine Learn. Res. 2, 419–444. doi:10.1162/153244302760200687
Lorenz, R., Bernhart, S. H., Höner zu Siederdissen, C., Tafer, H., Flamm, C., Stadler, P. F., et al. (2011). ViennaRNA Package 2.0. Algorithms Mol. Biol. 6, 26. doi:10.1186/1748-7188-6-26
Martin, E. C., Qureshi, A. T., Dasa, V., Freitas, M. A., Gimble, J. M., and Davis, T. A. (2016). MicroRNA Regulation of Stem Cell Differentiation and Diseases of the Bone and Adipose Tissue: Perspectives on miRNA Biogenesis and Cellular Transcriptome. Biochimie 124, 98–111. doi:10.1016/j.biochi.2015.02.012
Nematbakhsh, S., Pei Pei, C., Selamat, J., Nordin, N., Idris, L. H., and Abdull Razis, A. F. (2021). Molecular Regulation of Lipogenesis, Adipogenesis and Fat Deposition in Chicken. Genes 12, 414. doi:10.3390/genes12030414
Reinhart, B. J., Slack, F. J., Basson, M., Pasquinelli, A. E., Bettinger, J. C., Rougvie, A. E., et al. (2000). The 21-nucleotide Let-7 RNA Regulates Developmental Timing in Caenorhabditis elegans. Nature 403, 901–906. doi:10.1038/35002607
Ru, X., Cao, P., Li, L., and Zou, Q. (2019). Selecting Essential MicroRNAs Using a Novel Voting Method. Mol. Ther. - Nucleic Acids 18, 16–23. doi:10.1016/j.omtn.2019.07.019
Song, F., Cui, C., Gao, L., and Cui, Q. (2019). miES: Predicting the Essentiality of miRNAs with Machine Learning and Sequence Features. Bioinformatics 35, 1053–1054. doi:10.1093/bioinformatics/bty738
Wang, Y., Ru, J., Jiang, Y., and Zhang, J. (2019). Adaboost-SVM-based Probability Algorithm for the Prediction of All Mature miRNA Sites Based on Structured-Sequence Features. Sci. Rep. 9, 1521. doi:10.1038/s41598-018-38048-7
Wei, L., Liao, M., Gao, Y., Ji, R., He, Z., and Zou, Q. (2014). Improved and Promising Identification of Human MicroRNAs by Incorporating a High-Quality Negative Set. Ieee/acm Trans. Comput. Biol. Bioinf. 11, 192–201. doi:10.1109/TCBB.2013.146
Wojciechowska, A., Osiak, A., and Kozar-Kamińska, K. (2017). MicroRNA in Cardiovascular Biology and Disease. Adv. Clin. Exp. Med. 26, 868–874. doi:10.17219/acem/62915
Xue, C., Li, F., He, T., Liu, G.-P., Li, Y., and Zhang, X. (2005). Classification of Real and Pseudo microRNA Precursors Using Local Structure-Sequence Features and Support Vector Machine. BMC Bioinformatics 6, 310. doi:10.1186/1471-2105-6-310
Yan, C., Wu, F.-X., Wang, J., and Duan, G. (2020). PESM: Predicting the Essentiality of miRNAs Based on Gradient Boosting Machines and Sequences. BMC Bioinformatics 21, 111. doi:10.1186/s12859-020-3426-9
Zeng, P., Chen, J., Meng, Y., Zhou, Y., Yang, J., and Cui, Q. (2018). Defining Essentiality Score of Protein-Coding Genes and Long Noncoding RNAs. Front. Genet. 9, 380. doi:10.3389/fgene.2018.00380
Zhang, B., Pan, X., Cobb, G. P., and Anderson, T. A. (2007). MicroRNAs as Oncogenes and Tumor Suppressors. Dev. Biol. 302, 1–12. doi:10.1016/j.ydbio.2006.08.028
Zhang, J., Xu, Y., Liu, H., and Pan, Z. (2019). MicroRNAs in Ovarian Follicular Atresia and Granulosa Cell Apoptosis. Reprod. Biol. Endocrinol. 17, 9. doi:10.1186/s12958-018-0450-y
Zhang, W.-Y., Xu, J., Wang, J., Zhou, Y.-K., Chen, W., and Du, P.-F. (2021). KNIndex: a Comprehensive Database of Physicochemical Properties for K-Tuple Nucleotides. Brief Bioinform 22, bbaa284. doi:10.1093/bib/bbaa284
Keywords: essential miRNA, CART, XGBoost, sequence features, ensemble classifier
Citation: Min H, Xin X-H, Gao C-Q, Wang L and Du P-F (2022) XGEM: Predicting Essential miRNAs by the Ensembles of Various Sequence-Based Classifiers With XGBoost Algorithm. Front. Genet. 13:877409. doi: 10.3389/fgene.2022.877409
Received: 16 February 2022; Accepted: 07 March 2022;
Published: 28 March 2022.
Edited by:
Yungang Xu, Xi’an Jiaotong University, ChinaReviewed by:
Pengmian Feng, North China University of Science and Technology, ChinaZhuhong You, Northwestern Polytechnical University, China
Copyright © 2022 Min, Xin, Gao, Wang and Du. This is an open-access article distributed under the terms of the Creative Commons Attribution License (CC BY). The use, distribution or reproduction in other forums is permitted, provided the original author(s) and the copyright owner(s) are credited and that the original publication in this journal is cited, in accordance with accepted academic practice. No use, distribution or reproduction is permitted which does not comply with these terms.
*Correspondence: Likun Wang, wanglk@bjmu.edu.cn; Pu-Feng Du, pdu@tju.edu.cn