 Mei-Neng Wang
 Li-Lan Lei
 De-Wu Ding
- School of Mathematics and Computer Science, Yichun University, Yichun, China
Accumulating evidence indicated that the interaction between lncRNA and miRNA is crucial for gene regulation, which can regulate gene transcription, further affecting the occurrence and development of many complex diseases. Accurate identification of interactions between lncRNAs and miRNAs is helpful for the diagnosis and therapeutics of complex diseases. However, the number of known interactions of lncRNA with miRNA is still very limited, and identifying their interactions through biological experiments is time-consuming and expensive. There is an urgent need to develop more accurate and efficient computational methods to infer lncRNA–miRNA interactions. In this work, we developed a matrix completion approach based on structural perturbation to infer lncRNA–miRNA interactions (SPCMLMI). Specifically, we first calculated the similarities of lncRNA and miRNA, including the lncRNA expression profile similarity, miRNA expression profile similarity, lncRNA sequence similarity, and miRNA sequence similarity. Second, a bilayer network was constructed by integrating the known interaction network, lncRNA similarity network, and miRNA similarity network. Finally, a structural perturbation-based matrix completion method was used to predict potential interactions of lncRNA with miRNA. To evaluate the prediction performance of SPCMLMI, five-fold cross validation and a series of comparison experiments were implemented. SPCMLMI achieved AUCs of 0.8984 and 0.9891 on two different datasets, which is superior to other compared methods. Case studies for lncRNA XIST and miRNA hsa-mir-195–5-p further confirmed the effectiveness of our method in inferring lncRNA–miRNA interactions. Furthermore, we found that the structural consistency of the bilayer network was higher than that of other related networks. The results suggest that SPCMLMI can be used as a useful tool to predict interactions between lncRNAs and miRNAs.
1 Introduction
Non-coding RNAs (ncRNAs) are a type of RNAs that do not translate into proteins, and they were regarded transcriptional byproducts for a long time (Adelman and Egan, 2017). Along with the development of next-generation sequencing technology, researchers have found that there are only about 2% of RNA-encoding proteins in the whole human genome, while roughly up to 98% are identified as ncRNAs (Yamamura et al., 2018). However, ncRNA plays a crucial role in regulating various biological processes, such as cell cycle regulation, cell development, and tumor metastasis (Salmena et al., 2011). In human transcript expression, the length of ncRNA ranges from 22 nucleotides (nts) to hundreds of kb. Long non-coding RNAs (lncRNAs) and microRNAs (miRNAs), the two main types of ncRNAs, have attracted increasing attention for their important roles in regulating gene expression (Ambros, 2004; Bartel, 2004; Persengiev et al., 2011). miRNA is an endogenous short ncRNA molecule with a length of about 20–25 nts, which is usually involved in the gene expression regulation in post-transcription (Alvarez-Garcia and Miska, 2005; Zeng, 2006). Increasing evidence suggests that miRNAs play critical roles in many physiological and pathological processes including embryo development, tissue differentiation, cell growth, tumorigenesis, and metastasis (Liu et al., 2013; Fang et al., 2015; Sun et al., 2015). On the other side, as a kind of ncRNA with a length of more than 200 nts, lncRNAs are also widely involved in various complex biological processes such as chromatin modification, immune response and cell differentiation, growth, and apoptosis (Li et al., 2016a; Engreitz et al., 2016; Chen et al., 2018). More importantly, studies have shown that the abnormal expression of both lncRNAs and miRNAs is closely related to complex human diseases such as lung cancer, liver cancer, and gastric cancer (Huang et al., 2016; Pan et al., 2019). For example, the overexpression of lncRNA HOTAIR is related to breast cancer, colon cancer, and liver cancer; the expression of miRNA miR-145 is reduced in prostate and colon cancers (Takagi et al., 2009; Zaman et al., 2010). In recent years, with the rapid development of gene sequencing technology, more and more lncRNAs and miRNAs have been discovered, but only a small number of them have been annotated with experimental information.
A number of studies suggest that lncRNAs exert biological function roles by interacting with proteins, RNAs, and DNAs (Atianand and Fitzgerald, 2014). Such lncRNA–biomolecule interactions are very important in regulating life activities. For example, the interaction of lncRNA PVT1 with the FOXM1 protein accelerates the development of gastric cancer (Xu et al., 2017); the lncRNA loc285194 acts as a tumor suppressor by interacting with the p53 gene (Liu et al., 2013). In the past, the influence of lncRNA–miRNA interactions on the occurrence and progression of human diseases has not attracted enough attention. Recently, studies have demonstrated that lncRNA can inhibit the expression of miRNA by exerting the function of an endogenous miRNA sponge and can also act as a decoy for miRNAs to inhibit the binding of miRNA to target gene mRNA (Li et al., 2016b; Militello et al., 2017; Wang et al., 2021). Similarly, miRNAs can target a large number of protein-coding genes and lncRNAs (Paraskevopoulou and Hatzigeorgiou, 2016). For example, in glioma, knocking down the expression of lncRNA XIST can upregulate the expression of miRNA miR-152, thereby inhibiting the proliferation, invasion, and migration of cancer cells and promoting apoptosis (Yao et al., 2015). In gastric cancer, the lncRNA ANRIL regulates cell proliferation by inhibiting the expression of miRNA miR-99a and miR-499a (Zhang et al., 2014). For this reason, the lncRNA ANRIL may be used as a prognostic biomarker and new therapeutic target for gastric cancer. Although the lncRNA–miRNA regulatory network in lung cancer, colon cancer, and breast cancer has been established (You et al., 2014), there are still a large number of lncRNA–miRNA interaction regulatory networks that have not been discovered. However, identifying the interactions of lncRNAs with miRNAs through biological experiments is time-consuming, labor-compressive, and costly. In order to comprehend and deeply understand the role of lncRNA–miRNA interactions in pathophysiology and discover the potential diagnostic markers and therapeutic approaches for some specific diseases, a reasonable and effective method is urgently needed to infer the interactions of lncRNAs with miRNAs.
In recent years, many computational approaches have been introduced to identify lncRNA–biomolecule interactions, such as random forest (RF) (Wang et al., 2018), support vector machine (SVM) (Zheng et al., 2019), and non-negative matrix factorization (NMF) (Wang et al., 2022). However, methods for predicting lncRNA–miRNA interactions are still very limited. Hu et al. (2018) developed a computational method called INLMI that infers lncRNA–miRNA interactions using a matrix completion technique based on the known interaction network. Huang et al. (2018) developed a graph-based approach, named EPLMI, to predict potential interactions between lncRNAs and miRNAs. This method represents lncRNA–miRNA interaction data as a bipartite graph and uses the average of the independent prediction network based on the similarity between lncRNAs and miRNAs to calculate the final prediction network. Wong et al. (2020) constructed a lncRNA–miRNA bipartite network and used linear neighbor representation to infer the potential interactions between lncRNAs and miRNAs (LNRLMI). Xu et al. (2021) developed a structural perturbation method to predict potential lncRNA–miRNA interactions, but this method only considered the expression profile information on lncRNAs and miRNAs when constructing the lncRNA similarity network and miRNA similarity network. In addition, nonnegative matrix factorization (NMF) is an efficient method and has been successfully used for data representation (Lee and Seung, 1999). The purpose of NMF is to approximate a matrix by the product of two low-rank nonnegative matrices. Pauca et al. (2006) proposed a constrained nonnegative matrix factorization (CNMF) method for data representation, which uses regularization constraint terms in NMF to mine the intrinsic geometry of the data space. Wang et al. (2020) proposed a graph regularized nonnegative matrix factorization method for inferring interactions of lncRNAs with miRNAs (GNMFLMI). Most of the previous methods aimed to improve the accuracy of prediction but ignored the range of lncRNA–miRNA interactions that can be predicted.
In this paper, we proposed a novel computational model, called SPCMLMI, to infer potential interactions of lncRNAs with miRNAs based on matrix structural perturbation. More specifically, we constructed a duplex network and randomly selected partial observed links from a duplex network to construct the perturbation set. Then, perturbing the remaining links, a perturbed adjacency matrix can be obtained by first-order approximation. Finally, we rank the unobserved links according to the scores of the perturbed matrix. In principle, the miRNAs with higher scores in each column are more likely to interact with the corresponding lncRNA. The proposed method has the following advances: 1) we built a bilayer network by integrating the confirmed lncRNA–miRNA interaction network, the lncRNA similarity network, and the miRNA similarity network, which can fuse more effective information to improve the prediction performance. 2) Considering that there is no prior knowledge on network organization in the structural consistency index, the structural consistency index was used to evaluate the link predictability of the lncRNA–miRNA interaction network. The results suggest that the consistency of the bilayer network is superior to other related networks. Under five-fold cross validation, SPCMLMI achieved AUC values of 0.8984 and 0.9891 on two different datasets, respectively, which outperformed other comparative methods. In addition, compared to the correlation network, the bilayer network also showed the best performance. The experimental results suggest that SPCMLMI can effectively infer lncRNA–miRNA interactions and provide valuable information for biomedical research.
2 Materials and methods
2.1 Datasets
For investigating the potential interactions of lncRNAs with miRNAs, we downloaded the lncRNASNP database from http://bioinfo.life.hust.edu.cn/lncRNASNP as the baseline dataset (Gong et al., 2015). In the lncRNASNP database, there are 8,091 laboratory study-verified records of known interactions between lncRNAs and miRNAs which were collected from 108CLIP-Seq datasets. After deleting the invalid lncRNAs and miRNAs and the duplicated records, we obtained 5,118 valid lncRNA–miRNA interaction pairs used as the benchmark data in our study, including 780 lncRNAs and 275 miRNAs. In order to better describe the lncRNA–miRNA interactions, we constructed the lncRNA–miRNA adjacency matrix
2.2 Method overview
In this study, to infer the undiscovered interactions of lncRNAs with miRNAs, we proposed a link prediction approach called SPMCLMI, which achieved matrix completion based on the structural perturbation of the bilayer network. The overall process of SPMCLMI is given in Figure 1. First, we calculated the expression similarity network using Pearson’s correlation coefficient based on the expression profile of lncRNAs and miRNAs, respectively. Considering that some RNAs have no expression similarity, we calculated the second type of similarity network for RNAs based on sequence information. According to the aforementioned two similarities, the integrated similarity network for lncRNAs and miRNAs was constructed, respectively. Second, we constructed the bilayer network
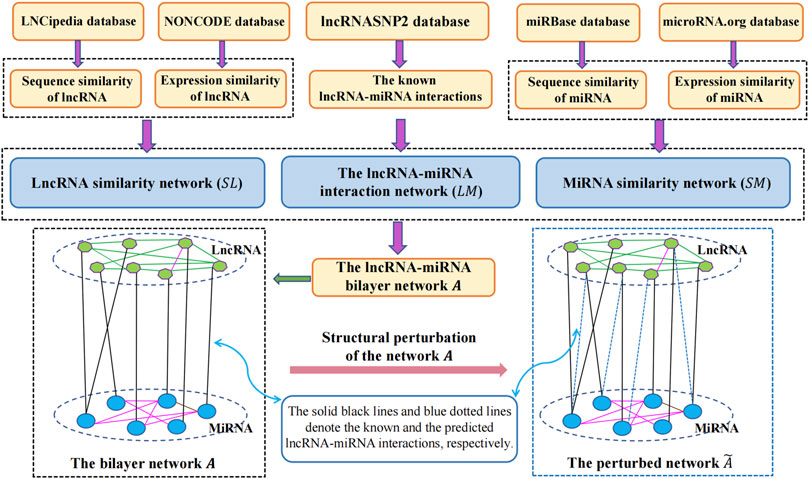
FIGURE 1. Flowchart of the prediction process of SPCMLMI.
2.3 Construction of the lncRNA–miRNA bilayer network
The lncRNA–miRNA bilayer network consists of three networks, namely, the known lncRNA–miRNA interaction network, lncRNA similarity network, and miRNA similarity network.
In this work, for calculating the similarities among RNAs, two different types of lncRNA/miRNA information were collected to construct lncRNA and miRNA similarity networks, including expression profiles and sequence information on nucleotides. Based on the hypothesis that functionally similar miRNAs/lncRNAs tend to interact more with a cluster of lncRNAs/miRNAs which share similar functions, Pearson’s correlation coefficient (PCC) has been widely utilized to calculate the similarity of ncRNAs (Wang et al., 2020). Here, we used PCC to calculate the first kind of similarity based on the expression profiles of lncRNAs and miRNAs. For each lncRNA, the expression profiles can be collected from NONCODE (Bu et al., 2012), while the expression profiles of each miRNA can be obtained from the microRNA.org database (Betel et al., 2008). Therefore, given two expression profiles of lncRNA
where
The second type of RNA similarity was measured based on the sequence information on nucleotides. The sequence information on lncRNAs and miRNAs was obtained from the LNCipedia database (Volders et al., 2013) and miRBase database (Kozomara and Griffiths-Jones, 2014), respectively. Given the sequence information on lncRNAs, the sequence similarity
By applying the same method for miRNAs, the final similarity of miRNA
Finally, by integrating the lncRNA similarity network
The sizes of
2.4 Structural consistency index
In 2015, Lü et al. (2015) developed a new approach named structural consistency for quantifying the link predictability of complex networks. This approach mainly considers the consistency of the structural features of existing networks before and after randomly removing a small set of associations. In this study, we used structural consistency to evaluate the lncRNA–miRNA bilayer network
where
Here, left-multiplying
The remaining eigenvectors are unchanged, the eigenvalue
where
The second case is that the adjacency matrix has repeated eigenvalues. Here, we use
giving us
Thereafter, left multiplying
The aforementioned Eqn. 11 can be written in the matrix form as follows:
where
The eigenvectors of a matrix can be used to measure the network structure. In general, if the eigenvectors of the perturbed matrix
where
In this work, the structural consistency of four related networks was calculated, including the lncRNA–miRNA interaction network

TABLE 1. Structural consistency of four related networks on the lncRNASNP dataset.
3 Results
3.1 Evaluation metrics
To systematically investigate the performance of SPCMLMI, we implemented the five-fold cross validation experiments on the lncRNASNP dataset and compared it with other methods. In the framework of five-fold cross validation, the observed lncRNA–miRNA interaction pairs were randomly divided into five equally sized subsets. For these subsets, each subset was taken in turns as the test set for validating the model, while the rest of the four subsets served as the training set. More specifically, for the lncRNA–miRNA bilayer network
The receiver operating characteristic (ROC) curve is an important metric for studying the generalization performance of a learner. We can plot the ROC curve by setting different thresholds for a false positive rate (FPR) and true positive rate (TPR). The area under the ROC curve (AUC) is widely used to estimate the performance of models, which follows the principle of the larger the better. If AUC = 0.5 represents random performance, AUC = 1 represents perfect performance. The FPR and TPR are calculated as follows:
Furthermore, to measure the performance of the proposed model from multiple perspectives, a range of evaluation indicators called specificity (Spe.), precision (Pre.), sensitivity (Sen.), accuracy (Acc.), and F1-score are defined as follows:
where TP and TN are the number of true positive and true negative samples, respectively, and FP and FN are the number of false positive and false negative samples, respectively.
Here, the parameter
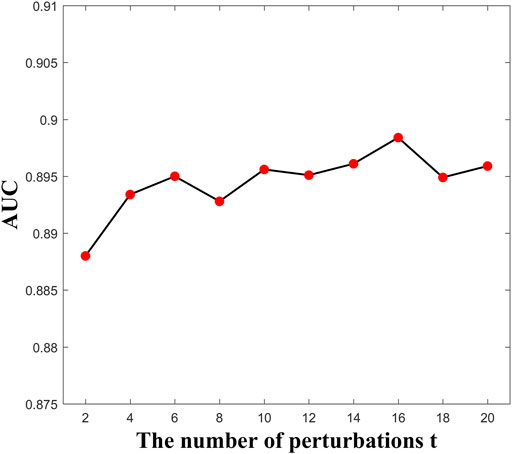
FIGURE 2. AUC values versus parameter t.
3.2 Prediction performance of a structural perturbation-based matrix completion method to predict lncRNA–miRNA interactions
In this work, we compared SPMCLMI with some previous studies, including INLMI (Hu et al., 2018), EPLMI (Huang et al., 2018), KATZ (Chen et al., 2017), LMF (Koren, 2008), NMF (Lee and Seung, 1999), CNMF (Pauca et al., 2006), and GNMFLMI (Wang et al., 2020). The KATZ measure, as an effective network-based link prediction algorithm, has been widely used in bioinformatics. The latent factor model (LFM) is a recommendation system algorithm, which aims to find the relationship matrix between lncRNA/miRNA and the latent factor and then takes the product of the aforementioned two matrices as the score matrix for the interaction between lncRNAs and miRNAs. As shown in Figure 3 and Table 2, we use the AUC as an evaluation indicator of model performance. The SPMCLMI model achieved the best performance among eight compared methods on the lncRNASNP dataset. Specifically, the average AUC values of SPMCLMI, INLMI, EPLMI, LMF, KATZ, NMF, CNMF, and GNMFLMI were 0.8984, 0.8517, 0.8402, 0.8257, 0.7435, 0.8316, 0.8535, and 0.8894, respectively. The AUC values of SPMCLMI were 4.67%, 5.82%, 7.27%, 15.49%, 6.68%, 4.49%, and 0.9% higher than those of the aforementioned seven computational approaches, respectively. The experimental results demonstrated that SPMCLMI is an efficient method in inferring large-scale lncRNA–miRNA interactions.
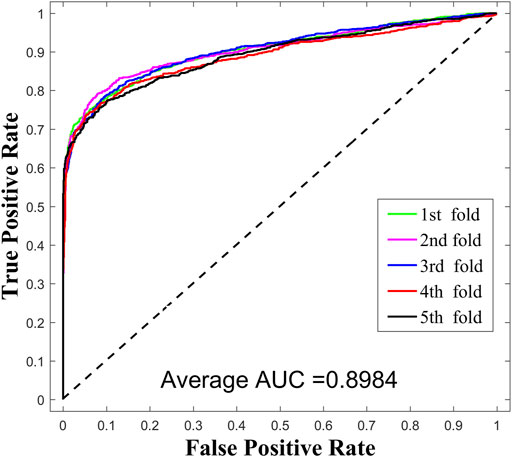
FIGURE 3. Performance results of SPCMLMI using the bilayer network.

TABLE 2. Average AUC values achieved among different methods under five-fold cross validation on the lncRNASNP dataset.
In addition, we calculated the values of specificity, precision, sensitivity, accuracy, and F1-score under five-fold cross-validation of SPCMLMI on the lncRNASNP dataset. As shown in Table 3, the average Acc. of SPCMLMI was 84.33%, and the Acc. under the five-fold cross-validation experiment was 84.36%, 85.45%, 84.38%, 84.03%, and 83.45%, respectively, while the standard deviation is only 0.73%. In terms of indices such as Spe., Pre., Sen., and F1-score, the proposed method obtained average values of 92.34%, 90.94%, 76.33%, and 82.97%, and their standard deviation was 1.90%, 1.90%, 2.10%, and 0.91%, respectively. These results proved that the proposed method is very suitable for predicting lncRNA–miRNA interactions.
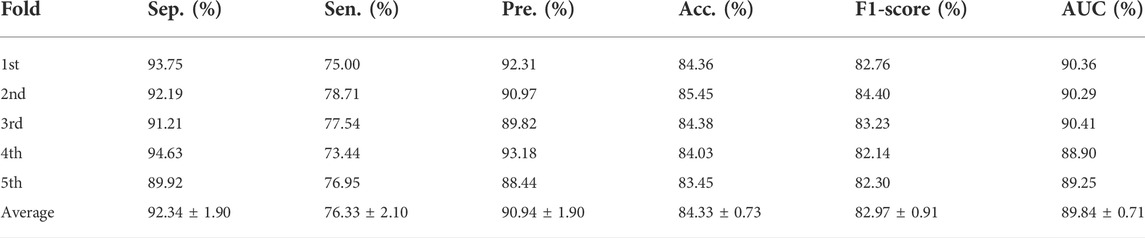
TABLE 3. Sep., Sen., Pre., Acc., and F1-score values achieved by SPCMLMI on the lncRNASNP dataset.
In general, the predicted results obtained from the top-ranked are more convincing than others. In other words, in the predicted matrix, larger values suggest that the lncRNAs are more likely to interact with the corresponding miRNAs. Here, all verified lncRNA–miRNA interactions were used as the training sample, and the number of correctly recovered known interactions was used to judge the effectiveness of the model. Usually, the model is considered more effective if more true interactions are retrieved from the top-ranked parts. The original lncRNA–miRNA interaction adjacency matrix and the result matrix are shown in Figure 4. From Figure 4, we can visually observe that our proposed model successfully retrieved the vast majority of interactions from all the 5,118 known interactions, suggesting that SPCMLMI is an effective approach in retrieving known lncRNA–miRNA interactions with a lower false positive rate.
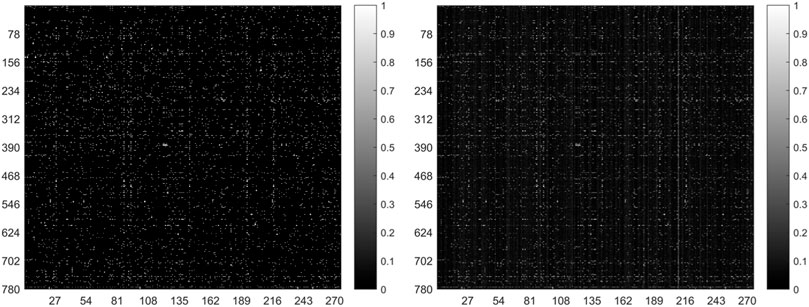
FIGURE 4. Original lncRNA–miRNA interaction adjacency matrix (left) and the result matrix (right).
3.3 Comparison with the other three related networks
To further investigate the impact of various networks’ information on prediction performance of SPCMLMI, we compared the performance of four related networks including the bilayer network
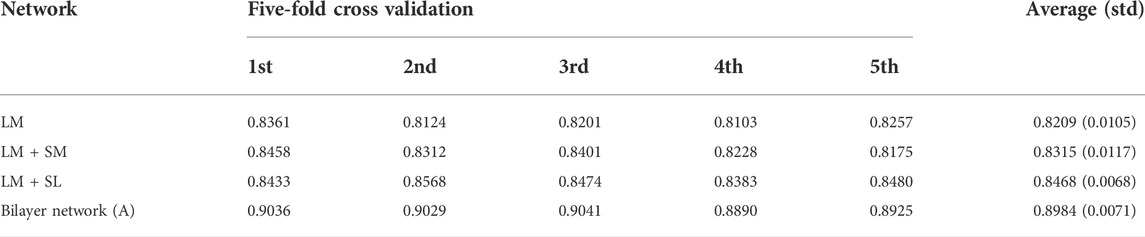
TABLE 4. AUC values of four related networks by using SPCMLMI on the lncRNASNP dataset.
3.4 Experiments on two different datasets
Because the methods of NMF, CNMF, GNMFLMI, and SPCMLMI all belong to the matrix completion models, it is representative to put them together for comparison. In order to ensure that the prediction results are more convincing, we compared SPCMLMI with NMF, CNMF, and GNMFLMI under five-fold cross-validation on two different datasets (lncRNASNP dataset and lncRNASNP2 dataset), respectively. The lncRNASNP2 dataset was downloaded from http://bioinfo.life.hust.edu.cn/lncRNASNP (the January 2018 version) (Ya-Ru et al., 2018). After removing the duplicated entries, 8,634 experimentally confirmed lncRNA–miRNA interactions were obtained, including 262 miRNAs and 468 lncRNAs. As shown in Table 5, the AUC values of NMF, CNMF, GNMFLMI, and SPCMLMI on the lncRNASNP2 dataset were 0.9344, 0.9510, 0.9769, and 0.9891, respectively. We can see that the proposed method achieved the best performance. At the same time, the performance of our proposed method on the lncRNASNP dataset was also the best. We can see from Table 2 that the average AUC values of NMF, CNMF, GNMFLMI, and SPCMLMI on the lncRNASNP dataset were 0.8316, 0.8535, 8894, and 0.8984, respectively. The results further demonstrated that the method of SPCMLMI is effective and robust in predicting potential lncRNA–miRNA interactions.

TABLE 5. AUC values of SPCMLMI and other compared methods under five-fold cross-validation on the lncRNASNP dataset and lncRNASNP2 dataset.
3.5 Case studies
In this section, case studies were performed on the lncRNASNP2 dataset to further validate the capability of SPCMLMI to infer novel lncRNA–miRNA interactions. In the experiment, we removed the interactions of a specific miRNA or the interactions of a specific lncRNA from the dataset and used the SPCMLMI method to predict lncRNAs interacting with “the specific miRNA” and miRNAs interacting with “the specific lncRNA.” We selected the lncRNA XIST (NONHSAT137542.2) and miRNA hsa-miR-195–5p as candidate prediction objects, respectively. The lncRNA XIST is closely related to non-small cell lung cancer and can promote cancer cell proliferation, invasion, and metastasis (Liu et al., 2019). The miRNA hsa-miR-195–5p has been proven to be a critical regulator in the progression of prostate cancer, which inhibits cell proliferation by downregulating proline-rich protein 11 expression (Cai et al., 2018). For the lncRNA XIST, all candidate miRNAs were sorted in descending order according to the predicted interaction scores after perturbing. The predicted top 10 candidate miRNAs interacting with the lncRNA XIST are shown in Table 6. We can see that seven out of them have been confirmed by biochemical experiments to be searched in starBase v2.0 and lncRNASNP2 databases. Similarly, for the miRNA hsa-miR-195–5p, we ranked all candidate lncRNAs according to their predicted scores in the perturbed matrix. As shown in Table 7, the top 10 candidate lncRNAs related to hsa-mir-195–5p were verified by biochemical experiments to be searched in starBase v2.0 and lncRNASNP2 databases. The aforementioned results further demonstrated the effectiveness of SPCMLMI in predicting novel interactions of miRNA with lncRNA.
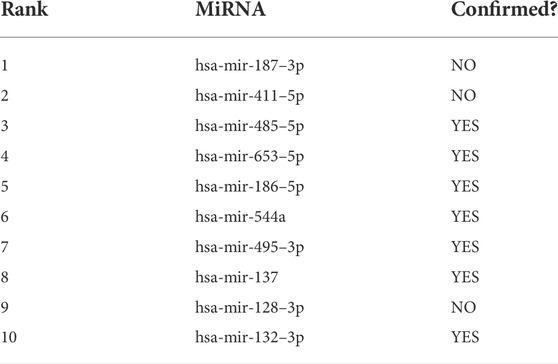
TABLE 6. Top 10 candidate miRNAs for lncRNA XIST using SPCMLMI.

TABLE 7. Top 10 candidate lncRNAs for miRNA hsa-mir-195–5p using SPCMLMI.
4 Discussion
As key molecules in the competing endogenous RNA (ceRNA) mechanism, lncRNAs and miRNAs play critical roles in gene regulation, and exploring their interactions shows a variety of biological functions. In this study, we developed a computational approach called SPCMLMI, which uses structural perturbation for matrix completion to infer lncRNA–miRNA interactions. We first make full use of the expression profiles and sequence information on lncRNAs and miRNAs to calculate their respective similarities. Then, according to the lncRNA similarity network, the miRNA similarity network, and the lncRNA–miRNA interaction network, we constructed the lncRNA–miRNA bilayer symmetrical network. Structural consistency was utilized to measure the link predictability of this network. The results suggested that the lncRNA–miRNA bilayer network achieved the best link predictability. Finally, we used the structural perturbation approach to perturb the bilayer network to recover the unknown links in the lncRNA–miRNA interaction network (i.e., to achieve the lncRNA–miRNA interaction adjacency matrix completion).
The performance of our method was compared with other competing methods on two different datasets. The experimental results demonstrated that SPCMLMI is powerful in predicting lncRNA–miRNA interactions. Although the results show that SPCMLMI is reliable and effective, there are some limitations. SPCMLMI only utilized two different miRNA/lncRNA-related pieces of information to construct the miRNA/lncRNA similarity network; we hope that more different miRNA/lncRNA-related information will be utilized to construct their similarity network in the future. Moreover, our method relies on the known lncRNA–miRNA interaction network. We look forward to building a more complete lncRNA–miRNA interaction network to improve the prediction performance by further studying lncRNAs and miRNAs.
Data availability statement
The original contributions presented in the study are included in the article/Supplementary Material; further inquiries can be directed to the corresponding authors.
Author contributions
M-NW and D-WD conceived the algorithm, analyzed it, conducted the experiment, and wrote the manuscript. L-LL and WH prepared the dataset and analyzed the experiment. The final draft was read and approved by all authors.
Funding
This work was supported in part by the NSFC Excellent Young Scholars Program, under grant 61722212, in part by the National Natural Science Foundation of China, under grants 62002297 and 62161050, and in part by the Science and Technology Project of Jiangxi Provincial Department of Education, under grants GJJ180852 and GJJ211603.
Acknowledgments
The authors would like to thank all the guest editors and reviewers for their constructive advice.
Conflict of interest
The authors declare that the research was conducted in the absence of any commercial or financial relationships that could be construed as a potential conflict of interest.
Publisher’s note
All claims expressed in this article are solely those of the authors and do not necessarily represent those of their affiliated organizations, or those of the publisher, the editors, and the reviewers. Any product that may be evaluated in this article, or claim that may be made by its manufacturer, is not guaranteed or endorsed by the publisher.
References
Adelman, K., and Egan, E. (2017). Non-coding RNA: More uses for genomic junk. Nature 543, 183–185. doi:10.1038/543183a
Alvarez-Garcia, I., and Miska, E. A. (2005). MicroRNA functions in animal development and human disease. Development 132 (21), 4653–4662. doi:10.1242/dev.02073
Atianand, M. K., and Fitzgerald, K. A. (2014). Long non-coding RNAs and control of gene expression in the immune system. Trends Mol. Med. 20, 623–631. doi:10.1016/j.molmed.2014.09.002
Bartel, D. P. (2004). MicroRNAs: Genomics, biogenesis, mechanism, and function. Cell. 116, 281–297. doi:10.1016/s0092-8674(04)00045-5
Betel, D., Wilson, M., Gabow, A., Marks, D. S., and Sander, C. (2008). The microRNA. Org resource: Targets and expression. Nucleic Acids Res. 36, D149–D153. doi:10.1093/nar/gkm995
Bu, D., Yu, K., Sun, S., Xie, C., Skogerbø, G., Miao, R., et al. (2012). NONCODE v3. 0: Integrative annotation of long noncoding RNAs. Nucleic Acids Res. 40, D210–D215. doi:10.1093/nar/gkr1175
Cai, C., He, H., Duan, X., Wu, W., Mai, Z., Zhang, T., et al. (2018). miR-195 inhibits cell proliferation and angiogenesis in human prostate cancer by downregulating PRR11 expression. Oncol. Rep. 39, 1658–1670. doi:10.3892/or.2018.6240
Chen, L., Zhang, Y.-H., Pan, X., Liu, M., Wang, S., Huang, T., et al. (2018). Tissue expression difference between mRNAs and lncRNAs. Int. J. Mol. Sci. 19, 3416. doi:10.3390/ijms19113416
Chen, X., Huang, Y.-A., You, Z.-H., Yan, G.-Y., and Wang, X.-S. (2017). A novel approach based on KATZ measure to predict associations of human microbiota with non-infectious diseases. Bioinformatics 33, 733–739. doi:10.1093/bioinformatics/btw715
Cock, P. J., Antao, T., Chang, J. T., Chapman, B. A., Cox, C. J., Dalke, A., et al. (2009). Biopython: Freely available Python tools for computational molecular biology and bioinformatics. Bioinformatics 25, 1422–1423. doi:10.1093/bioinformatics/btp163
Engreitz, J. M., Haines, J. E., Perez, E. M., Munson, G., Chen, J., Kane, M., et al. (2016). Local regulation of gene expression by lncRNA promoters, transcription and splicing. Nature 539, 452–455. doi:10.1038/nature20149
Fang, J., Li, Y., Liu, R., Pang, X., Li, C., Yang, R., et al. (2015). Discovery of multitarget-directed ligands against Alzheimer’s disease through systematic prediction of chemical–protein interactions. J. Chem. Inf. Model. 55, 149–164. doi:10.1021/ci500574n
Gong, J., Liu, W., Zhang, J., Miao, X., and Guo, A.-Y. (2015). lncRNASNP: a database of SNPs in lncRNAs and their potential functions in human and mouse. Nucleic Acids Res. 43, D181–D186. doi:10.1093/nar/gku1000
Hu, P., Huang, Y.-A., Chan, K. C., and You, Z.-H. (2018). “Discovering an integrated network in heterogeneous data for predicting lncRNA-miRNA interactions,” in International conference on intelligent computing (Berlin, Germany: Springer), 539–545.
Huang, Y.-A., Chan, K. C., and You, Z.-H. (2018). Constructing prediction models from expression profiles for large scale lncRNA–miRNA interaction profiling. Bioinformatics 34, 812–819. doi:10.1093/bioinformatics/btx672
Huang, Y.-A., Chen, X., You, Z.-H., Huang, D.-S., and Chan, K. C. (2016). Ilncsim: Improved lncRNA functional similarity calculation model. Oncotarget 7, 25902–25914. doi:10.18632/oncotarget.8296
Koren, Y. (2008). “Factorization meets the neighborhood: A multifaceted collaborative filtering model,” in Proceedings of the 14th ACM SIGKDD international conference on Knowledge discovery and data mining, Las Vegas Nevada USA, 24 August 2008, 426–434.
Kozomara, A., and Griffiths-Jones, S. (2014). miRBase: annotating high confidence microRNAs using deep sequencing data. Nucleic Acids Res. 42, D68–D73. doi:10.1093/nar/gkt1181
Lee, D. D., and Seung, H. S. (1999). Learning the parts of objects by non-negative matrix factorization. Nature 401, 788–791. doi:10.1038/44565
Li, D., Ainiwaer, J., Sheyhiding, I., Zhang, Z., and Zhang, L. (2016). Identification of key long non-coding RNAs as competing endogenous RNAs for miRNA-mRNA in lung adenocarcinoma. Eur. Rev. Med. Pharmacol. Sci. 20, 2285–2295.
Li, J., Tian, H., Yang, J., and Gong, Z. (2016). Long noncoding RNAs regulate cell growth, proliferation, and apoptosis. DNA Cell. Biol. 35, 459–470. doi:10.1089/dna.2015.3187
Liu, J., Yao, L., Zhang, M., Jiang, J., Yang, M., and Wang, Y. (2019). Downregulation of LncRNA-XIST inhibited development of non-small cell lung cancer by activating miR-335/SOD2/ROS signal pathway mediated pyroptotic cell death. Aging (albany NY) 11, 7830–7846. doi:10.18632/aging.102291
Liu, Q., Huang, J., Zhou, N., Zhang, Z., Zhang, A., Lu, Z., et al. (2013). LncRNA loc285194 is a p53-regulated tumor suppressor. Nucleic Acids Res. 41, 4976–4987. doi:10.1093/nar/gkt182
Lü, L., Pan, L., Zhou, T., Zhang, Y.-C., and Stanley, H. E. (2015). Toward link predictability of complex networks. Proc. Natl. Acad. Sci. U. S. A. 112, 2325–2330. doi:10.1073/pnas.1424644112
Militello, G., Weirick, T., John, D., Döring, C., Dimmeler, S., and Uchida, S. (2017). Screening and validation of lncRNAs and circRNAs as miRNA sponges. Brief. Bioinform. 18, 780–788. doi:10.1093/bib/bbw053
Pan, X., Jensen, L. J., and Gorodkin, J. (2019). Inferring disease-associated long non-coding RNAs using genome-wide tissue expression profiles. Bioinformatics 35, 1494–1502. doi:10.1093/bioinformatics/bty859
Paraskevopoulou, M. D., and Hatzigeorgiou, A. G. (2016). Analyzing miRNA–lncRNA interactions, Long non-coding RNAs. Berlin, Germany: Springer, 271–286.
Pauca, V. P., Piper, J., and Plemmons, R. J. (2006). Nonnegative matrix factorization for spectral data analysis. Linear Algebra Appl. 416, 29–47. doi:10.1016/j.laa.2005.06.025
Persengiev, S., Kondova, I., Otting, N., Koeppen, A. H., and Bontrop, R. E. (2011). Genome-wide analysis of miRNA expression reveals a potential role for miR-144 in brain aging and spinocerebellar ataxia pathogenesis. Neurobiol. Aging 32, e2317–e27. e2327. doi:10.1016/j.neurobiolaging.2010.03.014
Salmena, L., Poliseno, L., Tay, Y., Kats, L., and Pandolfi, P. P. (2011). A ceRNA hypothesis: The rosetta stone of a hidden RNA language? Cell. 146, 353–358. doi:10.1016/j.cell.2011.07.014
Sun, H., Wang, G., Peng, Y., Zeng, Y., Zhu, Q.-N., Li, T.-L., et al. (2015). H19 lncRNA mediates 17β-estradiol-induced cell proliferation in MCF-7 breast cancer cells. Oncol. Rep. 33, 3045–3052. doi:10.3892/or.2015.3899
Takagi, T., Iio, A., Nakagawa, Y., Naoe, T., Tanigawa, N., and Akao, Y. (2009). Decreased expression of microRNA-143 and-145 in human gastric cancers. Oncology 77, 12–21. doi:10.1159/000218166
Volders, P.-J., Helsens, K., Wang, X., Menten, B., Martens, L., Gevaert, K., et al. (2013). LNCipedia: A database for annotated human lncRNA transcript sequences and structures. Nucleic Acids Res. 41, D246–D251. doi:10.1093/nar/gks915
Wang, L., You, Z.-H., Xia, S.-X., Chen, X., Yan, X., Zhou, Y., et al. (2018). An improved efficient rotation forest algorithm to predict the interactions among proteins. Soft Comput. 22, 3373–3381. doi:10.1007/s00500-017-2582-y
Wang, M.-N., Xie, X.-J., You, Z.-H., Wong, L., Li, L.-P., and Chen, Z.-H. (2022). Combining K nearest neighbor with nonnegative matrix factorization for predicting circrna-disease associations. IEEE/ACM Trans. Comput. Biol. Bioinform. 2022, 1–10. doi:10.1109/TCBB.2022.3180903
Wang, M.-N., You, Z.-H., Li, L.-P., Wong, L., Chen, Z.-H., and Gan, C.-Z. (2020). Gnmflmi: Graph regularized nonnegative matrix factorization for predicting LncRNA-MiRNA interactions. IEEE Access 8, 37578–37588. doi:10.1109/access.2020.2974349
Wang, M.-N., You, Z.-H., Wang, L., Li, L.-P., and Zheng, K. (2021). Ldgrnmf: LncRNA-disease associations prediction based on graph regularized non-negative matrix factorization. Neurocomputing 424, 236–245. doi:10.1016/j.neucom.2020.02.062
Wong, L., Huang, Y. A., You, Z. H., Chen, Z. H., and Cao, M. Y. (2020). Lnrlmi: Linear neighbour representation for predicting lncRNA‐miRNA interactions. J. Cell. Mol. Med. 24, 79–87. doi:10.1111/jcmm.14583
Xu, M.-d., Wang, Y., Weng, W., Wei, P., Qi, P., Zhang, Q., et al. (2017). A positive feedback loop of lncRNA-PVT1 and FOXM1 facilitates gastric cancer growth and invasion. Clin. Cancer Res. 23, 2071–2080. doi:10.1158/1078-0432.CCR-16-0742
Xu, M., Chen, Y., Lu, W., Kong, L., Cong, P., Li, Z., et al. (2021). Spmlmi: Predicting lncRNA-miRNA interactions in humans using a structural perturbation method. PeerJ 9, e11426. doi:10.7717/peerj.11426
Ya-Ru, M., Wei, L., Qiong, Z., and An-Yuan, G. (2018). lncRNASNP2: an updated database of functional SNPs and mutations in human and mouse lncRNAs. Nucleic Acids Res. 46, D276–D280. doi:10.1093/nar/gkx1004
Yamamura, S., Imai-Sumida, M., Tanaka, Y., and Dahiya, R. (2018). Interaction and cross-talk between non-coding RNAs. Cell. Mol. Life Sci. 75, 467–484. doi:10.1007/s00018-017-2626-6
Yao, Y., Ma, J., Xue, Y., Wang, P., Li, Z., Liu, J., et al. (2015). Knockdown of long non-coding RNA XIST exerts tumor-suppressive functions in human glioblastoma stem cells by up-regulating miR-152. Cancer Lett. 359, 75–86. doi:10.1016/j.canlet.2014.12.051
You, J., Zhang, Y., Liu, B., Li, Y., Fang, N., Zu, L., et al. (2014). MicroRNA-449a inhibits cell growth in lung cancer and regulates long noncoding RNA nuclear enriched abundant transcript 1. Indian J. Cancer 51, 77–e81. doi:10.4103/0019-509X.154055
Zaman, M. S., Chen, Y., Deng, G., Shahryari, V., Suh, S., Saini, S., et al. (2010). The functional significance of microRNA-145 in prostate cancer. Br. J. Cancer 103, 256–264. doi:10.1038/sj.bjc.6605742
Zeng, Y. (2006). Principles of micro-RNA production and maturation. Oncogene 25, 6156–6162. doi:10.1038/sj.onc.1209908
Zhang, E.-b., Kong, R., Yin, D.-d., You, L.-h., Sun, M., Han, L., et al. (2014). Long noncoding RNA ANRIL indicates a poor prognosis of gastric cancer and promotes tumor growth by epigenetically silencing of miR-99a/miR-449a. Oncotarget 5, 2276–2292. doi:10.18632/oncotarget.1902
Keywords: structural perturbation, structural consistency, matrix completion, bilayer network, lncRNA–miRNA interactions
Citation: Wang M-N, Lei L-L, He W and Ding D-W (2022) SPCMLMI: A structural perturbation-based matrix completion method to predict lncRNA–miRNA interactions. Front. Genet. 13:1032428. doi: 10.3389/fgene.2022.1032428
Received: 30 August 2022; Accepted: 28 October 2022;
Published: 15 November 2022.
Edited by:
Zeeshan Ahmed, The State University of New Jersey, United StatesCopyright © 2022 Wang, Lei, He and Ding. This is an open-access article distributed under the terms of the Creative Commons Attribution License (CC BY). The use, distribution or reproduction in other forums is permitted, provided the original author(s) and the copyright owner(s) are credited and that the original publication in this journal is cited, in accordance with accepted academic practice. No use, distribution or reproduction is permitted which does not comply with these terms.
*Correspondence: Mei-Neng Wang, ycuwangmn@163.com; De-Wu Ding, dwding2008@aliyun.com