 Kun Fang
 Hairong Qu2
 Lei Gao
- 1Department of Surgery, Yinchuan Maternal and Child Health Hospital, Yinchuan, China
- 2Department of Gynaecology, Yinchuan Maternal and Child Health Hospital, Yinchuan, China
- 3Department of Pathology, Yinchuan Maternal and Child Health Hospital, Yinchuan, China
- 4Central Laboratory, Department of Gastroenterology, First Affiliated Hospital of Harbin Medical University, Harbin, China
- 5Central Laboratory, Department of Pancreatic and Biliary Surgery, The First Affiliated Hospital of Harbin Medical University, Harbin, China
Objective: N6-methyladenosine (m6A) modification may modulate various biological processes. Nonetheless, clinical implications of m6A modification in pancreatic cancer are undefined. Herein, this study comprehensively characterized the m6A modification patterns in pancreatic cancer based on m6A regulators.
Methods: Genetic mutation and expression pattern of 21 m6A regulators and their correlations were assessed in pancreatic cancer from TCGA dataset. m6A modification patterns were clustered using unsupervised clustering analysis in TCGA and ICGC datasets. Differences in survival, biological functions and immune cell infiltrations were assessed between modification patterns. A m6A scoring system was developed by principal component analysis. Genetic mutations and TIDE scores were compared between high and low m6A score groups.
Results: ZC3H13 (11%), RBM15B (9%), YTHDF1 (8%), and YTHDC1 (6%) frequently occurred mutations among m6A regulators. Also, most of regulators were distinctly dysregulated in pancreatic cancer. There were tight crosslinks between regulators. Two m6A modification patterns were constructed, with distinct prognoses, immune cell infiltration and biological functions. Furthermore, we quantified m6A score in each sample. High m6A scores indicated undesirable clinical outcomes. There were more frequent mutations in high m6A score samples. Lower TIDE score was found in high m6A score group, with AUC = 0.61, indicating that m6A scores might be used for predicting the response to immunotherapy.
Conclusion: Collectively, these data demonstrated that m6A modification participates pancreatic cancer progress and ornaments immune microenvironment, providing an insight into pancreatic cancer pathogenesis and facilitating precision medicine development.
Introduction
Pancreatic cancer represents the most lethal malignancy globally, characterized by high intra-tumoral heterogeneity and undesirable survival outcomes (Jain and Dudeja, 2021). Despite the improvement in standard of care, survival outcomes are extremely undesirable with a 5 year survival rate <10% and median survivals <1 year (Qin et al., 2020). The existing therapies provide only limited efficacy. Despite surgical resection as the main therapeutic strategy for pancreatic cancer, merely 10–15% of newly diagnosed patients are qualified (Peng et al., 2019). Over 50% of subjects are diagnosed at locally advanced or metastatic stages (O'Reilly et al., 2020). Specially, traditional chemotherapy for advanced or metastatic patients merely provides months of overall survival (OS) benefit (Ho et al., 2020). Due to the undesirable clinical outcomes, novel treatment strategies are urgently required. Pancreatic cancer with similar morphology usually displays distinct clinical characteristics, response to therapies and survival outcomes (Bailey et al., 2016). Currently, molecular subtypes have been proposed for guidance of preclinical and clinical management, prediction of first-rank treatment strategies and minimum of treatment-relevant death risk and cost in pancreatic cancer (Collisson et al., 2019). Nevertheless, so far, molecular subtyping does not inform therapeutic decisions.
N6-methyladenosine (m6A), a dynamic and reversible process, represents the most plentiful posttranscriptional methylation modification of mRNAs in eukaryotic species (Zhang et al., 2020). It occurs in the RRACH sequence (where R = A or G, H = A, C, or U). m6A methylation modulates nearly each step of RNA metabolism like RNA splicing, stability, decay, and translation. Aberrant m6A levels alters target gene expression and cellular processes and physiological functions, thereby affecting cancer progression (He et al., 2019). This modification is mainly controlled by three kinds of regulators: methyltransferases (“writers”), demethylases (“erasers”) as well as binding proteins (“readers”). Accumulating evidence has reported the carcinogenesis of m6A regulators in pancreatic cancer. For instance, upregulating m6A writer METTL14 may promote growth and metastases of pancreatic cancer by mediating PERP mRNA m6A (Wang et al., 2020). Nevertheless, it remains limited understanding on the global landscape and dynamic changes of m6A regulators in pancreatic cancer. Immune microenvironment exerts an important role in tumor progress and treatment effects for pancreatic cancer (Hegde et al., 2020). Comprehending immune microenvironment and its regulators assist enhance immunotherapy (Torphy et al., 2020). For example, targeting m6A eraser ALKBH5 enhances the responsiveness to anti-PD-1 therapy through modulating tumor immune microenvironment (Li et al., 2020). Associations between m6A regulators and immune microenvironment have been preliminarily characterized in pancreatic cancer (Xu et al., 2021). Nonetheless, m6A regulators-mediated methylation modification patterns and immune microenvironment are ambiguous in pancreatic cancer.
Here, this study systematically assessed m6A modification patterns in pancreatic cancer according to m6A regulatory genes and their correlations to immune microenvironment. Also, we developed a m6A scoring system for quantifying the m6A modification patterns in each specimen. These findings might enhance the comprehension on immune microenvironment characteristics as well as make more effective immunotherapeutic strategy.
Materials and Methods
Data Acquisition and Preprocessing
RNA sequencing profiling and copy number variation of pancreatic cancer were retrieved from The Cancer Genome Atlas (TCGA) via the UCSC Xena (https://gdc.xenahubs.net/). Meanwhile, the matched clinical data were acquired via cgdsr package. Genomic mutation data of pancreatic cancer containing somatic mutation were also obtained from TCGA database via TCGAbiolinks package (Colaprico et al., 2016). Use Mutation landscape of patients was characterized by maftools package. Also, expression profiles of two pancreatic cancer cohorts (PACA-AU and PACA-AU) were downloaded from ICGC cohort (https://dcc.icgc.org/projects). Specific clinical information was listed in Table 1. To maintain data consistency, sva package was applied for performing batch correction on the pancreatic cancer transcriptome data from TCGA and ICGC databases (Leek et al., 2012). The GSE79668 dataset containing RNA-seq and clinical information of 51 pancreatic cancer patients was downloaded from the Gene Expression Omnibus (GEO) repository (https://www.ncbi.nlm.nih.gov/gds/) (Kirby et al., 2016).
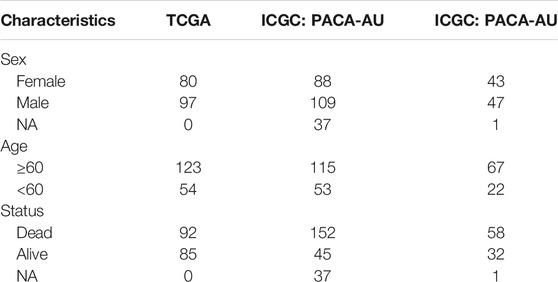
TABLE 1. Specific clinical information of pancreatic cancer patients.
Unsupervised Clustering Analysis
Expression profiles of 21 m6A regulators were extracted from TCGA and ICGC datasets as well as GSE79668 dataset. RCircos package was utilized for plotting the chromosome distribution of these regulators in chromosomes. Distinct m6A modification patterns were clustered according to expression of m6A regulators using unsupervised clustering analysis by ConsensusClusterPlus package (Wilkerson and Hayes, 2010). Patients were classified for distinct molecular subtypes for further analysis. The distance used for clustering was the Euclidean distance. This analysis was repeated 1,000 times to ensure the stability of clustering. Principal component analysis was applied for validating the accuracy of this classification.
Gene Set Variation Analysis
GSVA, a non-parametric, unsupervised method, is primarily utilized for estimating activity changes in pathway or biological process in a sample (Hänzelmann et al., 2013). For studying the differences in biological processes of distinct m6A modification patterns, GSVA package was applied to perform GSVA enrichment analysis based on gene expression profiles. The “c2.cp.kegg.v6.2” gene set from the Molecular Signatures Database (MSigDB) database (https://www.gsea-msigdb.org/gsea/index.jsp) was set as the reference set (Liberzon et al., 2015).
Single Sample Gene Set Enrichment Analysis
The infiltration levels of 24 immune cells were estimated in each sample by ssGSEA package. Then, the differences between m6A modification patterns were compared with Wilcox test. Univariate cox regression analysis was separately presented for assessing the associations between immune cells and prognosis of pancreatic cancer in each cluster.
Development of m6A Score System
Differentially expressed genes (DEGs) were screened between m6A modification patterns from TCGA and ICGC databases by limma package (Ritchie et al., 2015). The thresholds were set as adjusted p value < 0.05 and log2 |fold-change| > 0.5. The random forest method was utilized for removing redundant genes based on DEGs using randomForest, ROCR and Hmisc packages. The “meandecreaseaccuracy” parameter was set as the standard selection. Then, survival analysis on the remaining genes was performed. Genes with p < 0.05 were significantly related to survival outcomes of pancreatic cancer. By cox regression model, genes were separated into two categories according to positive or negative coefficients. m6A score was determined using the following formula: m6A score = scale(∑X−∑Y). X represented the expression value of the gene set for which regression coefficient was positive. Meanwhile, Y represented the expression value of the gene set for which regression coefficient was negative. Based on the median of m6A score, pancreatic cancer specimens were stratified into high and low m6A score groups. Kaplan-Meier curves and log-rank tests were performed for assessing the overall survival (OS) differences between groups.
Association Between m6A Score and Biological Pathways
Pearson analysis was performed for assessing associations between m6A score and several key biological pathways including immune checkpoints, antigen processing and presentation, EMT1, EMT2, EMT3, and other epithelial-mesenchymal transition (EMT) markers, DNA damage repair, mismatch repair, nucleotide excision repair, and the like.
Copy Number Variation Analysis
The GISTIC method was employed for detecting the shared copy number change area in all samples based on the SNP6 CopyNumber segment data. The parameters were set as: Q ≤ 0.05 was the change significance standard and the confidence level was 0.95 when determining the peak interval. The analysis was presented through MutSigCV function of GenePattern (https://cloud.genepattern.org/gp/pages/index.jsf) online tool.
Assessment of T Cell Dysfunction and Exclusion
TIDE (http://tide.dfci.harvard.edu) was employed for assessing the response to immune checkpoint blockade (ICB) (Jiang et al., 2018). TIDE score of each specimen was determined. Receiver operating characteristic curve (ROC) was then carried out for evaluating the efficacy of m6A scores for predicting the response to immunotherapy, and the area under the curve (AUC) was quantified with pROC package.
Statistical Analysis
Statistical analysis was achieved with R language (version 3.6.1) and appropriate packages. Wilcox test was applied for comparing the differences between groups. p < 0.05 indicated statistically significance.
Results
Landscape of Genetic Mutation and Expression of m6A Regulators in Pancreatic Cancer
Totally, 21 m6A regulators were analyzed in our study. Figure 1A showed the locations of these regulators on the chromosomes. Also, we summarized frequencies of CNV and somatic mutation. In Figure 1B, CNV was common in all regulators. Among them, ALKBH5, FMR1, HNRNPA2B1, IGF2BP1 and KIAA1429 had high frequencies of gain, while other regulators occurred high frequencies of loss. Among 185 pancreatic cancer specimens in TCGA dataset, 61 occurred somatic mutations (Figure 1C). Among them, ZC3H13 (11%), RBM15B (9%), YTHDF1 (8%), and YTHDC1 (6%) displayed higher genetic mutation frequencies. Also, we compared the expression patterns of these regulators in pancreatic cancer and normal tissues. In Figure 1D, YTHDC2, YTHDC1, HNRNPC, FMR1, FTO, IGF2BP1, and YTHDF3 were significantly dysregulated in pancreatic cancer.
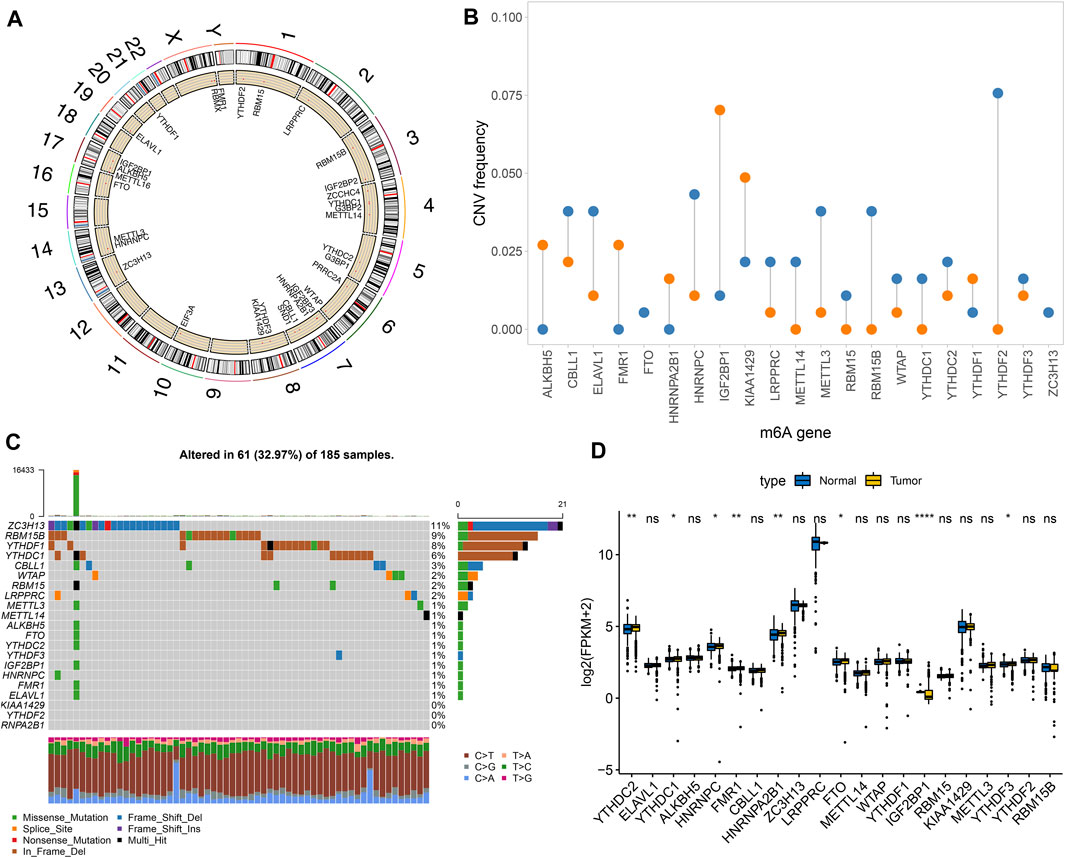
FIGURE 1. Landscape of genetic mutation and expression patterns of m6A regulators in pancreatic cancer. (A) The locations of m6A regulators on the chromosomes. (B) The distribution of CNV frequency of m6A regulators. Blue indicates deletion and orange indicates amplification. The height of bar indicates the variation frequency. (C) Landscape of somatic mutation of m6A regulators. (D) Box plot of expression patterns of m6A regulators in normal and pancreatic cancer. Ns: not significant; *p < 0.05; **p < 0.01; ****p < 0.0001.
Characterization of Two m6A Methylation Modification Patterns in Pancreatic Cancer
This study integrated RNA-seq data from TCGA and ICGC datasets and batch effects were removed by sva package (Figure 2A). By univariate cox regression analyses, associations between m6A regulators and prognoses of pancreatic cancer were evaluated. As a result, ELAVL1, ALKBH5, and KIAA1429 were distinctly correlated to the patients’ prognoses (Table 2). Figure 2B depicted the crosslinks between writers, erasers, and readers, indicating that the interactions between m6A regulators might exert a critical role in forming distinct m6A modification patterns. Multivariate cox regression analyses revealed that KIAA1429 served as an independent risk factor of pancreatic cancer prognosis among m6A regulators (Figure 2C). After extracting the expression profiles of 21 regulators in pancreatic cancer specimens from TCGA and ICGC datasets, unsupervised clustering analysis was carried out with ConsensusClusterPlus package. As a result, 2 modification patterns were clustered (m6A cluster A and m6A cluster B; Figure 2D; Supplementary Table S1). PCA results demonstrated the prominent differences between clusters based on the expression profiles of m6A regulators (Figure 2E). In Figure 2F, samples in m6A cluster B displayed poorer OS duration in comparison to those in m6A cluster A (p = 0.01). However, no significant differences in KRAS mutation (Figure 2G), TP53 (Figure 2H), metastasis (Figure 2I) and diabetes (Figure 2J) were found between clusters. The m6A clustering results and survival differences were confirmed in the GSE79668 dataset (Supplementary Figures S1A,B).
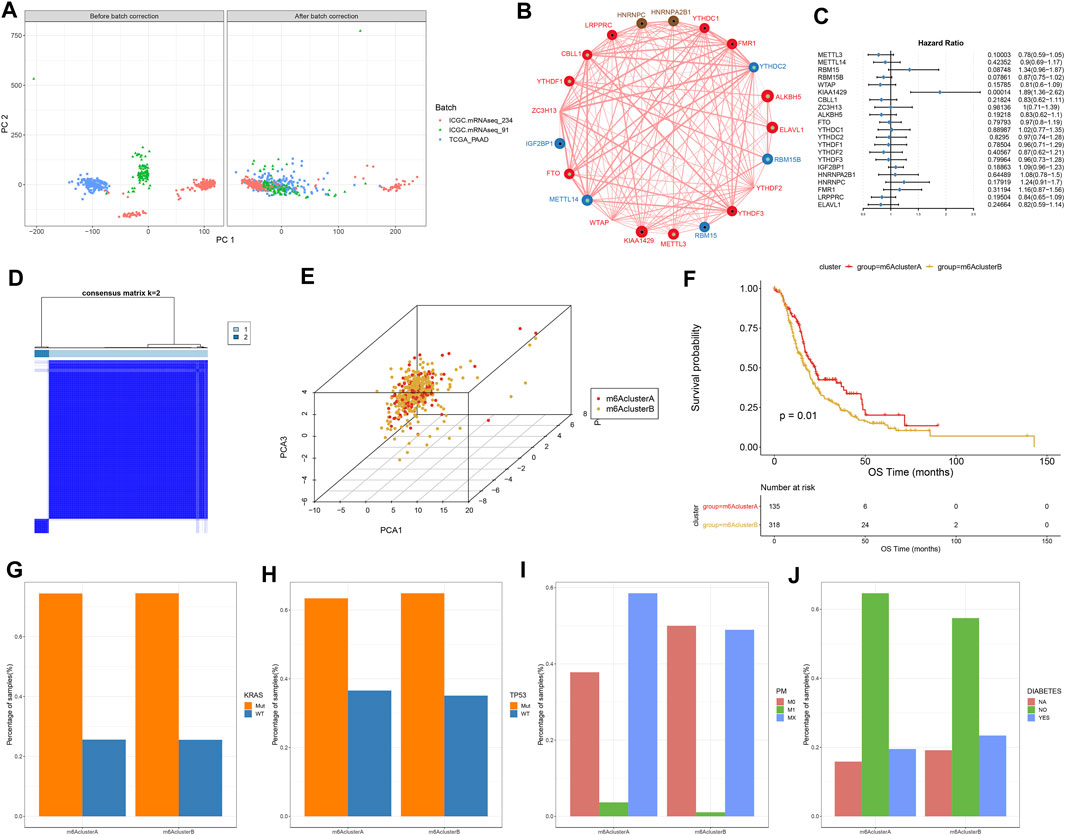
FIGURE 2. Construction of two m6A methylation modification patterns in pancreatic cancer from TCGA and ICGC datasets. (A) PCA plots showing before and after batch correction of TCGA and ICGC datasets. (B) An interaction network of m6A regulators. The size of the circle indicates the impact of each regulator on survival, and the larger the circle, the more relevant its expression is to the prognosis. The green dot in the circle indicates that the regulator is a protective factor for prognosis, and the black dot in the circle indicates that the regulator is a risk factor for prognosis. The lines connecting regulators indicate their interactions, negative correlations are marked in blue, and positive correlations are marked in red. (C) Multivariate cox regression analyses for assessing associations of m6A regulators with pancreatic cancer prognoses. (D) Consensus matrix heatmap when k = 2. (E) PCA plots showing the differences between m6A cluster A and B based on the expression profiling of m6A regulators. (F) Kaplan-Meier curves of two m6A clusters. P was determined with log-rank test. Distributions of (G) KRAS mutation, (H) TP53 mutation, (I) metastasis, and (J) diabetes in two m6A clusters.
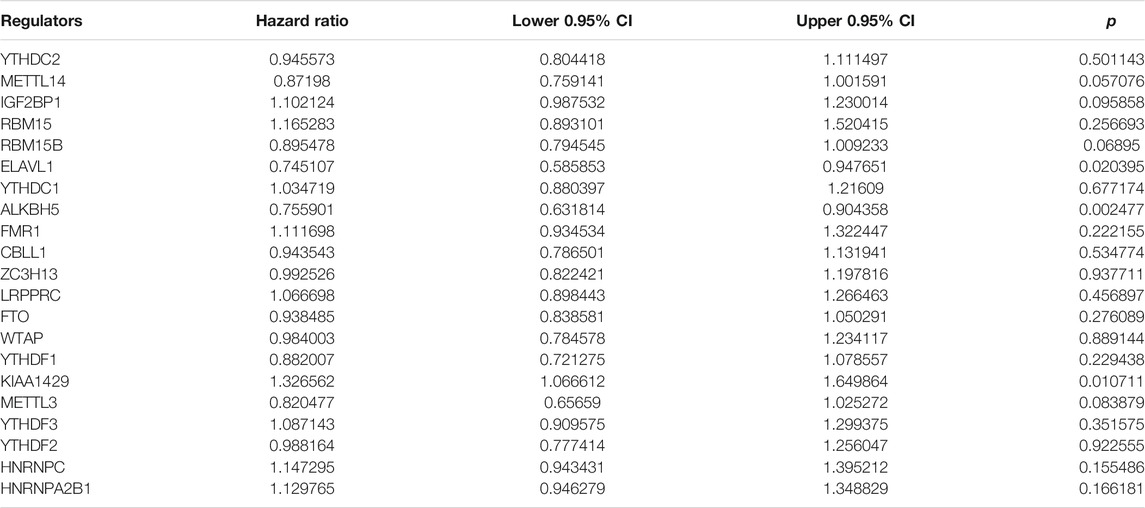
TABLE 2. Associations between m6A regulators and prognoses of pancreatic cancer.
Two m6A Methylation Modification Patterns Characterized by Distinct Immune Cell Infiltration, Biological Functions, and Genetic Mutations
Figure 3A depicted the expression patterns of 21 m6A regulators in two m6A methylation modification patterns. By ssGSEA algorithm, we estimated the infiltration levels of 24 immune cells in pancreatic cancer. Univariate cox regression analyses identified that activated CD4 T cell, activated dendritic cell, CD56bright natural killer cell, central memory CD4 T cell, gamma delta T cell and type 2 T helper cell were risk factors of pancreatic cancer prognoses in m6A cluster A (Figure 3B). In contrast, we observed that activated B cell, activated CD8 T cell, eosinophil, immature B cell, and macrophage were protective factors of pancreatic cancer prognoses in m6A cluster B (Figure 3B). In Figure 3C, m6A cluster B was charactered by higher infiltration levels of activated CD4 T cells, activated dendritic cells, central memory CD8 T cells, Effector memory CD4 T cells, eosinophils, immature B cells, immature dendritic cells, mast cells, neutrophils, regulatory T cells and type 2 T helper cells, indicating that there was higher immunogenicity in m6A cluster B. T explore the biological behaviors between these different m6A modification patterns, GSVA enrichment analysis was carried out. As a result, there were distinct differences in activation of glycosaminoglycan biosynthesis chondroitin sulfate, glycosaminoglycan biosynthesis keratan sulfate, one carbon pool by folate, RNA degradation, homologous recombination, propanoate metabolism, valine leucine and isoleucine degradation, non-homologous end joining, citrate cycle TCA cycle, olfactory transduction, purine metabolism, regulation of autophagy, ubiquitin mediated proteolysis, oocyte meiosis, endometrial cancer, adherens junction, starch and sucrose metabolism, lysine degradation, vasopressin regulated water reabsorption and lysosome between m6A clusters (Figure 3D). Furthermore, we found that DNA replication, nucleotide excision repair, homologous recombination and mismatch repair were significantly activated in m6A cluster A than cluster B (Figure 3E). However, EMT3 was distinctly activated in cluster B. We also compared the differences in genetic mutations between m6A clusters (Figures 3F,G). Higher frequency of mutation was found in cluster B (38.61%) than cluster A (32.91%).
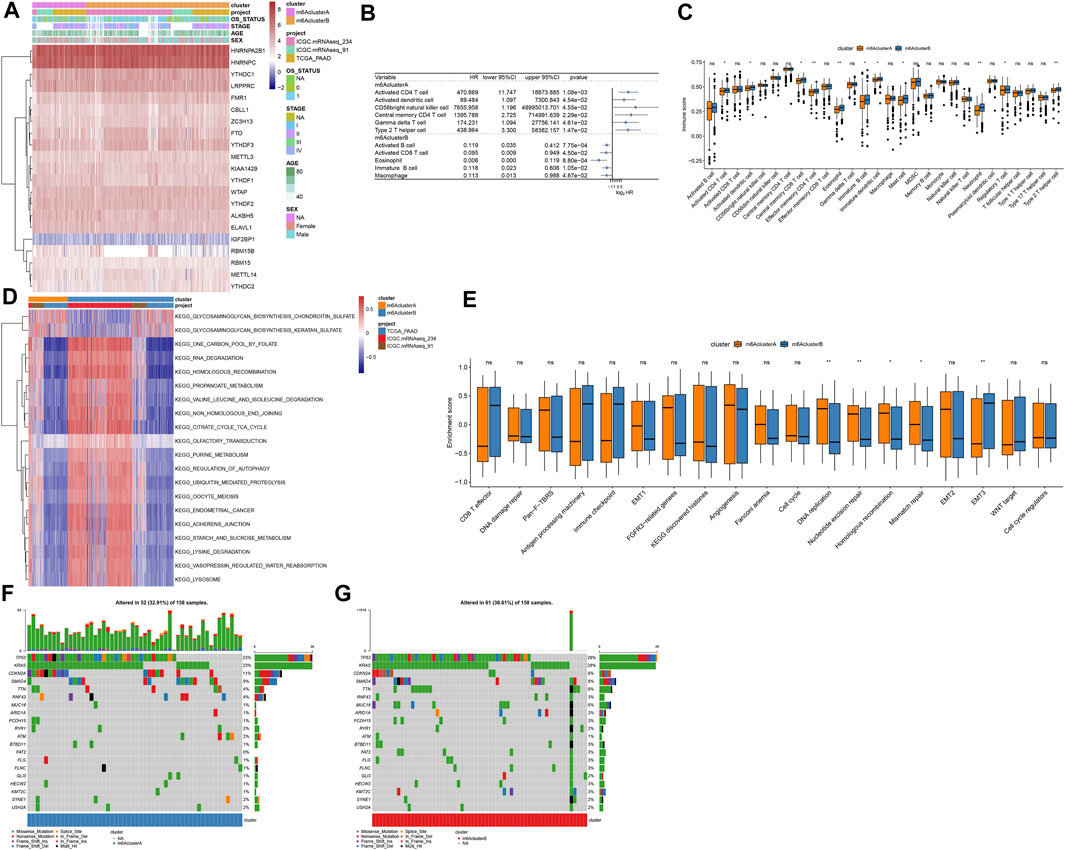
FIGURE 3. Two m6A methylation modification patterns with distinct immune cell infiltration, biological functions, and genetic mutation. (A) Heatmap of expression patterns of m6A regulators in m6A clusters (cluster A and B), OS status, stage, age, and sex. (B) Associations between immune cells and prognoses of pancreatic cancer. HR: hazard ratio and CI: confidence interval. (C) Box plot of the infiltration levels of immune cells in two m6A clusters. Ns: not significant; *p < 0.05; **p < 0.01. (D) GSVA enrichment analysis for the activation status of biological pathways in two m6A clusters. (E) Box plots of the enrichment scores of key biological processes in two m6A clusters. (F) The somatic mutation landscape of samples in m6A cluster A. (G) The somatic mutation landscape of samples in m6A cluster B.
Construction of m6A Gene Clusters in Pancreatic Cancer
To further study the potential mechanisms of m6A clusters, limma package was applied for determining 140 m6A-related DEGs with the cutoff values of p = 0.05, |log2fold-change| = 0.5 (Supplementary Table S2). By clusterProfiler package, we analyzed KEGG pathways based on the DEGs. Only ribosome was significantly enriched by the DEGs. Furthermore, we performed unsupervised cluster analysis based on the obtained m6A-related genes, and stratified the patients into two different m6A gene clusters named as m6A gene cluster A and B (Figure 4A; Supplementary Table S3). The expression patterns of the m6A-related genes were visualized, as shown in Figure 4B. METTL14, WTAP, CBLL1, ZC3H13, FTO, YTHDC1, YTHDC2, YTHDF3, HNRNPC, FMR1, and LRPPRC were distinctly up-regulated in m6A gene cluster B while RBM15B, ALKBH5, YTHDF1, and ELAVL1 were significantly up-regulated in m6A gene cluster A (Figure 4C).
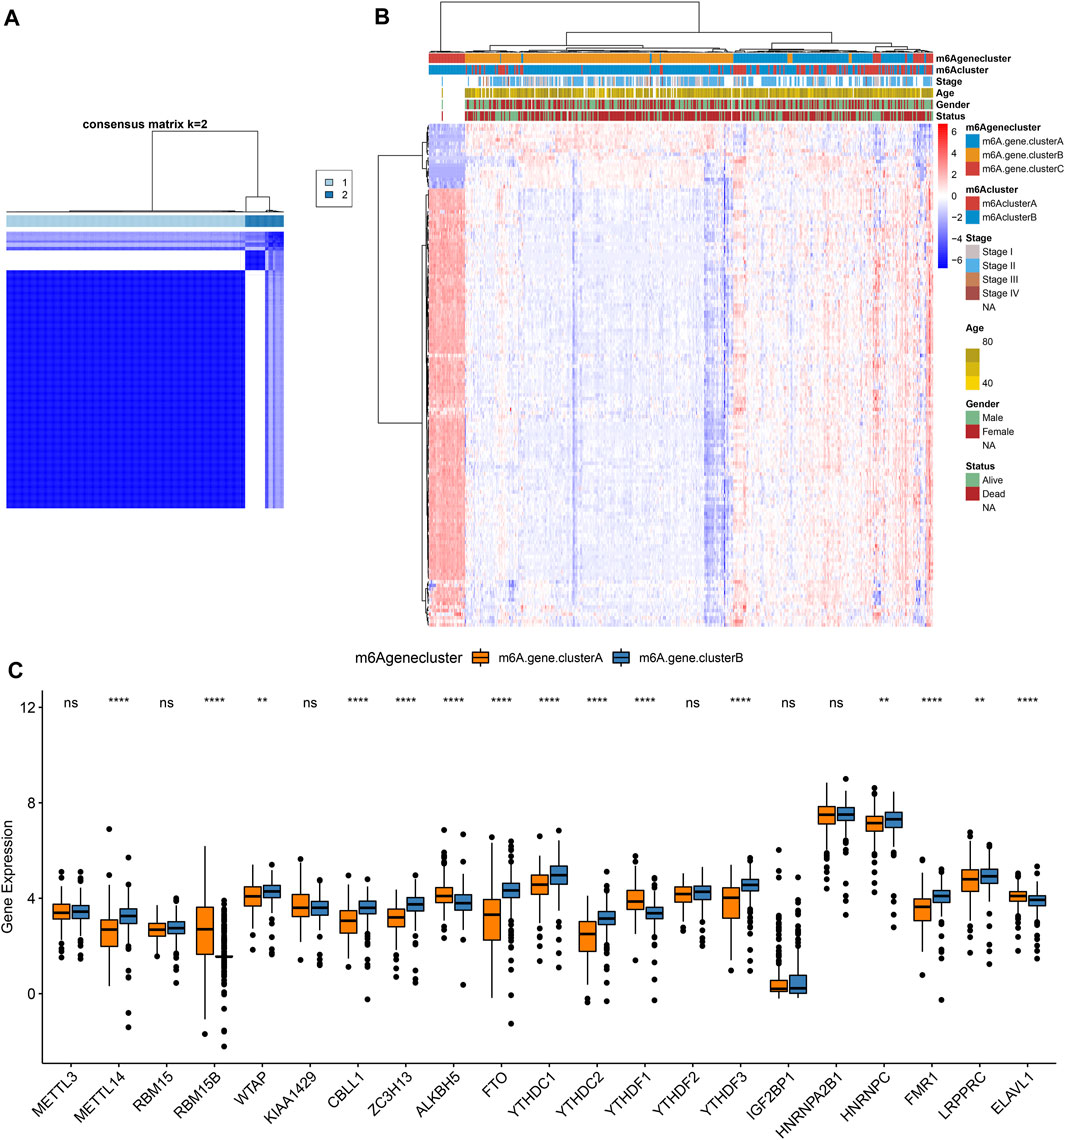
FIGURE 4. Construction of m6A gene clusters in pancreatic cancer. (A) Consensus matrix heatmap when k = 2. (B) Heatmap of two m6A gene clusters and expression patterns of m6A-related genes. (C) Box plot of expression patterns of 21 m6A regulators in m6A gene cluster A and B. Ns: not significant; **p < 0.01; ****p < 0.0001.
Development of a m6A Scoring System in Pancreatic Cancer
For the m6A-related genes, the random forest algorithm was used for eliminating the redundancy of DEGs. The characteristic genes that were most relevant to the classification were screened out, including RABAC1, ALKBH7, DPM3, POLR2I, MBD3, ISOC2, WBSCR16, CUTA, C17orf89, MRPL41, ZNF787, C19orf60, and C19orf43. By cox regression model, we determined the relationships between these genes and prognoses. According to the coefficients, the genes were divided into two categories. With the m6A score calculation formula, each pancreatic cancer was scored (Supplementary Table S4). Based on m6A score median, we stratified samples into high and low m6A score groups (Figure 5A). Higher m6A scores were detected in m6A cluster B (Figure 5B) and m6A gene cluster B (Figure 5C). There were not significant differences in primary sites (Figure 5D), sex (Figure 5E), age (Figure 5F) and stage (Figure 5G) between high and low m6A score groups. However, patients with dead status exhibited higher m6A score than those with alive status (Figure 5H).
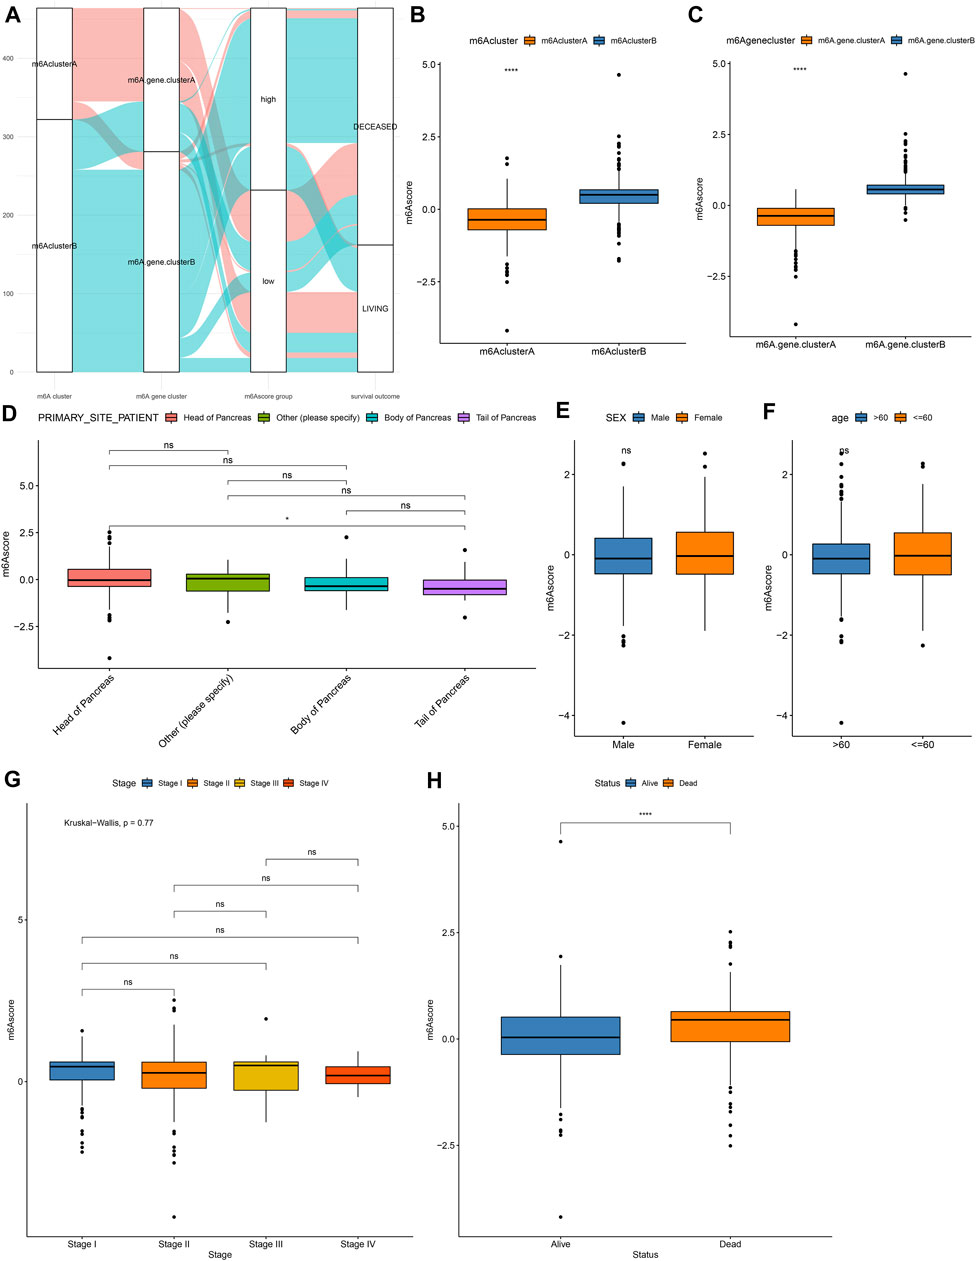
FIGURE 5. Development of a m6A scoring system in pancreatic cancer. (A) Alluvial diagram for the relationships of m6A modification patterns, m6A gene clusters and m6A scores. (B) Distribution of m6A scores in m6A cluster A and B. (C) Distribution of m6A scores in m6A gene cluster A and B. Distributions of m6A scores in (D) different primary sites, (E) sex, (F) age, (G) stage, and (H) survival status. Ns: not significant; ****p < 0.0001.
m6A Scores as a Prognostic Factor of Pancreatic Cancer
As shown in Figure 6A, patients in high m6A score group displayed a poor prognosis, while those in low m6A score group had a good prognosis, indicating that the m6A scoring system can provide a good characterization of the prognosis of pancreatic cancer. The prognostic implication of m6A score was confirmed in the GSE79668 dataset (Supplementary Figure S1C). In Figure 6B, m6A scores were distinctly correlated to DNA replication, nucleotide excision repair, homologous recombination, EMT2, EMT3, WNT target and cell cycle regulators. Furthermore, high m6A scores were characterized by activation of histones, EMT3, WNT target and cell cycle regulators, while low m6A scores were characterized by angiogenesis, cell cycle, DNA replication, nucleotide excision repair, homologous recombination, and mismatch repair (Figure 6C).
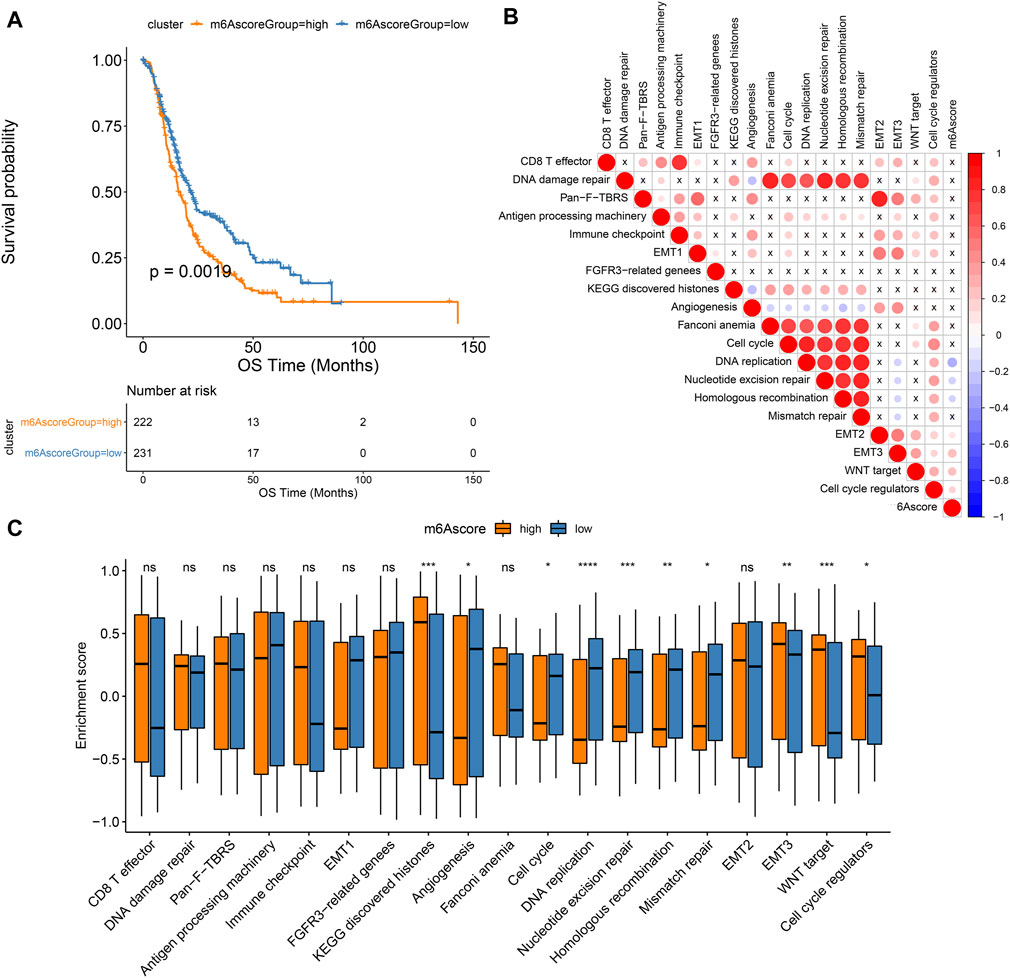
FIGURE 6. Associations between m6A scores and pancreatic cancer prognoses. (A) Kaplan-Meier curves of patients with high and low m6A scores. (B) Correlation between key biological processes and m6A scores. (C) Box plot of the enrichment scores of key biological processes in high and low m6A score groups. Ns: not significant; *p < 0.05; **p < 0.01; ***p < 0.001; ****p < 0.0001.
Assessment of Genetic Mutation Characteristics of High and Low m6A Scores
Our analysis found that m6A scores had no significant differences in KRAS mutation (Figure 7A) and TP53 mutation (Figure 7B). We applied maftools package for analyzing the differences in somatic mutations between high and low m6A score groups. Figures 7C,D showed the frequencies of genetic mutations in two groups. Both in high and low m6A score groups, FRG1B, KRAS, TP53, TCF20, MED12L, PRG4, OTUD4, and MYH9 were the eight most frequently mutated genes. Missense mutation was the main mutation type in pancreatic cancer. Figures 7E,F showed the distributions of CNV regions in two groups.
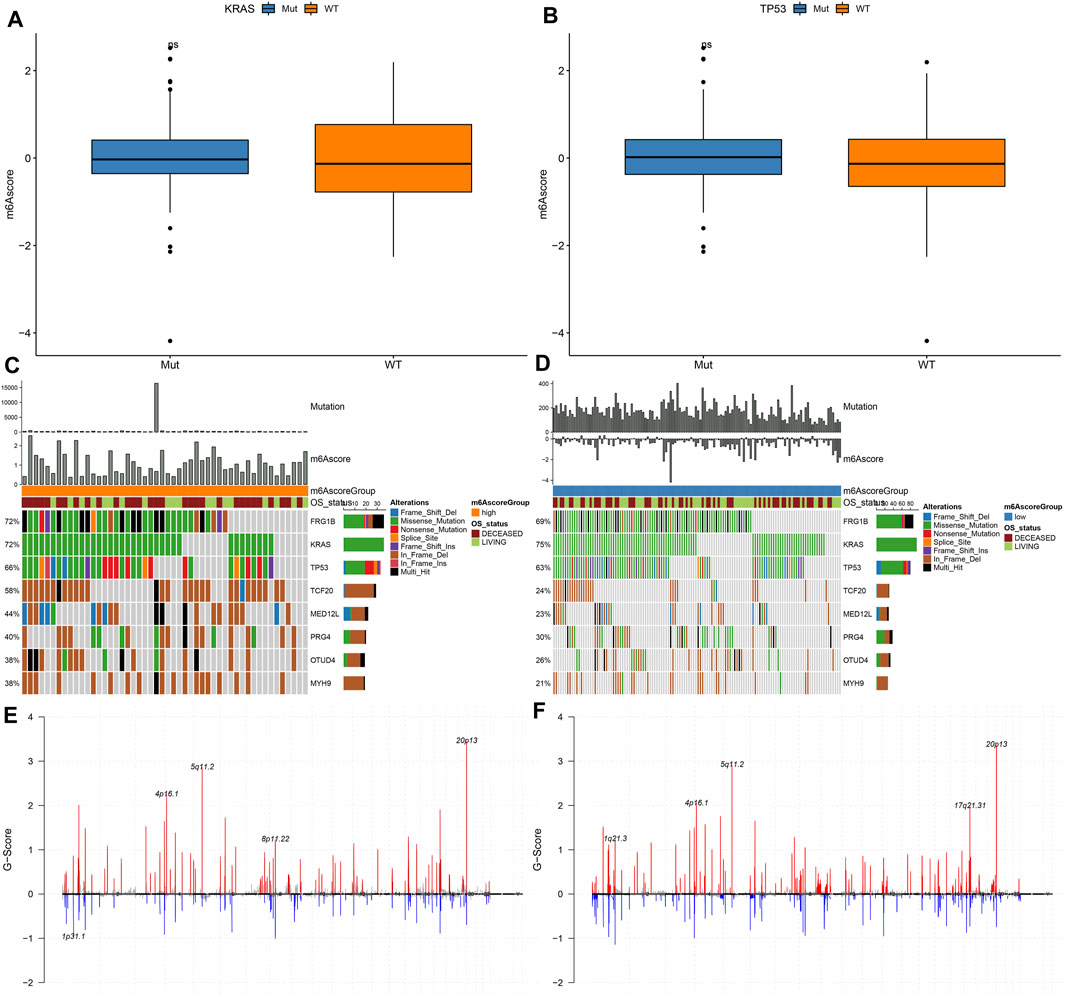
FIGURE 7. Genetic mutations of samples with high and low m6A scores. (A) Distribution of KRAS mutation in high and low m6A score groups. (B) Distribution of TP53 mutation in high and low m6A score groups. (C,D) The somatic mutation landscape of samples with high and low m6A scores. (E,F) The CNV landscape of samples with high and low m6A scores.
m6A Score as a Predictive Tool of Immunotherapy Response
We further employed pRRophetic package for estimating IC50 values of chemotherapy drugs (Cisplatin, Gemcitabine) based on the expression profile. There were no significant differences in IC50 values of Cisplatin and Gemcitabine between high and low m6A scores (Figures 8A,B). Furthermore, TIDE scores were determined for evaluating the clinical effects of ICB treatment in high and low m6A score groups based on the mRNA expression profiles. As shown in Figure 8C, TIDE scores of the high m6A score group were distinctly lower than low m6A score group. AUC reached 0.62, indicating that the m6A score might be utilized for predicting the response of immunotherapy (Figure 8D). Difference in TIDE scores between high and low m6A score groups was confirmed in the GSE79668 dataset (Figure 8E).
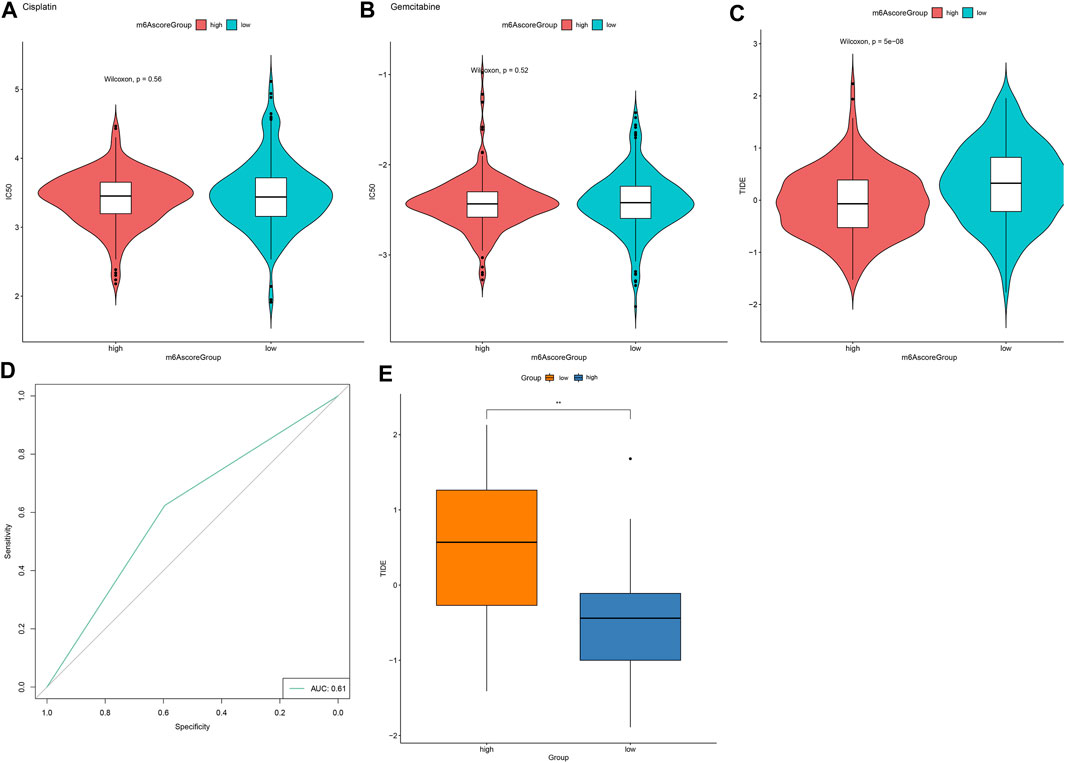
FIGURE 8. m6A score might be used for predicting the response to immunotherapy. (A,B) Violin plots for visualizing IC50 values of (A) cisplatin and (B) gemcitabine in high and low m6A score groups. (C) Violin plots of TIDE scores in high and low m6A score groups. Comparisons between groups were analyzed with Wilcoxon test. (D) ROC curves for assessing the response to immunotherapy based on m6A scores. (E) Validation of TIDE scores in high and low m6A score groups in the GSE79668 dataset. **p < 0.01.
Discussion
Pancreatic cancer represents a highly lethal malignancy with limited therapeutic options (Liang et al., 2020). Aberrant m6A levels participate in modulating cancer malignant phenotypes through affecting the expression of tumor-related genes (Guo et al., 2020). Pancreatic cancer patients with genetic alterations of m6A regulators exhibit worse disease-free and OS (Meng et al., 2020). Despite the anti-cancer effects of several m6A enzyme inhibitors, more effective m6A-related drugs and treatment options required to be further probed. Here, we constructed two m6A modification patterns, characterized by different survival outcomes, biological functions, and immune cell infiltration. To individually quantify the m6A modification, we developed a m6A scoring system. High m6A scores indicated undesirable clinical outcomes and predicted high sensitivity to respond to immunotherapy in pancreatic cancer.
32.97% pancreatic cancer samples occurred genetic mutations. ZC3H13 (11%), RBM15B (9%), YTHDF1 (8%), and YTHDC1 (6%) frequently occurred genetic mutations in pancreatic cancer. Frame shift deletion was the most mutation type of ZC3H13 and in-frame deletion was the most mutation classification of RBM15B, YTHDF1, and YTHDC1. Crosslink among writers, erasers. and readers participates in cancer pathogenesis and progress (Ma et al., 2019). Here, tight crosslinks between m6A regulators were found in pancreatic cancer. Based on the expression profiles of m6A regulators, we constructed two m6A clusters with distinct OS duration. Compared with m6A cluster A, we observed that m6A cluster B was charactered by higher infiltration levels of activated CD4 T cells, activated dendritic cells, central memory CD8 T cells, Effector memory CD4 T cells, eosinophils, immature B cells, immature dendritic cells, mast cells, neutrophils, regulatory T cells, and type 2 T helper cells, demonstrating higher immunogenicity in m6A cluster B. Consistently, previous studies have reported the interactions between m6A and tumor microenvironment of pancreatic cancer. For instance, both arm-level gain and deletion of ALKBH5 is relation to decreased infiltration of CD8 + T cell in pancreatic adenocarcinoma (Tang et al., 2020b).
This study proposed m6A score system for quantifying the m6A modification pattern of individual pancreatic cancer by PCA algorithm. Lowered m6A scores were detected in m6A gene cluster A. Furthermore, we found that m6A scores were not correlated to clinical characteristics including primary sites, sex, and age. Nevertheless, high m6A scores were in relation to depressed OS duration, demonstrating that m6A scores might be utilized for predicting pancreatic cancer prognoses. A previous study developed a six-m6A-regulator-signature prognostic model that was markedly associated with OS as well as clinical features (pathologic M, N, clinical stages, and vital status) (Hou et al., 2020). To uncover the molecular mechanism behind m6A scores, this study evaluated the enrichment scores of cancer-related pathways between high and low m6A score groups. High m6A scores were characterized by increased activation of EMT3, Wnt targets, and cell cycle regulators. YTHDF2 orchestrates EMT process in pancreatic cancer (Chen et al., 2017). ALKBH5 suppresses pancreatic cancer tumorigenesis through mediation of Wnt pathway (Tang et al., 2020a). Meanwhile, low m6A scores were distinctly related to angiogenesis, cell cycle, DNA replication, nucleotide excision repair, homologous recombination, and mismatch repair. Here, both in high and low m6A score groups, FRG1B, KRAS, TP53, TCF20, MED12L, PRG4, OTUD4, and MYH9 were the eight most frequently mutated genes. Missense mutation was the main type of mutation in pancreatic cancer. Genomic and transcriptomic research has uncovered key genetic mutations may drive pancreatic cancer initiation and progress, like KRAS driver mutation (beyond 90%) as well as frequently inactivated TP53 tumor suppressor (beyond 50%) (Peng et al., 2019). A previous study constructed a LASSO prognostic model based on the m6A regulators and showed that, KRAS mutation status prominently differed between high- and low-risk subgroups in pancreatic cancer (Geng et al., 2020). In our study, no significant differences in KRAS and TP53 mutations were found in high and low m6A score groups. Cisplatin and gemcitabine are standard chemotherapy protocols in pancreatic cancer (Liedtke et al., 2020). Nevertheless, chemo-resistance is the most common phenomenon in pancreatic cancer therapy (Herbst and Zheng, 2019). In previous research, up-regulating m6A demethylase ALKBH5 may enhance the sensitivity to gemcitabine in pancreatic cancer (Tang et al., 2020a). Furthermore, pancreatic cancer cells with inhibition of m6A writer METTL3 displays higher sensitivity to cisplatin and gemcitabine (Taketo et al., 2018). Above research emphasizes key roles of m6A regulators in pancreatic cancer resistance. Nevertheless, no significant differences in sensitivity to cisplatin and gemcitabine were detected between high and low m6A score groups.
ICB can produce long-lasting clinical effects. However, limited pancreatic cancer patients benefit from these therapies due to low immunogenicity as well as immunosuppressive tumor microenvironment (Macherla et al., 2018). Combining ICB with other modalities like vaccines, chemoradiotherapy, and target therapies possibly overcomes resistance and enhances immune response in pancreatic cancer. TIDE has been developed for predicting ICB response (Jiang et al., 2018). In previous research the efficacy of anti-PD-L1 therapy can be enhanced by m6A-binding protein YTHDF1 inhibition (Han et al., 2019). Also, suppression of m6A demethylase FTO may enhance the responsiveness to anti-PD-1 blockade (Yang et al., 2019). Here, high m6A score group displayed lower TIDE scores, indicating that these patients were more likely to respond to ICB therapies. AUC = 0.61 indicated that m6A scores might be utilized for predicting immunotherapy response.
Taken together, this study offered new insights into prolonging pancreatic cancer patients’ survival duration and enhancing the response to immunotherapy, thereby promoting personalized cancer immunotherapy.
Conclusion
Collectively, these data characterized two distinct m6A methylation modification patterns and their associations with immune microenvironment. By comprehensively evaluating individualized m6A modification patterns, we may fully understand immune microenvironment characteristics and develop more effective immunotherapeutic options.
Data Availability Statement
The original contributions presented in the study are included in the article/Supplementary Material, further inquiries can be directed to the corresponding author.
Author Contributions
Conception and design: KF, DT. Collection and assembly of data: DT, JM, CY, LG. Analysis and interpretation: KF, HQ. Article writing: JW, CY. Paper revision: KF.
Conflict of Interest
The authors declare that the research was conducted in the absence of any commercial or financial relationships that could be construed as a potential conflict of interest.
Publisher’s Note
All claims expressed in this article are solely those of the authors and do not necessarily represent those of their affiliated organizations, or those of the publisher, the editors and the reviewers. Any product that may be evaluated in this article, or claim that may be made by its manufacturer, is not guaranteed or endorsed by the publisher.
Supplementary Material
The Supplementary Material for this article can be found online at: https://www.frontiersin.org/articles/10.3389/fgene.2021.702072/full#supplementary-material
Abbreviations
OS, overall survival; m6A, N6-methyladenosine; TCGA, the cancer genome atlas; GSVA, gene set variation analysis; MSigDB, molecular signatures database; ssGSEA, single sample gene set enrichment analysis; DEGs, differentially expressed genes; EMT, epithelial-mesenchymal transition; CNV, copy number variation; TIDE, T cell dysfunction and exclusion; ICB, immune checkpoint blockade; ROC, receiver operating characteristic curve; AUC, area under the curve.
References
Bailey, P., Chang, D. K., Nones, K., Johns, A. L., Patch, A. M., Gingras, M. C., et al. (2016). Genomic analyses identify molecular subtypes of pancreatic cancer. Nature 531 (7592), 47–52. doi:10.1038/nature16965
Chen, J., Sun, Y., Xu, X., Wang, D., He, J., Zhou, H., et al. (2017). YTH domain family 2 orchestrates epithelial-mesenchymal transition/proliferation dichotomy in pancreatic cancer cells. Cell Cycle 16 (23), 2259–2271. doi:10.1080/15384101.2017.1380125
Colaprico, A., Silva, T. C., Olsen, C., Garofano, L., Cava, C., Garolini, D., et al. (2016). TCGAbiolinks: an R/Bioconductor package for integrative analysis of TCGA data. Nucleic Acids Res. 44 (8), e71. doi:10.1093/nar/gkv1507
Collisson, E. A., Bailey, P., Chang, D. K., and Biankin, A. V. (2019). Molecular subtypes of pancreatic cancer. Nat. Rev. Gastroenterol. Hepatol. 16 (4), 207–220. doi:10.1038/s41575-019-0109-y
Geng, Y., Guan, R., Hong, W., Huang, B., Liu, P., Guo, X., et al. (2020). Identification of m6A-related genes and m6A RNA methylation regulators in pancreatic cancer and their association with survival. Ann. Transl Med. 8 (6), 387. doi:10.21037/atm.2020.03.98
Guo, X., Li, K., Jiang, W., Hu, Y., Xiao, W., Huang, Y., et al. (2020). RNA demethylase ALKBH5 prevents pancreatic cancer progression by posttranscriptional activation of PER1 in an m6A-YTHDF2-dependent manner. Mol. Cancer 19 (1), 91. doi:10.1186/s12943-020-01158-w
Han, D., Liu, J., Chen, C., Dong, L., Liu, Y., Chang, R., et al. (2019). Anti-tumour immunity controlled through mRNA m6A methylation and YTHDF1 in dendritic cells. Nature 566 (7743), 270–274. doi:10.1038/s41586-019-0916-x
Hänzelmann, S., Castelo, R., and Guinney, J. (2013). GSVA: gene set variation analysis for microarray and RNA-seq data. BMC Bioinformatics 14, 7. doi:10.1186/1471-2105-14-7
He, L., Li, H., Wu, A., Peng, Y., Shu, G., and Yin, G. (2019). Functions of N6-methyladenosine and its role in cancer. Mol. Cancer 18 (1), 176. doi:10.1186/s12943-019-1109-9
Hegde, S., Krisnawan, V. E., Herzog, B. H., Zuo, C., Breden, M. A., Knolhoff, B. L., et al. (2020). Dendritic Cell Paucity Leads to Dysfunctional Immune Surveillance in Pancreatic Cancer. Cancer Cell 37 (3), 289–307. e289. doi:10.1016/j.ccell.2020.02.008
Herbst, B., and Zheng, L. (2019). Precision medicine in pancreatic cancer: treating every patient as an exception. Lancet Gastroenterol. Hepatol. 4 (10), 805–810. doi:10.1016/s2468-1253(19)30175-x
Ho, W. J., Jaffee, E. M., and Zheng, L. (2020). The tumour microenvironment in pancreatic cancer - clinical challenges and opportunities. Nat. Rev. Clin. Oncol. 17 (9), 527–540. doi:10.1038/s41571-020-0363-5
Hou, J., Wang, Z., Li, H., Zhang, H., and Luo, L. (2020). Gene Signature and Identification of Clinical Trait-Related m6 A Regulators in Pancreatic Cancer. Front. Genet. 11, 522. doi:10.3389/fgene.2020.00522
Jain, T., and Dudeja, V. (2021). The war against pancreatic cancer in 2020 - advances on all fronts. Nat. Rev. Gastroenterol. Hepatol. 18 (2), 99–100. doi:10.1038/s41575-020-00410-4
Jiang, P., Gu, S., Pan, D., Fu, J., Sahu, A., Hu, X., et al. (2018). Signatures of T cell dysfunction and exclusion predict cancer immunotherapy response. Nat. Med. 24 (10), 1550–1558. doi:10.1038/s41591-018-0136-1
Kirby, M. K., Ramaker, R. C., Gertz, J., Davis, N. S., Johnston, B. E., Oliver, P. G., et al. (2016). RNA sequencing of pancreatic adenocarcinoma tumors yields novel expression patterns associated with long-term survival and reveals a role for ANGPTL4. Mol. Oncol. 10 (8), 1169–1182. doi:10.1016/j.molonc.2016.05.004
Leek, J. T., Johnson, W. E., Parker, H. S., Jaffe, A. E., and Storey, J. D. (2012). The sva package for removing batch effects and other unwanted variation in high-throughput experiments. Bioinformatics 28 (6), 882–883. doi:10.1093/bioinformatics/bts034
Li, N., Kang, Y., Wang, L., Huff, S., Tang, R., Hui, H., et al. (2020). ALKBH5 regulates anti-PD-1 therapy response by modulating lactate and suppressive immune cell accumulation in tumor microenvironment. Proc. Natl. Acad. Sci. USA 117 (33), 20159–20170. doi:10.1073/pnas.1918986117
Liang, C., Shi, S., Qin, Y., Meng, Q., Hua, J., Hu, Q., et al. (2020). Localisation of PGK1 determines metabolic phenotype to balance metastasis and proliferation in patients with SMAD4-negative pancreatic cancer. Gut. 69 (5), 888–900. doi:10.1136/gutjnl-2018-317163
Liberzon, A., Birger, C., Thorvaldsdóttir, H., Ghandi, M., Mesirov, J. P., and Tamayo, P. (2015). The Molecular Signatures Database Hallmark Gene Set Collection. Cel Syst. 1 (6), 417–425. doi:10.1016/j.cels.2015.12.004
Liedtke, K.-R., Freund, E., Hermes, M., Oswald, S., Heidecke, C.-D., Partecke, L.-I., et al. (2020). Gas Plasma-Conditioned Ringer's Lactate Enhances the Cytotoxic Activity of Cisplatin and Gemcitabine in Pancreatic Cancer In Vitro and in Ovo. Cancers 12 (1), 123. doi:10.3390/cancers12010123
Ma, S., Chen, C., Ji, X., Liu, J., Zhou, Q., Wang, G., et al. (2019). The interplay between m6A RNA methylation and noncoding RNA in cancer. J. Hematol. Oncol. 12 (1), 121. doi:10.1186/s13045-019-0805-7
Macherla, S., Laks, S., Naqash, A., Bulumulle, A., Zervos, E., and Muzaffar, M. (2018). Emerging Role of Immune Checkpoint Blockade in Pancreatic Cancer. Ijms 19 (11), 3505. doi:10.3390/ijms19113505
Meng, Z., Yuan, Q., Zhao, J., Wang, B., Li, S., Offringa, R., et al. (2020). The m6A-Related mRNA Signature Predicts the Prognosis of Pancreatic Cancer Patients. Mol. Ther. - Oncolytics 17, 460–470. doi:10.1016/j.omto.2020.04.011
O’Reilly, E. M., Lee, J. W., Zalupski, M., Capanu, M., Park, J., Golan, T., et al. (2020). Randomized, Multicenter, Phase II Trial of Gemcitabine and Cisplatin with or without Veliparib in Patients with Pancreas Adenocarcinoma and a Germline BRCA/PALB2 Mutation. Jco 38 (13), 1378–1388. doi:10.1200/jco.19.02931
Peng, J., Sun, B.-F., Chen, C.-Y., Zhou, J.-Y., Chen, Y.-S., Chen, H., et al. (2019). Single-cell RNA-seq highlights intra-tumoral heterogeneity and malignant progression in pancreatic ductal adenocarcinoma. Cell Res. 29 (9), 725–738. doi:10.1038/s41422-019-0195-y
Qin, C., Yang, G., Yang, J., Ren, B., Wang, H., Chen, G., et al. (2020). Metabolism of pancreatic cancer: paving the way to better anticancer strategies. Mol. Cancer 19 (1), 50. doi:10.1186/s12943-020-01169-7
Ritchie, M. E., Phipson, B., Wu, D., Hu, Y., Law, C. W., Shi, W., et al. (2015). limma powers differential expression analyses for RNA-sequencing and microarray studies. Nucleic Acids Res. 43 (7), e47. doi:10.1093/nar/gkv007
Taketo, K., Konno, M., Asai, A., Koseki, J., Toratani, M., Satoh, T., et al. (2018). The epitranscriptome m6A writer METTL3 promotes chemo- and radioresistance in pancreatic cancer cells. Int. J. Oncol. 52 (2), 621–629. doi:10.3892/ijo.2017.4219
Tang, B., Yang, Y., Kang, M., Wang, Y., Wang, Y., Bi, Y., et al. (2020a). m6A demethylase ALKBH5 inhibits pancreatic cancer tumorigenesis by decreasing WIF-1 RNA methylation and mediating Wnt signaling. Mol. Cancer 19 (1), 3. doi:10.1186/s12943-019-1128-6
Tang, R., Zhang, Y., Liang, C., Xu, J., Meng, Q., Hua, J., et al. (2020b). The role of m6A-related genes in the prognosis and immune microenvironment of pancreatic adenocarcinoma. PeerJ 8, e9602. doi:10.7717/peerj.9602
Torphy, R. J., Schulick, R. D., and Zhu, Y. (2020). Understanding the immune landscape and tumor microenvironment of pancreatic cancer to improve immunotherapy. Mol. Carcinogenesis 59 (7), 775–782. doi:10.1002/mc.23179
Wang, M., Liu, J., Zhao, Y., He, R., Xu, X., Guo, X., et al. (2020). Upregulation of METTL14 mediates the elevation of PERP mRNA N6 adenosine methylation promoting the growth and metastasis of pancreatic cancer. Mol. Cancer 19 (1), 130. doi:10.1186/s12943-020-01249-8
Wilkerson, M. D., and Hayes, D. N. (2010). ConsensusClusterPlus: a class discovery tool with confidence assessments and item tracking. Bioinformatics 26 (12), 1572–1573. doi:10.1093/bioinformatics/btq170
Xu, F., Zhang, Z., Yuan, M., Zhao, Y., Zhou, Y., Pei, H., et al. (2021). M6A Regulatory Genes Play an Important Role in the Prognosis, Progression and Immune Microenvironment of Pancreatic Adenocarcinoma. Cancer Invest. 39 (1), 39–54. doi:10.1080/07357907.2020.1834576
Yang, S., Wei, J., Cui, Y.-H., Park, G., Shah, P., Deng, Y., et al. (2019). m6A mRNA demethylase FTO regulates melanoma tumorigenicity and response to anti-PD-1 blockade. Nat. Commun. 10 (1), 2782. doi:10.1038/s41467-019-10669-0
Keywords: pancreatic cancer, N6-methyladenosine regulators, prognosis, immune microenvironment, immunotherapy
Citation: Fang K, Qu H, Wang J, Tang D, Yan C, Ma J and Gao L (2021) Characterization of Modification Patterns, Biological Function, Clinical Implication, and Immune Microenvironment Association of m6A Regulators in Pancreatic Cancer. Front. Genet. 12:702072. doi: 10.3389/fgene.2021.702072
Received: 29 April 2021; Accepted: 06 September 2021;
Published: 17 September 2021.
Edited by:
Rais Ahmad Ansari, Nova Southeastern University, United StatesReviewed by:
Zitong Gao, University of Hawaii at Manoa, United StatesMehrdad Zarei, Case Western Reserve University, United States
Deli Liu, Weill Cornell Medicine, United States
Copyright © 2021 Fang, Qu, Wang, Tang, Yan, Ma and Gao. This is an open-access article distributed under the terms of the Creative Commons Attribution License (CC BY). The use, distribution or reproduction in other forums is permitted, provided the original author(s) and the copyright owner(s) are credited and that the original publication in this journal is cited, in accordance with accepted academic practice. No use, distribution or reproduction is permitted which does not comply with these terms.
*Correspondence: Kun Fang, k99ftl@163.com