A Literature Review of Performance Metrics of Automated Driving Systems for On-Road Vehicles
 Mysore Narasimhamurthy Sharath
 Babak Mehran
- Department of Civil Engineering, University of Manitoba, Winnipeg, MB, Canada
The article presents a review of recent literature on the performance metrics of Automated Driving Systems (ADS). More specifically, performance indicators of environment perception and motion planning modules are reviewed as they are the most complicated ADS modules. The need for the incorporation of the level of threat an obstacle poses in the performance metrics is described. A methodology to quantify the level of threat of an obstacle is presented in this regard. The approach involves simultaneously considering multiple stimulus parameters (that elicit responses from drivers), thereby not ignoring multivariate interactions. Human-likeness of ADS is a desirable characteristic as ADS share road infrastructure with humans. The described method can be used to develop human-like perception and motion planning modules of ADS. In this regard, performance metrics capable of quantifying human-likeness of ADS are also presented. A comparison of different performance metrics is then summarized. ADS operators have an obligation to report any incident (crash/disengagement) to safety regulating authorities. However, precrash events/states are not being reported. The need for the collection of the precrash scenario is described. A desirable modification to the data reporting/collecting is suggested as a framework. The framework describes the precrash sequences to be reported along with the possible ways of utilizing such a valuable dataset (by the safety regulating authorities) to comprehensively assess (and consequently improve) the safety of ADS. The framework proposes to collect and maintain a repository of precrash sequences. Such a repository can be used to 1) comprehensively learn and model the precrash scenarios, 2) learn the characteristics of precrash scenarios and eventually anticipate them, 3) assess the appropriateness of the different performance metrics in precrash scenarios, 4) synthesize a diverse dataset of precrash scenarios, 5) identify the ideal configuration of sensors and algorithms to enhance safety, and 6) monitor the performance of perception and motion planning modules.
1 Introduction
About 90% of road accident fatalities are attributed to human errors such as distraction, fatigue, violation of traffic rules, and poor judgements (Treat et al., 1979; Katrakazas, 2017; Collet and Musicant, 2019; Wood et al., 2019). Automation of the driving task offers an excellent opportunity to reduce such errors and consequently improve road safety, accident costs, productivity, mobility, and convenience. Automated Driving Systems (ADS) are rigorously being developed across the globe, realizing these tremendous potentials. ADS (SAE level 3, 4, or 5) can simultaneously handle lateral and longitudinal motions of the vehicles (SAE, 2018).
Well-conceived performance metrics shall be practicable and ideally not involve subjective terms (e.g., thresholds). As safety is being quantified, supporting evidence from field evaluations and simulations are necessary. According to National Highway Traffic Safety Authority (NHTSA), it is premature to regulate the safety standard for ADS (NHTSA, 2020). There is no clear consensus about the performance metrics among the researchers or ADS developers. Ill-conceived (as opposed to well-conceived) performance metrics may deter the development or progression of ADS, or worse, provide a false sense of security/performance. Hence, NHTSA is presently seeking inputs from researchers, regulators, and ADS developers to formulate the safety standards for ADS. Its European Union counterpart, the World Forum for Harmonization of Vehicle Regulations, is also actively working on this matter. This emphasizes the need for a literature review of the available performance metrics to gauge the performance of ADS.
However, ADS have safety-of-life critical applications. This characteristic necessitates appropriate guidelines, rules, and regulations to ensure technological advancement without compromising road safety. Performance requirements to ensure the safety of ADS are therefore to be standardized and regulated. The performance metrics used for such a task shall be practicable and objective, meaning that the metrics shall be computed based on scientific measurements (not opinion-based) and be consistent.
Nevertheless, in the absence of standards/regulations, some ADS developers have resorted to voluntary assessment (self-assessment) of safety aspects of ADS. Self-developed performance metrics are being employed to improve the ADS, using data from limited field deployments. Several other research studies related to the safety of ADS are already published (e.g., Al-khoury, 2017; Every et al., 2017; Fraade-blanar et al., 2018; Nistér et al., 2019; Wood et al., 2019; Berk et al., 2020; Riedmaier et al., 2020; Weng et al., 2020; Wishart et al., 2020; Bansal et al., 2021; Elli et al., 2021; Huang and Kurniawati, 2021; Luiten et al., 2021; Wang et al., 2021). Researchers across the globe are making a considerable effort to quantify the safety of ADS and consequently improve it.
The development of performance metrics demands the understanding of driving tasks. Successful execution of driving tasks by human drivers depends on 1) knowing the current state of self (such as location, speed, acceleration, and steering angle), 2) perceiving the states of surrounding obstacles, 3) planning the future course of action ensuring safety, and 4) controlling the vehicle using steering wheel, throttle, and brakes. Analogously, ADS can be considered to have four primary modules (Figure 1): 1) localization, 2) perception, 3) motion planning, and 4) vehicle control. ADS can also have an additional module dedicated to wireless communications.
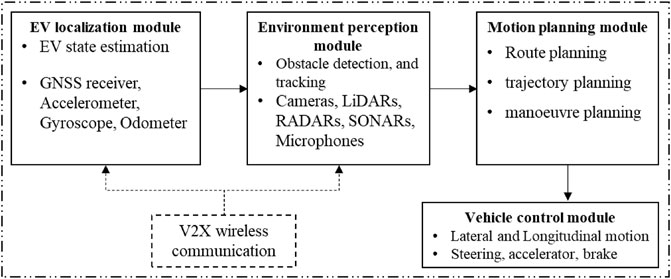
FIGURE 1. Primary modules in an ADS.
Ego vehicle (EV) localization involves measuring the state of EV like position, velocity, and acceleration. Global Navigation Satellite Systems (GNSS) such as GPS, Galileo, GLONASS, BeiDou or regional navigation satellite systems (RNSS) such as IRNSS or QZSS can be used for rough state estimation. Localization accuracy of such standalone systems is generally not suitable for safety-of-life-critical applications. Integration of GNSS/RNSS positioning information with GIS road maps and other sensors such as accelerometers and gyroscopes can enhance the localization accuracy (e.g., Yeh et al., 2016; Li et al., 2017; Sharath et al., 2019; Wang et al., 2019). However, GNSS/RNSS availability diminishes in tunnels and under forest cover. Urbanization introduces multi-path errors, which may deteriorate the quality of localization. Lane-level localization using visual cues such as lane markings or other road signs is also possible (e.g., Li et al., 2010; Alkhorshid et al., 2015; Gaoya; Kamijo et al., 2015; Qu et al., 2015; Cao et al., 2016; Kim et al., 2017). But such systems can suffer inaccuracies due to occlusion.
Environment perception involves abstracting information from the surrounding. It involves measuring the states (e.g., position, velocity, acceleration, and type/class) of surrounding obstacles. A combination of RADARs, LiDARs, and cameras is used to detect, classify, and track the surrounding obstacles (Zhu et al., 2017). Computer vision is a popular approach due to the low cost of cameras and the ability to classify the obstacles accurately (e.g., Mohamed et al., 2018; Janai et al., 2020). Machine learning approaches for environment abstraction are on the rise and appear promising (e.g., Yang et al., 2019; Fayyad et al., 2020; Sligar, 2020).
Information about the surroundings is used to plan the EV’s future actions to safely navigate in a dynamic environment. Motion planning (trajectory planning to be more precise) of autonomous vehicles is another very challenging task. Extreme care is to be exercised to ensure safety. The process involves deciding the EV’s future states (position, velocity, acceleration) in the dynamic traffic environment. Humans make such decisions based on multiple parameters (see Human-likeness and ADS). Multivariate interactions are to be considered in the human-like motion planning of autonomous vehicles.
The final task is to execute the planned motion. The vehicle control module performs this action. Wireless communication between every entity on the road can substantially simplify the devious task of the environment perception module. However, such a situation could occur only when all the vehicles plying on the road are equipped with a wireless communication module.
The most challenging tasks are assigned to the perception and motion planning modules. Proprioceptive sensors (such as speedometer, accelerometer, and gyroscope) and exteroceptive sensors (such as cameras, LiDARs, and RADARs) fetch data from the surroundings. Understanding/abstracting the surroundings by processing data received from such sensors is the perception module’s primary task. The perception module deals with the detection, classification, and tracking of obstacles. It also anticipates the future states of the obstacles. This forms the basis for planning the future motion of the EV. The EV’s safe and efficient movement in the dynamic traffic is made possible by the motion planning module using the current and future states of surrounding obstacles. Motion planning involves making high-level decisions (such as overtaking, lane changing, turning, and following) and low-level decisions (such as deciding instantaneous speed, acceleration, braking, and steering). Errors in any of these tasks may get cascaded and eventually result in an unsafe situation.
The safety of the ADS thus depends on the performance of these primary modules. The environment perception sensors used by different ADS are different. Some developers use cameras as primary sensors, while others make use of LiDARs. As such, the perceived environment will inherently depend upon the configuration of sensors used. The software (algorithms and sensor fusion) used for processing/analysis of data perceived by sensors has a pivotal role in determining the performance of ADS. Furthermore, human drivers and ADS coexist for the next several decades. The driving behavior of ADS shall be similar to that of human drivers to ascertain public acceptance. These aspects present a unique challenge to the regulatory authority. The performance metrics shall be able to incorporate all the points mentioned above.
This article attempts to review the metrics used to quantify the performance of perception and motion planning modules (two of the most complicated modules). Introduction and need for the current work are presented in Section 1 and Section 2. Section 3 provides the performance metrics for environment perception and motion planning modules. Furthermore, the need for metrics to quantify human-like perception and driving behavior is elaborated in Section 4. The advantages and limitations of the existing performance metrics are summarized in Section 5. Lastly, a framework for safety regulating authorities to collect information regarding scenarios resulting in an incident is presented in Section 6. The regulatory authorities may use this repository of benchmark scenarios/datasets to compare different ADS objectively. More specifically, a repository of edge cases (critical scenarios) where the ADS tend (or observed) to perform poorly may be used for selecting/formulating the performance metrics and eventually specifying the performance requirements. The work is summarized in Section 7.
2 Research Contributions
This article makes the following contributions:
1) A literature review on the safety-quantifying metrics of environment perception and motion planning algorithms are presented.
2) Obstacles posing a high-level risk to the safety of the subject vehicle need to be accurately perceived and proper action taken. On the contrary, erroneous perception of an obstacle that poses no threat may be acceptable. The need for the inclusion of threat levels of obstacles in the performance metric is identified. A novel multivariate cumulative distribution approach to assess (human-like) threat levels is presented. A similar approach can be used for human-like motion planning.
3) A suggestion to the safety regulating authority in the form of a framework is presented. The framework focuses on collecting the states of subject vehicles and the obstacles resulting in incidents. Such a repository can be used for quantifying, monitoring, and evaluating the safety of different ADS.
3 Environment Perception, Motion Planning, and Their Performance Metrics
The performance of an ADS can be considered to depend on the following four components: 1) Hardware, 2) Software, 3) State of subject vehicle (also called ego vehicle), and 4) State of obstacles. The hardware component involves the sensors used to perceive the environment (e.g., cameras, LiDARs, RADARs, and wireless communication modules), proprioceptive sensors (e.g., GNSS receiver, odometer, odometer, gyroscope, and accelerometer), and actuators used for vehicle control (Winner et al., 2014). On the other hand, the software component deals with the fusion of multiple sensors, analysis of data received from various sensors, and motion planning of the EV based on such an analysis. The most complicated component of an ADS would be the software component, which includes understanding the data received from various sensors (detection, classification, and tracking of other traffic entities, and future state prediction of the obstacles). Based on such understandings, the future states of the EV would be determined to ensure safety. The states of the EV (e.g., speed, acceleration, position) and that of other traffic entities dictate the performance of the ADS. ADS may drive the EV into a precarious situation due to inappropriate hardware and/or software implementation. The threat to safety can also arise purely from external sources (other traffic entities).
Several manufacturers/organizations are independently developing ADS. The hardware and software components influencing performance thus significantly vary between different ADS developers. As such, a unified metric to quantify the performance of an ADS may not be possible. Furthermore, SAE level 3 vehicles require human drivers’ intervention in case of a fallback. As humans are in the loop, performance metrics should include human factors as well. These aspects further complicate the task of setting up safety standards by regulatory authorities.
The performance of an ADS depends on that of the EV localization, perception, motion planning, and vehicle control module (Berk et al., 2020). Perception and motion planning modules are the most complicated and influencing parts of an ADS. Hence, the performance metrics or indicators for these two modules are reviewed in this article.
3.1 Performance Metrics for Environment Perception
Environment perception involves understanding/measuring the state of surrounding (dynamic) obstacles. State includes position, velocity, acceleration, and class/type. Cameras are generally used for object (obstacle) detection and tracking in ADS. Data from other sensors (e.g. point cloud data from LiDARs) can also be used for object detection and tracking. A comparison of the three major sensors used for environment perception is provided in Table 1, which is compiled by reviewing multiple sources (Hasch et al., 2012; Murad et al., 2013; Patole et al., 2017; Will et al., 2017; Campbell et al., 2018; Lin and Zhang, 2020; Lu et al., 2020; Wang et al., 2020; Zaarane et al., 2020; Yeong et al., 2021).
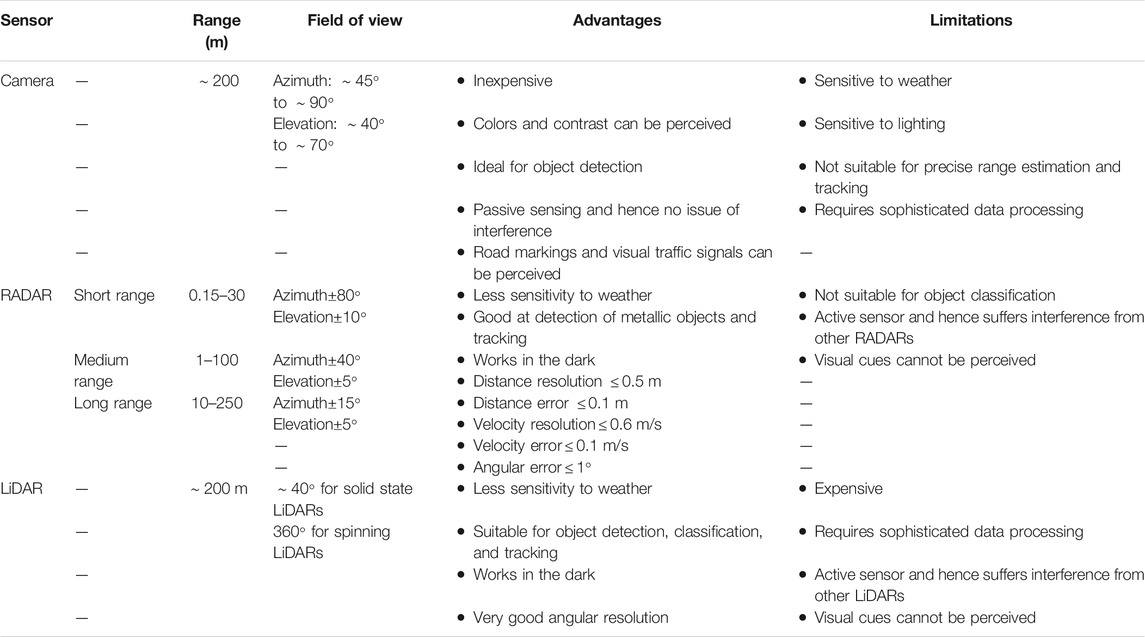
TABLE 1. Comparison of sensors used for environment perception.
Cameras are the ubiquitous sensors in ADS. Monocular cameras tend to have a longer range compared to stereo cameras. Thermal/infrared cameras are also used to detect objects in low-lighting conditions (e.g., Korthals et al., 2018; John and Mita, 2021). The field of view depends on the focal length of the lens used. Multi-input multi-output RADARs are being extensively used in ADS due to their high angular resolution and smaller size (Sun et al., 2020). Cameras and LiDARs complement each other in adverse weather conditions. LiDARs are accurate sensors with a few caveats. They are very expensive, computationally challenging and cannot perceive visual cues. Cameras and LiDARs are both active sensors (emit electromagnetic radiation and analyze the scattered/reflected signals) and hence could suffer from interference when multiple such sensors are placed in close proximity. GNSS receivers are used to locate the vehicle on a road map through a process called map-matching (e.g., Quddus, 2006, 2013; Velaga et al., 2009; Sharath et al., 2019). The positioning accuracy of GNSS receivers is approximately 5–20 m, and GNSS availability may be compromised under forest cover and in tunnels. Integration of the inertial sensors such as accelerometers and gyroscopes with GNSS receivers can mitigate the issue of unavailability and poor positioning accuracy to some extent. Visual cues such as road markings perceived from cameras can also be used to localize the EV. Multiple sensors are to be fused/integrated to achieve sufficient redundancy in safety-of-life-critical applications.
Object detection involves estimating the states of the vehicles at a time step based on data received from sensors. Figure 2 depicts one such instance where the black bounding box is the estimated position. Tracking (also called association) is the process of detecting multiple obstacles and associating a unique identifier to the corresponding obstacles in different time steps (Figure 3.
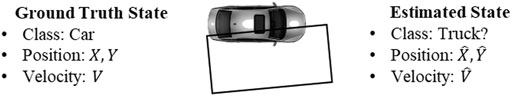
FIGURE 2. Object detection.
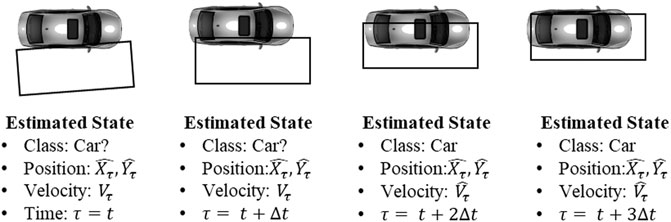
FIGURE 3. Tracking or association.
In the figure, Class indicates the type of the obstacle (e.g., bike, car, truck, and pedestrian). Cameras are popularly used for obstacle classification.
Data from multiple perception sensors such as LiDARs and RADARs can be used to estimate
Environment perception happens using multiple sensors such as cameras, LiDARs, RADARs, SONARs, and microphones. Cameras are prevalent because of their low cost. Visual cues such as lane markings and traffic signs can be perceived using cameras (Pollard et al., 2011; Yogamani et al., 2019). However, range measurements are less precise. Cameras are susceptible to weather conditions, and their ability drastically drops in inclement weather. Multiple cameras are generally used to perceive the environment in all directions. Thermal infrared cameras may also be used to sense the environment in the dark (Miethig et al., 2019; Dai et al., 2021).
LiDARs, though expensive, are suitable for precise range measurements. They are less susceptible to weather conditions. Hence, they are ideal for classification and tracking (Wang et al., 2017; Gao et al., 2018). RADARs can accurately detect and track metallic objects. They are less sensitive to weather conditions. Short-range RADARs can be used to detect vulnerable road users (pedestrian and bicyclists) by analyzing micro-Doppler signatures (Steinhauser et al., 2021). However, micro-Doppler effects are not pronounced for stationary objects, and hence they may not be detected. Both RADARs and LiDARs are active sensors, meaning they emit electromagnetic radiation and perceive reflected/scattered radiation. This aspect makes them vulnerable to interference when multiple active sensors are in close proximity. Researchers are working to mitigate interference (Goppelt et al., 2010; Alland et al., 2019). Ultrasonic range measurement sensors are popular in detecting closer objects. Microphones are necessary to respond to audio cues such as that from emergency vehicles.
3.1.1 Traditional Metrics or Performance Indicators
Cameras serve as convenient object detection and tracking sensor. A frame extracted from a video would have multiple objects (obstacles) of interest. First, objects are to be detected and segmented. Then the detected objects are to be identified/classified. Last, an application such as ADS requires that the objects be tracked (i.e., to understand the association of detected objects between the successive frames). These complex tasks are handled by computer vision algorithms. True Positive (
Recall (
Precision (
Jaccard distance (Volk et al., 2020; Luiten et al., 2021) used both
None of the above-described metrics considers the quality of detection/classification/tracking as a binary decision is made (based on a threshold). Tightly bound segmentation of an object is the desired quality apart from its correct detection. Intersection over Union (iou) metric addresses this aspect and is given by:
where
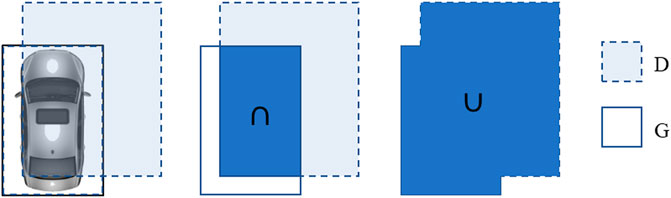
FIGURE 4. IoU indicator for quantifying the performance of perception module.
3.1.2 CLEAR Metrics for Evaluation of Object Detection and Tracking
Traditional metrics described above place emphasis on object detection. Tracking, which is an association of detected objects in successive time steps, is of equal importance. Hence, metrics have been developed to quantify the detection as well as tracking quality (Stiefelhagen et al., 2006).
CLassification of Events, Activities and Relationships (CLEAR) is one of the popular studies that described the metrics for quantifying object detection and tracking accuracy (Stiefelhagen et al., 2006; Volk et al., 2020). These metrics can be used for the detection and tracking of obstacles such as pedestrians and vehicles. The metrics are described below:
Multiple-Object-Tracking Accuracy (
Multiple-Object-Tracking Precision (
Multiple-Object-Detection Accuracy (
where
3.1.3 Higher Order Tracking Accuracy (HOTA) Metric
CLEAR metrics are constituted by multiple indicators, which can be a hindrance for real-time applications (Volk et al., 2020). Also, detection performance takes precedence over tracking/association performance. Hence, Luiten et al. (2021) have adapted the basic indicators to incorporate the tracking aspect.
Association score for object
Detection accuracy,
Association accuracy,
Finally, the
HOTA metric unifies detection and association metrics. Thus, it provides a balanced emphasis on detection and association/tracking. The metric has been thoroughly analyzed and validated (Luiten et al., 2021).
Performance Metrics for Motion Planning
Motion planning involves deciding future states of the vehicles at trajectory level and planning maneuvers (Katrakazas et al., 2015). This section includes the performance metrics used at both trajectory levels and for maneuver planning.
3.1.4 Traditional Metrics
Time-To-Collision (TTC): It is the time required to observe a collision between an EV and an obstacle if both of them continue to travel without changing velocities (Minderhoud and Bovy, 2001; Vogel, 2003; Forkenbrock and Snyder, 2015; Johnsson et al., 2018; Li et al., 2021; Wang et al., 2021). It is one of the most popular safety indicators of longitudinal motion of the EV and is given by Hou et al. (2014):
where
Time Exposed Time-to-Collision (TET): Cumulative duration for which TTC remains lower than a specified threshold. Both TTC and TET are suitable to quantify risks of collisions like rear-end, turning, and weaving (Mahmud et al., 2017). Usually, a threshold level is set to compute the duration for which a violation occurs. TET can be computed as:
where
Post Encroachment Time (PET): It is the time gap between the arrival of two vehicles in the area of potential conflict. PET can be used to quantify the safety risk at intersections, weaving, and merging sections (Wishart et al., 2020). Figure 5 1) depicts the time instant
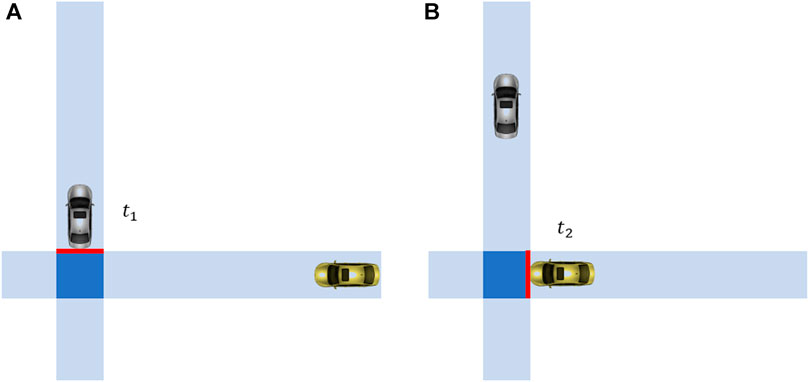
FIGURE 5. Definition of post encroachment time.
These traditional metrics primarily consider the one-dimensional motion (longitudinal) of the EV. However, in the real world, multiple obstacles can simultaneously interact with the EV (pose a threat to the safety of the EV). As such, the EV’s two-dimensional (lateral and longitudinal) motion is to be considered in quantifying the safety.
There are other relatively less popular safety indicators such as Time Integrated Time-to-Collision, J-value, standard deviation of lateral position, time-to-intersection, time-to-obstacle (Mahmud et al., 2017).
3.1.5 Responsibility-Sensitive Safety (RSS) Metrics
Specific popular metrics used for indicating/improving the safety of ADS such as 1) miles driven, 2) total number of near-collision incidents/disengagements, 3) simulation, and 4) scenario-based approaches have severe drawbacks (Shalev-Shwartz et al., 2017). To address the drawbacks, Shalev-Shwartz et al. (2017) have described several metrics or indicators to ascertain the safety of an ADS. They are 1) safe longitudinal distance, 2) safe lateral distance, 3) longitudinal danger threshold, and 4) lateral danger threshold. Safe longitudinal distance is the longitudinal separation necessary between an EV and an obstacle to stop the EV without collisions. Safe longitudinal distance is described for the case of 1) EV following another vehicle (traveling in the same direction) and 2) when EV and obstacle are moving toward each other (traveling in opposite directions). Safe lateral distance is the lateral separation necessary to ascertain no lateral collision. When the prevailing separation between the EV and an obstacle is smaller than the safe distance, the situation is considered dangerous. The time instant at which lateral safety is compromised is called lateral danger threshold (similar is the case for longitudinal danger threshold). Using these metrics, proper responses in lateral and longitudinal directions are described in terms of permissible lateral and longitudinal accelerations to ensure safety. Proper responses for routes of different geometry and operational domains are also explained. The three distance measures used are (Shalev-Shwartz et al., 2017; Volk et al., 2020):
where
Superscripts
Proper responses for different scenarios are described. However, there are some limitations as the scenario description cannot be exhaustive. Koopman et al. (2019) have identified edge cases or scenarios that cannot be addressed by the RSS approach presented by Shalev-Shwartz et al. (2017). For example, as per
Another study has formulated a “safety score” by adapting the RSS approach (Zhao et al., 2020). They have modified the matric to reduce the computation time. Such improvements are necessary for real-time applications.
3.1.6 Model Predictive Instantaneous Safety Metric (MPrISM)
Weng et al. (2020) developed a comprehensive safety metric to quantify the safety of EV based on the work of Every et al. (2017). Multiple independent obstacles are considered to interact with the EV. The instantaneous safety metric (MPrISM) evaluates the ability of an EV to evade an impending or potential collision. The metric may be considered a generalized TTC indicator. The TTC between EV and the surrounding obstacles is computed when the EV performs an evasive maneuver and obstacles try to collide with EV (Kamikaze approach). The motion of EV and the surrounding vehicles is considered continuous and governed by ordinary differential equations. The analytical solution is available, which makes it appealing to employ in real-time applications. Vehicle kinematic and pedestrian kinematics are provided in detail. The performance of ADS under several traffic scenarios such as the presence of static obstacles, dynamic obstacles, weaving, and lane change operations is evaluated. NHTSA recommends research and development of metrics similar to MPrISM to assess the safety of ADS (NHTSA, 2020).
3.1.7 Other Metrics Used by ADS Developers
The concept of artificial potential fields is popularly used for collision avoidance and motion planning (Latombe, 1991; Xiong et al., 2016; Sharath et al., 2020). This approach is further improved by Nistér et al. (2019) to develop the “Safety Force Field.” Actions of the dynamic obstacles and the EV are expected to follow specific driving policies to ensure safety. If not, the EV could experience a safety risk. Hence, corrective measures are to be dynamically taken to ascertain continuous safety. The prediction of future states/actions of the dynamic obstacles and of the EV has certain benefits. Foreseeing safety risk is the obvious one. Another major advantage is the possibility of learning the driving policies from the field experiments. A metric comparing observed states and predicted states may be formulated for such a purpose.
A consortium of eleven ADS developers/manufacturers have compiled a document providing a framework for developing safe ADS (Wood et al., 2019). Twelve principles governing the safety of ADS are presented in the report. The concepts of safety by design, verification, and validation are the foundation of the proposed framework for ADS development. The required properties of ADS are categorized as fail-safe capabilities and fail-degraded capabilities. Fail-safe and fail-degraded operations are generically described. It is argued that fail-degraded capabilities should assume higher priority over fail-safe capabilities while designing ADS. Fraade-blanar et al. (2018) have developed a generic framework to quantify the safety of ADS. The report provides desirable qualities of safety indicators/metrics. Suitable safety indicators at the development, demonstration, and deployment stages are mentioned. However, the formulation of performance metrics used by different ADS developers is not provided in either of the reports.
Concept of “Threat” in the Performance Metrics
Obstacles can pose different magnitudes of threats to the EV based on their state (e.g., position, velocity, acceleration, and vehicle type). Perception errors associated with low-threat obstacles (e.g., an obstacle that is far away) may not be as critical as that for high-threat obstacles (Volk et al., 2020). Therefore, performance metrics for a perception system needs first to quantify the potential threat. Missed detection or wrong classification of low-threat obstacles may be acceptable. On the other hand, erroneous perception/classification of obstacles results in erroneous predictions of future states of the obstacles. The repercussion would be erroneous motion planning that can be fatal in safety-of-life critical applications (Volk et al., 2020). Therefore, there is a need to incorporate the “threat level” of obstacles in defining the performance of a perception system.
The metrics mentioned above do not incorporate the level of threat an obstacle poses to the EV. Those metrics are formulated to assess the quality of detection and association. However, erroneous perception of objects (obstacles) that pose a very low threat to EV safety may be permissible. On the contrary, instances of an inaccurate perception of objects that pose a very high risk to EV safety shall be minimized/eliminated. Such a process requires a comprehensive and objective description of the “threat” posed by the obstacle.
Volk et al. (2020) introduced the concept of “Collision Relevance” to indicate the level of threat an obstacle poses. Longitudinal and lateral separation between EV and the obstacle and braking time under prevailing weather conditions are used to compute Responsibility-Sensitive Safety (RSS) distance (Shalev-Shwartz et al., 2017). RSS distance objectively quantifies the relevance or level of threat of an obstacle. The braking distance is computed considering prevailing road weather conditions (coefficient of friction and maximum deceleration), making it weather sensitive. The distance measures are the same as that in Shalev-Shwartz et al. (2017)(see Equations 18-20).
Quantification of the level of threat of an obstacle is a leap forward in improving the safety of ADS. Algorithms may be enhanced to detect and track high risk posing obstacles with greater accuracy. Furthermore, it may also be possible to assess the safety of the EV at any given instant. The same approach may be employed for analyzing data from other perception sensors such as LiDARs (Lang et al., 2019; Volk et al., 2020).
4 Human-likeness and ADS
ADS and human-driven vehicles will coexist for several decades, forming a mixed traffic environment (Litman, 2020). ADS would receive public acceptance only if they exhibit driving behavior similar to that of humans (Guo et al., 2018; Sharath et al., 2020). This is necessary to gain the trust of EV occupants and other road users. Cooperation and coordination between the vehicles in the mixed traffic are crucial to prevent deterioration of the safety and traffic flow parameters (Li et al., 2018).
Humans’ driving behavior may be characterized by distributions of microscopic traffic parameters such as headways, relative velocities, and accelerations (Zhu et al., 2018). ADS should be developed to mimic human-like driving behavior, resulting in human-like distributions of microscopic traffic parameters. The performance metrics/indicators mentioned earlier do not address this need. Hence, they do not evaluate human-like driving behavior.
Volk et al. (2020) use the concept of collision relevance. The safety score developed by Shalev-Shwartz et al. (2017) incorporates proximity, braking time, and prevailing weather conditions. These are implicit attempts to comprehensively model human driving behavior and can be considered positive steps forward in developing human-like ADS. However, several factors can elicit a reaction in human drivers (Sharath et al., 2020; Sharath and Velaga, 2020). These stimulus parameters include 1) velocity of EV, 2) velocity of surrounding obstacles, 3) proximity of an obstacle to the EV, 4)
Such parameters may not independently influence driving behavior. It is not easy to model human-like driving behavior incorporating the interaction between multiple stimulus parameters. However, such interactions can be learned from observation. Human-driven trajectories (NGSIM, 2007; Krajewski et al., 2018) can be used for such a purpose. Multivariate cumulative distribution function(s) (CDF) can be constructed from those trajectories. Please refer to Sharath et al. (2020) for a detailed description and justification on using multivariate CDF to model human response.
Figure 6 presents a five-dimensional CDF constructed using human-driven trajectories obtained from NGSIM (2007). The five dimensions are 1)
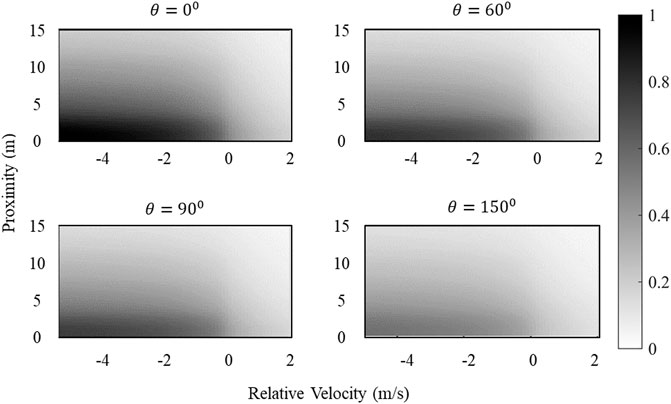
FIGURE 6. An example of multivariate CDF (EV is Car; Obstacle is Bike).
However, developing a nonlinear formulation to model human drivers’ responses (with interacting parameters) is not a trivial task. Multivariate CDF could be a way forward in such cases. Note that not all the stimulus parameters mentioned above are used in the example resented in Figure 6 as the visual representation becomes difficult. In reality, there is no limit to the number of stimulus parameters used to construct multivariate CDF. But, as the number of stimulus parameters used increases, the sample size (human-driven trajectories) needed would exponentially increase, which is a limitation of this approach.
The following subsections present a direction to use this multivariate CDF approach to improve human-like perception and motion planning modules of an ADS.
Human-like Perception
Human-like threat perception is essential to model human-like driving behavior. Human drivers may perceive threats from surrounding obstacles based on several stimulus parameters mentioned earlier. The objective is to detect and track the obstacles that pose a high risk with greater accuracy. It may be acceptable to erroneously detect/track the obstacles that pose low or no risk to the safety of EV (might reduce computational requirements). Except for Volk et al. (2020), none of the existing performance metrics considers human-like threat perception. However, the threat quantification metric used by Volk et al. (2020) does not comprehensively consider all these stimulus parameters. Hence, there is room to incorporate all the stimulus parameters in quantifying the performance (human-likeness) of the perception module of ADS.
The multivariate CDF approach seems to be feasible to quantify threat levels of different obstacles by learning from human-driven trajectories. Such an approach also has the inherent ability to accommodate the interaction between multiple parameters. A nonlinear relationship between the perceived level of threat and the stimulus parameters can be constructed from the observed human-driven trajectories. Every detected obstacle can then be assigned a (human perceived) human-like threat level (which is a continuous value between 0 (very low-level threat) and 1 (very high-level threat)). This objective threat level can be used as a weighting factor in traditional or CLEAR metrics to quantify detection and tracking quality appropriately. Thus, false positives and false negatives of the low-threat obstacles are imposed a lesser penalty as compared to that of high-threat obstacles.
Multivariate CDFs are constructed from the observed data. This implies, temporal and spatial variations in driving behaviors and subsequent perception of threat can be dynamically adapted by human intervention. Threat levels can also be quantified at different operational environments and weather conditions. The perception model (and consequent driving behavior model) can be customized for a human driver.
Human-like Driving Behavior
A trajectory is the time series of states/actions. As mentioned earlier, human driving behavior is characterized by several microscopic traffic parameters. Some metrics/indicators are available to quantify the human-likeness of a generated trajectory. Human-driven trajectories are necessary for comparison. The initial position of one of the human-driven trajectories (
where
Multiple metrics may be necessary for targeted improvement of specific parts of the ADS. The longitudinal error may be obtained as (Ossen and Hoogendoorn, 2011; Zhang et al., 2019):
The lateral error may be computed as (Kesting and Treiber, 2008; Zhang et al., 2019):
Model error, which is a combination of lateral error and longitudinal error, can be determined as (Zhang et al., 2019):
where
5 Advantages and Disadvantages of Performance Metrics
The metrics used for performance evaluation of environment perception and motion planning are provided in this section. Objectivity of a performance metric is a desirable quality. A metric is said to be objective when it does not contain any subjective term. Performance would be quantified based on measurements/computations that are not subjective. Table 2 summarizes the advantages and disadvantages of metrics used to quantify the performance of environment perception. Table 3 provides the summary of metrics used for the evaluation of motion planning algorithms.
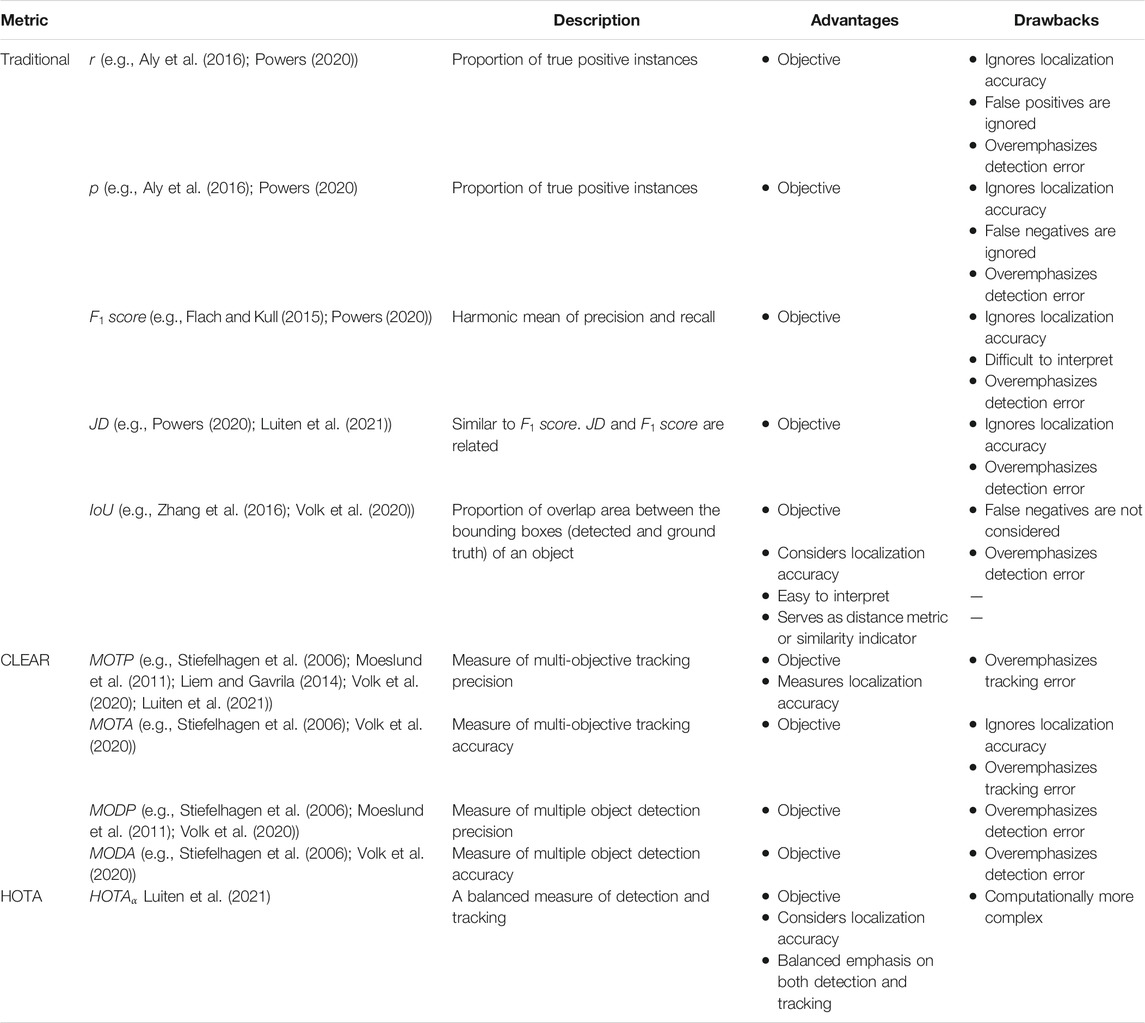
TABLE 2. Metrics for environment perception.
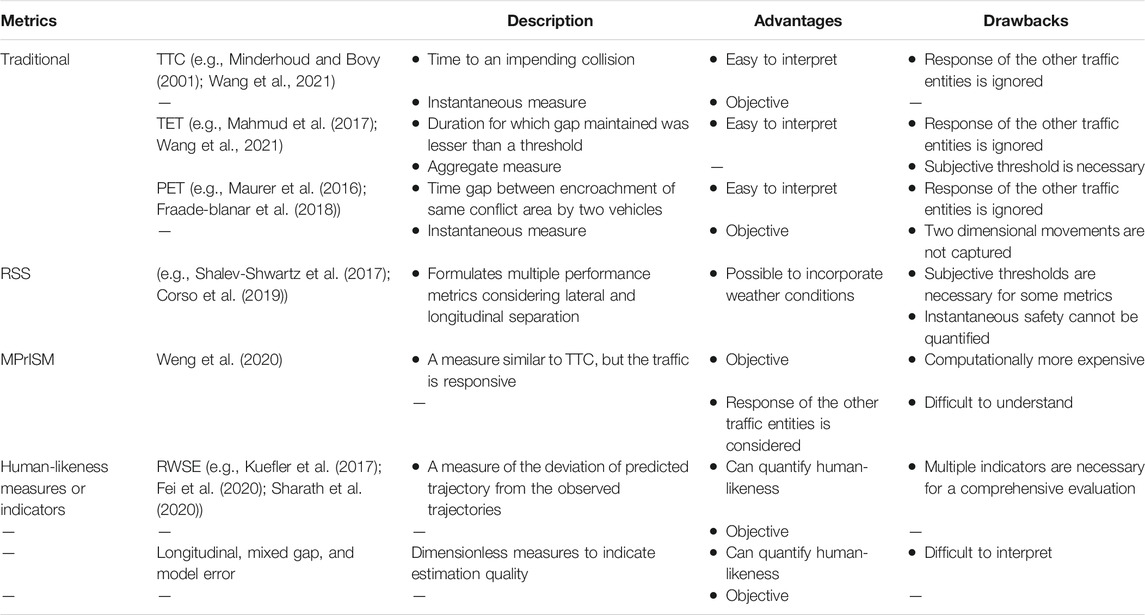
TABLE 3. Metrics for motion planning.
6 Framework for Safety Regulation of ADS
In June 2021, NHTSA has issued a standing general order mandating ADS developers/operators to report incidents (crashes) (NHTSA, 2021). The order seeks the following information pertaining to an incident, 1) EV information (e.g., model, make, and mileage), 2) incident information (date, time), 3) incident scene (location, pavement characteristics, speed limit, lighting, and weather conditions), 4) crash description (e.g., injury severity, precrash speed, etc.), and 5) postcrash information. However, the scenario leading to the crash is not being asked. Precrash information or the states of traffic participants that resulted in crashes/collisions/incidents are vital to identify the flaws in the existing system.
Reasons for Crashes/Incidents/Disengagements
A crash is a result of the failure of one or more of the basic four modules of an ADS. This paper’s scope is limited to the examination of the perception and motion planning module (as the likelihood of failure of other modules is much smaller). Failure of the perception module (erroneous scene abstraction) can result in improper motion planning. However, the erroneous motion of an EV may not always result in collisions as the other human-driven entities respond (react) to the actions of the EV. But crashes can happen due to a combination of imperfect environment perception and motion planning, as shown in Table 4. Also, erroneous environment perception or motion planning for a short duration may not result in a crash. The reaction of other traffic entities may prevent incidents. Furthermore, the future states of the EV (and of the surrounding traffic entities) are sensitive to the current (initial and previous) state. This butterfly effect may either dampen or magnify the safety risk posed by improper environment perception and motion planning. It is a complex phenomenon to analyze, and significant efforts must be made in this aspect to improve ADS.

TABLE 4. Plausible cases resulting in a crash.
If a crash or disengagement occurs, 1) it could be solely attributed to improper motion planning, 2) it could be solely attributed to erroneous environment perception, or 3) it could be the result of imperfect environment perception and imperfect motion planning.
Framework for Collecting Precrash Scenarios
Incident reporting is mandatory for ADS developers/operators (NHTSA, 2021). However, precrash information is not being collected by NHTSA. The sequence of precrash events/states may hold valuable lessons in improving ADS. It is necessary to identify the specific cases resulting in crashes as it helps in the targeted development of ADS. The first step in this direction is to understand the “scenarios” culminating in an incident. “Scenarios” are a sequence of states (e.g., position, velocity, and acceleration) of the EV and that of the surrounding traffic participants. Future states of the EV (and that of the other traffic entities) are sensitive to initial states. State evolution is a complex phenomenon and complicated to model. More specifically, the scenarios that culminate in crashes are infrequent but critical.
Human-driving behavior under safe (“normal”) driving conditions is extensively studied and modeled. Comprehensive simulation models are available to model the driving behavior under normal conditions. Such models can be calibrated and validated with experimental/empirical data. However, modeling human-driving behavior under “precarious” driving conditions presents three significant challenges: 1) any attempt to model such precarious driving conditions (and subsequent driving behavior) cannot be justified by empirical validation, 2) precarious driving conditions are scarce and present a problem of “class-imbalance” (Jeong et al., 2018; Elamrani Abou Elassad et al., 2020), and 3) behavior of multiple agents under precarious (extreme) scenario is challenging to hypothesize, let alone model it.
Class-imbalance exists when instances of one (or a few) class severely outnumber that of the other classes (Vluymans, 2019). In the present context, the two classes can be 1) normal scenario and 2) precarious scenario, where the former out represents the latter. If the under-represented scenario is of major concern (like in the present study), metrics shall be able to appropriately quantify the performance. Approaches to mitigate the issue of imbalance (e.g., synthetic minority oversampling technique, adaptive synthetic sampling) require the generation of precarious scenarios (Vluymans, 2019; Elamrani Abou Elassad et al., 2020; Fujiwara et al., 2020). Simply put, simulation environments may not mimic precrash scenarios due to complexities in comprehending and modeling multi-variate multi-agent interactions. Hence, synthesizing underrepresented scenarios is extremely difficult.
Recognizing (and predicting) the transition from normal to precarious driving scenarios is extremely important in ensuring the safety of ADS. The vital task of comprehending (and subsequent modeling/synthesizing) precarious scenarios can be initiated from empirical observation. Hence, precrash scenarios are extremely important to be collected and analyzed. Precrash scenario simulation can be enhanced using such a dataset, and ADS advancement would be a repercussion.
Figure 7 furnishes a framework for the safety regulatory authority to collect precrash scenario, along with the possible usage of the collected database.
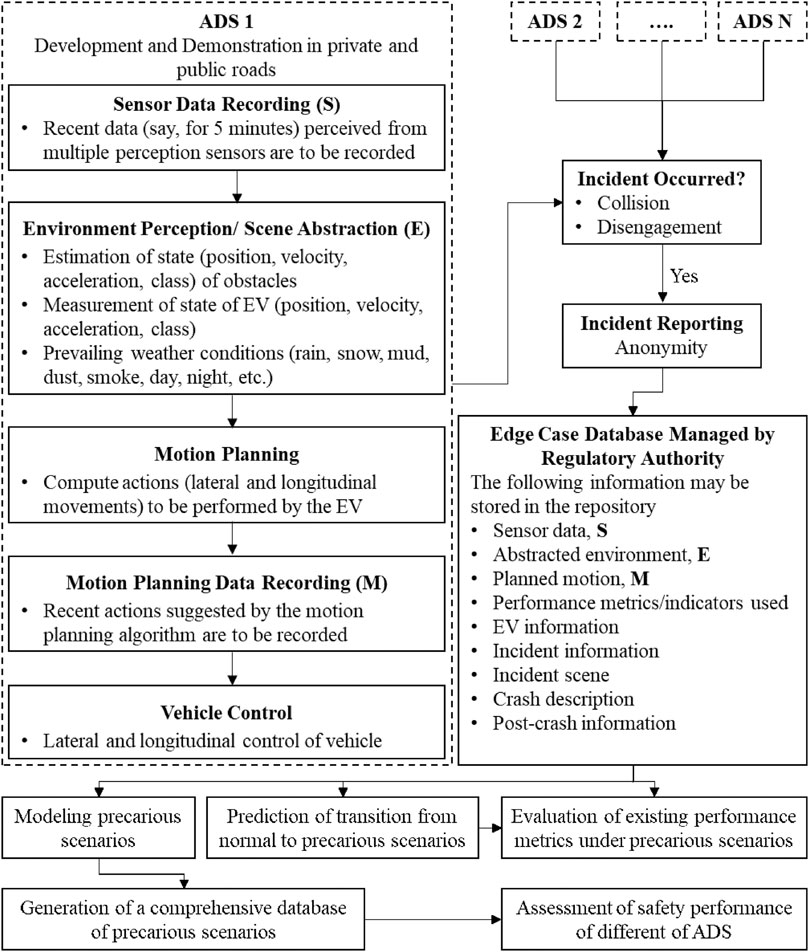
FIGURE 7. Framework for collecting precrash sequences and its analysis.
ADS developers may be mandated to record the following data:
Sensor Data (
Perceived Environment (
Planned Motion of EV (
Metrics used for performance evaluation of the environment perception module and the motion planning module vary between the ADS developers/operators. Appropriateness of performance metrics in the precrash scenario is a research question to be assessed. Reporting of precrash scenarios can help assess the quality/appropriateness of different performance metrics. Furthermore, scenario-specific (dynamic) performance metrics may be conceptualized.
ADS developers may be asked to anonymize and submit
The responsibilities of regulatory authorities could include:
1) Collection and storing of precrash sequences: The pressing need for precrash sequences (S, E, M) is described above. Regulatory authorities should aim at collecting and storing the same.
2) Modeling the precarious scenarios: Hypothesizing the driving behavior of the EVs and that of the involving traffic entities in precarious scenarios based on empirical observation is an important task. Modeling involves both calibration and validation using empirical sequences. Classical driving behavior models (e.g., Treiber and Kesting, 2013; Kala, 2016) may not comprehensively address both the normal and the precarious sequences. Two separate models may be necessary (or different calibration parameters) to address the two distinct sequences. Alternatively, machine learning approaches that are gaining prominence may be employed to learn the precarious scenario, which is a time series of states (e.g., Kuderer et al., 2015; Gu et al., 2016; Paden et al., 2016; Rehder et al., 2017; Mohanan and Salgoankar, 2018; Schwarting et al., 2018; Wang et al., 2018; Zyner et al., 2018; Zhang et al., 2019). Performance metrics suitable for the imbalanced problem are to be used for the development of such models.
3) Prediction of transition from normal to precarious scenario: Once the capability to model the precarious situation is achieved, methods to determine the state transition from normal to precarious scenario (and eventually forecast) are to be developed. Such forecasting could be used to prevent an incident. One possible way to achieve this goal is by developing metrics/indicators considering the time series of states (of EV and that of the surrounding entities). Such metrics would account for both spatial and temporal variation in the states.
4) Evaluation of existing performance metrics under precarious scenarios: The quality of existing performance metrics is to be assessed on the dataset of precarious sequences. This is to ascertain that the performance metrics/indicators would not suffer from the problem of class-imbalance.
5) Generation of a comprehensive database of precarious scenarios: Precarious scenarios are very rare, and the reported scenarios would not be comprehensive. As such, it is necessary to synthesize and build up a database of precarious scenarios. Such a synthesized database is a precious source of information toward targeted learning. Hence, the same may be shared with the ADS developers/operators to accelerate the development of ADS.
6) Assessment of safety performance of different ADS: The database of synthetic precarious trajectories could be used to assess ADS of different developers/operators.
Suitable performance metric(s) can then be used to assess the mapping between
States of the obstacles can be replayed from the synthetic dataset, and the EV can be made to navigate in precarious scenarios. The database (and the metrics) can also be used to evaluate the individual improvement of either the perception module or motion planning module.
Such an approach helps targeted learning. The configuration of sensors and the type of algorithms (perception and motion planning) ideal for enhancing ADS safety can be determined. Such a collaboration of ADS developers can accelerate the development of ADS. This database of critical scenarios can be used to identify performance metrics that give a false sense of superior performance (a crucial aspect of a performance metric). The quality of different performance metrics under different critical scenarios can be analyzed, with the potential to recognize scenario-specific performance metrics. Last, the repository would also contain human-driving behaviors (trajectories) leading to incidents. This information may be used to quantify the driving performance of drivers and further predict (and intervene) the onset of a precarious situation.
7 Summary and Conclusion
Automated Driving Systems (ADS) will soon become prevalent and start sharing the road infrastructure with the human drivers (leading to a mixed traffic environment). Safety regulatory authorities are therefore trying to formulate suitable performance metrics to quantify the safety of ADS. At this juncture, it is highly appropriate to review the literature on metrics used to quantify the performance of ADS.
The present article limits its scope to review the metrics related to environment perception and motion planning modules of ADS. It is recognized that the existing metrics on environment perception are formulated to quantify the detection and tracking performance. Usage of such metrics might result in a driving behavior dissimilar to that of human drivers. Such scenarios are unacceptable in a mixed environment. Human-like environment perception and motion planning are therefore essential.
To address this issue, a method to quantify the threat an obstacle poses to the safety of ADS is presented. This novel approach is capable of modeling threats as perceived by human drivers. Human-perceived threats are due to several stimulus parameters such as 1) velocity of subject vehicle, 2) velocity of surrounding obstacles, 3) proximity of an obstacle to the EV, 4)
Imperfect perception of obstacles posing low-level threats may not be a severe issue. On the other hand, it can be fatal to erroneously perceive obstacles that pose a greater risk. The human-like threat perception model suggested in the article can be used to identify threat levels and, consequently, develop a human-like environment perception algorithm. The metrics necessary to quantify the human-likeness of the motion planning algorithm are also presented.
Additionally, a framework is provided to suggest desirable changes to the incident reporting scheme. Currently, ADS operators/developers are mandated to report postcrash information. As thoroughly described, there is an immense potential for utilization of precrash scenarios. It is, hence, desirable to collect the same along with postcrash information. The framework focuses on collecting and managing the information regarding the scenarios that result in incidents. The states of subject vehicles and the obstacles for a small duration before the incident are necessary. Such a database of edge cases, collected from all the ADS developers, can be used to quantify and monitor the performance of environment perception and motion planning modules. The framework also outlines the different ways in which the repository of precrash scenarios could be used. The repository would help in accelerating the development of ADS.
Future research can focus on the development of human-like perception algorithms and human-like motion planning algorithms. A human-like threat level quantification method provided in this article may be employed for such a purpose. Furthermore, it is required to identify traits of the metrics that give a false sense of superior performance. Extensive research is necessary to appropriately model and evaluate the precrash scenarios. Such a study would allow for prediction (and mitigation) of crashes. Safety regulating authorities could objectively and comprehensively assess ADS based on such models.
Redundancy is necessary to prevent catastrophe in the event of an individual sensor (or system) failure and integrity monitoring. Future research can also focus on the conception of performance metrics where system redundancy and integrity are quantified.
Author Contributions
MNS and BM: Study conception and design. MNS and BM: Draft manuscript preparation. BM: supervision. All authors reviewed and approved the final version of the manuscript.
Conflict of Interest
The authors declare that the research was conducted in the absence of any commercial or financial relationships that could be construed as a potential conflict of interest.
Publisher’s Note
All claims expressed in this article are solely those of the authors and do not necessarily represent those of their affiliated organizations, or those of the publisher, the editors and the reviewers. Any product that may be evaluated in this article, or claim that may be made by its manufacturer, is not guaranteed or endorsed by the publisher.
References
Alkhorshid, Y., Aryafar, K., Wanielik, G., and Shokoufandeh, A. (2015). Camera-Based Lane Marking Detection for ADAS and Autonomous Driving. Image Analysis and Recognition. Cham: Springer International Publishing. 514–519. doi:10.1007/978-3-319-20801-5_57
Al-khoury, F. (2017). Safety of Machine Learning Systems in Autonomous Driving. KTH ROYAL INSTITUTE OF TECHNOLOGY.
Alland, S., Stark, W., Ali, M., and Hegde, M. (2019). Interference in Automotive Radar Systems: Characteristics, Mitigation Techniques, and Current and Future Research. IEEE Signal. Process. Mag. 36, 45–59. doi:10.1109/MSP.2019.2908214
Aly, H., Basalamah, A., and Youssef, M. (2016). Robust and Ubiquitous Smartphone-Based Lane Detection. Pervasive Mobile Comput. 26, 35–56. doi:10.1016/j.pmcj.2015.10.019
Bansal, A., Singh, J., Verucchi, M., Caccamo, M., and Sha, L. (2021). “Risk Ranked Recall: Collision Safety Metric for Object Detection Systems in Autonomous Vehicles,” in 2021 10th Mediterranean Conference on Embedded Computing (MECO) (Budva, Montenegro: IEEE), 1–4. doi:10.1109/MECO52532.2021.9460196
Berk, M., Schubert, O., Kroll, H.-M., Buschardt, B., and Straub, D. (2020). Assessing the Safety of Environment Perception in Automated Driving Vehicles. SAE Int. J. Trans. Saf. 8, 49–74. doi:10.4271/09-08-01-0004
Berntorp, K., Hoang, T., and Di Cairano, S. (2019). Motion Planning of Autonomous Road Vehicles by Particle Filtering. IEEE Trans. Intell. Veh. 4, 197–210. doi:10.1109/TIV.2019.2904394
Campbell, S., O'Mahony, N., Krpalcova, L., Riordan, D., Walsh, J., Murphy, A., and Ryan, C. (2018). “Sensor Technology in Autonomous Vehicles : A Review,” in 2018 29th Irish Signals and Systems Conference (ISSC) (Belfast: IEEE), 1–4. doi:10.1109/ISSC.2018.8585340
Cao, G., Damerow, F., Flade, B., Helmling, M., and Eggert, J. (2016). “Camera to Map Alignment for Accurate Low-Cost Lane-Level Scene Interpretation,” in 2016 IEEE 19th International Conference on Intelligent Transportation Systems (ITSC) (Rio de Janeiro, Brazil: IEEE), 498–504. doi:10.1109/ITSC.2016.7795601
Collet, C., and Musicant, O. (2019). Associating Vehicles Automation with Drivers Functional State Assessment Systems: A Challenge for Road Safety in the Future. Front. Hum. Neurosci. 13, 131. doi:10.3389/fnhum.2019.00131
Corso, A., Du, P., Driggs-Campbell, K., and Kochenderfer, M. J. (2019). “Adaptive Stress Testing with Reward Augmentation for Autonomous Vehicle Validatio,” in 2019 IEEE Intelligent Transportation Systems Conference (ITSC) (Auckland, New Zealand: IEEE), 163–168. doi:10.1109/ITSC.2019.8917242
Dai, X., Yuan, X., and Wei, X. (2021). TIRNet: Object Detection in thermal Infrared Images for Autonomous Driving. Appl. Intell. 51, 1244–1261. doi:10.1007/s10489-020-01882-2
Elamrani Abou Elassad, Z., Mousannif, H., and Al Moatassime, H. (2020). Class-imbalanced Crash Prediction Based on Real-Time Traffic and Weather Data: A Driving Simulator Study. Traffic Inj. Prev. 21, 201–208. doi:10.1080/15389588.2020.1723794
Elli, M. S., Wishart, J., Como, S., Dhakshinamoorthy, S., and Weast, J. (2021). Evaluation of Operational Safety Assessment (OSA) Metrics for Automated Vehicles in Simulation. SAE Technical Paper Series. doi:10.4271/2021-01-0868
Every, J. L., Barickman, F., Martin, J., Rao, S., Schnelle, S., and Weng, B. (2017). “A Novel Method to Evaluate the Safety of Highly Automated Vehicles,” in 25th International Technical Conference on the Enhanced Safety of Vehicles (ESV), 1–12.
Fayyad, J., Jaradat, M. A., Gruyer, D., and Najjaran, H. (2020). Deep Learning Sensor Fusion for Autonomous Vehicle Perception and Localization: A Review. Sensors 20, 4220. doi:10.3390/s20154220
Fei, C., He, X., and Ji, X. (2020). Multi‐modal Vehicle Trajectory Prediction Based on Mutual Information. IET Intell. Transp. Syst. 14, 148–153. doi:10.1049/iet-its.2019.0299
Flach, P. A., and Kull, M. (2015). “Precision-Recall-Gain Curves: PR Analysis Done Right,” in Proceedings of the 28th International Conference on Neural Information Processing Systems, Cambridge, MA, USA (MIT Press), 838–846. NIPS’15.
Forkenbrock, G. J., and Snyder, A. S. (2015). NHTSA’s 2014 Automatic Emergency Braking Test Track Evaluations. Report No. DOT HS 812 166. National Highway Traffic Safety Administration.
Fraade-blanar, L., Blumenthal, M. S., Anderson, J. M., and Kalra, N. (2018). Measuring Automated Vehicle Safety: Forging a Framework. California: Santa Monica.
Fujiwara, K., Huang, Y., Hori, K., Nishioji, K., Kobayashi, M., Kamaguchi, M., et al. (2020). Over- and Under-sampling Approach for Extremely Imbalanced and Small Minority Data Problem in Health Record Analysis. Front. Public Health 8, 1–15. doi:10.3389/fpubh.2020.00178
Gao, H., Cheng, B., Wang, J., Li, K., Zhao, J., and Li, D. (2018). Object Classification Using CNN-Based Fusion of Vision and LIDAR in Autonomous Vehicle Environment. IEEE Trans. Ind. Inf. 14, 4224–4231. doi:10.1109/TII.2018.2822828
Girshick, R., Donahue, J., Darrell, T., and Malik, J. (2014). “Rich Feature Hierarchies for Accurate Object Detection and Semantic Segmentation,” in 2014 IEEE Conference on Computer Vision and Pattern Recognition, Columbus, Ohio (IEEE), 580–587. doi:10.1109/CVPR.2014.81
Goppelt, M., Blöcher, H.-L., and Menzel, W. (2010). Automotive Radar - Investigation of Mutual Interference Mechanisms. Adv. Radio Sci. 8, 55–60. doi:10.5194/ars-8-55-2010
Gu, T., Dolan, J. M., and Lee, J.-W. (2016). “Human-like Planning of Swerve Maneuvers for Autonomous Vehicles,” in 2016 IEEE Intelligent Vehicles Symposium (IV) (Gothenburg, Sweden: IEEE), 716–721. doi:10.1109/IVS.2016.7535466
Guo, C., Kidono, K., Terashima, R., and Kojima, Y. (2018). “Toward Human-like Behavior Generation in Urban Environment Based on Markov Decision Process with Hybrid Potential Maps,” in 2018 IEEE Intelligent Vehicles Symposium (IV), Suzhou, China (IEEE), 2209–2215. doi:10.1109/IVS.2018.8500439
Hasch, J., Topak, E., Schnabel, R., Zwick, T., Weigel, R., and Waldschmidt, C. (2012). Millimeter-Wave Technology for Automotive Radar Sensors in the 77 GHz Frequency Band. IEEE Trans. Microwave Theor. Techn. 60, 845–860. doi:10.1109/TMTT.2011.2178427
Hou, J., List, G. F., and Guo, X. (20142014). New Algorithms for Computing the Time-To-Collision in Freeway Traffic Simulation Models. Comput. Intelligence Neurosci. 2014, 1–8. doi:10.1155/2014/761047
Huang, J. C., and Kurniawati, H. (2021). An NCAP-like Safety Indicator for Self-Driving Cars 1–14. http://arxiv.org/abs/2104.00859.
H. Winner, S. Hakuli, F. Lotz, and C. Singer (Editors) (2014). Handbook of Driver Assistance Systems (Cham: Springer International Publishing). doi:10.1007/978-3-319-09840-1
Janai, J., Güney, F., Behl, A., and Geiger, A. (2020). Computer Vision for Autonomous Vehicles: Problems, Datasets and State of the Art. FNT Comput. Graphics Vis. 12, 1–308. doi:10.1561/0600000079
Jeong, H., Jang, Y., Bowman, P. J., and Masoud, N. (2018). Classification of Motor Vehicle Crash Injury Severity: A Hybrid Approach for Imbalanced Data. Accid. Anal. Prev. 120, 250–261. doi:10.1016/j.aap.2018.08.025
John, V., and Mita, S. (2021). Deep Feature-Level Sensor Fusion Using Skip Connections for Real-Time Object Detection in Autonomous Driving. Electronics 10, 424. doi:10.3390/electronics10040424
Johnsson, C., Laureshyn, A., and De Ceunynck, T. (2018). In Search of Surrogate Safety Indicators for Vulnerable Road Users: a Review of Surrogate Safety Indicators. Transport Rev. 38, 765–785. doi:10.1080/01441647.2018.1442888
Kala, R. (2016). “Potential-Based Planning,” in On-Road Intelligent Vehicles: Motion Planning for Intelligent Transportation Systems (Elsevier), 318–356. doi:10.1016/B978-0-12-803729-4.00011-8
Katrakazas, C., Quddus, M., Chen, W.-H., and Deka, L. (2015). Real-time Motion Planning Methods for Autonomous On-Road Driving: State-Of-The-Art and Future Research Directions. Transp. Res. C: Emerging Tech. 60, 416–442. doi:10.1016/j.trc.2015.09.011
Katrakazas, C. (2017). Developing an Advanced Collision Risk Model for Autonomous Vehicles. Loughborough: Loughborough University.
Kesting, A., and Treiber, M. (2008). Calibrating Car-Following Models by Using Trajectory Data. Transportation Res. Rec. 2088, 148–156. doi:10.3141/2088-16
Kim, D., Kim, B., Chung, T., and Yi, K. (2017). Lane-Level Localization Using an AVM Camera for an Automated Driving Vehicle in Urban Environments. Ieee/asme Trans. Mechatron. 22, 280–290. doi:10.1109/TMECH.2016.2533635
Koopman, P., Osyk, B., and Weast, J. (2019). “Autonomous Vehicles Meet the Physical World: RSS, Variability, Uncertainty, and Proving Safety,” in Lecture Notes in Computer Science (Including Subseries Lecture Notes in Artificial Intelligence and Lecture Notes in Bioinformatics). Cham: Springer, 245–253. doi:10.1007/978-3-030-26601-1_17
Korthals, T., Kragh, M., Christiansen, P., Karstoft, H., Jørgensen, R. N., and Rückert, U. (2018). Multi-Modal Detection and Mapping of Static and Dynamic Obstacles in Agriculture for Process Evaluation. Front. Robot. AI 5, 28. doi:10.3389/frobt.2018.00028
Krajewski, R., Bock, J., Kloeker, L., and Eckstein, L. (2018). “The highD Dataset: A Drone Dataset of Naturalistic Vehicle Trajectories on German Highways for Validation of Highly Automated Driving Systems,” in 2018 21st International Conference on Intelligent Transportation Systems (ITSC) (Maui, HI: IEEE), 2118–2125. doi:10.1109/ITSC.2018.8569552
Kuderer, M., Gulati, S., and Burgard, W. (2015). “Learning Driving Styles for Autonomous Vehicles from Demonstration,” in 2015 IEEE International Conference on Robotics and Automation (ICRA) (Seattle, WA: IEEE), 2641–2646. doi:10.1109/ICRA.2015.7139555
Kuefler, A., Morton, J., Wheeler, T., and Kochenderfer, M. (2017). “Imitating Driver Behavior with Generative Adversarial Networks,” in 2017 IEEE Intelligent Vehicles Symposium (IV), Redondo Beach, CA (IEEE), 204–211. doi:10.1109/IVS.2017.7995721
Lang, A. H., Vora, S., Caesar, H., Zhou, L., Yang, J., and Beijbom, O. (2019). “PointPillars: Fast Encoders for Object Detection from Point Clouds,” in 2019 IEEE/CVF Conference on Computer Vision and Pattern Recognition (CVPR) (Long Beach, CA: IEEE), 12689–12697. doi:10.1109/CVPR.2019.01298
Latombe, J.-C. (1991). “Potential Field Methods,” in Robot Motion Planning (Boston, MA: Springer US), 295–355. doi:10.1007/978-1-4615-4022-9_7
Li, H., Nashashibi, F., and Toulminet, G. (2010). “Localization for Intelligent Vehicle by Fusing Mono-Camera, Low-Cost GPS and Map Data,” in 13th International IEEE Conference on Intelligent Transportation Systems (Funchal, Portugal: IEEE), 1657–1662. doi:10.1109/ITSC.2010.5625240
Li, F., Bonnifait, P., Ibanez-Guzman, J., and Zinoune, C. (2017). “Lane-level Map-Matching with Integrity on High-Definition Maps,” in 2017 IEEE Intelligent Vehicles Symposium (IV) (IEEE), 1176–1181. doi:10.1109/IVS.2017.7995872
Li, L., Ota, K., and Dong, M. (2018). Humanlike Driving: Empirical Decision-Making System for Autonomous Vehicles. IEEE Trans. Veh. Technol. 67, 6814–6823. doi:10.1109/TVT.2018.2822762
Li, Y., Wu, D., Chen, Q., Lee, J., and Long, K. (2021). Exploring Transition Durations of Rear-End Collisions Based on Vehicle Trajectory Data: A Survival Modeling Approach. Accid. Anal. Prev. 159, 106271. doi:10.1016/j.aap.2021.106271
Liem, M. C., and Gavrila, D. M. (2014). Joint Multi-Person Detection and Tracking from Overlapping Cameras. Computer Vis. Image Understanding 128, 36–50. doi:10.1016/j.cviu.2014.06.003
Lin, J., and Zhang, F. (2020). “Loam Livox: A Fast, Robust, High-Precision LiDAR Odometry and Mapping Package for LiDARs of Small FoV,” in 2020 IEEE International Conference on Robotics and Automation (ICRA) (Paris, France: IEEE), 3126–3131. doi:10.1109/ICRA40945.2020.9197440
Litman, T. (2020). Autonomous Vehicle Implementation Predictions Implications. Victoria Transport Policy Institute.
Lu, C. X., Rosa, S., Zhao, P., Wang, B., Chen, C., Stankovic, J. A., Trigoni, N., and Markham, A. (2020). “See through Smoke,” in Proceedings of the 18th International Conference on Mobile Systems, Applications, and Services, New York, NY, USA (ACM), 14–27. doi:10.1145/3386901.3388945
Luiten, J., Os̆ep, A., Dendorfer, P., Torr, P., Geiger, A., Leal-Taixé, L., et al. (2021). HOTA: A Higher Order Metric for Evaluating Multi-Object Tracking. Int. J. Comput. Vis. 129, 548–578. doi:10.1007/s11263-020-01375-2
Mahmud, S. M. S., Ferreira, L., Hoque, M. S., and Tavassoli, A. (2017). Application of Proximal Surrogate Indicators for Safety Evaluation: A Review of Recent Developments and Research Needs. IATSS Res. 41, 153–163. doi:10.1016/j.iatssr.2017.02.001
Maurer, M., Gerdes, J. C., Lenz, B., and Winner, H. (2016). Autonomous Driving: Technical, Legal and Social Aspects. Berlin, Heidelberg: Springer. doi:10.1007/978-3-662-48847-8
Miethig, B., Liu, A., Habibi, S., and Mohrenschildt, M. v. (2019). “Leveraging Thermal Imaging for Autonomous Driving,” in 2019 IEEE Transportation Electrification Conference and Expo (ITEC) (Detroit, MI: IEEE), 1–5. doi:10.1109/ITEC.2019.8790493
Minderhoud, M. M., and Bovy, P. H. L. (2001). Extended Time-To-Collision Measures for Road Traffic Safety Assessment. Accid. Anal. Prev. 33, 89–97. doi:10.1016/S0001-4575(00)00019-1
Moeslund, T. B., Hilton, A., Kruger, V., and Sigal, L. (2011). Visual Analysis of Humans: Looking at People. London: Springer. doi:10.1007/978-0-85729-997-0
Mohamed, A., Ren, J., Gindy, M. E., Lang, H., and Ouda, A. N. (2018). Literature Survey for Autonomous Vehicles: Sensor Fusion, Computer Vision, System Identification and Fault Tolerance. Ijaac 12, 555. doi:10.1504/IJAAC.2018.095104
Mohanan, M. G., and Salgoankar, A. (2018). A Survey of Robotic Motion Planning in Dynamic Environments. Rob. Auton. Syst. 100, 171–185. doi:10.1016/j.robot.2017.10.011
Murad, M., Bilik, I., Friesen, M., Nickolaou, J., Salinger, J., Geary, K., and Colburn, J. S. (2013). “Requirements for Next Generation Automotive Radars,” in 2013 IEEE Radar Conference (RadarCon13) (Ottawa, ON: IEEE), 1–6. doi:10.1109/RADAR.2013.6586127
NHTSA (2020). Framework for Automated Driving System Safety. Washington, D.C., USA: National Highway Traffic Safety Administration (NHTSA), Department of Transportation (DOT).
NHTSA (2021). Incident Reporting for Automated Driving Systems (ADS) and Level 2 Advanced Driver Assistance Systems (ADAS). Washington, D.C: U.S. Department of Transportation, National Highway Traffic Safety Administration.
Ossen, S., and Hoogendoorn, S. P. (2011). Heterogeneity in Car-Following Behavior: Theory and Empirics. Transportation Res. Part C: Emerging Tech. 19, 182–195. doi:10.1016/j.trc.2010.05.006
Paden, B., Cap, M., Yong, S. Z., Yershov, D., and Frazzoli, E. (2016). A Survey of Motion Planning and Control Techniques for Self-Driving Urban Vehicles. IEEE Trans. Intell. Veh. 1, 33–55. doi:10.1109/TIV.2016.2578706
Patole, S. M., Torlak, M., Wang, D., and Ali, M. (2017). Automotive Radars: A Review of Signal Processing Techniques. IEEE Signal. Process. Mag. 34, 22–35. doi:10.1109/MSP.2016.2628914
Phillips, D. J., Wheeler, T. A., and Kochenderfer, M. J. (2017). “Generalizable Intention Prediction of Human Drivers at Intersections,” in 2017 IEEE Intelligent Vehicles Symposium (IV) (Los Angeles, CA: IEEE), 1665–1670. doi:10.1109/IVS.2017.7995948
Pollard, E., Gruyer, D., Tarel, J.-P., Ieng, S.-S., and Cord, A. (2011). “Lane Marking Extraction with Combination Strategy and Comparative Evaluation on Synthetic and Camera Images,” in 2011 14th International IEEE Conference on Intelligent Transportation Systems (ITSC) (Washington, DC: IEEE), 1741–1746. doi:10.1109/ITSC.2011.6083036
Powers, D. M. W. (2020). Evaluation: from Precision, Recall and F-Measure to ROC, Informedness, Markedness and Correlation. CoRR abs/2010.16061. 37–63. https://arxiv.org/abs/2010.16061.
Qu, X., Soheilian, B., and Paparoditis, N. (2015). “Vehicle Localization Using Mono-Camera and Geo-Referenced Traffic Signs,” in 2015 IEEE Intelligent Vehicles Symposium (IV) (IEEE), 605–610. doi:10.1109/IVS.2015.7225751
Quddus, M. A. (2006). High Integrity Map Matching Algorithms for Advanced Transport Telematics Applications. London: Imperial College London.
Quddus, M. A. (2013). “Map Matching Algorithms for Intelligent Transport Systems,” in Geographic Information Systems: Concepts, Methodologies, Tools, and Applications. Editors M. Khosrow-Pour, S. Clarke, M. E. Jennex, A. Becker, and A.-V. Anttiroiko (Hershey: Information Science Reference), 658–665. doi:10.4018/978-1-4666-2038-4.ch040
Razmpa, A. (2016). An Assessment of Post-Encroachment Times for Bicycle-Vehicle Interactions Observed in the Field, a Driving Simulator, and in Traffic Simulation Models. Portland: Portland State University.
Rehder, E., Quehl, J., and Stiller, C. (2017). “Driving like a Human: Imitation Learning for Path Planning Using Convolutional Neural Networks,” in International Conference on Robotics and Automation Workshops (Singapore: IEEE).
Riedmaier, S., Ponn, T., Ludwig, D., Schick, B., and Diermeyer, F. (2020). Survey on Scenario-Based Safety Assessment of Automated Vehicles. IEEE Access 8, 87456–87477. doi:10.1109/ACCESS.2020.2993730
SAE (2018). Surface Vehicle Recommended Practice: (R) Taxonomy and Definitions for Terms Related to Driving Automation Systems for On-Road Motor Vehicles. SAE International.
Schwarting, W., Alonso-Mora, J., and Rus, D. (2018). Planning and Decision-Making for Autonomous Vehicles. Annu. Rev. Control. Robot. Auton. Syst. 1, 187–210. doi:10.1146/annurev-control-060117-105157
Shalev-Shwartz, S., Shammah, S., and Shashua, A. (2017). On a Formal Model of Safe and Scalable Self-Driving Cars. CoRR abs/1708.0. http://arxiv.org/abs/1708.06374.
Sharath, M. N., and Velaga, N. R. (2020). Enhanced Intelligent Driver Model for Two-Dimensional Motion Planning in Mixed Traffic. Transp. Res. Part C: Emerging Tech. 120, 102780. doi:10.1016/j.trc.2020.102780
Sharath, M. N., Velaga, N. R., and Quddus, M. A. (2019). A Dynamic Two-Dimensional (D2D) Weight-Based Map-Matching Algorithm. Transp. Res. Part C: Emerging Tech. 98, 409–432. doi:10.1016/j.trc.2018.12.009
Shunsuke, K., Yanlei, G., and Hsu, L.-T. (2015). “GNSS/INS/On-board Camera Integration for Vehicle Self-Localization in Urban Canyon,” in 2015 IEEE 18th International Conference on Intelligent Transportation Systems (IEEE), 2533–2538. doi:10.1109/ITSC.2015.407
Sharath, M. N., Velaga, N. R., and Quddus, M. A. (2020). 2‐dimensional Human‐like Driver Model for Autonomous Vehicles in Mixed Traffic. IET Intell. Transp. Syst. 14, 1913–1922. doi:10.1049/iet-its.2020.0297
Sligar, A. P. (2020). Machine Learning-Based Radar Perception for Autonomous Vehicles Using Full Physics Simulation. IEEE Access 8, 51470–51476. doi:10.1109/ACCESS.2020.2977922
Steinhauser, D., Held, P., Thoresz, B., and Brandmeier, T. (2021). “Towards Safe Autonomous Driving: Challenges of Pedestrian Detection in Rain with Automotive Radar,” in EuRAD 2020 - 2020 17th European Radar Conference, Utrecht, Netherlands (IEEE), 409–412. doi:10.1109/EuRAD48048.2021.00110
Stiefelhagen, R., Bernardin, K., Bowers, R., Garofolo, J., Mostefa, D., and Soundararajan, P. (2006). “The CLEAR 2006 Evaluation,” in Multimodal Technologies for Perception of Humans (Berlin, Heidelberg: Springer Berlin Heidelberg), 1–44. doi:10.1007/978-3-540-69568-4_1
Sun, S., Petropulu, A. P., and Poor, H. V. (2020). MIMO Radar for Advanced Driver-Assistance Systems and Autonomous Driving: Advantages and Challenges. IEEE Signal. Process. Mag. 37, 98–117. doi:10.1109/MSP.2020.2978507
Treat, J. R., Tumbas, N. S., McDonald, S. T., Shinar, D., Hume, R. D., Mayer, R. E., et al. (1979). Tri-level Study of the Causes of Traffic Accidents: Final Report. Bloomington. Executive summary.
Treiber, M., and Kesting, A. (2013). “Car-Following Models Based on Driving Strategies,” in Traffic Flow Dynamics (Berlin, Heidelberg: Springer Berlin Heidelberg), 181–204. doi:10.1007/978-3-642-32460-4_11
Velaga, N. R., Quddus, M. A., and Bristow, A. L. (2009). Developing an Enhanced Weight-Based Topological Map-Matching Algorithm for Intelligent Transport Systems. Transp. Res. Part C: Emerging Tech. 17, 672–683. doi:10.1016/j.trc.2009.05.008
Visa, S., Ramsay, B., Ralescu, A., and Van Der Knaap, E. (2011). “Confusion Matrix-Based Feature Selection,” in Proceedings of the Twenty second Midwest Artificial Intelligence and Cognitive Science Conference, Cincinnati, Ohio. Editors S. Visa, A. Inoue, and A. Ralescu (MAICS), 120–127.
Vluymans, S. (2019). “Learning from Imbalanced Data,” in Studies in Computational Intelligence (IEEE), 81–110. doi:10.1007/978-3-030-04663-7_4
Vogel, K. (2003). A Comparison of Headway and Time to Collision as Safety Indicators. Accid. Anal. Prev. 35, 427–433. doi:10.1016/S0001-4575(02)00022-2
Volk, G., Gamerdinger, J., Bernuth, A. v., and Bringmann, O. (2020). “A Comprehensive Safety Metric to Evaluate Perception in Autonomous Systems,” in 2020 IEEE 23rd International Conference on Intelligent Transportation Systems (ITSC) (Rhodes, Greece: IEEE), 1–8. doi:10.1109/ITSC45102.2020.9294708
Wang, H., Wang, B., Liu, B., Meng, X., and Yang, G. (2017). Pedestrian Recognition and Tracking Using 3D LiDAR for Autonomous Vehicle. Rob. Auton. Syst. 88, 71–78. doi:10.1016/j.robot.2016.11.014
Wang, X., Jiang, R., Li, L., Lin, Y., Zheng, X., and Wang, F.-Y. (2018). Capturing Car-Following Behaviors by Deep Learning. IEEE Trans. Intell. Transport. Syst. 19, 910–920. doi:10.1109/TITS.2017.2706963
Wang, C., Huang, H., Ji, Y., Wang, B., and Yang, M. (2019). Vehicle Localization at an Intersection Using a Traffic Light Map. IEEE Trans. Intell. Transport. Syst. 20, 1432–1441. doi:10.1109/TITS.2018.2851788
Wang, Z., Wu, Y., and Niu, Q. (2020). Multi-Sensor Fusion in Automated Driving: A Survey. IEEE Access 8, 2847–2868. doi:10.1109/ACCESS.2019.2962554
Wang, C., Xie, Y., Huang, H., and Liu, P. (2021). A Review of Surrogate Safety Measures and Their Applications in Connected and Automated Vehicles Safety Modeling. Accid. Anal. Prev. 157, 106157. doi:10.1016/j.aap.2021.106157
Weng, B., Rao, S. J., Deosthale, E., Schnelle, S., and Barickman, F. (2020). “Model Predictive Instantaneous Safety Metric for Evaluation of Automated Driving Systems,” in 2020 IEEE Intelligent Vehicles Symposium (IV) (IEEE), 1899–1906. doi:10.1109/IV47402.2020.9304635
Will, D., Gronert, P., Bargen, S. V., Levrin, F. B., and Larini, G. (2017). Report on the State of the Art of Connected and Automated Driving in Europe (Final). European project SCOUT Deliverable D3.2, Aachen.
Wishart, J., Como, S., Elli, M., Russo, B., Weast, J., Altekar, N., et al. (2020). Driving Safety Performance Assessment Metrics for ADS-Equipped Vehicles. SAE Technical Papers. doi:10.4271/2020-01-1206
Wood, M., Knobel, C., Garbacik, N., Robbel, P., Boymanns, D., Smerza, D., et al. (2019). Safety First for Automated Driving, White Paper of Different Car Manufacutres and Suppliers.
Xin, L., Wang, P., Chan, C.-Y., Chen, J., Li, S. E., and Cheng, B. (2018). “Intention-aware Long Horizon Trajectory Prediction of Surrounding Vehicles Using Dual LSTM Networks,” in 2018 21st International Conference on Intelligent Transportation Systems (ITSC) (IEEE), 1441–1446. doi:10.1109/ITSC.2018.8569595
Xiong, X., Wang, J., Zhang, F., and Li, K. (2016). Combining Deep Reinforcement Learning and Safety Based Control for Autonomous Driving. arXiv Prepr.
Yang, S., Wang, W., Liu, C., and Deng, W. (2019). Scene Understanding in Deep Learning-Based End-To-End Controllers for Autonomous Vehicles. IEEE Trans. Syst. Man. Cybern, Syst. 49, 53–63. doi:10.1109/TSMC.2018.2868372
Yeh, A. G.-O., Zhong, T., and Yue, Y. (2017). Angle Difference Method for Vehicle Navigation in Multilevel Road Networks with a Three-Dimensional Transport GIS Database. IEEE Trans. Intell. Transport. Syst. 18, 140–152. doi:10.1109/TITS.2016.2567451
Yeong, D. J., Velasco-Hernandez, G., Barry, J., and Walsh, J. (2021). Sensor and Sensor Fusion Technology in Autonomous Vehicles: A Review. Sensors 21, 2140. doi:10.3390/s21062140
Yogamani, S., Hughes, C., Horgan, J., Sistu, G., Chennupati, S., Uricar, M., Milz, S., Simon, M., Amende, K., Witt, C., Rashed, H., Nayak, S., Mansoor, S., Varley, P., Perrotton, X., Odea, D., and Perez, P. (2019). “WoodScape: A Multi-Task, Multi-Camera Fisheye Dataset for Autonomous Driving,” in 2019 IEEE/CVF International Conference on Computer Vision (ICCV), Seoul, South Korea (IEEE), 9307–9317. doi:10.1109/ICCV.2019.00940
Yu, H., and Dai, Z. (2019). SNNRice6mA: A Deep Learning Method for Predicting DNA N6-Methyladenine Sites in Rice Genome. Front. Genet. 10, 1071. doi:10.3389/fgene.2019.01071
Zaarane, A., Slimani, I., Al Okaishi, W., Atouf, I., and Hamdoun, A. (2020). Distance Measurement System for Autonomous Vehicles Using Stereo Camera. Array 5, 100016. doi:10.1016/j.array.2020.100016
Zhang, S., Benenson, R., Omran, M., and Schiele, B., (2016). How Far Are We from Solving Pedestrian Detection?. CoRR abs/1602.0. http://arxiv.org/abs/1602.01237.
Zhang, X., Sun, J., Qi, X., and Sun, J. (2019). Simultaneous Modeling of Car-Following and Lane-Changing Behaviors Using Deep Learning. Transp. Res. Part C: Emerging Tech. 104, 287–304. doi:10.1016/j.trc.2019.05.021
Zhao, H., Zhang, Y., Meng, P., Shi, H., Li, L. E., Lou, T., and Zhao, J. (2020). “Safety Score: A Quantitative Approach to Guiding Safety-Aware Autonomous Vehicle Computing System Design,” in 2020 IEEE Intelligent Vehicles Symposium (IV) (Las Vegas, NV: IEEE), 1479–1485. doi:10.1109/IV47402.2020.9304602
Zhu, H., Yuen, K.-V., Mihaylova, L., and Leung, H. (2017). Overview of Environment Perception for Intelligent Vehicles. IEEE Trans. Intell. Transport. Syst. 18, 2584–2601. doi:10.1109/TITS.2017.2658662
Zhu, M., Wang, X., and Wang, Y. (2018). Human-like Autonomous Car-Following Model with Deep Reinforcement Learning. Transp. Res. Part C: Emerging Tech. 97, 348–368. doi:10.1016/j.trc.2018.10.024
Zyner, A., Worrall, S., and Nebot, E. (2018). Naturalistic Driver Intention and Path Prediction Using Recurrent Neural Networks. CoRR abs/1807.0. http://arxiv.org/abs/1807.09995.
Keywords: safety metrics of ADS, human-like perception, human-like driving behavior, ADS safety regulation, obstacle threat level
Citation: Sharath MN and Mehran B (2021) A Literature Review of Performance Metrics of Automated Driving Systems for On-Road Vehicles. Front. Future Transp. 2:759125. doi: 10.3389/ffutr.2021.759125
Received: 15 August 2021; Accepted: 25 October 2021;
Published: 29 November 2021.
Edited by:
Ciprian Alecsandru, Concordia University, CanadaReviewed by:
Hesham El-Sayed, United Arab Emirates University, United Arab EmiratesXuting Duan, Beihang University, China
Copyright © 2021 Sharath and Mehran. This is an open-access article distributed under the terms of the Creative Commons Attribution License (CC BY). The use, distribution or reproduction in other forums is permitted, provided the original author(s) and the copyright owner(s) are credited and that the original publication in this journal is cited, in accordance with accepted academic practice. No use, distribution or reproduction is permitted which does not comply with these terms.
*Correspondence: Babak Mehran, babak.mehran@umanitoba.ca