Nitrous oxide and nitric oxide fluxes differ from tea plantation and tropical forest soils after nitrogen addition
 Galina Y. Toteva1,2
  David Reay2
  Matthew R. Jones1
  Nicholas Cowan1
  Ajinkya Deshpande1 Buddhika Weerakoon3
  Sarath Nissanka3
  Julia Drewer1*
- 1UK Centre for Ecology & Hydrology, Penicuik, United Kingdom
- 2School of GeoSciences, The University of Edinburgh, Edinburgh, United Kingdom
- 3Faculty of Agriculture, University of Peradeniya, Peradeniya, Sri Lanka
South Asia is experiencing a rapid increase in nitrogen (N) pollution which is predicted to continue in the future. One of the possible implications is an increase in gaseous reactive N losses from soil, notably in the form of nitrous oxide (N2O) and nitric oxide (NO). Current knowledge of N2O and NO dynamics in forest ecosystems is not sufficient to understand and mitigate the impacts on climate and air quality. In order to improve the understanding of emissions from two major land uses in Sri Lanka, we investigated the emission potential for N2O and NO fluxes measured by absorption spectroscopy and chemiluminescence, respectively, in response to three different N addition levels (the equivalent of 0, 40 and 100 kg N ha−1 yr.−1 deposition in the form of NH4+) from soils of two typical land uses in Sri Lanka: a secondary montane tropical forest and a tea plantation using soil laboratory incubations of repacked soil cores. We observed an increase in NO fluxes which was directly proportional to the amount of N applied in line with initial expectations (maximum flux ranging from 6–8 ng NO-N g−1 d−1 and from 16–68 ng NO-N g−1 d−1 in forest and tea plantation soils, respectively). However, fluxes of N2O did not show a clear response to N addition, the highest treatment (100 N) did not result in the highest fluxes. Moreover, fluxes of N2O were higher following the addition of a source of carbon (in the form of glucose) across treatment levels and both land uses (maximum flux of 2–34 ng N2O-N g−1 d−1 in forest and 808–3,939 ng N2O-N g−1 d−1 in tea plantation soils). Both N2O and NO fluxes were higher from tea plantation soils compared to forest soils irrespective of treatment level, thus highlighting the importance of land use and land management for gaseous reactive N fluxes and therefore N dynamics.
1 Introduction
Reactive nitrogen (Nr) entering ecosystems has increased dramatically over the past few decades (Erisman et al., 2011; Malik et al., 2022). Galloway et al. (2021) estimated that Nr created by anthropogenic activities (primarily the Haber-Bosch process) has increased from <60 Tg N yr.−1 in 1961 to 226 Tg N yr.−1 in 2020. South Asia has been identified as a major source of Nr pollution, where both the absolute quantities and the growth rates in emissions of several Nr compounds (ammonia – NH3, nitrous oxide – N2O, nitric oxide – NO and nitrogen dioxide – NO2) were higher than global averages for the period 1970 to 2015 (Yang et al., 2022). The amount of Nr fertilizer added to agricultural land increased particularly sharply in South Asia (Begho et al., 2022). For instance, there was a 370 and 3,932% increase in total nitrogen (N) inputs in Sri Lanka and in India, respectively, in 2013 relative to 1961 (Raza et al., 2018). This is consistent with Deshpande et al. (2024) who modeled atmospheric NH3 concentrations over Sri Lanka using the EMEP-WRF (European Monitoring and Evaluation Program – Weather Research and Forecast) model (Ge et al., 2021) and found high concentrations in the central and southwest parts of the country (approximately 10 to 30 μg m−3). The increase in NH3 emissions and hence atmospheric concentrations can in turn lead to increased deposition to agricultural and natural ecosystems (Galloway et al., 2004; Liu et al., 2022). Although a number of N policies have been implemented in recent years (Kanter et al., 2020; Yang et al., 2022), NH3 pollution is predicted to further increase in the future (Lassaletta et al., 2016).
The United Nations Environment Program (UNEP) Frontiers Report identified nitrogen pollution as one of the five emerging threats facing our planet (UNEP, 2019a). Atmospheric deposition acts as a major source of Nr to natural ecosystems which are not subject to managed fertilization (Bobbink et al., 2010). This can have several impacts such as soil acidification (Tian and Niu, 2015) and eutrophication (Sutton et al., 1993; de Vries, 2021), as well as changes to the vegetation communities (Bobbink et al., 2010; Sheppard et al., 2014; Levy et al., 2019), microbial populations (Li et al., 2021) and greenhouse gas (GHG) dynamics (Leeson et al., 2017; Song et al., 2020). The impact of nitrogen deposition on GHG dynamics is not fully understood in the context of natural tropical ecosystems such as forests and may present an underestimated emission source that could contribute to climate change.
One potential but highly uncertain implication of increased N deposition is the increase of gaseous Nr losses, namely N2O and NO. Nitrous oxide is a potent GHG whose global warming potential is 273 times that of carbon dioxide on a 100-year timescale (IPCC, 2023). Elevated N input has been reported to increase the emissions of N2O from agricultural fields (Reay et al., 2012). However, the impacts on forests are more variable and less well understood (van Lent et al., 2015). Tropical forest soils present favorable conditions for high N2O emissions as high temperatures and soil moisture content have been demonstrated to stimulate microbial and enzymatic activity which results in the production and release of N2O (Davidson et al., 2000; Malhi and Wright, 2004; Braker et al., 2010). In a meta-analysis based on 46 studies across various biomes, it was found that N2O emissions were 55% higher on average as a result of increased precipitation levels, irrespective of seasonality, biome type and treatment method (Li et al., 2020).
In addition to N2O, gaseous losses of Nr can also occur in the form of NO (Butterbach-Bahl et al., 2011; van Groenigen et al., 2015). Concentrations of NO play an important role in atmospheric chemistry through its effects on the production and destruction of ozone (O3) (Pilegaard, 2013). This in turn affects the oxidation capacity and the radiation budget of the atmosphere (Jacob, 1999; Ehhalt et al., 2015; Abrol and Adhya, 2017). Similarly to N2O fluxes, NO fluxes from soils have been proposed to be higher in response to increased Nr availability (Firestone and Davidson, 1989; Venterea et al., 2003; Pilegaard et al., 2006; van Lent et al., 2015). Data on NO are relatively rare, especially from tropical regions, compared to other trace gases both from laboratory and field studies (van Lent et al., 2015). Nitrous oxide and nitric oxide share microbial production pathways and therefore studying them together can provide useful insights into the Nr dynamics in an ecosystem.
Tropical regions, including South Asia, have been undergoing dramatic changes to land use in the past century (Li et al., 2023). For instance, forest cover in Sri Lanka decreased from >80% around 1880 to 28% in 2020 predominantly for agriculture, timber extraction, settlements and tea plantations (Geekiyanage and Vithanage, 2015; Pushpakumari, 2021). The latter have been proposed to be a hotspot for N2O emissions (Yu et al., 2023). Wang et al. (2020) estimated annual N2O emissions from tea plantations globally to be 17.1 kg N ha−1 yr.−1 on average (or 8,008 kg CO2eq ha−1 yr.−1) compared to 62–3,757 kg CO2eq ha−1 emitted from cereal croplands. Tea plantations often receive high levels of N fertilizer (typically >500 kg N ha−1 yr.−1) (Wang et al., 2020) and soils are often more acidic compared to natural ecosystems (Cheng et al., 2015). Both factors can contribute to higher N2O emissions relative to other land uses. When investigating the impacts of increased N inputs in tropical areas, it is important to consider different land uses due to the dynamic land use changes in those regions.
Little is known on how future increases in N deposition might affect N2O and NO fluxes from tropical forest soils. Most N studies in tropical regions have been carried out in South America, and South Asian forests remain severely under-represented in global datasets. Sri Lanka was selected as a case study due to the relatively high Nr concentrations in the area and rapidly changing N policy (Yang et al., 2022). For example, the country was a host and a pioneer in signing the Colombo Declaration on Sustainable Nitrogen Management which calls for halving N waste by 2030 (UNEP, 2019b). Later, in 2021, Sri Lanka became the first country to officially ban the use of all synthetic fertilizers; a policy which was reversed a few months later (Weerahewa et al., 2021). The dynamic N policy context in Sri Lanka, high levels of N pollution, high forest cover and absence of previous measurements indicates a global scientific knowledge gap that needs investigation.
In this study, we measured fluxes of N2O and NO from soil cores from a secondary montane tropical forest in Sri Lanka and compared these with soil cores from a local tea plantation which represents a typical land use in the country. To our knowledge, N2O and NO fluxes have not previously been measured from Sri Lankan forest soils despite their potentially large contributions to national emissions. The objectives of the current study are to (1) evaluate the effects of increasing Nr availability (in the form of NH4+) on N2O and NO fluxes from Sri Lanka soils and (2) to compare the response of two typical land uses (a secondary tropical forest and a tea plantation).
2 Materials and methods
2.1 Site description
Soil samples were collected from a secondary montane tropical forest (6°58′10.73” N, 80°35′25.39″ E) and an organic tea plantation (6°58′15.1”N 80°35′37.6″E), both in Queensberry Estate, Kandy region, Central province, Sri Lanka (Supplementary Figure S1). These were located approximately 500 m apart and as such share similar climatic conditions and soil parent material (Mapa, 2020). The elevation is approximately 1,650 m. The climate in the area is classed as tropical monsoon climate (Am) according to the Koppen Climate Classification (Beck et al., 2018) and falls within the Intermediate climatic zone in Sri Lanka (Mapa, 2020). The average annual temperature is approximately 21°C and the annual precipitation is around 2,800 mm per year (Climate-data.org, 2023). The soil type in the forest site was predominantly red laterites.
The main land use in the area is tea plantations. The tea plantation study site has been under organic management since 2020, implying that no synthetic N fertilizer has been applied to the soils since then. Consequently, there is a larger range of understory species compared to other tea plantations in the area, such as Achyranthes aspera, Bidens pilosa, Cleome aspera, Oxalis debilis, Scoparia dulcis. The tea (Camellia sinensis) was planted in rows and occupied a total area of two hectares. The predominant soil type is red yellow podzoles.
The forest site is a secondary montane tropical forest. The previous land use was a tea plantation which was allowed to naturally regenerate 80 years ago. At present, the vegetation community composition resembles that of a primary forest, including tree species such as Syzygium aqueum, Litsea gardneri, Cinnamomum ovalifolium, and Symplocus cordifolia. Average atmospheric NH3 concentrations in the forest site ranged from 0.03 to 1.02 μg m−3 for the period April 2022 to January 2023. This equates to monthly deposition rates to all canopy layers combined of −0.30 to 0.22 kg ha−1 month−1 (Deshpande et al., 2024).
2.2 Field collection methodology and soil pre-treatment
Soil samples were collected in March 2022 from the top 10 cm of soil from both sites. Samples were collected from nine and twenty distinct locations within the forest and tea plantation sites, respectively. Each sample was collected from an area of approximately 10 × 10 cm to ensure that different sampling points contributed similar amount to the final homogenized bulk sample.
All samples were air-dried at approximately 25°C in Sri Lanka prior to shipping to the UK Centre for Ecology and Hydrology, Edinburgh, United Kingdom. The soil was sieved through a 2 mm steel sieve to preserve soil macro aggregate structures (Wilpiszeski et al., 2019). Samples were then homogenized to reduce variability and increase representability. For the laboratory incubations 800 g of soil were placed into Perspex chamber bottoms (d = 19 cm, h = 10) and repacked to approximately field bulk density (ranging between 1.0 and 1.2 g cm−3). At the beginning of each experiment, repacked soil cores were rewetted using deionized water to reach 100% water filled pore space (WFPS). Nitrogen treatments were applied five days later in order to allow for any ‘Birch effect’ impacts and resulting artifacts in GHG emissions (Birch, 1964) to subside.
2.3 Experimental treatments
We compared the N2O and NO fluxes of tea plantation versus forest soils from Sri Lanka in response to different treatment levels of ammonium (NH4+) aqueous solution. We applied Nr in the form of NH4+ since NH3 and NH4+ act as major sources of Nr to natural ecosystems through atmospheric N deposition (Erisman and De Vries, 2000). Each treatment had three replicate incubated cores for trace gas measurements and one destructive core for measurements of other properties (Supplementary Figure S2). Soil was incubated for 40 days in total. There were two N applications: on days 5 and 27 after the start of the experiment. The amount of N applied to each core (800 g of soil on average) to simulate N deposition of 0, 40 and 100 kg N ha−1 yr.−1 was 0 g (0 N), 8.5 g (40 N) and 21.3 g (100 N) per core, respectively. The amount of N added during the first and the second applications was identical. The concentration of NH4+ in the solution was 1.1 g N L−1. Soil moisture was kept constant for 11 days after the first N application and for 9 days after the second application. Soils were then left to dry for approximately one week in both cases. A solution of 1% glucose was applied to all cores together with the second N application as a source of additional carbon (Sanchez-Martín et al., 2008). All soils were kept at constant temperature of 20°C throughout the experiment which is representative of the temperature at both sites.
The NH4+ stock solution was prepared by bubbling NH3 volatized from chicken manure through water (Cowan et al., 2024). Concentrations of NH4+ and NO3− of each solution were confirmed prior to application using a Seal AQ2 analyser (Seal Analytical Inc., Wisconsin, USA). The application solutions were prepared on the day of application by adding deionized water to a stock solution to reach a target concentration which simulates N deposition at the required levels. Deionized water was selected over rainwater to minimize the introduction of Nr compounds beyond the known amount in the application solution.
The 1% glucose solution was prepared by adding 20 g analytical grade glucose (Sigma Aldrich) to 1 L deionized water (Sanchez-Martín et al., 2008). This is the equivalent of 6.6 g of sugar per soil core (800 g on average).
2.4 N2O and NO flux measurements
Fluxes of N2O and NO were measured every day during the first week following the treatment applications and approximately every second day thereafter for a total of 40 days.
Concentrations of N2O were measured using the dynamic chamber method described in Cowan et al. (2014). The experimental setup consisted of a quantum cascade laser (QCL) (Tildas-FD, Aerodyne Research Inc., Billerica, MA, USA), a thermocube unit used to maintain a constant temperature (Thermocube, SS cooling systems, New York, USA), and a pump used to circulate the air (SH-110, Dry Scroll Vacuum Pump, Agilent Technologies, Lexington, MA, USA). This formed a closed loop, non-steady state flow through system. The components of the system were connected via Synflex tubing which is inert in relation to N2O (Nemitz et al., 2018).
A Perspex chamber (diameter = 19 cm, height = 20 cm) was attached to a cylindrical Perspex bottom (diameter = 19 cm, height = 10 cm) which contained the 800 g of soil. The containers were sealed via bulldog clips and a neoprene seal for the duration of each measurement. The flow rate of air through the system was approximately 3.5 L min−1 on average. The total headspace of the chamber plus soil-containing bottom part was 0.01 m3 on average. Concentrations of N2O were recorded continuously at a frequency of 1 Hz (once every second) for 5 min producing 300 data points on average for each measurement. Twenty seconds from the beginning and end of each measurement were removed to account for the lag time that it takes for the gas sample to travel through the closed loop system and reach the detector. Flux of N2O was calculated using Equation 1, where F is gas flux from the soil (nmol m−2 s−1), dC/dt is the rate of change in concentration with time in nmol mol−1 s−1, 𝜌 is the density of air in mol m−3, V is the volume of the chamber in m3 and A is the ground area enclosed by the chamber in m2.
Concentrations of NO were measured separately from N2O using a NO-NO2 ultra-sensitive chemiluminescence analyser (Model T200UP, Enviro Technology Services plc, UK) as part of a gas flow-through system (Drewer et al., 2015). A pump was used to circulate the air through the system at a flow rate of approximately 1 L min−1. This formed an open loop system with a vent to the lab, unlike the QCL setup which was a closed loop. NO concentrations were measured for 20 to 30 min, depending on how quickly the system reached equilibrium. Equilibrium concentrations were recorded for two to four minutes.
Concentrations of O3 were monitored using a 49C O3 analyser (Thermo Environmental Instruments Inc., USA) to ensure that they were below 5 ppb and thus the probability of chemical reactions occurring in the system was low (Seinfeld and Pandis, 2016). O3 data were not included in further analysis.
Fluxes of NO were calculated using equilibrium concentrations unlike N2O flux calculations that utilize changes in concentrations over time (Schindlbacher et al., 2004) (Equation 2). F is NO-N flux expressed in μg m−2 h−1, M is atomic weight (N = 14.008 g mol−1), Q is the mass flow rate of air through the chamber (1 L min−1 on average), Vm is the standard gaseous molar volume (24.055 * 10−3 m3 mol−1), Ceq is the mixing ratio of NO at equilibrium, C0 is the mixing ratio of NO from an empty chamber (blank), and A is the soil surface area of the soil core (0.03 m2).
Empty chambers (blanks) were measured daily, and these blank fluxes were subtracted from the measured fluxes of the soil cores (Drewer et al., 2015).
Fluxes of N2O and NO were then converted from nmol m−2 s−1 and μg m−2 h−1, respectively, to ng N g−1 dry soil d−1 to facilitate the comparison among different Nr forms.
2.5 Soil properties
There was one equivalent and separate “destructive” core for each treatment so that physicochemical soil properties could be measured without interfering with the gas measurements. “Destructive” cores were treated in the same way as the “gas” cores. Soil subsamples were taken from the destructive cores to measure NO3−, NH4+, soil pH, and total carbon and total nitrogen contents.
Subsamples of 20 g of soil were collected from each destructive core on the same day relative to Nr application when the gas measurements took place. 15 g of soil were extracted in 50 mL of 1 M KCl solution to obtain mineral N. The samples were placed on an orbital shaker (SSL1 orbital shaker, Stuart) at 100 rpm for 60 min. The extracts were filtered through Whatman No 40 ashless filter paper (pore size = 8 μm). The concentrations of KCl-extractable NO3− and NH4+, were measured using a discrete multi chemistry analyser (Seal AQ 2, Seal Analytical Inc., Wisconsin, USA). Soil samples were corrected for moisture content by measuring the gravimetric content of separate samples (dried at 105°C for three days).
In an earlier experiment, soil extractions were carried out with three replicates from each core of 6 g of soil and 20 mL of 1 M KCl solution. Preliminary chemical analysis suggested that the variability in NH4+ and NO3− concentrations was small among the replicates due to the soil being homogenized before packing the cores. Consequently, only one sample per core of 15 g was extracted in 50 mL KCl for this study. This decreased the number of samples three times and allowed us to obtain a better representation of the changes in Nr over the duration of the experiment.
The amount of N in the form of NH4+ and NO3− is expressed per gram of dry soil (Equation 3). N refers to the mass of NH4-N or NO3-N expressed in mg N per g of dry soil; c is the concentration of NH4+ or NO3− in mg L−1; v is the volume of KCl solution used during soil extractions in L; m is the mass of dry soil in g. We subtracted the water content on the day of measurement and corrected for the amount of water in air-dried samples to calculate the dry mass of each subsample. The latter was calculated after drying a 15 g air-dried subsample at 105°C until constant weight.
Total C and total N in soil samples were measured at the beginning and at the end of each experiment using an elemental analyser (Flash SMART, Thermo Fisher Scientific). Approximately 4 g of soil were taken from each destructive core, dried at 105°C and milled using a ball mill (MM200 ball mill, Retsch). Approximately 2 mg of soil sample were used for further elemental analysis.
Soil pH was measured using a pH meter (MP 200, Mettler Toledo GmbH, Schwerzenbach, Switzerland) where 10 g of soil from the destructive cores were mixed with 20 mL of deionized water (soil to water ratio of 1:2). The pH was measured 60 min later. A 2-point calibration was performed with calibration solutions of pH 4 and 7 at the beginning of each measurement day.
Bulk density was measured by collecting field samples using a metal cup (diameter = 6 cm, height = 4 cm). Samples were oven-dried at 105°C for three days or until constant weight was reached.
2.6 Data analysis
All data were inspected, cleaned, transformed, visualized and statistically analyzed using R software version 4.2.2 (R Core Team, 2022).
We used a series of two-sample Welch t-tests to check if land use and N dose had a significant impact on cumulative N2O and NO fluxes. These were fitted using the “t.test” function from the stats package in R. Linear regression was performed between the gaseous N forms (N2O and NO) as a response variable and the mineral N forms measured from the soils (NH4+ and NO3−) as predictor variables both in normal and in log space. Linear models were fitted using the “lm” function from the stats package. None of the relationships were significant (p-value > 0.05) and these data are not presented further.
Percentage gaseous losses in the form of N2O and NO were calculated relative to the amount of N applied to the soils plus the amount of the inorganic N present in the soil on the day before the N application (in line with emission factor calculations). N losses were calculated relative to inorganic N as the latter represented only a small fraction of total N present in the soil (ranging between 0.5 and 0.7% at the beginning of the experiment). The first and second N applications were treated as two separate events. Cumulative fluxes of N2O and NO were also calculated separately for the two application periods via linear interpolation.
3 Results
3.1 N2O and NO fluxes
There was a short-lived, two-day burst of N2O fluxes at the beginning of the experiment in both forest and tea plantation soil types (Figure 1). This was most likely the response of the air-dried soil to rewetting. This is the well documented Birch effect (Birch, 1964) and hence it will not be considered in further discussions here.
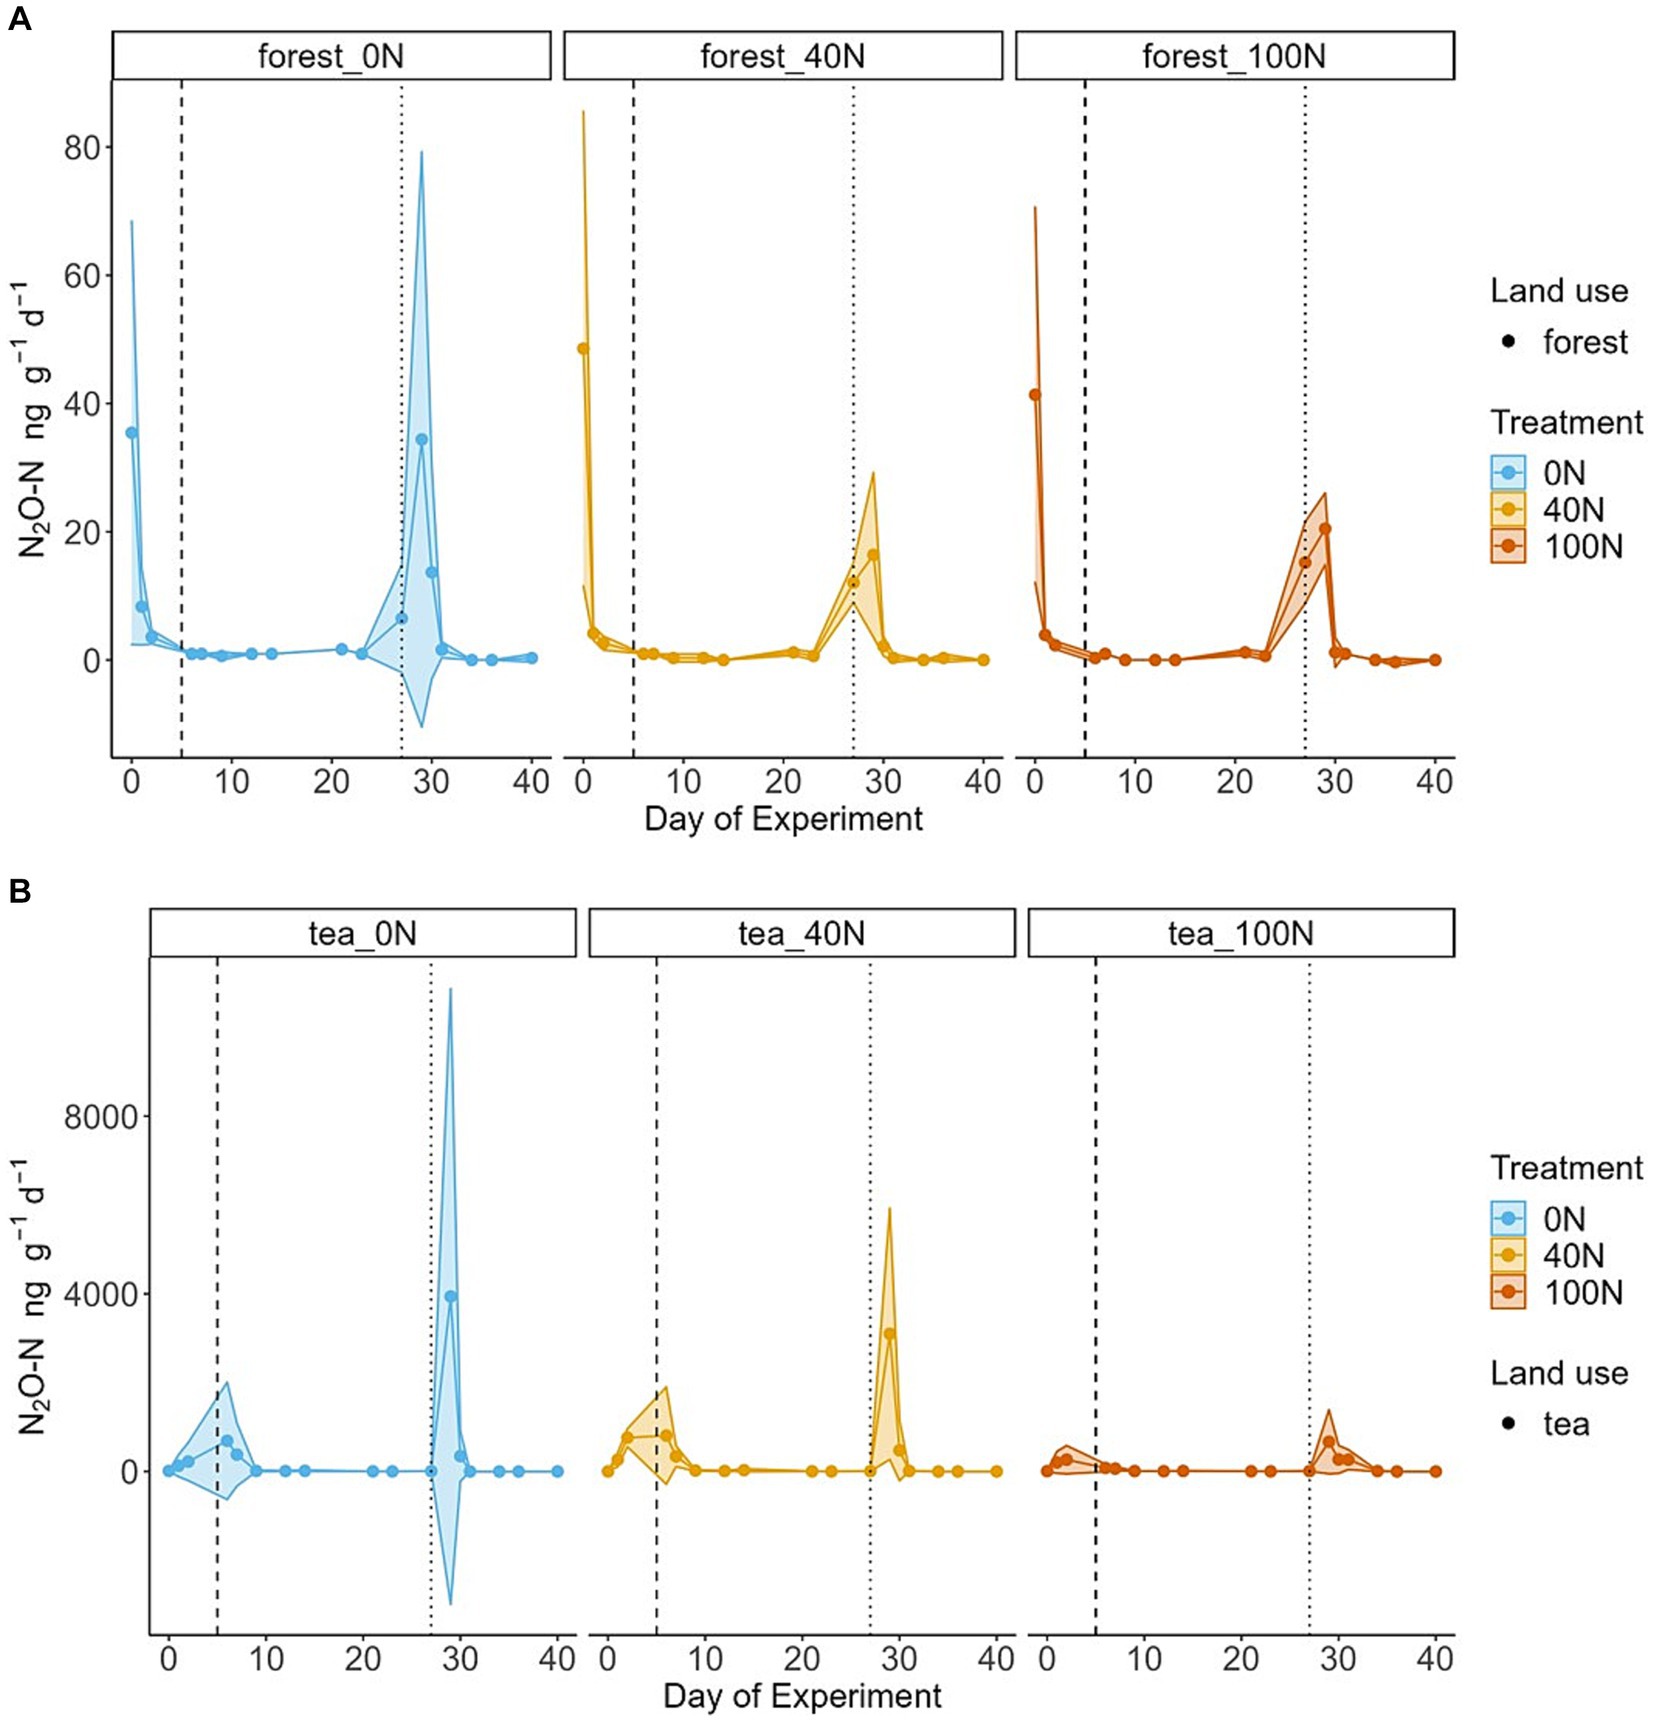
Figure 1. Temporal changes in N2O fluxes from forest (A) and tea (B) soils. The 95% confidence intervals (C.I.) based on triplicates are presented as shaded areas. Blue, orange and red refer to simulated N deposition of 0, 40 and 100 kg N ha−1 yr.−1, respectively. The vertical dashed line corresponds to the first N application event, and the vertical dotted line marks the second application of N together with glucose. Please note the different scales on the y axes between the forest soils (top panel) and the tea plantation soils (bottom panel).
Fluxes of N2O from the forest soils did not increase in response to the first N application across the three treatment levels. Fluxes remained at background levels and close to 0 for 18 days after N application. The maximum value across the three treatments during the first application period ranged from 1 to 2 ng N2O-N g−1 d−1. There was a small increase in N2O fluxes on the day of the second application (N + glucose), followed by a peak the day after (maximum value ranging from 16 to 34 ng N2O-N g−1 d−1). The control treatment (0 N) had the highest peak of N2O fluxes after the second application, yet it was also associated with the highest uncertainty (34 ± 39 ng N2O-N g−1 d−1) (Figure 1). The control treatment cores (0 N) were associated with the highest cumulative fluxes (164 ng N2O-N g−1), followed by the medium treatment (137 ng N2O-N g−1). The highest N treatment had the lowest cumulative fluxes from forest soils (116 ng N2O-N g−1) (Table 1). Cumulative forest fluxes of N2O from the 40 N and 100 N treatments were not significantly different from the control (t-test, df = 3, p-value = 0.37 and 0.42 for 40 N and 100 N, respectively).
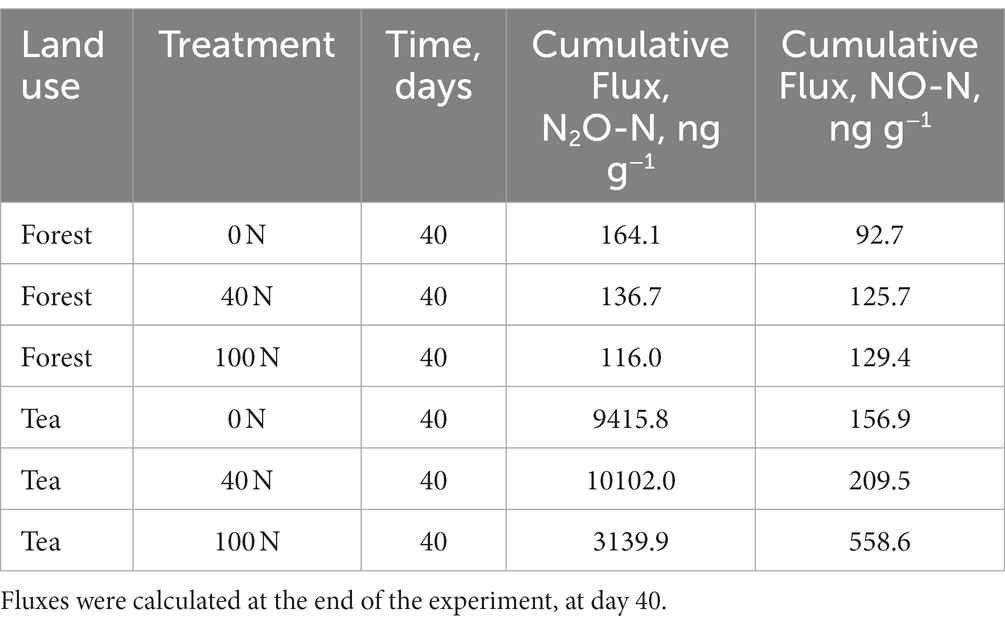
Table 1. Cumulative N2O and NO fluxes from forest and tea plantation soils at three levels of N addition (the equivalent of 0, 40 and 100 kg N ha−1 yr.−1).
Fluxes observed from tea plantation soils were two orders of magnitude higher than their forest counterparts in response to the same level of N addition. This difference was statically significant (t-test, df = 8, p-value = 0.04). The tea plantation soils exhibited a response to the first N addition, albeit smaller compared to the second application (N + glucose). The maximum value of the N2O peak ranged from 80 ng N2O-N g−1 d−1 (100 N treatment) to 808 ng N2O-N g−1 d−1 (40 N treatment) during the first application period. The highest N2O peak occurred two days after the second application with little response on the day of the application (Figure 1). The peak value during the second application period ranged from 669 ng N2O-N g−1 d−1 (100 N treatment) to 3,939 ng N2O-N g−1 d−1 (40 N treatment). The cumulative N2O fluxes from the tea plantation soils were the highest from the medium treatment (40 N) at approximately 10,102 ng N2O-N g−1 d−1. The control cores (0 N) still exhibited larger cumulative fluxes relative to the highest treatment (9,416 compared to 3,140 ng N2O-N g−1 d−1) (Table 1). Similarly to forest soils, N2O fluxes from the tea plantation soils did not differ significantly between the control and the two treatment levels (t-test, df = 3, p-value = 0.94 and 0.54 for 40 N and 100 N, respectively).
Similar to N2O, NO fluxes from tea plantation soils were also significantly higher than their forest counterparts, although the difference in the flux magnitude was less pronounced (Figure 2) (t-test, df = 8, p-value = 0.02). All cores across treatments and vegetation types exhibited the Birch effect. The NO peak did not appear rapidly after applications, in contrast to N2O fluxes. Instead, the peak fluxes occurred around day 23 of the experiment in both the forest and tea plantation soils. The maximum NO peak during the first application period ranged from 6 ng NO-N g−1 d−1 (0 N) to 8 ng NO-N g−1 d−1 (100 N) for forest soils and from 16 ng NO-N g−1 d−1 (0 N) to 68 ng NO-N g−1 d−1 (100 N) for tea plantation soils. Both the peaks and the cumulative NO fluxes were proportional to the treatment levels across the two land uses (Figure 2; Table 1). The differences among the three treatment levels were more pronounced in the tea compared to the forest soils, especially during the first application period. The highest NO flux (68 ng NO-N g−1 d−1) occurred in response to the highest treatment level (100 N). However, the only significant difference in NO fluxes was between the control and the 100 N treatment in tea plantation soils (t-test, df = 3, p-value <0.01).
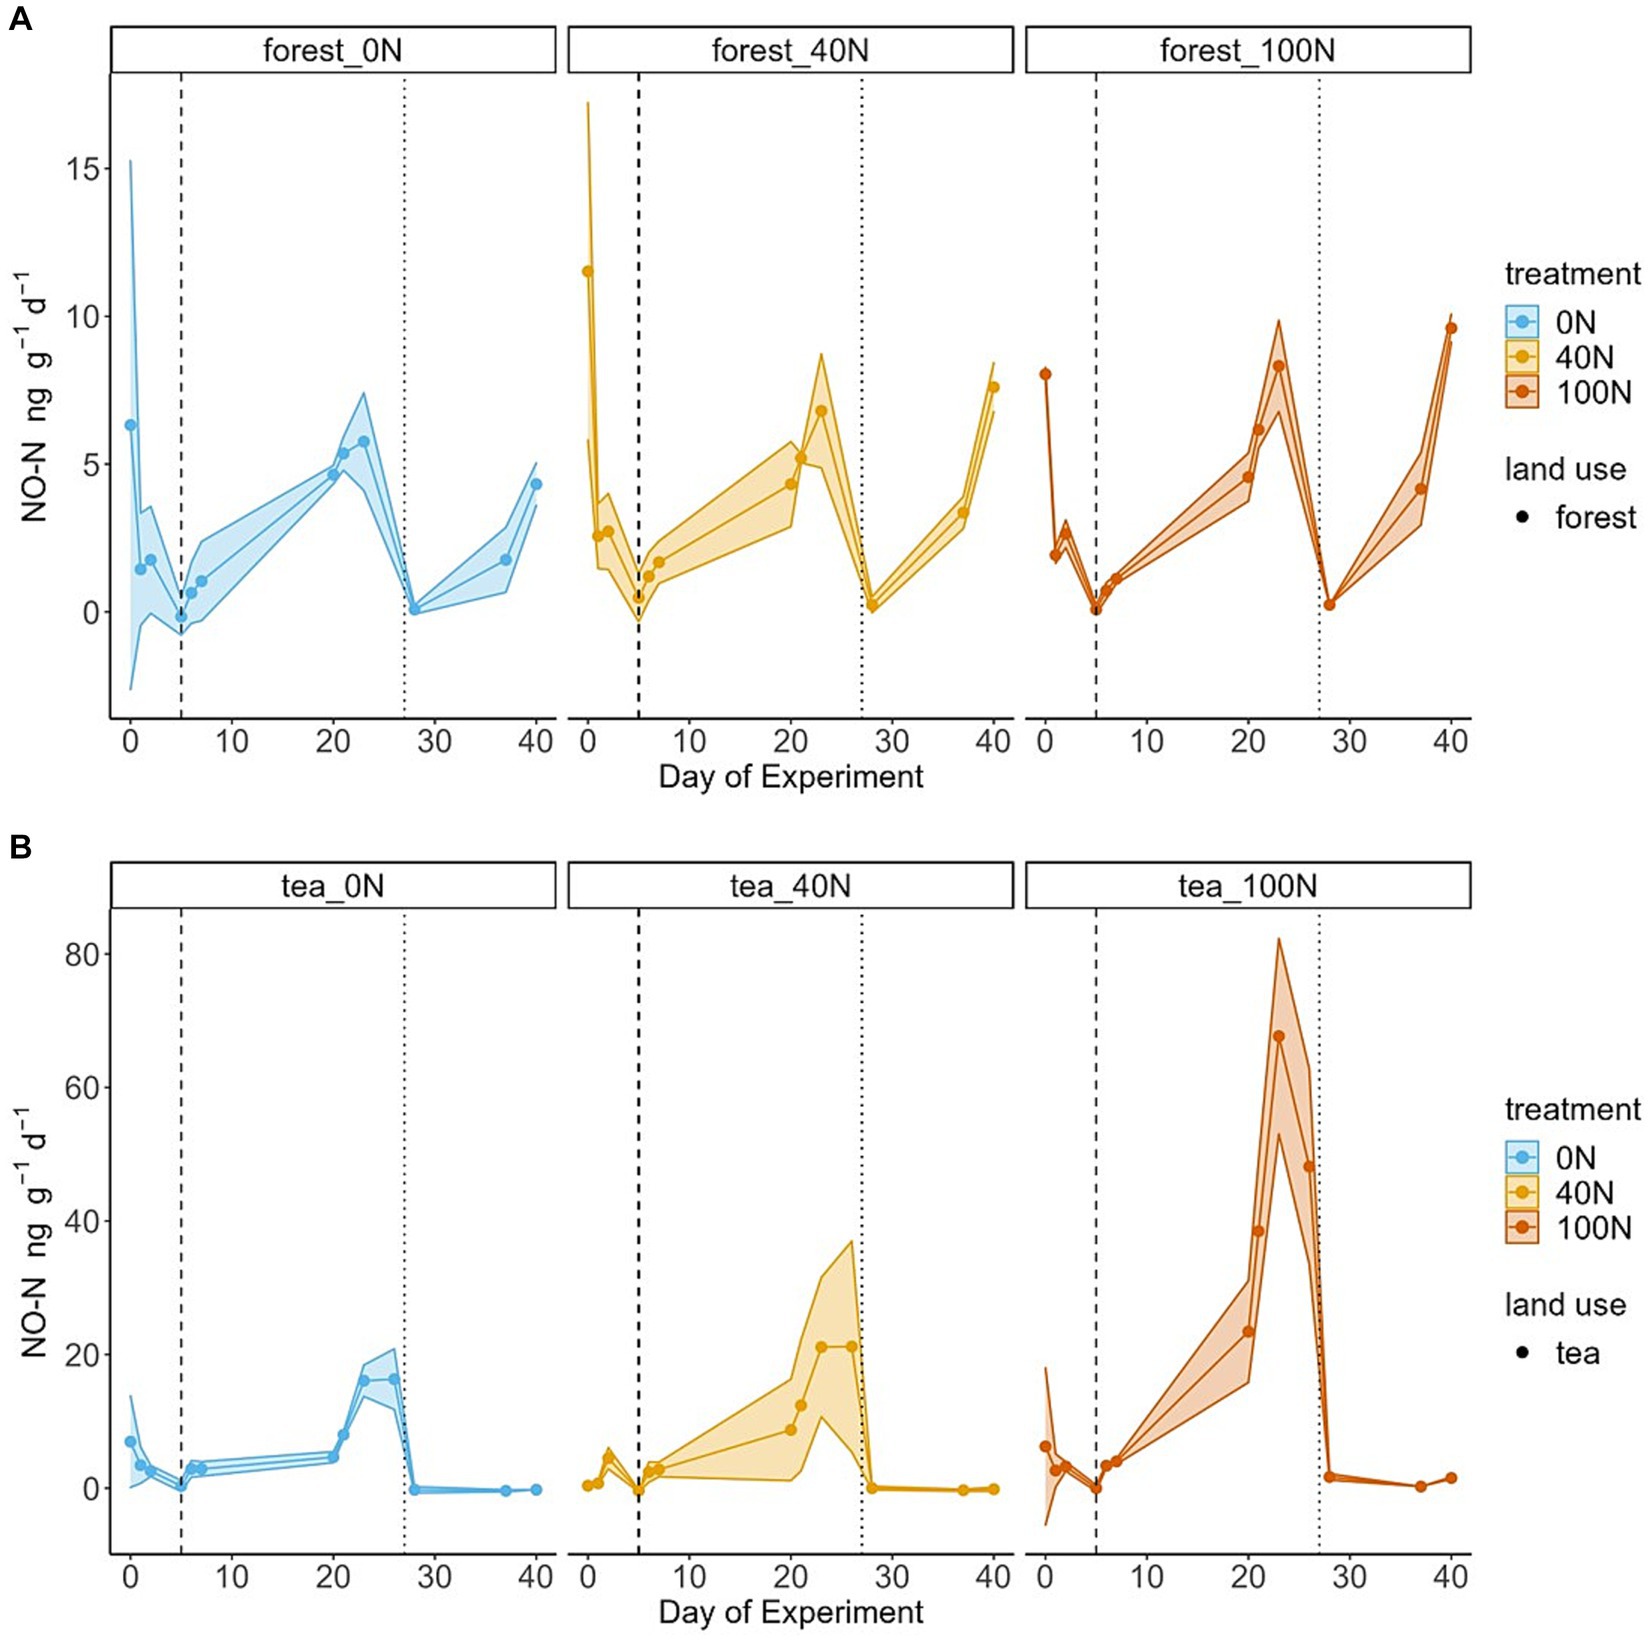
Figure 2. Temporal changes in NO fluxes from forest (A) and tea (B) soils. 95% C.I. based on triplicates are presented as shaded areas. Blue, orange and red refer to simulated N deposition of 0, 40 and 100 kg N ha−1 yr.−1, respectively. The vertical dashed line corresponds to the first N application event, and the vertical dotted line marks the second application of N together with glucose.
3.2 Gaseous N losses
Fluxes of N2O as a percentage of N application were higher during the second application period (with glucose) compared to the first (Table 2). This was particularly pronounced in the tea plantation soils, 40 N treatment, where almost half (48.6%) of the N applied was re-emitted in the form of N2O. However, if we consider the amount of mineral N that is already present in the soil, the percentage losses become more similar. This was the case for both the forest and the tea plantation soils. The percentage loss of N2O was comparable among treatments within the same land use (forest soils percentage loss ranging from 0.01 to 0.05%; tea plantation soils percentage loss ranging from 4.04 to 5.52%). One exception was the 100 N tea plantation soils which exhibited a notably lower percentage loss (0.51 and 1.06% for the first and second applications, respectively).
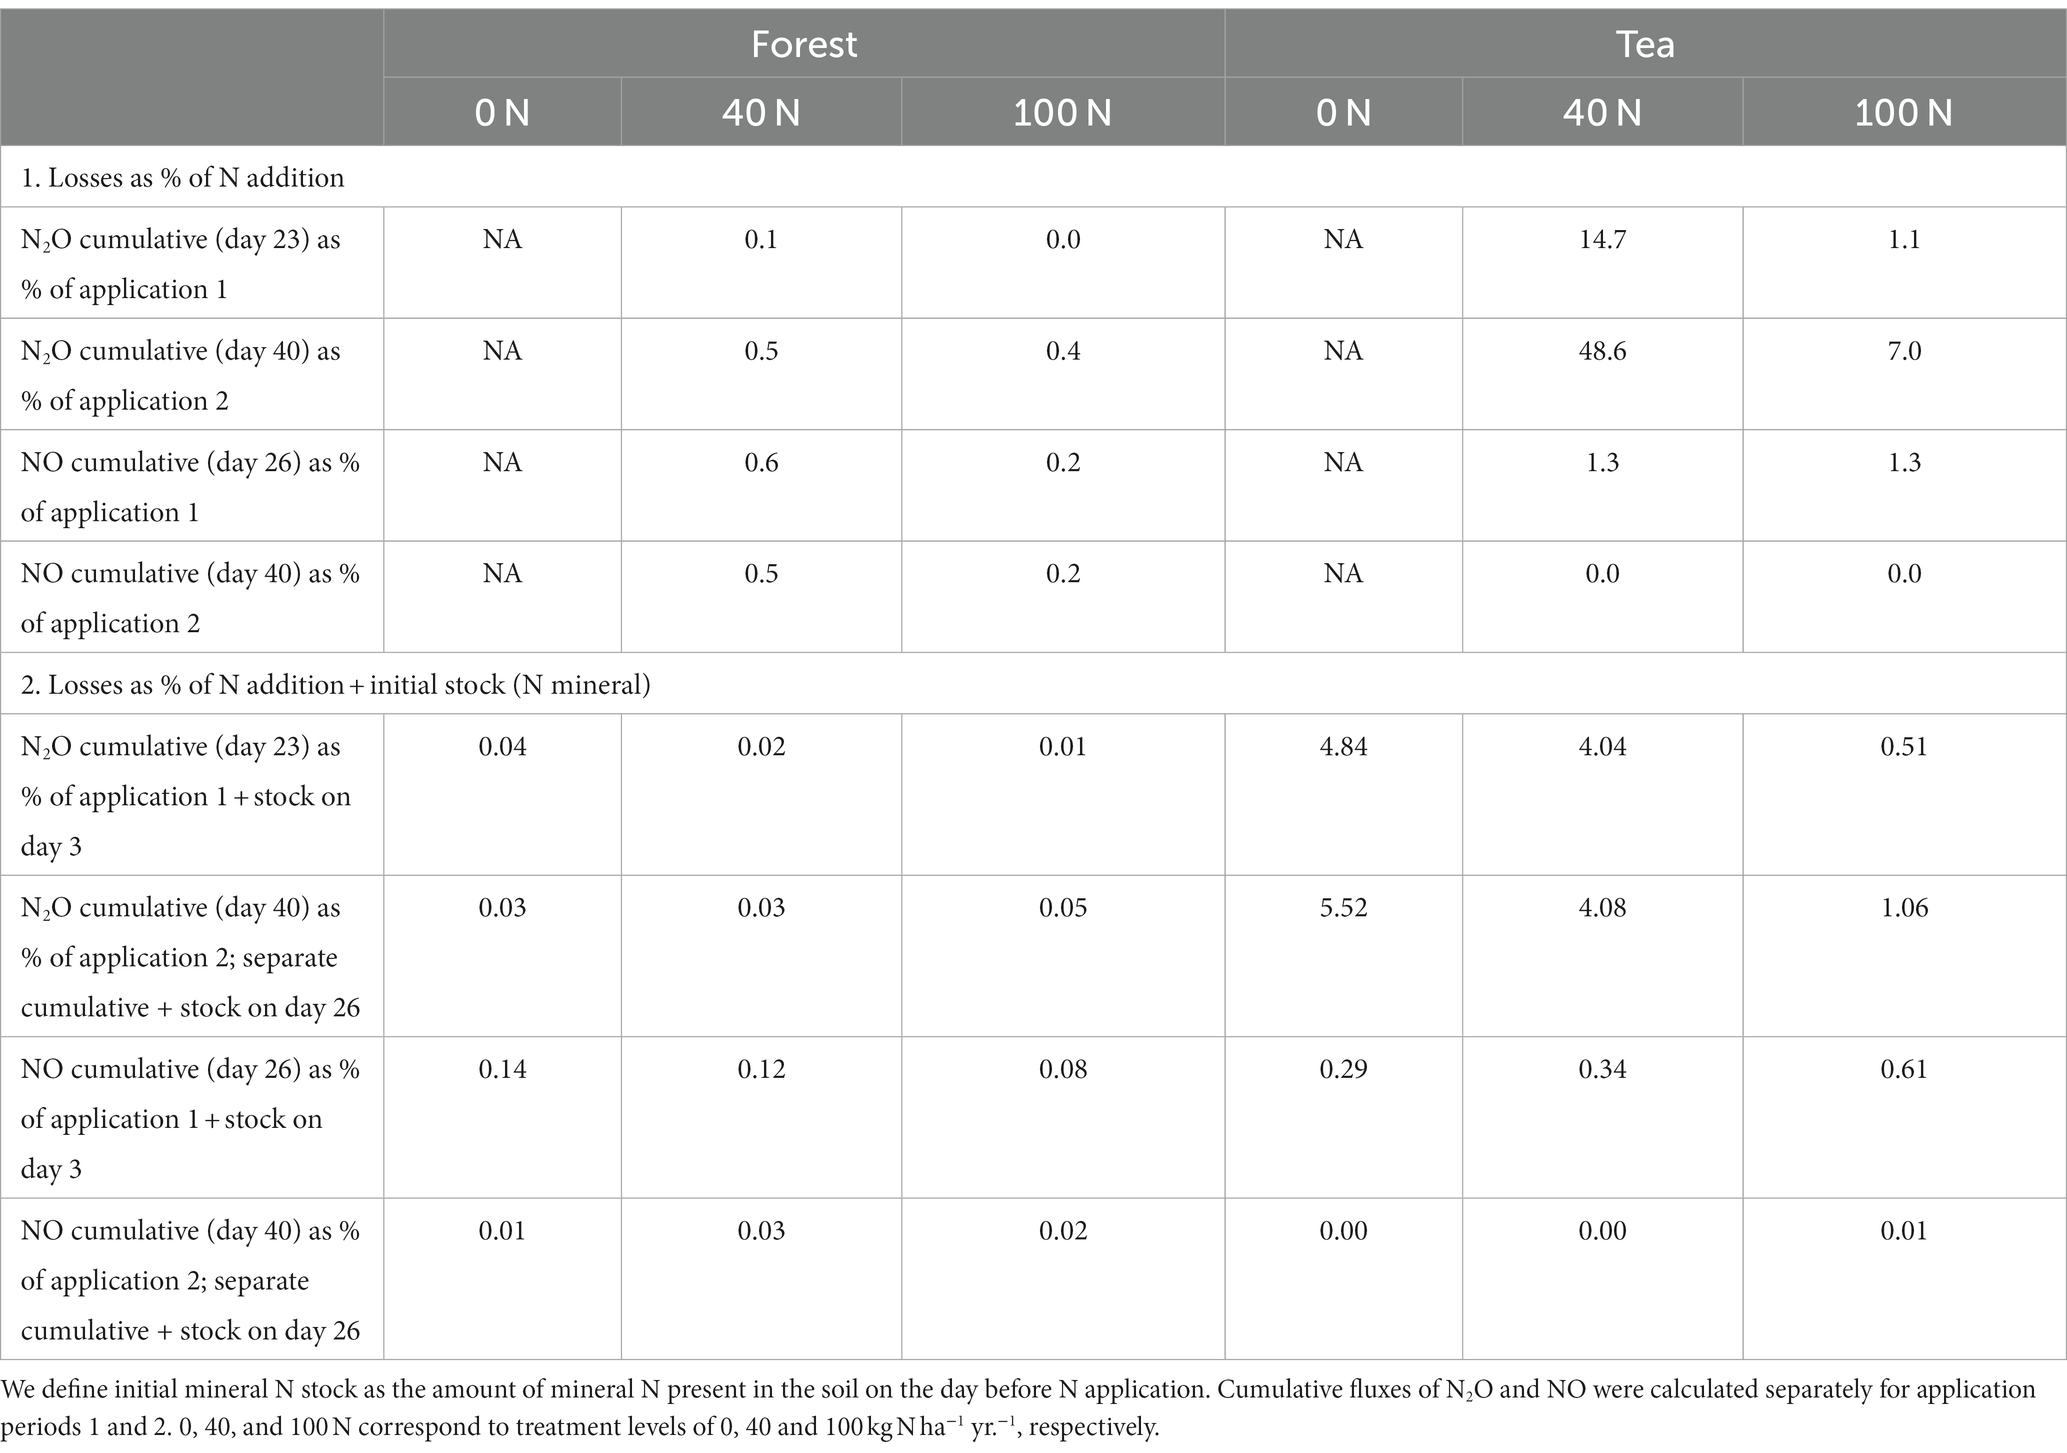
Table 2. Percentage N loss in the form of N2O and NO as a proportion of experimental N application (1) and the sum of experimental N application plus initial mineral N stock.
Percentage loss of NO fluxes was higher during the first compared to the second application period across treatments and for both land uses (Table 2). All the percentage losses from the forest soils were low and similar across treatments (approximately 0.1%). The percentage loss of NO from tea plantations was higher compared to forest soils (ranging from 0.29% for 0 N to 0.61% for 100 N for the first application). It increased slightly at higher N treatments, especially during the first application period.
3.3 Soil properties
Tea plantation soils were more acidic relative to forest soils (pH of 5.1 ± 0.3 compared to 5.6 ± 0.3, respectively). These were also more compacted than forest soils (bulk density of 1 ± 0.02 g cm−3 and 0.89 ± 0.02 g cm−3, respectively) (Supplementary Table S1).
Volumetric water content (VWC) was controlled and monitored during the experiment and followed an identical pattern for all cores. Initially, water was added to the repacked soil cores to reach 100% WFPS, resulting in approximately 35.8 to 38.6% VWC. Soil moisture was maintained constant for 11 and 9 days after the first and second N applications, respectively. The cores were then allowed to dry for 11 and 7 days, respectively.
Forest soils had higher concentrations of total soil carbon both at the beginning and at the end of the experiment relative to the tea plantation soils. Total soil C at the start of the experiment ranged from 4.9 to 5.0% in forest soils and between 3.8 and 4.0% in tea plantation soils. Similarly, forest C concentrations were also higher than that in the tea plantation at the end of the experiment (5.2 to 5.3% compared to 3.8 to 4.1%). There was relatively little change in C in the medium and high forest treatments, except for the glucose application event on day 32, when C content increased to 5.2 and 5.3%, respectively. However, the control forest soils (0 N) showed evidence of C consumption around day 24 when C concentrations dropped to 3.7%, which were then replenished by the application of glucose (to 6.5%). Carbon concentrations in the tea soils were similar at the beginning and end of the experiment (around 4%) across the three treatments.
The amount of mineral N in the form of NO3− and NH4+ varied over the course of the experiment and differed between land use types (Figure 3). In the forest soils, NH4+ concentrations were relatively low and consistent among the three cores at the start of the experiment and before any treatment application (range between 21.2 and 22.1 μg NH4-N g−1). Concentrations increased in response to the N application. We detected two peaks: on day 17 (range between 158.9 and 196.7 μg NH4-N g−1) and on day 31 (range between 192.0 and 235.0 μg NH4-N g−1). The second peak was higher in all three treatments and occurred one day before the second application. The decrease in NH4+ concentrations around day 21 (range between 138.6 and 218.8 μg NH4-N g−1) could correspond to the slight increase in NO3− concentrations around day 31 in the forest soils (range between 4.6 and 20.0 μg NO3-N g−1). NO3− concentrations were generally low and close to 0 in all three forest soil cores except for an increase around day 31. In this case, the magnitude of the concertation increase was proportional to the treatment level.
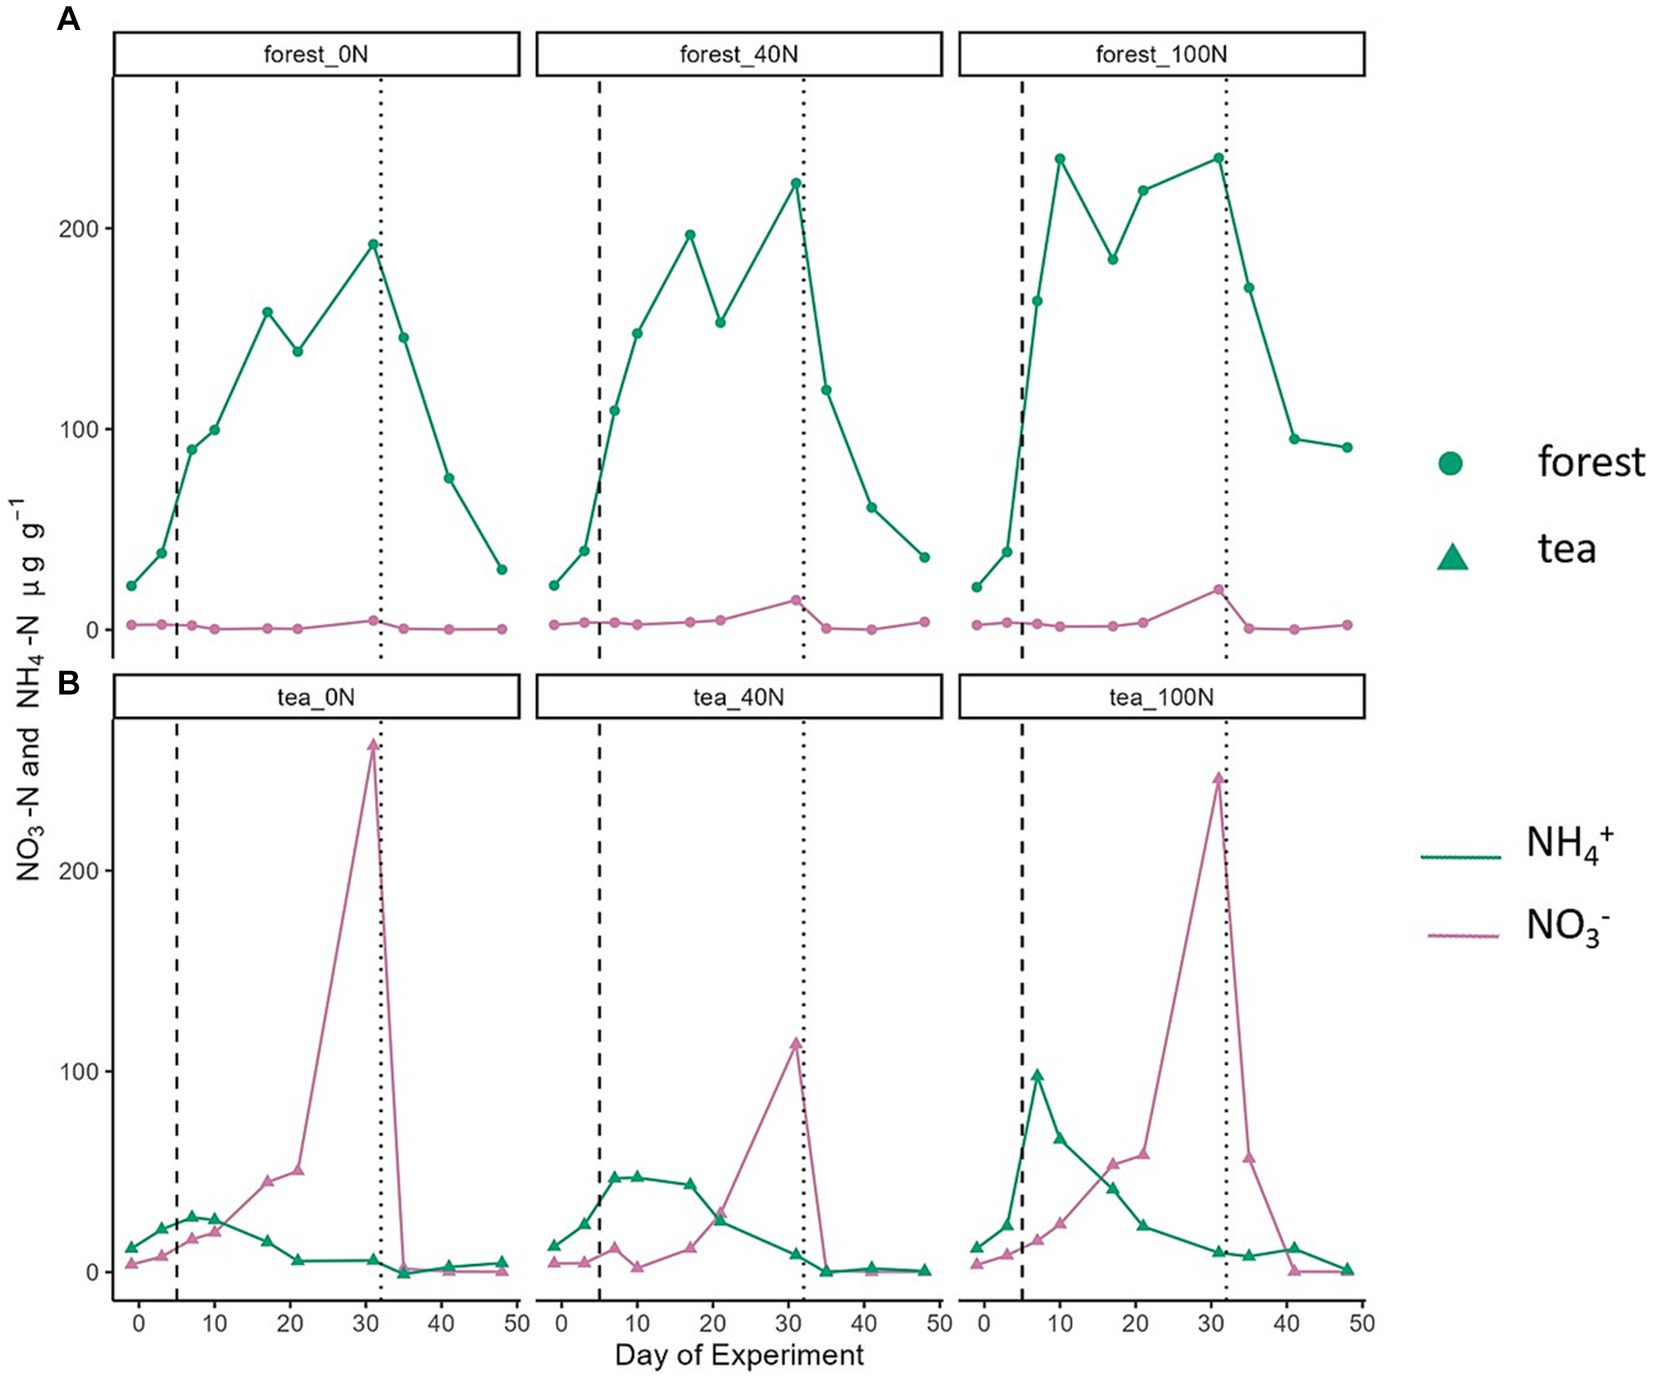
Figure 3. Temporal changes in NO3− (pink) and NH4+ (green) concentrations from forest (A) and tea plantation (B) soils. The vertical dashed line corresponds to the first N application event, and the vertical dotted line marks the second application of N together with glucose.
Tea plantation soils showed different mineral N dynamics compared to forest soils. Nitrate concentrations in tea plantation soils were notably higher than NH4+ concentrations. For instance, the NO3− peak in the 100 N treatment was 245.6 μg NO3-N g−1 (day 31) compared to an NH4 peak of 9.8 μg NH4-N g−1 (day 7). Nitrate concentrations continued to increase after the first N application and reached a peak (range between 113.4 and 262.1 μg NO3-N g−1) one day before the second N application. These decreased rapidly after the second application and remained low after day 35 (<4 μg NO3-N g−1) and during the rest of the experiment. In contrast, NH4+ concentrations from tea plantation soils, showed some increase after the first N application, yet notably lower compared to the forest soils. The highest NH4+ value occurred during the first application period, around day 7, and ranged from 27.2 to 97.6 μg NH4-N g−1. These concentrations then gradually decreased over the course of the experiment (between 5.5 and 25.2 μg NH4-N g−1 on day 21) and remained low (<10 μg NH4-N g−1) even after the second application.
4 Discussion
4.1 Why did higher N addition result in higher NO fluxes but not N2O fluxes?
We observed higher NO fluxes in response to higher treatment levels (both peak and cumulative fluxes) in line with initial expectations. This pattern was present in both land use types, but particularly pronounced in the tea plantation soils. The well-established Hole in the Pipe (HIP) model proposed by Firestone and Davidson (1989) suggests that the more Nr is available in a system, the higher the amount of gaseous Nr losses in the form of NO and N2O will be. However, fluxes of N2O demonstrated the opposite pattern where the highest N treatment (100 N) had the lowest cumulative fluxes in both land use types.
Fluxes of N2O were higher than NO fluxes across treatments and for both soil types. This is in line with previous findings and might suggest that gaseous Nr losses (i.e., those other than N2) occur predominantly as N2O rather than NO from these soils (Hall et al., 2018; Drewer et al., 2020). We observed relatively small N2O fluxes from most cores following the first N application (<1 ng N2O-N g−1 h−1 in forest and < 33.7 ng N2O-N g−1 h−1 in tea plantation). This went contrary to initial expectations. Fluxes of N2O only increased in response to the second application which included both N and C. In a laboratory incubation experiment using Malaysian soils from a logged forest and two oil palm plantations, Drewer et al. (2020) found that both N2O and NO fluxes were higher after rewetting than after N addition in the form of NH4NO3. One of their proposed explanations was that microbial activity could be limited by carbon availability based on the abundance of gene transcripts in the soil (Drewer et al., 2020). The latter hypothesis is consistent with our findings where the larger N2O peak occurred in response to the addition of both N and C as opposed to nitrogen alone. Garcia-Montiel et al. (2003) also reported increased N2O fluxes following the addition of C in the form of glucose using soils from a humid tropical forest in Brazil. Similarly, Figueiredo et al. (2016) suggested that the amount of organic matter in riparian and upland boreal soils affects both N dynamics in general, and N2O production in particular. Fluxes of N2O were reported to be three to five times larger in soils rich in organic matter in that study. One potential explanation is an increase in the Dissimilatory Nitrate Reduction to Ammonium (DNRA) in response to higher C levels which has previously been reported in a meta-analysis of different terrestrial ecosystems, including forests (Cheng et al., 2022).
In the context of our study, it should be noted that glucose (a monosaccharide) is less complex than other organic carbon compounds present in soils and hence is more easily available to microbes. While this could introduce bias to our results, it can still be indicative of a carbon limitation in the microbial community. Morley and Baggs (2010) demonstrated that the form of C compounds plays an important role in the response of the microbial community to N addition as well as in the associated N2O emissions. These experiments were performed in temperate agricultural soils, where microbial communities are subjected to different environmental conditions compared to microbial communities in tropical regions. While it might be difficult to predict whether C form has a stimulating or suppressing effect on microbial diversity and function, we would still expect to observe a differentiated response.
The opposite pattern has also been reported, where increasing amount of organic carbon in soils was suggested to reduce N2O emissions from agricultural soils (Neal et al., 2023). The authors proposed that adding organic C to soils could improve connectivity among soil pores thus increasing soil aeration and consequently decreasing N2O emissions. While this theory might apply to some ecosystems, it assumes that only a small proportion of N2O fluxes were produced as a result of nitrification (an aerobic process). However, based on the NO3− concentrations that we observed in our study and the experimental addition of NH4+ solution, nitrification could be responsible for a large fraction of the N2O fluxes, especially in the tea plantation soils. Furthermore, Liyanage et al. (2020) cautioned against applying large amounts of C alongside high N levels in tropical regions as these might result in high N2O emissions. Their results were based on maize and soybean trials in Sri Lanka. Although their experimental N doses (the equivalent of 0, 100, 220, 300 kg N ha−1 yr.−1) were not representative of natural ecosystems, the report of microbial activity in tropical soils potentially being limited by C is in line with both the current and previous studies (Garcia-Montiel et al., 2003).
There was an increase in NO3− concentration up until the day before the second (N + C) application followed by a sharp decrease in NO3− to nearly 0 μg g−1. This pattern was observed in all cores, although it was more pronounced in tea plantation soils. The sharp decrease in NO3− concentrations following the C addition likely suggested that denitrification took place. This is also consistent with the observed peak in N2O fluxes after the second application. While N2O fluxes were present in all cores (n = 18), it is possible that much of the N was re-emitted in the form of N2. This would suggest complete denitrification and is consistent with the relatively low NO3− concentrations that we observed. Almaraz et al. (2023) proposed that “excess” N might be re-emitted as N2 rather than as N oxides, especially in wet tropical soils where O2 concentrations tend to be low. Morley et al. (2014) suggested that this process of complete denitrification might also be modulated by C availability. However, N2 production remains a less well understood process compared to N2O and NO fluxes (Galloway et al., 2004; Lehnert et al., 2021) and tends to be reported less often (as it is difficult to measure given very high background concentrations).
The potential carbon limitation on the microbial community still did not explain why the 100 N treatment resulted in the lowest cumulative N2O fluxes, as we observed the same pattern after the N + C addition. Our laboratory study represented a closed system. We hypothesize that Nr could only exit the system in the form of gaseous emissions as neither leaching, nor plant uptake could occur within the incubation cores. Similarly, mineral N concentrations at the end of the experiment were low, particularly in tea plantation soils (<5 μg g−1), thus suggesting that N did not accumulate in the soils. Another uniqueness of our study is that N availability was increased by adding NH4+ solution rather than the commonly used NH4NO3 or another N form. While NH4NO3 is often utilized in N addition studies due to convenience and ease of comparison to past research, it is less representative of atmospheric deposition to natural ecosystems (Erisman and De Vries, 2000). N form has been reported to affect the diversity and composition of microbial communities (Liu et al., 2021; Ding et al., 2023). It has been suggested that NH4+ plays an important role in shaping bacterial but not fungal communities based on a study of temperate forest soil (Ding et al., 2023). This is an important consideration given that bacteria tend to dominate over fungi in biomes with high mean annual temperature and net primary productivity, such as tropical regions (Yu et al., 2022). However, specific data on the microbial community at our study sites were not available.
As ammonia oxidizers use carbon dioxide for biomass synthesis, previous studies have reported enhanced nitrification-based N2O production after ammonium based fertilization (Hink et al., 2017, 2018). Hence, ammonia oxidation could also have contributed to the second N2O emission pulse after N fertilization in our case. However, since the nitrogen source was sufficiently applied, we suspect that the depleted organic carbon might be the limiting factor affecting the denitrification-related N2O production as previously reported by Drewer et al. (2020) who also identified denitrifiers and archaeal ammonia oxidizers as the main contributors to N2O emissions, albeit with varying activity levels. The relative contribution of denitrification vs. ammonia oxidation was difficult to estimate in their study despite extensive microbial analysis. Based on the mineral N dynamics in our study, the nitrification or ammonia oxidation processes in the tea plantation soils likely contributed less than in forest soils.
The carbon and nitrogen cycles are closely coupled in ecosystems (Zaehle, 2013) and hence it is likely that a C limitation might modulate the response of the microbial community to increased N availability. This emphasizes the fact that N availability is not the only factor that affects N2O production. While our results support a potential carbon limitation, this is not sufficient to establish a causal relationship based on the current data alone.
4.2 Why were gaseous Nr losses higher from tea plantation than from forest soils?
The N2O emission potential from the tea plantation soils was two orders of magnitude higher compared to the forest soils. Fluxes of NO were also higher from the tea plantation soils although the difference was less pronounced. This is consistent with a meta-analysis on the effects of land use on N fluxes which proposed that fertilized systems often emit higher N2O fluxes compared to natural ecosystems (van Lent et al., 2015). Since we performed a laboratory experiment, our results more accurately depict the emission potential of soils rather than absolute field emissions. In a similar laboratory incubation experiment of tropical soils, Drewer et al. (2020) reported higher N2O and NO emission potential from logged forest soils compared to an oil palm plantation (15.6 and 11.5 ng N2O-N g−1 h−1 and 6.0 and 1.6 ng NO-N g−1 h−1, respectively). In their study, a riparian reserve forest showed the lowest emission potential of all. This study highlighted that some forest soils have the potential to be a significant source of N2O emission, on the same order of magnitude as plantations, depending on the environmental conditions and disturbances. We also observed lower emission potential from a natural ecosystem compared to a plantation, with the caveat that these observations could change in the future depending on environmental conditions.
A major difference that we observed between the tea plantation and forest sites was opposing trends in NO3− and NH4+ dynamics. Forest soils exhibited high NH4+ and low NO3− concentrations, whereas tea plantation soils contrastingly showed high NO3− and low NH4+ concentrations. In a meta-analysis of 104 studies from tropical areas, it was reported that plantation soils tend to have higher NO3− concentrations compared to natural ecosystems (van Lent et al., 2015). This is likely due to nitrification taking place in the soils. This hypothesis is consistent with our observations, as NH4+ concentrations from the tea plantation soils decreased following the first N application. Simultaneously, NO3− concentrations increased, thus suggesting nitrification. In contrast, the change in NO3− concentrations from the forest soils was less pronounced and concentrations were close to 0 μg g−1 for the majority of the experiment. While NO3− concentrations in the forest soils did not change notably, there was an increase in NO fluxes around the time of the decrease in NH4+ concentrations (approximately day 20). This suggests that nitrification took place in both land use types, however it is likely that most of the NH4+ was emitted as NO (and possibly N2) rather than remaining in the soil as NO3− in the case of the forest soils.
In general, tropical forests have been suggested to be rich in N and plant growth tends to be limited by P and not N availability (Vitousek, 1984). Consequently, tropical forests are considered to exhibit an open N cycle, meaning that the rate of cycling and loss of N from the system is high compared to systems with N limitation, where N is cycled more efficiently (Vitousek, 1984). This can also result in higher gaseous Nr losses from the system (Aber, 1992). However, Wolf et al. (2011) demonstrated that this is not always the case, particularly in the context of tropical montane forests. They found that N availability decreased alongside an elevation gradient (1,000 to 3,000 m) in Ecuador, suggesting a potential N limitation in the system. The paradigm of high N availability in tropical forests was further contested by Gallarotti et al. (2021) study using a δ15N isotopic approach in the Congo basin. While tropical soils are still widely considered to be poor in P, primarily due to leaching, N might be the limiting nutrient especially in montane forests (Dalling et al., 2016). This could explain why we observed smaller gaseous Nr losses from montane forest soils compared to tea plantation soils. This is further supported by the fact that tea plantations are likely to be saturated in N due to high fertilizer application (typically >500 kg N ha−1 yr.−1) (Wang et al., 2020). Moreover, tea plantations have previously been proposed to be hotspots of N2O emissions (Wang et al., 2020; Yu et al., 2023). Even though our tea plantation study site has been under organic cultivation for the past three years, the soil is still likely to exhibit memory effects due to past management practices (Targulian and Bronnikova, 2019).
4.3 Implications
Our findings raise the question of what might happen in the future if forest soils continue to be exposed to elevated amounts of atmospheric N deposition. Could those ecosystems become N saturated, similar to plantations and so result in significant increases in gaseous Nr emissions? And if this is the case, when will saturation occur? In the meantime, there are international initiatives for increasing the amount of carbon stored in soils as a potential climate change mitigation measure, such as “4 per 1,000” (The International “4 per 1000” Initiative, 2015). Several studies have raised concerns over that as increasing soil carbon could incur a penalty in terms of increased N2O emissions (Lugato et al., 2018; Guenet et al., 2021). This is in line with our findings which suggested a potential C limitation on the microbial community.
It is important to acknowledge that N2O and NO production in soils can occur because of several different microbial processes, each of which is controlled by different environmental conditions (Baggs, 2011; Butterbach-Bahl et al., 2013). This complexity is often not captured in emission inventories, which are one of the most commonly used tools for estimating GHG emissions on regional and global scales. Instead, inventories rely on activity data multiplied by an emission factor (IPCC, 2019). This can pose several challenges, especially in the case of N2O emissions from tropical soils. Namely: (1) emission factors are often built upon relationships observed in temperate regions and as such might not always apply to tropical soils; (2) limited activity data which only account for N inputs, (3) do not capture change in environmental conditions such as changes to N deposition, nutrient availability and climate-change-induced changes to temperature and precipitation; (4) a default value is typically used for all natural ecosystems, regardless of vegetation type and other relevant biome-specific conditions.
We recommend that future studies focus on better understanding the mechanisms that underlie N2O and NO production in tropical soils, including the role of nutrient limitations and the coupling of the C and N cycles. Long-term field scale experiments would be particularly useful for that purpose. Ideally, application of default (tier 1) emission factors in such systems should be replaced by tier 2 and 3 approaches that better account for the dynamically changing environmental conditions and take advantage of the increasing amount of environmental data available.
5 Conclusion
Our findings highlighted the importance of land use and land management in modulating N2O and NO fluxes from tropical soils. Ecosystems that have previously been exposed to high levels of Nr, such as tea plantations, were more likely to exhibit higher gaseous Nr losses compared to natural ecosystems, when exposed to the same controlled conditions and N addition. This was particularly pronounced after adding a source of carbon to the soil cores under investigation. Future land use strategies should carefully consider the balance between managing land for agricultural productivity and carbon storage versus any potential penalties in terms of non-CO2 greenhouse gases.
Data availability statement
The raw data supporting the conclusions of this article will be made available by the authors, without undue reservation.
Author contributions
GT: Conceptualization, Formal analysis, Investigation, Writing – original draft. DR: Funding acquisition, Supervision, Writing – review & editing. MJ: Supervision, Writing – review & editing. NC: Methodology, Writing – review & editing. AD: Writing – review & editing. BW: Writing – review & editing. SN: Resources, Writing – review & editing. JD: Conceptualization, Funding acquisition, Methodology, Resources, Supervision, Writing – review & editing.
Funding
The author(s) declare financial support was received for the research, authorship, and/or publication of this article. This project was funded by the UK Research and Innovation (UKRI) Global Challenges Research Fund (GCRF) as part of the South Asia Nitrogen Hub SANH project (NE/S009019/1) and the University of Edinburgh.
Acknowledgments
We would like to thank Tharindu Prabhashwara, Shamodi Nanayakkara, and the rest of the team of Dilmah Conservation for granting access to the study sites and providing on the ground support during field work; Anushka Tennakoon and Samitha Disanayaka for help with soil preparation; Ivan Simmons for setting up the NO-NO2 analyser; Duncan Harvey, Neil Mullinger and Netty van Dijk for help and advice during soil collection in the field.
Conflict of interest
The authors declare that the research was conducted in the absence of any commercial or financial relationships that could be construed as a potential conflict of interest.
Publisher’s note
All claims expressed in this article are solely those of the authors and do not necessarily represent those of their affiliated organizations, or those of the publisher, the editors and the reviewers. Any product that may be evaluated in this article, or claim that may be made by its manufacturer, is not guaranteed or endorsed by the publisher.
Supplementary material
The Supplementary material for this article can be found online at: https://www.frontiersin.org/articles/10.3389/ffgc.2024.1335775/full#supplementary-material
References
Aber, J. D. (1992). Nitrogen cycling and nitrogen saturation in temperate forest ecosystems. Trends Ecol. Evol. 7, 220–224. doi: 10.1016/0169-5347(92)90048-G
Almaraz, M., Groffman, P. M., Silver, W. L., Hall, S. J., Lin, Y., O’Connell, C., et al. (2023). Dinitrogen emissions dominate nitrogen gas emissions from soils with low oxygen availability in a moist tropical Forest. JGR Biogeosci. 128:7210. doi: 10.1029/2022JG007210
Baggs, E. M. (2011). Soil microbial sources of nitrous oxide: recent advances in knowledge, emerging challenges and future direction. Curr. Opin. Environ. Sustain. Carbon Nitrogen Cycles 3, 321–327. doi: 10.1016/j.cosust.2011.08.011
Beck, H. E., Zimmermann, N. E., McVicar, T. R., Vergopolan, N., Berg, A., and Wood, E. F. (2018). Present and future Köppen-Geiger climate classification maps at 1-km resolution. Sci. Data 5:180214. doi: 10.1038/sdata.2018.214
Begho, T., Eory, V., and Glenk, K. (2022). Demystifying risk attitudes and fertilizer use: a review focusing on the behavioral factors associated with agricultural nitrogen emissions in South Asia. Front. Sustain. Food Syst. 6:991185. doi: 10.3389/fsufs.2022.991185
Birch, H. (1964). Mineralisation of plant nitrogen following alternate wet and dry conditions. Plant Soil 20, 43–49. doi: 10.1007/BF01378096
Bobbink, R., Hicks, K., Galloway, J., Spranger, T., Alkemade, R., Ashmore, M., et al. (2010). Global assessment of nitrogen deposition effects on terrestrial plant diversity: a synthesis. Ecol. Appl. 20, 30–59. doi: 10.1890/08-1140.1
Braker, G., Schwarz, J., and Conrad, R. (2010). Influence of temperature on the composition and activity of denitrifying soil communities. FEMS Microbiol. Ecol. 73, 134–148. doi: 10.1111/j.1574-6941.2010.00884.x
Butterbach-Bahl, K., Baggs, E. M., Dannenmann, M., Kiese, R., and Zechmeister-Boltenstern, S. (2013). Nitrous oxide emissions from soils: how well do we understand the processes and their controls? Philos. Trans. 368, 20130122–20130113. doi: 10.1098/rstb.2013.0122
Butterbach-Bahl, K., Gundersen, P., Ambus, P., Augustin, J., Beier, C., Boeckx, P., et al. (2011). “Nitrogen processes in terrestrial ecosystems” in The European nitrogen assessment: Sources, effects and policy perspectives. eds. A. Bleeker, B. Grizzetti, C. M. Howard, G. Billen, H. van Grinsven, and J. W. Erisman (Cambridge: Cambridge University Press), 99–125.
Cheng, Y., Elrys, A. S., Merwad, A.-R. M., Zhang, H., Chen, Z., Zhang, J., et al. (2022). Global patterns and drivers of soil dissimilatory nitrate reduction to ammonium. Environ. Sci. Technol. 56, 3791–3800. doi: 10.1021/acs.est.1c07997
Cheng, Y., Wang, J., Zhang, J.-B., Müller, C., and Wang, S.-Q. (2015). Mechanistic insights into the effects of N fertilizer application on N2O-emission pathways in acidic soil of a tea plantation. Plant Soil 389, 45–57. doi: 10.1007/s11104-014-2343-y
Climate-data.org. (2023). Climate Central Province, Sri Lanka: Temperature, climate graph, Climate table for Central Province, Sri Lanka [WWW Document]. Available at: https://en.climate-data.org/asia/sri-lanka/central-province-2619/ (Accessed August 29, 2023)
Cowan, N. J., Ashwood, D., Drewer, J., Toteva, G. Y., and Heal, M. R. (2024). A low tech, low cost method to capture point-source ammonia emissions and their potential use as a nitrogen fertiliser. PLoS Sustain. Transform. 19:e0296679. doi: 10.1371/journal.pone.0296679
Cowan, N. J., Famulari, D., Levy, P. E., Anderson, M., Bell, M. J., Rees, R. M., et al. (2014). An improved method for measuring soil N2O fluxes using a quantum cascade laser with a dynamic chamber. Eur. J. Soil Sci. 65, 643–652. doi: 10.1111/ejss.12168
Dalling, J. W., Heineman, K., Lopez, O. R., Wright, S. J., and Turner, B. L. (2016). “Nutrient availability in tropical rain forests: the paradigm of phosphorus limitation” in Tropical tree physiology: Adaptations and responses in a changing environment, Tree Physiology. eds. G. Goldstein and L. S. Santiago (Cham: Springer International Publishing), 261–273.
Davidson, E. A., Keller, M., Erickson, H. E., Verchot, L. V., and Veldkamp, E. (2000). Testing a conceptual model of soil emissions of nitrous and nitric oxides. Bioscience 50, 667–680. doi: 10.1641/0006-3568(2000)050[0667:TACMOS]2.0.CO;2
de Vries, W. (2021). Impacts of nitrogen emissions on ecosystems and human health: a mini review. Curr. Opin. Environ. Sci. Health 21:100249. doi: 10.1016/j.coesh.2021.100249
Deshpande, A. G., Jones, M. R., van Dijk, N., Mullinger, N. J., Harvey, D., Nicoll, R., et al. (2024). Estimation of ammonia deposition to forest ecosystems in Scotland and Sri Lanka using wind-controlled NH3 enhancement experiments. Atmos. Environ. 320:120325. doi: 10.1016/j.atmosenv.2023.120325
Ding, Z., Gong, L., Zhu, H., Tang, J., Li, X., and Zhang, H. (2023). Changes in soil microbial communities under mixed organic and inorganic nitrogen addition in temperate forests. Forests 14:21. doi: 10.3390/f14010021
Drewer, J., Braban, C. F., Tang, Y. S., Anderson, M., Skiba, U. M., Dragosits, U., et al. (2015). Surface greenhouse gas fluxes downwind of a penguin colony in the maritime sub-Antarctic. Atmos. Environ. 123, 9–17. doi: 10.1016/j.atmosenv.2015.10.062
Drewer, J., Zhao, J., Leduning, M. M., Levy, P. E., Sentian, J., Gubry-Rangin, C., et al. (2020). Linking nitrous oxide and nitric oxide fluxes to microbial communities in tropical Forest soils and oil palm plantations in Malaysia in laboratory incubations. Front. For. Glob. Change 3:4. doi: 10.3389/ffgc.2020.00004
Ehhalt, D. H., Rohrer, F., and Wahner, A. (2015). “Tropospheric chemistry and composition | oxidizing capacity” in Encyclopedia of atmospheric sciences. eds. G. R. North, J. Pyle, and F. Zhang. 2nd ed (Oxford: Academic Press), 243–250.
Erisman, J. W., and De Vries, W. (2000). Nitrogen deposition and effects on European forests. Environ. Rev. 8, 65–93. doi: 10.1139/a00-006
Erisman, J. W., Galloway, J., Seitzinger, S., Bleeker, A., and Butterbach-Bahl, K. (2011). Reactive nitrogen in the environment and its effect on climate change. Curr. Opin. Environ. Sustain. Carbon Nitrogen Cycles 3, 281–290. doi: 10.1016/j.cosust.2011.08.012
Figueiredo, V., Enrich-Prast, A., and Rütting, T. (2016). Soil organic matter content controls gross nitrogen dynamics and N2O production in riparian and upland boreal soil. Eur. J. Soil Sci. 67, 782–791. doi: 10.1111/ejss.12384
Firestone, M. K., and Davidson, E. A. (1989). “Microbiological basis of NO and N2O production and consumption in soil” in Exchange of trace gases between terrestrial ecosystems and the atmosphere. ed. M. O. Andreae (Hoboken, NJ: Wiley), 7–21.
Gallarotti, N., Barthel, M., Verhoeven, E., Pereira, E. I. P., Bauters, M., Baumgartner, S., et al. (2021). In-depth analysis of N2O fluxes in tropical forest soils of the Congo Basin combining isotope and functional gene analysis. ISME J. 15, 3357–3374. doi: 10.1038/s41396-021-01004-x
Galloway, J. N., Bleeker, A., and Erisman, J. W. (2021). The human creation and use of reactive nitrogen: a global and regional perspective. Annu. Rev. Environ. Resour. 46, 255–288. doi: 10.1146/annurev-environ-012420-045120
Galloway, J. N., Dentener, F. J., Capone, D. G., Boyer, E. W., Howarth, R. W., Seitzinger, S. P., et al. (2004). Nitrogen cycles: past, present, and future. Biogeochemistry 70, 153–226. doi: 10.1007/s10533-004-0370-0
Garcia-Montiel, D. C., Melillo, J. M., Steudler, P. A., Cerri, C. C., and Piccolo, M. C. (2003). Carbon limitations to nitrous oxide emissions in a humid tropical forest of the Brazilian Amazon. Biol. Fertil. Soils 38, 267–272. doi: 10.1007/s00374-003-0637-y
Ge, Y., Heal, M. R., Stevenson, D. S., Wind, P., and Vieno, M. (2021). Evaluation of global EMEP MSC-W (rv4.34) WRF (v3.9.1.1) model surface concentrations and wet deposition of reactive N and S with measurements. Geosci. Model Dev. 14, 7021–7046. doi: 10.5194/gmd-14-7021-2021
Geekiyanage, N., and Vithanage, M. (2015). State of the environment, environmental challenges and governance in Sri Lanka. Environmental Challenges and Governance. London: Routledge.
Guenet, B., Gabrielle, B., Chenu, C., Arrouays, D., Balesdent, J., Bernoux, M., et al. (2021). Can N2O emissions offset the benefits from soil organic carbon storage? Glob. Chang. Biol. 27, 237–256. doi: 10.1111/gcb.15342
Hall, S. J., Reyes, L., Huang, W., and Homyak, P. M. (2018). Wet spots as hotspots: moisture responses of nitric and nitrous oxide emissions from poorly drained agricultural soils. J. Geophys. Res. Biogeo. 123, 3589–3602. doi: 10.1029/2018JG004629
Hink, L., Gubry-Rangin, C., Nicol, G. W., and Prosser, J. I. (2018). The consequences of niche and physiological differentiation of archaeal and bacterial ammonia oxidisers for nitrous oxide emissions. ISME J. 12, 1084–1093. doi: 10.1038/s41396-017-0025-5
Hink, L., Nicol, G. W., and Prosser, J. I. (2017). Archaea produce lower yields of N2O than bacteria during aerobic ammonia oxidation in soil. Environ. Microbiol. 19, 4829–4837. doi: 10.1111/1462-2920.13282
IPCC (2019). Chapter 11: N2O emissions from managed soils and CO2 emissions from lime and urea application, 2019 refinement to the 2006 IPCC guidelines for National Greenhouse gas Inventories. IPCC 2, 5–13. doi: 10.21513/0207-2564-2019-2-05-13
IPCC. (2023). The Earth’s energy budget, climate feedbacks and climate sensitivity, in: Climate change 2021 – The physical science basis: Working group I contribution to the sixth assessment report of the intergovernmental panel on climate change. Cambridge University Press, Cambridge, pp. 923–1054.
Kanter, D. R., Chodos, O., Nordland, O., Rutigliano, M., and Winiwarter, W. (2020). Gaps and opportunities in nitrogen pollution policies around the world. Nat. Sustain. 3, 956–963. doi: 10.1038/s41893-020-0577-7
Lassaletta, L., Billen, G., Garnier, J., Bouwman, L., Velazquez, E., Mueller, N. D., et al. (2016). Nitrogen use in the global food system: past trends and future trajectories of agronomic performance, pollution, trade, and dietary demand. Environ. Res. Lett. 11:095007. doi: 10.1088/1748-9326/11/9/095007
Leeson, S. R., Levy, P. E., van Dijk, N., Drewer, J., Robinson, S., Jones, M. R., et al. (2017). Nitrous oxide emissions from a peatbog after 13 years of experimental nitrogen deposition. Biogeosciences 14, 5753–5764. doi: 10.5194/bg-14-5753-2017
Lehnert, N., Musselman, B. W., and Seefeldt, L. C. (2021). Grand challenges in the nitrogen cycle. Chem. Soc. Rev. 50, 3640–3646. doi: 10.1039/D0CS00923G
Levy, P., Van Dijk, N., Gray, A., Sutton, M., Jones, M., Leeson, S., et al. (2019). Response of a peat bog vegetation community to long-term experimental addition of nitrogen. J. Ecol. 107, 1167–1186. doi: 10.1111/1365-2745.13107
Li, S., He, F., Liu, X., and Hua, L. (2023). Historical land use reconstruction for South Asia: current understanding, challenges, and solutions. Earth Sci. Rev. 238:104350. doi: 10.1016/j.earscirev.2023.104350
Li, B.-B., Roley, S. S., Duncan, D. S., Guo, J., Quensen, J. F., Yu, H.-Q., et al. (2021). Long-term excess nitrogen fertilizer increases sensitivity of soil microbial community to seasonal change revealed by ecological network and metagenome analyses. Soil Biol. Biochem. 160:108349. doi: 10.1016/j.soilbio.2021.108349
Li, L., Zheng, Z., Wang, W., Biederman, J. A., Xu, X., Ran, Q., et al. (2020). Terrestrial N2O emissions and related functional genes under climate change: a global meta-analysis. Glob. Chang. Biol. 26, 931–943. doi: 10.1111/gcb.14847
Liu, L., Xu, W., Lu, X., Zhong, B., Guo, Y., Lu, X., et al. (2022). Exploring global changes in agricultural ammonia emissions and their contribution to nitrogen deposition since 1980. Proc. Natl. Acad. Sci. 119:e2121998119. doi: 10.1073/pnas.2121998119
Liu, X., Zhang, Y., Ren, X., Shen, C., Wang, F., and Wu, D. (2021). Influences of nitrogen forms on abundances and community structures of ammonia and nitrite oxidizers in a slightly alkaline upland soil. Arch. Agron. Soil Sci. 67, 152–165. doi: 10.1080/03650340.2020.1718113
Liyanage, A., Grace, P. R., Scheer, C., de Rosa, D., Ranwala, S., and Rowlings, D. W. (2020). Carbon limits non-linear response of nitrous oxide (N2O) to increasing N inputs in a highly-weathered tropical soil in Sri Lanka. Agric. Ecosyst. Environ. 292:106808. doi: 10.1016/j.agee.2019.106808
Lugato, E., Leip, A., and Jones, A. (2018). Mitigation potential of soil carbon management overestimated by neglecting N2O emissions. Nature Clim. Change 8, 219–223. doi: 10.1038/s41558-018-0087-z
Malhi, Y., and Wright, J. (2004). Spatial patterns and recent trends in the climate of tropical rainforest regions. Philos. Trans. R. Soc. Lond. Ser. B Biol. Sci. 359, 311–329. doi: 10.1098/rstb.2003.1433
Malik, A., Oita, A., Shaw, E., Li, M., Ninpanit, P., Nandel, V., et al. (2022). Drivers of global nitrogen emissions. Environ. Res. Lett. 17:015006. doi: 10.1088/1748-9326/ac413c
Mapa, R. B.. (2020). The soils of Sri Lanka, world soils book series. New York: Springer International Publishing.
Morley, N., and Baggs, E. M. (2010). Carbon and oxygen controls on N2O and N2 production during nitrate reduction. Soil Biol. Biochem. 42, 1864–1871. doi: 10.1016/j.soilbio.2010.07.008
Morley, N. J., Richardson, D. J., and Baggs, E. M. (2014). Substrate induced denitrification over or under estimates shifts in soil N2/N2O ratios. PLoS One 9:e108144. doi: 10.1371/journal.pone.0108144
Neal, A. L., Barrat, H. A., Bacq-Lebreuil, A., Qin, Y., Zhang, X., Takahashi, T., et al. (2023). Arable soil nitrogen dynamics reflect organic inputs via the extended composite phenotype. Nat. Food. 4, 51–60. doi: 10.1038/s43016-022-00671-z
Nemitz, E., Mammarella, I., Ibrom, A., Aurela, M., Burba, G. G., Dengel, S., et al. (2018). Standardisation of eddy-covariance flux measurements of methane and nitrous oxide. Int. Agrophys. 32, 517–549. doi: 10.1515/intag-2017-0042
Pilegaard, K. (2013). Processes regulating nitric oxide emissions from soils. Philos. Trans. R. Soc. Lond. Ser. B Biol. Sci. 368:20130126. doi: 10.1098/rstb.2013.0126
Pilegaard, K., Skiba, U., Ambus, P., Beier, C., Brüggemann, N., Butterbach-Bahl, K., et al. (2006). Factors controlling regional differences in forest soil emission of nitrogen oxides (NO and N2O). Biogeosciences 3, 651–661. doi: 10.5194/bg-3-651-2006
Pushpakumari, G. G. P. (2021). Sri Lanka agricultural statistics (no. XVIII). Peradeniya. University of Peradeniya.
Raza, S., Zhou, J., Aziz, T., Afzal, M. R., Ahmed, M., Javaid, S., et al. (2018). Piling up reactive nitrogen and declining nitrogen use efficiency in Pakistan: a challenge not challenged (1961–2013). Environ. Res. Lett. 13:034012. doi: 10.1088/1748-9326/aaa9c5
Reay, D. S., Davidson, E. A., Smith, K. A., Smith, P., Melillo, J. M., Dentener, F., et al. (2012). Global agriculture and nitrous oxide emissions. Nat. Clim. Chang. 2, 410–416. doi: 10.1038/nclimate1458
Sanchez-Martín, L., Vallejo, A., Dick, J., and Skiba, M. (2008). The influence of soluble carbon and fertilizer nitrogen on nitric oxide and nitrous oxide emissions from two contrasting agricultural soils. Soil Biol. Biochem. 40, 142–151. doi: 10.1016/j.soilbio.2007.07.016
Schindlbacher, A., Zechmeister-Boltenstern, S., and Butterbach-Bahl, K. (2004). Effects of soil moisture and temperature on NO, NO2, and N2O emissions from European forest soils. J. Geophys. Res. Atmos. 109:4590. doi: 10.1029/2004JD004590
Seinfeld, J. H., and Pandis, S. N. (2016). Atmospheric chemistry and physics: From air pollution to climate change 3rd Edn. John Wiley & Sons: Hoboken, NJ.
Sheppard, L. J., Leith, I. D., Mizunuma, T., Leeson, S., Kivimaki, S., Neil Cape, J., et al. (2014). Inertia in an ombrotrophic bog ecosystem in response to 9 years’ realistic perturbation by wet deposition of nitrogen, separated by form. Glob. Chang. Biol. 20, 566–580. doi: 10.1111/gcb.12357
Song, L., Drewer, J., Zhu, B., Zhou, M., Cowan, N., Levy, P., et al. (2020). The impact of atmospheric N deposition and N fertilizer type on soil nitric oxide and nitrous oxide fluxes from agricultural and forest Eutric Regosols. Biol. Fertil. Soils 56, 1077–1090. doi: 10.1007/s00374-020-01485-6
Sutton, M. A., Pitcairn, C. E. R., and Fowler, D. (1993). “The exchange of Ammonia between the atmosphere and plant communities” in Advances in ecological research. eds. M. Begon and A. H. Fitter (Cambridge, MA: Academic Press), 301–393.
Targulian, V. O., and Bronnikova, M. A. (2019). Soil memory: theoretical basics of the concept, its current state, and prospects for development. Eurasian Soil Sci. 52, 229–243. doi: 10.1134/S1064229319030116
The International “4 per 1000” Initiative. (2015). Why the "4 per 1000" Initiative: Soils for Food Security and Climate? Available at: https://4p1000.org/discover/?lang=en (Accessed September 12, 2023)
Tian, D., and Niu, S. (2015). A global analysis of soil acidification caused by nitrogen addition. Environ. Res. Lett. 10:024019. doi: 10.1088/1748-9326/10/2/024019
UNEP. (2019a). Frontiers 2018/19: emerging issues of environmental concern. Chapter 4: the nitrogen fix., Frontiers: emerging issues of environmental concern. Nairobi: United Nations environment Programme.
UNEP. (2019b). Colombo declaration on sustainable nitrogen management. Nairobi: United Nations environment Programme
van Groenigen, J. W., Huygens, D., Boeckx, P., Kuyper, T. W., Lubbers, I. M., Rütting, T., et al. (2015). The soil N cycle: new insights and key challenges. Soil 1, 235–256. doi: 10.5194/soil-1-235-2015
van Lent, J., Hergoualch, K., and Verchot, L. V. (2015). Reviews and syntheses: soil N2O and NO emissions from land use and land-use change in the tropics and subtropics: a meta-analysis. Biogeosciences 12, 7299–7313. doi: 10.5194/bg-12-7299-2015
Venterea, R. T., Groffman, P. M., Verchot, L. V., Magill, A. H., Aber, J. D., and Steudler, P. A. (2003). Nitrogen oxide gas emissions from temperate forest soils receiving long-term nitrogen inputs. Glob. Chang. Biol. 9, 346–357. doi: 10.1046/j.1365-2486.2003.00591.x
Vitousek, P. M. (1984). Litterfall, nutrient cycling, and nutrient limitation in tropical forests. Ecology 65, 285–298. doi: 10.2307/1939481
Wang, Y., Yao, Z., Pan, Z., Wang, R., Yan, G., Liu, C., et al. (2020). Tea-planted soils as global hotspots for N2O emissions from croplands. Environ. Res. Lett. 15:104018. doi: 10.1088/1748-9326/aba5b2
Weerahewa, J., Senaratne, A., and Babu, S. (2021). Reforming fertilizer import policies for sustainable intensification of agricultural Systems in Sri Lanka: Is there a policy failure? US’s Government Global Hunger and Food Security Initiative. Michigan State University.
Wilpiszeski, R. L., Aufrecht, J. A., Retterer, S. T., Sullivan, M. B., Graham, D. E., Pierce, E. M., et al. (2019). Soil aggregate microbial communities: towards understanding microbiome interactions at biologically relevant scales. Appl. Environ. Microbiol. 85:846. doi: 10.1128/AEM.00324-19
Wolf, K., Veldkamp, E., Homeier, J., and Martinson, G. O. (2011). Nitrogen availability links forest productivity, soil nitrous oxide and nitric oxide fluxes of a tropical montane forest in southern Ecuador. Glob. Biogeochem. Cycles 25:GB4009. doi: 10.1029/2010GB003876
Yang, A. L., Raghuram, N., Adhya, T. K., Porter, S. D., Panda, A. N., Kaushik, H., et al. (2022). Policies to combat nitrogen pollution in South Asia: gaps and opportunities. Environ. Res. Lett. 17:025007. doi: 10.1088/1748-9326/ac48b2
Yu, H., Han, X., Zhang, X., Meng, X., Yue, Z., Liu, X., et al. (2023). Fertilizer-induced N2O and NO emissions in tea gardens and the main controlling factors: a recent three-decade data synthesis. Sci. Total Environ. 871:162054. doi: 10.1016/j.scitotenv.2023.162054
Yu, K., van den Hoogen, J., Wang, Z., Averill, C., Routh, D., Smith, G. R., et al. (2022). The biogeography of relative abundance of soil fungi versus bacteria in surface topsoil. Earth System Sci. Data 14, 4339–4350. doi: 10.5194/essd-14-4339-2022
Keywords: greenhouse gases, nitrogen deposition, ammonium, tropics, land use, Sri Lanka
Citation: Toteva GY, Reay D, Jones MR, Cowan N, Deshpande A, Weerakoon B, Nissanka S and Drewer J (2024) Nitrous oxide and nitric oxide fluxes differ from tea plantation and tropical forest soils after nitrogen addition. Front. For. Glob. Change. 7:1335775. doi: 10.3389/ffgc.2024.1335775
Edited by:
Tobias Rütting, University of Gothenburg, SwedenReviewed by:
Teodora Todorcic Vekic, Norwegian Institute of Bioeconomy Research (NIBIO), NorwayJinyang Wang, Nanjing Agricultural University, China
Copyright © 2024 Toteva, Reay, Jones, Cowan, Deshpande, Weerakoon, Nissanka and Drewer. This is an open-access article distributed under the terms of the Creative Commons Attribution License (CC BY). The use, distribution or reproduction in other forums is permitted, provided the original author(s) and the copyright owner(s) are credited and that the original publication in this journal is cited, in accordance with accepted academic practice. No use, distribution or reproduction is permitted which does not comply with these terms.
*Correspondence: Julia Drewer, juew@ceh.ac.uk