Modeling decline of mountain range forest using survival analysis
 Thakur Dhakal
 Ki Hwan Cho
 Su-Jin Kim
 Mu-Sup Beon4
- 1Department of Life Science, Yeungnam University, Gyeongsan, Republic of Korea
- 2Institute of Natural Science, Yeungnam University, Gyeongsan, Republic of Korea
- 3Division of Forest Ecology, National Institute of Forest Science, Seoul, Republic of Korea
- 4Department of Landscape Architecture, Jeonbuk National University, Jeonju, Republic of Korea
Deforestation is a global issue; however, each deforestation phenomenon occurs within its own local context. Elucidating this context in detail is important to prevent deforestation and maintain sustainable ecosystem management. In this study, we analyzed the land cover changes, forest characteristics, and modeled the forest decline over the last two decades to reveal the pattern and affecting factors of deforestation in the Honam-Jeongmaek mountain range. Forests less than 50-years-old dominate the study area, indicating they were mainly regenerated after the 1970s. Reforestation policies such as planting trees have helped forest regeneration. In the study region, as deforestation occurred, agricultural and residential areas decreased, and barren and grassland increased. We applied the Weibull regression model to determine forest survivorship and covariates. The deforestation risks are significantly different among regions; protected areas lose less forest than non-protected areas but the losses in protected areas were also significant, with approximately 5% from 2000 to 2020. Areas of higher elevation and steep slopes experience less deforestation, whereas areas closer to the mountain ridge are at greater risk. With survival analysis, it is possible to assess the risk of deforestation quantitatively and predict long-term survival of forests. The findings and methods of this study could contribute to better forest management and policymaking.
1. Introduction
Deforestation has been a global issue for decades (Morton et al., 2006; Hosonuma et al., 2012; Yao et al., 2014; Barlow et al., 2016; Sandker et al., 2017). According to the Food and Agriculture Organization (FAO), the world had lost 178 million ha of forest since 1990, with a net loss rate of 4.7 million ha per year between 2010 and 2020 (FAO, 2020). The major causes of deforestation include, industrial agriculture, increasing cattle numbers, timber logging, mining, city expansion and infrastructure, forest fires, paper production, and climate change (Adams et al., 2012; Mon et al., 2012; López-Carr, 2021). Although deforestation is a global phenomenon, the specific patterns in which it occurs and its impact on socio-ecological relationships may vary by local context.
Forests in the Korean peninsula experienced severe depletion during the Korean war, but reforestation has been conducted since the 1960s in South Korea (Kim and Zsuffa, 1994; Park and Lee, 2014; Allison, 2016; Choi et al., 2019). The tree growing stocks increased from 9.6 m3/ha in 1960 to 126.6 6 m3/ha in 2010. From 1953 to 2010, forest area in South Korea almost doubled, with a 13-fold increase in the density of trees (Buckingham and Hanson, 2015). Despite a very successful forest regeneration campaign, deforestation continued in some areas and the issue has been receiving more attention. The forest area in South Korea has decreased from 6,551,000 ha in 1990 to 6,287,000 ha in 2020 (FAO, 2020). The overall decreasing ratio is relatively low (4% of forest in 1990), but this ratio varies in different regions (Global Forest Watch, 2021).
Most of the natural forests in Korea are located in mountains; thus, owing to the lack of accessibility, mountain forests are less affected by anthropogenic activities and have continued to grow after regeneration. Mountain forests are an important ecosystem component that plays a key role as a refuge for vulnerable species (Chung et al., 2016, 2018) and an ecological corridor connecting various ecosystems (Choi, 2004; Cho et al., 2008; Hayes, 2010; Chung et al., 2016, 2018). The network of mountain ridgelines has been traditionally conceptualized in Korea and are called “Daegan” and “Jeongmack” (Choi, 2004). The traditional concept of “mountains do not cross water and water does not go over mountains,” has been passed down over hundreds of years and is widely accepted as an important geographic idea. The traditional geographic concept, which is aware of the importance of ridge networks, is similar to the modern concept of watersheds. Of note, the traditional concept emphasizes the continuity rather than the divide of watersheds. The mountain network of the Korea peninsular was composed of one main ridgeline, Daegan, Baekdu–Daegan, and several Jeongmacks. The concept has been adapted to the management of mountain ranges. The Baekdu–Daegan is the longest and highest mountain ridgeline range and is protected by a legislative act. Whereas Jeongmacks, a subsidiary of Beakdu–Daegan mountain ranges, are not well protected despite their importance to ecosystem functionality and socio-ecological linkage (Jang et al., 2008; Choi et al., 2014). Owing to the lack of protection laws, the forests on the Jeongmack mountain range are undergoing deforestation, especially around the villages near the ridgeline.
Deforestation monitoring is usually performed using remote sensing imagery (Greenberg et al., 2005; Songer et al., 2008; Sandker et al., 2017; Hadi et al., 2018). In a deforestation analysis study, it is common to create land cover/land use (LULC) maps using satellite images and compare the forest area of the LULC maps in two or more specific times (Sandker et al., 2017; Hadi et al., 2018). This approach quantifies the overall change in forest area; however, it has limitations in analyzing the trend of forest decline and predicting future decline (the time taken for a forest area to be reduced to a certain level).
The factors affecting deforestation have been analyzed using different models, including regression (Rosa et al., 2013; Pir Bavaghar, 2016), machine learning (Mayfield et al., 2020; Larrea-GallegosIan and Vázquez-Rowe, 2021), and survival analysis models (Vance and Geoghegan, 2002; Greenberg et al., 2005). Greenberg et al. (2005) used survival analysis to determine decreases in rainforest area; by using this method, it was not only possible to identify the factors affecting the deforestation rate but also quantify the accelerating deforestation rate. Vance and Geoghenan (2002) applied survival analysis to identify the factors that influence deforestation probability. Although survival analysis is recognized as a promising method to model and predict land cover change (An and Brown, 2008; Wang et al., 2013), it has not been frequently applied in deforestation research.
To date, studies on the temporal pattern of deforestation in South Korea are scarce. Research has mainly focused on the deforestation quantity and its spatial distribution (Jang et al., 2008; Yu et al., 2016). To help ecosystem management, answers to the following questions are essential: (1) how much forest area has been destroyed and how has the rate of deforestation changed over time? and (2) what factors affect deforestation? We believe that survival analysis is a useful statistical method to answer these questions. It models both the overall quantity and pattern change of deforestation over time. This study examined deforestation patterns and trends of the Honam–Jeongamaek mountain forest, which has long been the background of socio–ecological interactions.
2. Methods
2.1. Study area
The study area is the north part of Honam–Jeongmack mountain range, located in the southwestern part of the Korean peninsula (35° 36′ N, 128° 06′ E; Figure 1). One end of the mountain range is connected to the Baekdu–Daegan mountain range, the core ecological axis of the Korean Peninsula, and the other to the Naejangsan national park. The average temperature normals are 10.7 ~ 13.3 and precipitation total normals are 1329.8 ~ 1486.0 mm (Supplementary Table 1). The elevation range of the ridge line is between 166 meters and 1,230 meters above sea level. Among the broadleaf forests, oak forests are the most widespread, and among the coniferous forests, pine forests are the most widespread.
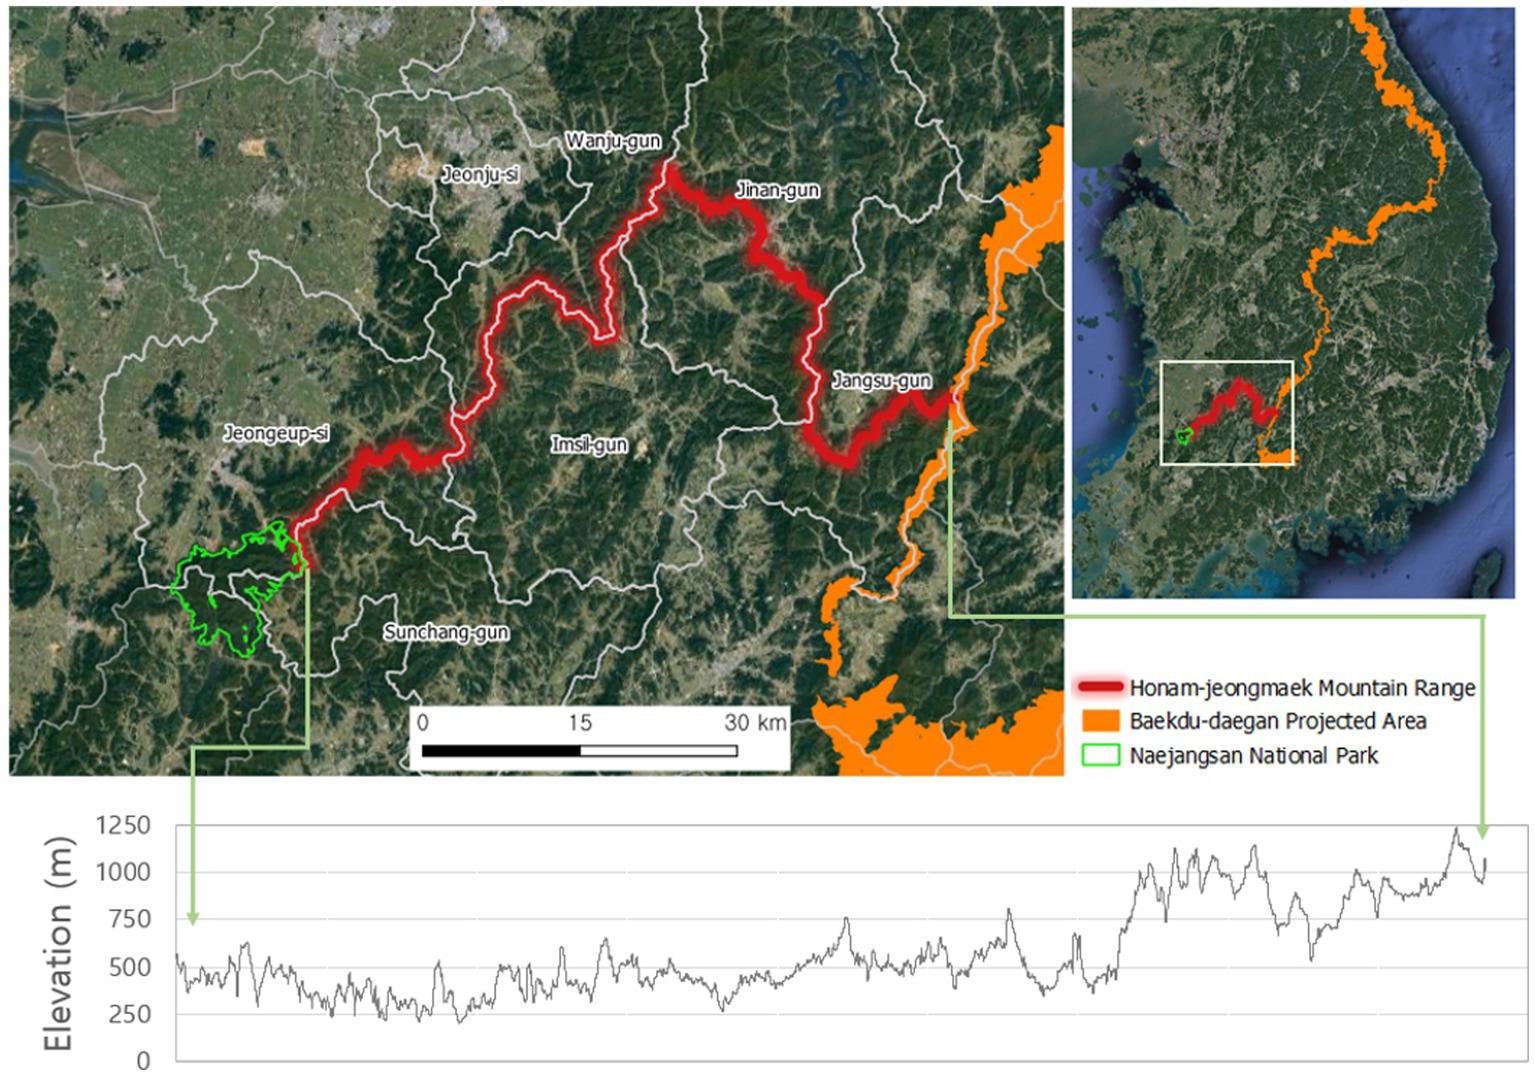
Figure 1. The ridgeline of Honam-Jeongmaek mountain range (red line) with elevation profile, and the Baekdu-Daegan protection area (orange area). Image data: Google.
The administrative boundaries of the mountain villages roughly coincide with the 3 km buffer zone on the ridge; therefore, the 3 km buffer zone area was analyzed. The mountain range spans six municipalities. The study area can be divided into three regions according to regional characteristics. The west region of the mountain range (Wangju-gun and Jeongup-si) is connected to a wide range of farmland. This region is also under pressure for development as a large city (Jeonju-si, with a population of 657,432). The northeast region (Jinan-gun and Jangsu-gun) is a typical mountainous area with high elevation. The southeast region is a mixture of mountainous and agricultural areas (Imsil-gun, Sunchang-gun, and Jeongeup-si) and the elevation of the mountain is relatively low compared to the northeast region. Jeongup-si encompasses two regions: the west and southeast regions divided by the ridgeline (Figure 1). Over the past 20 years, Wanju-gun and Jeongup-si have seen an increase in population, while other municipalities have seen a decrease (Supplementary Table 2).
2.2. Data
Global forest change (GFC) data (Hansen et al., 2013) was used for survival analysis because it provides deforestation information. The dataset provides global tree (taller than 5 m in height) cover in 2000, and indications of deforestation from 2000 to 2020 on an annual basis. For this study, the vegetated areas in GFC data are regarded as forests. The data was produced based on the multi-temporal Landsat imagery with a spatial resolution of 30 m. In the GFC data, forest loss was defined as a complete removal of canopy tree cover; forest degradation, such as selective removals, was not characterized as a change (Hansen et al., 2013).
Although GFC data can provide an approximation of forest loss (Galiatsatos et al., 2020), the uncertainties exist in the dataset (Galiatsatos et al., 2020; Shimizu et al., 2020). In addition to modeling long-term deforestation trends based on GFC data, we used quality-controlled land cover maps for detailed quantitative analysis of land cover change and forest type maps to characterize forests.
Land cover (LC) and forest type (FT) maps were used to identify the characteristics of the forest area. The LC maps are produced and distributed by the Ministry of Environment, South Korea. There are three different levels of LC types: level 1 consists of six LC types, namely, used (built-up) area, agricultural land, forest, grassland, wet land, barren, and water. Level 2 and 3 LC types provide more detailed classifications of land cover. Level 2 and 3 maps were used for analysis (Table 1), which have 22 and 41 LC types, respectively. For consistency, the level 2 LC classification (Supplementary Table 3) was used in the analysis. There are three forest types: broadleaf, coniferous, and mixed forests. Forest type maps are produced and provided by the Korea Forest Service. These maps provide detailed forest information on 42 tree types, decadal age classes, and stand density classes, and have been updated in the last decade. We used the FT map, published in 2015 and updated using aerial images from the early 2010s to identify characteristics of forest stand. Information of accuracy evaluation for each map is not provided, but there is a quality control condition that each map must have an overall accuracy of 95% or higher in order to be published (Environmental Spatial Information Service, 2023).
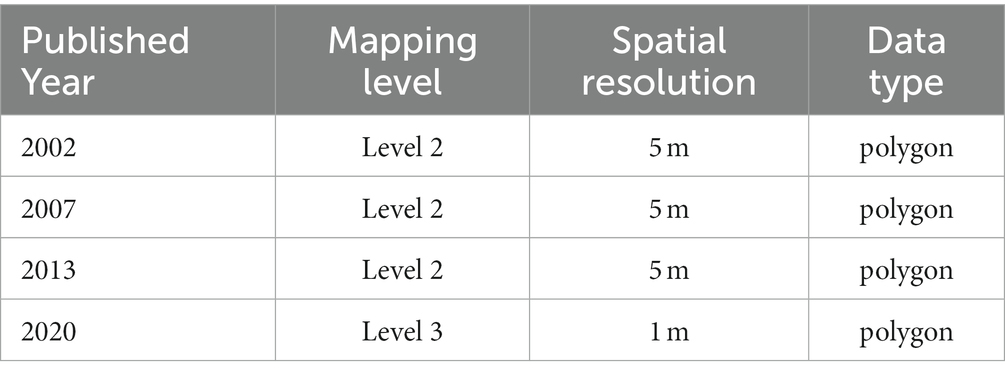
Table 1. Specification of used land cover maps.
The Advanced Land Observing Satellite (ALOS) World 3D-30 m (AW3D30) global digital surface model data (Tadono et al., 2016) was used to analyze topographic characteristics such as elevation and slope. The latitude and longitude coordinates were projected onto the Universal Transverse Mercator (UTM) coordinate system (EPSG: 32652). The maps had different projected coordinate systems that were reprojected using the UTM.
2.3. Survival analysis
Survival analysis accounts for the time when an event occurs in addition to the magnitude of that event. It is a useful tool to develop regression models that best fit the relationship between the time of deforestation and covariates. We applied the Weibull regression model for parametric survival analysis, which has advantages of estimating baseline hazard function and modeling the effects of covariates (Lee and Wang, 2003; Zhang, 2016). The parametric survival model is used to predict future trends. In the practical application of survival analysis, it is common to use log transformations for the distribution of time to an event (T), and the relationship between T and the covariates can be expressed as:
where β0,…, βp are the regression coefficients for corresponding covariates; x1,…, xp, σ is a scale parameter, and ε is the random disturbance term. The Weibull regression model assumes ε follows the Weibull distribution. The hazard function (the risk of event function, e.g., death or deforestation) at any moment in the Weibull regression model can be expressed with shape parameter λ as:
The baseline hazard is formulated as ℎ0(t) = λe−λβ0tλ−1. The Weibull regression model can be used to test the relative effect of covariates (hazard ratio) and the change of hazard over time (accelerated failure-time, AFT).
Survival analysis requires the information of start, end, and event times. As the GFC data recorded a deforestation event after 2000, the LC map published in 2002 was used for the base information of the forest at the start time. The LC map is usually created based on the images taken a few years ago; thus, we decided to set 2000 as the start time (year) to maintain consistency with the GFC data. Each raster pixel of the GFC data located in the forest area of the map was considered as an alive forest pixel. The event was defined as forest loss on the GFC data. If a forest pixel had no forest loss indication, it was considered that the forest remained intact until 2020. The intact forest is dealt as right-censored data. We estimated the effect of covariates on survival time based on the Weibull regression model. A total five covariates, two categorical variables, and three continuous variables were used (Table 2). The correlation coefficient between the elevation and slope was 0.29, the correlation coefficient between the elevation and the distance to ridgeline was −0.19, and the correlation coefficient between the slope and the distance to the ridgeline was −0.14 (Supplementary Table 3).
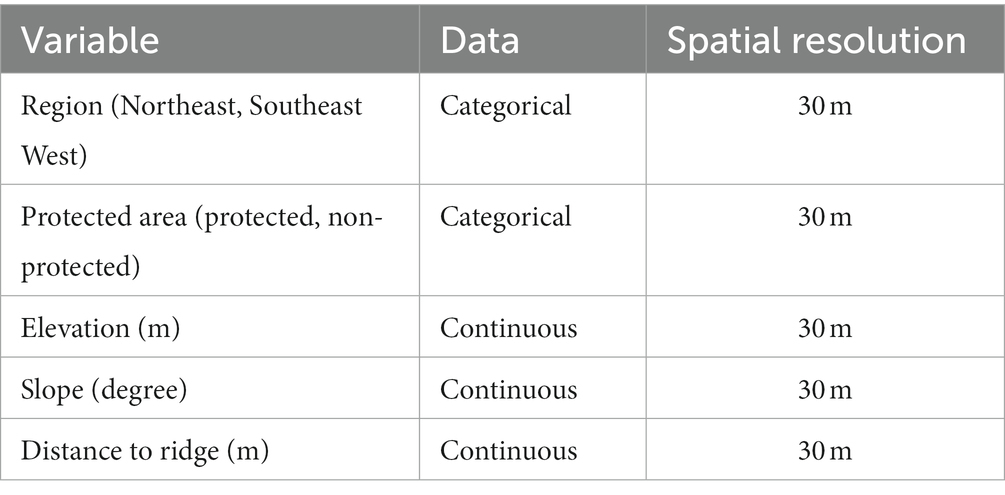
Table 2. Covariates used in the Weibull regression analysis.
2.4. Software
The quantum geographic information system (QGIS Development Team, 2023) was used for GIS data analysis, and R software (version 4.2.1; R Core Team, 2023) was used for statistical analysis. A Survival analysis was conducted using the “survival” package (version 3.2–10; Therneau and Grambsch, 2000).
3. Results
3.1. Land cover change
Land cover changes over the last two decades are listed in Table 3. The overall change of used (built-up) area was ~15–20 km2 (Table 2). But detailed LC change analysis revealed larger variation, residential area decreased from 10.3 km2 in 2002 LC map to 2.5 km2 in 2020 LC map, while transportation infrastructure area increased from 5.9 to 15.4 km2 during the same period. The grass and barren land types increased, and majority of the incensement was caused by anthropogenic activity. In the case of grass, the artificial grassland had an area of 77.3 km2 on the 2020 LC map, while natural meadow had an area of only 0.2 km2. Similarly, artificial barren land area was 17.0 km2, while natural barren land was 2.7 km2 on the 2020 LC map. The water area has been fluctuating around 22 km2. During the last two decades, the net decrease in forest area was 49.9 km2. Even in areas with new forests, owing to afforestation activities, the deforestation area increased. Among the areas that were forests on the 2002 LC map, a total forest area of 49.9 km2 was changed to other land cover types on the 2020 LC map. Most of the decreased area turned into grassland (45.7 km2), barren land (12.0 km2) and agricultural land (11.1 km2) on the 2020 LC map (Table 4). 83% of the new forest grew on agricultural land (12.7 km2) and grasslands (7.59km2; Table 4). The area of broadleaf, coniferous, and mixed forest was 386.5, 128.6, and 30.9 km2, respectively on the 2020 LC map.
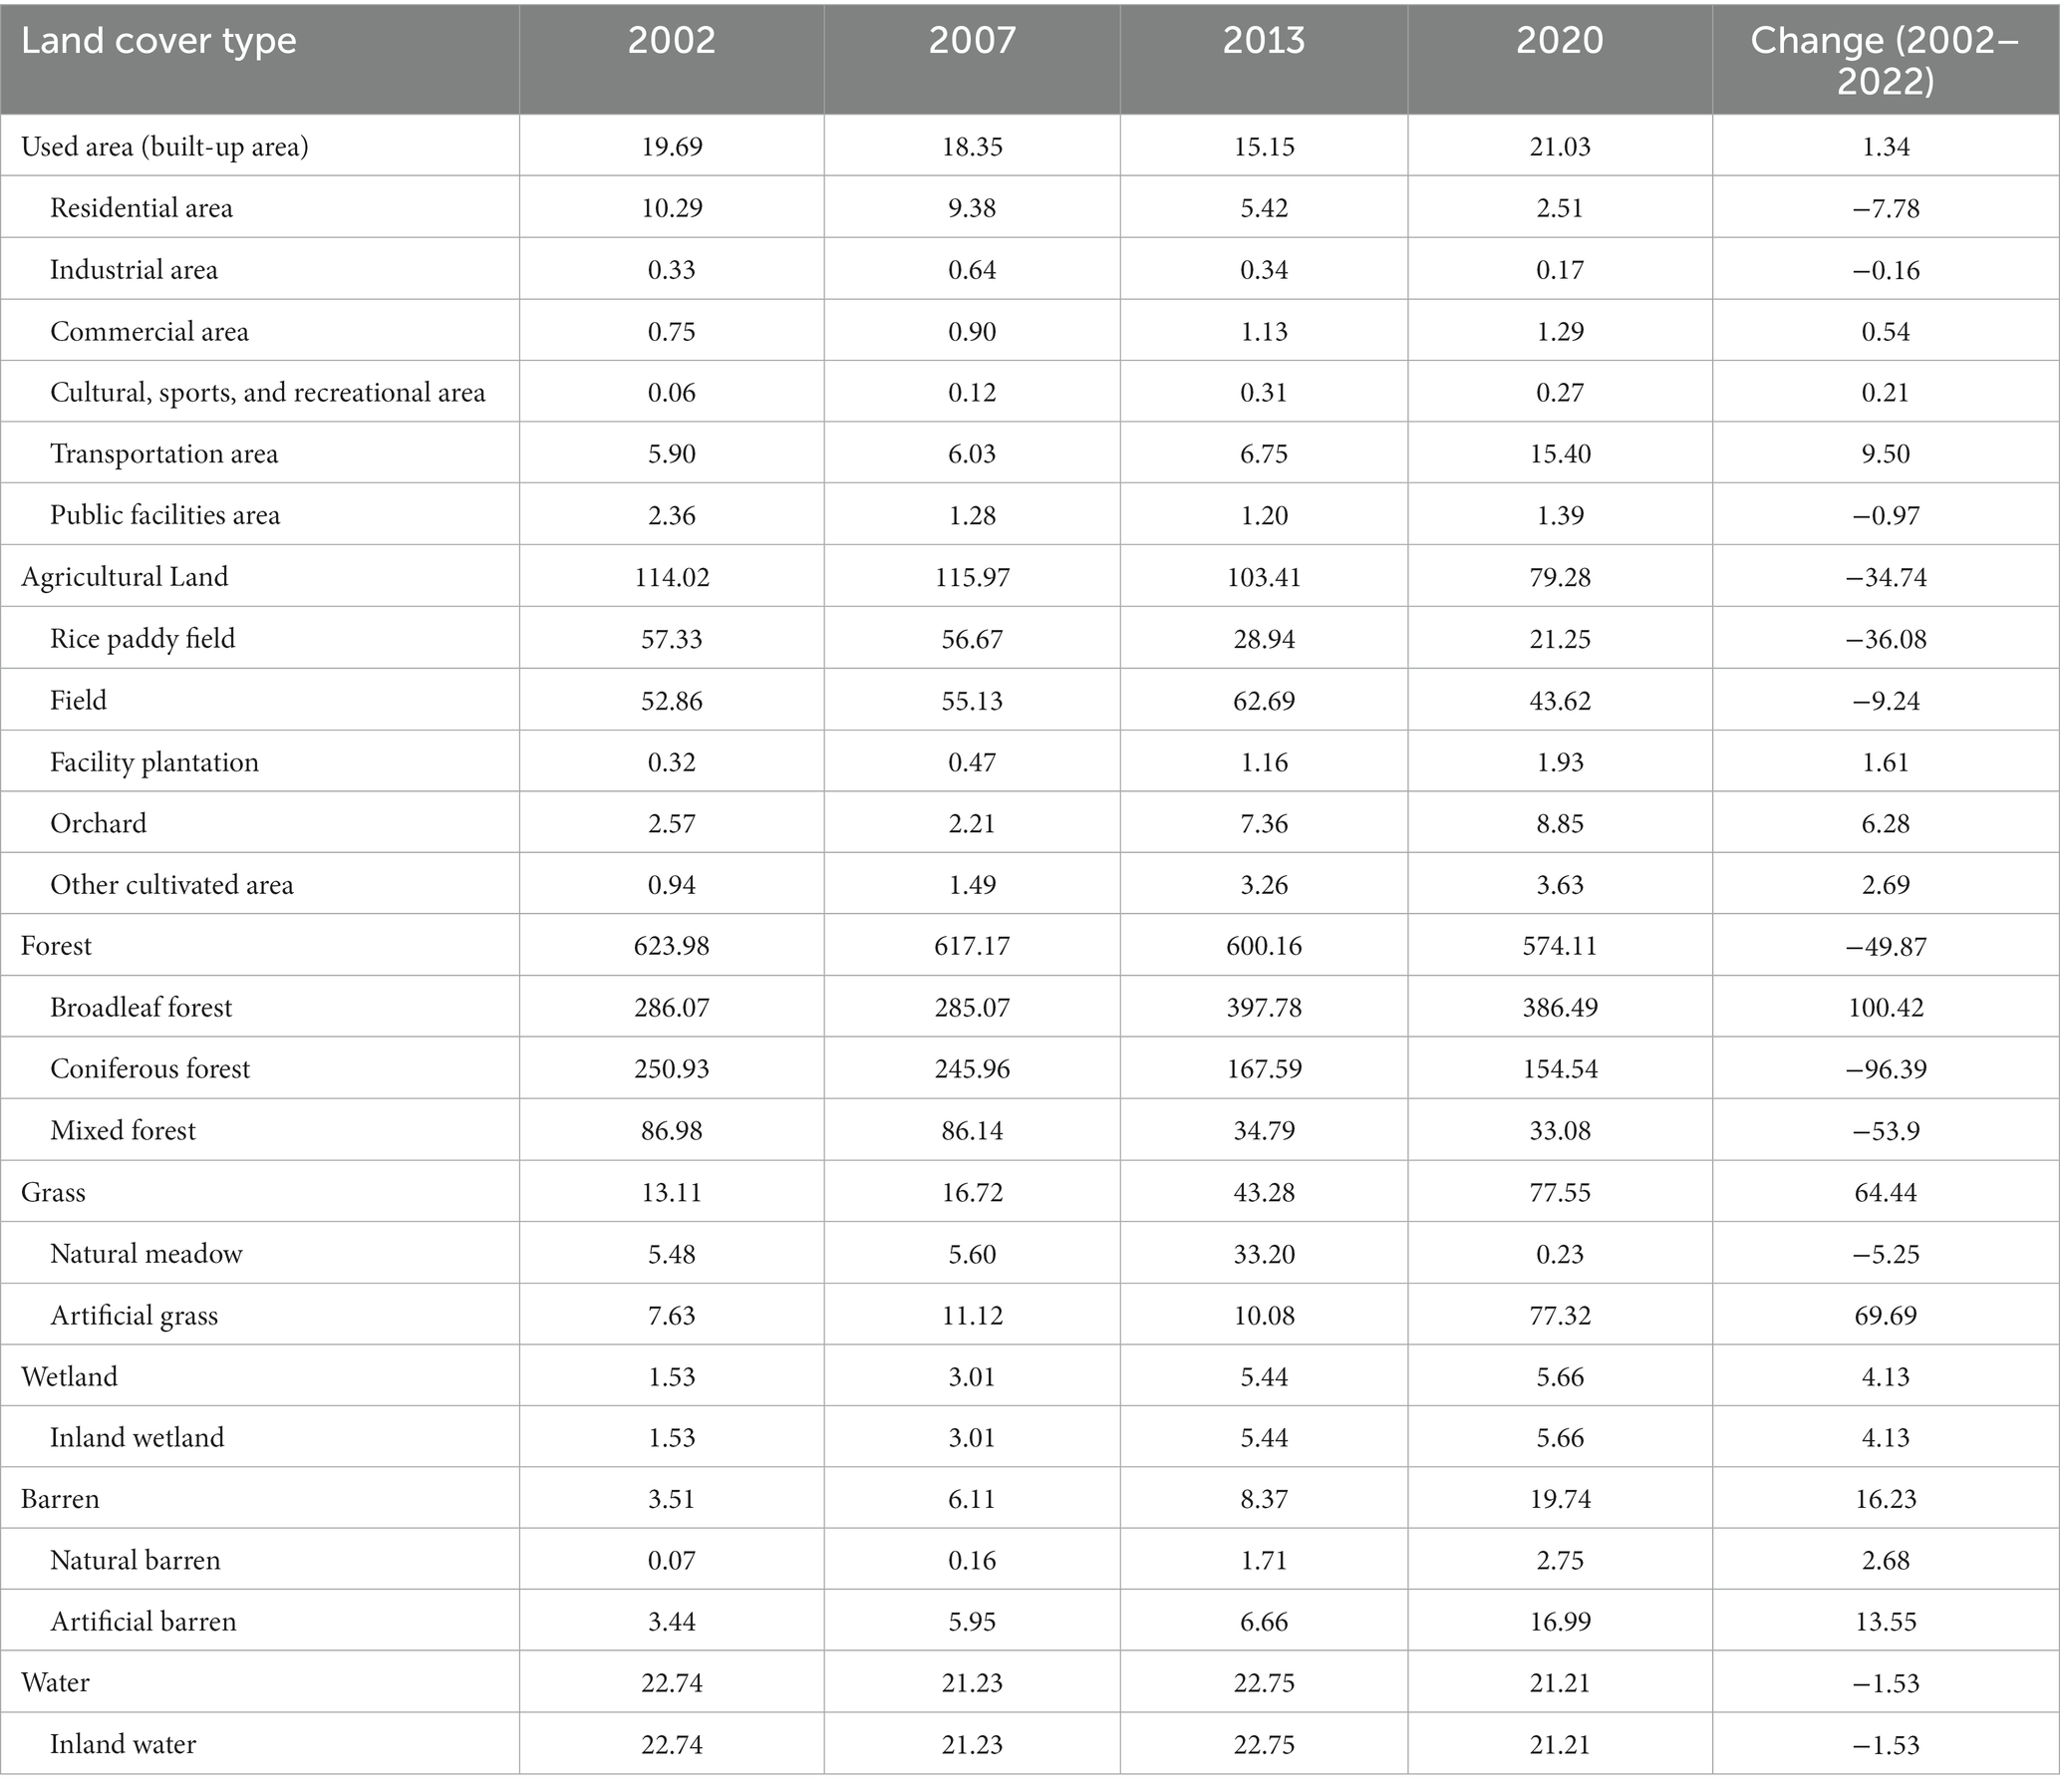
Table 3. Land cover area (km2).
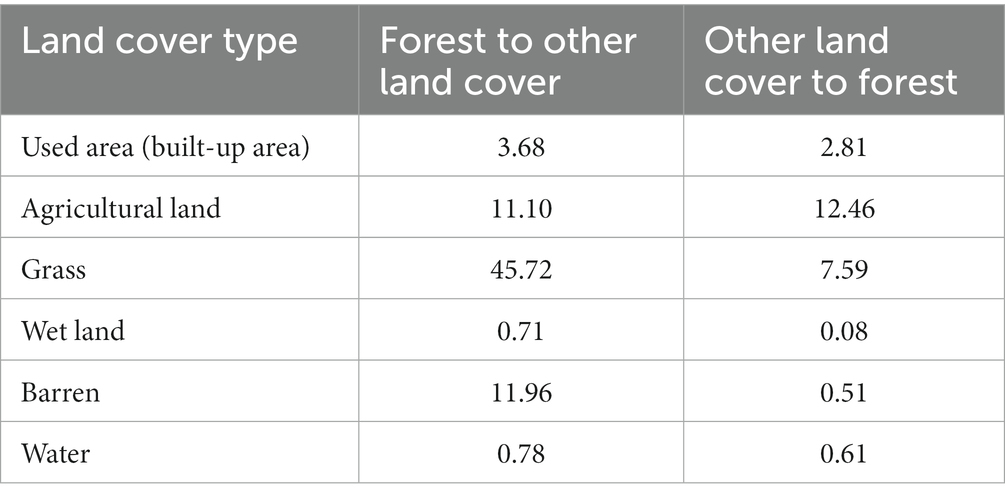
Table 4. Land cover change between forest and other land covers (2002–2020; km2).
The study area includes several types of protected areas, such as national parks, wildlife sanctuaries, and wetlands, among others. The forest area in the protected areas was 113.5 km2 on the 2002 LC map and 107.2 km2 on the 2020 LC map. The forest area in the non-protected areas was 510.5 km2 on the 2002 LC map and 446.9 km2 on the 2020 LC map.
3.2. Characteristics of forest
We calculated forest area by stand age class in the three regions (within the 3 km buffer from the ridgeline) based on the FT maps (Figures 2, 3). The majority of the forests belong to the stand age 31 to 40 years, implying that these forests were regenerated post the 1970s. The northeast region has the largest forest area but old forests (> 41 years) of the region are relatively small compared to that of other regions. The west region has the largest area of old forests. Pine tree covers the largest area of the coniferous forest. Among the pine tree forests, Pinus densiflora dominated forests are the largest (59.4 km2). The representative planted pine species occupying a large area are the larch (Larix kaempferi, 33.9 km2) and Rigida pine (Pinus rigida, 35.1 km2; Table 5). Oak tree (Quercus spp.) covers the largest area (216.5 km2) of the broadleaf forest, while tulip tree (Liriodendron tulipifera) covers the largest area (12.0 km2) among planted broadleaf trees. Young forests (< 20 years) are dominated by naturally regenerating oak or pine trees (Table 5).
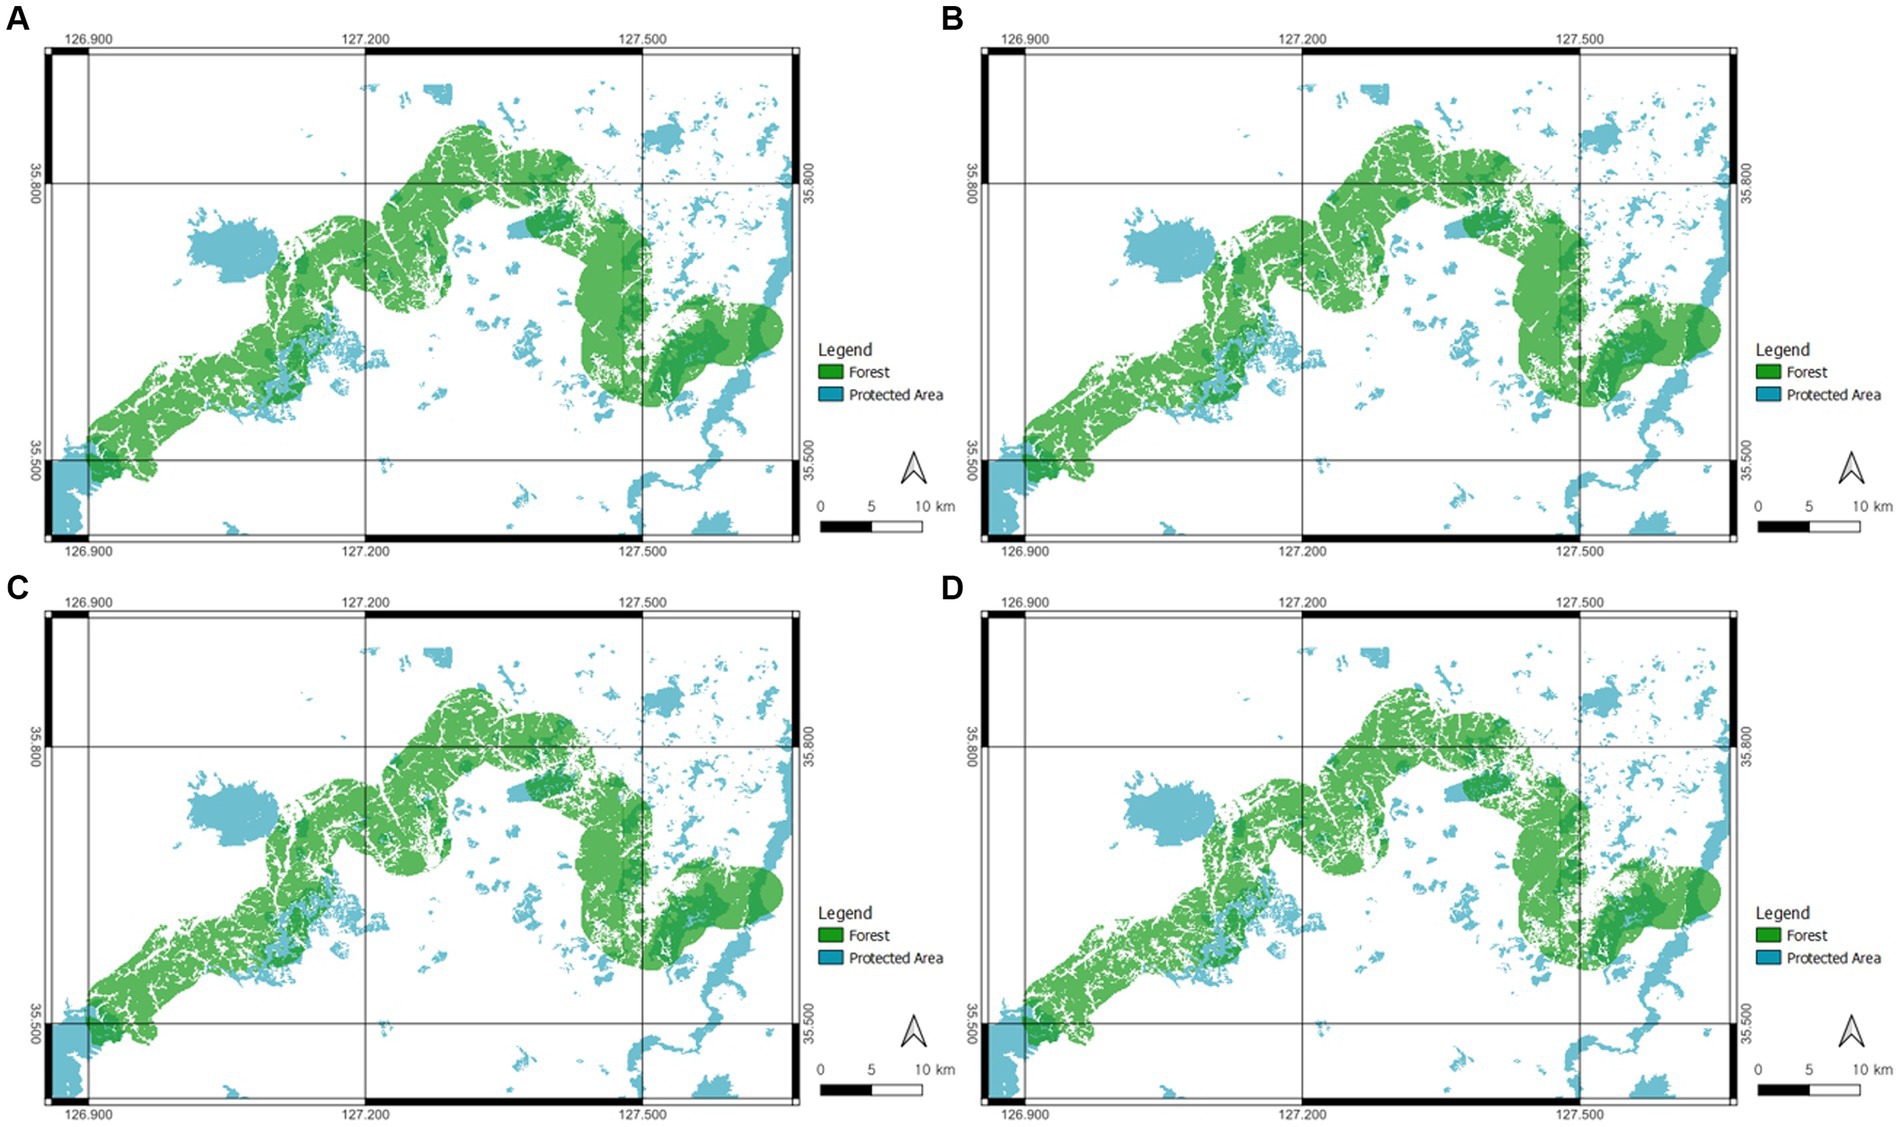
Figure 2. Forest in land cover maps within 3 km buffer of mountain ridge and protected area (blue, A) 2002, (B) 2007, (C) 2013 and (D) 2020.
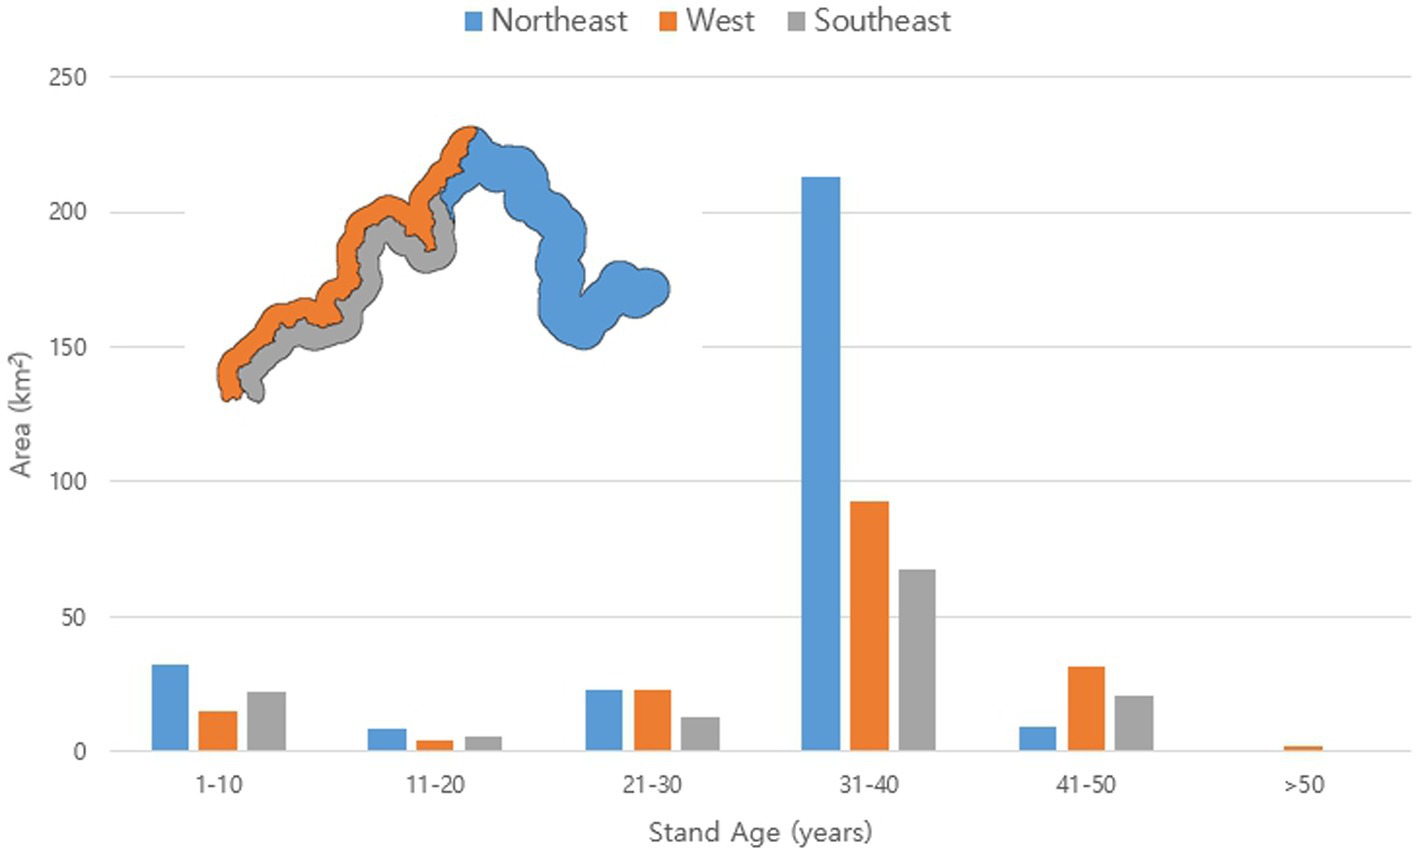
Figure 3. Forest areas by stand age of three regions.
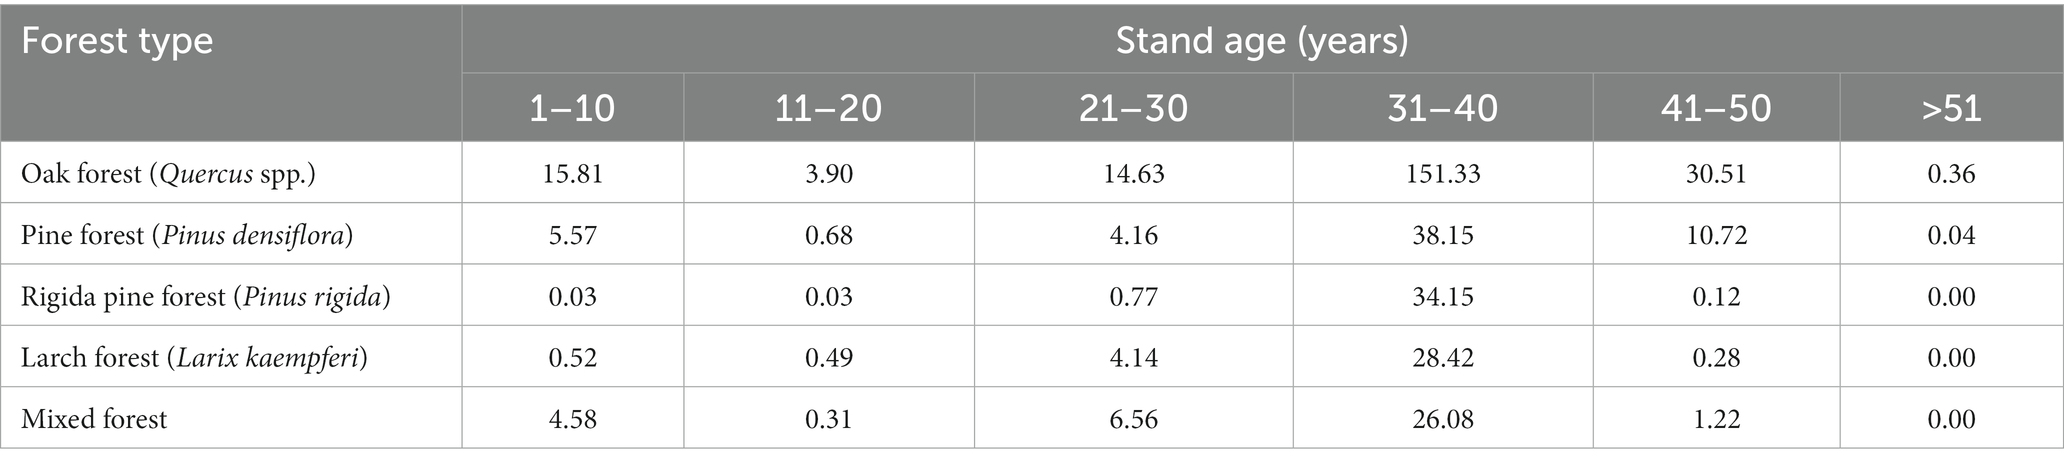
Table 5. Stand age and area (km2) of major forest types.
3.3. Survivorship of mountain forest
Hazard ratios (HRs) from the Weibull regression model for the deforestation event are listed in Table 6. The deforestation risk of the west and southeast regions is significantly lower than that of the northeast region (confidence intervals lower than 1). The west region had the lowest deforestation risk (Table 6). If the deforestation trends maintain the current trajectory, the amount of forest (LC map in 2002) in the northeast, west, and southeast regions will decrease by 75, 82.5, and 80%, respectively, by 2040 (Figure 4). The 95% confidence interval of the non-protected area is greater than 1 (Table 6), which means that the risk of deforestation in the non-protected area is significantly higher than that of the protected area. However, forests in the protected areas also undergo deforestation. The loss of forest in protected areas is predicted to reach 10% in 2035, and if unprotected, 20% in the same year. As elevation, slope, and distance to ridge increases, deforestation risk decreases (confidence intervals of the covariates are lower than 1). Figure 5 shows the survival curves of the unprotected forest areas by region. The forest areas in the south and southeast regions are predicted around 80% in 2040. In contrast, the forest areas in the northeast region will decrease by 72% in the same year if the current trend continues without policy changes to protect the forest.
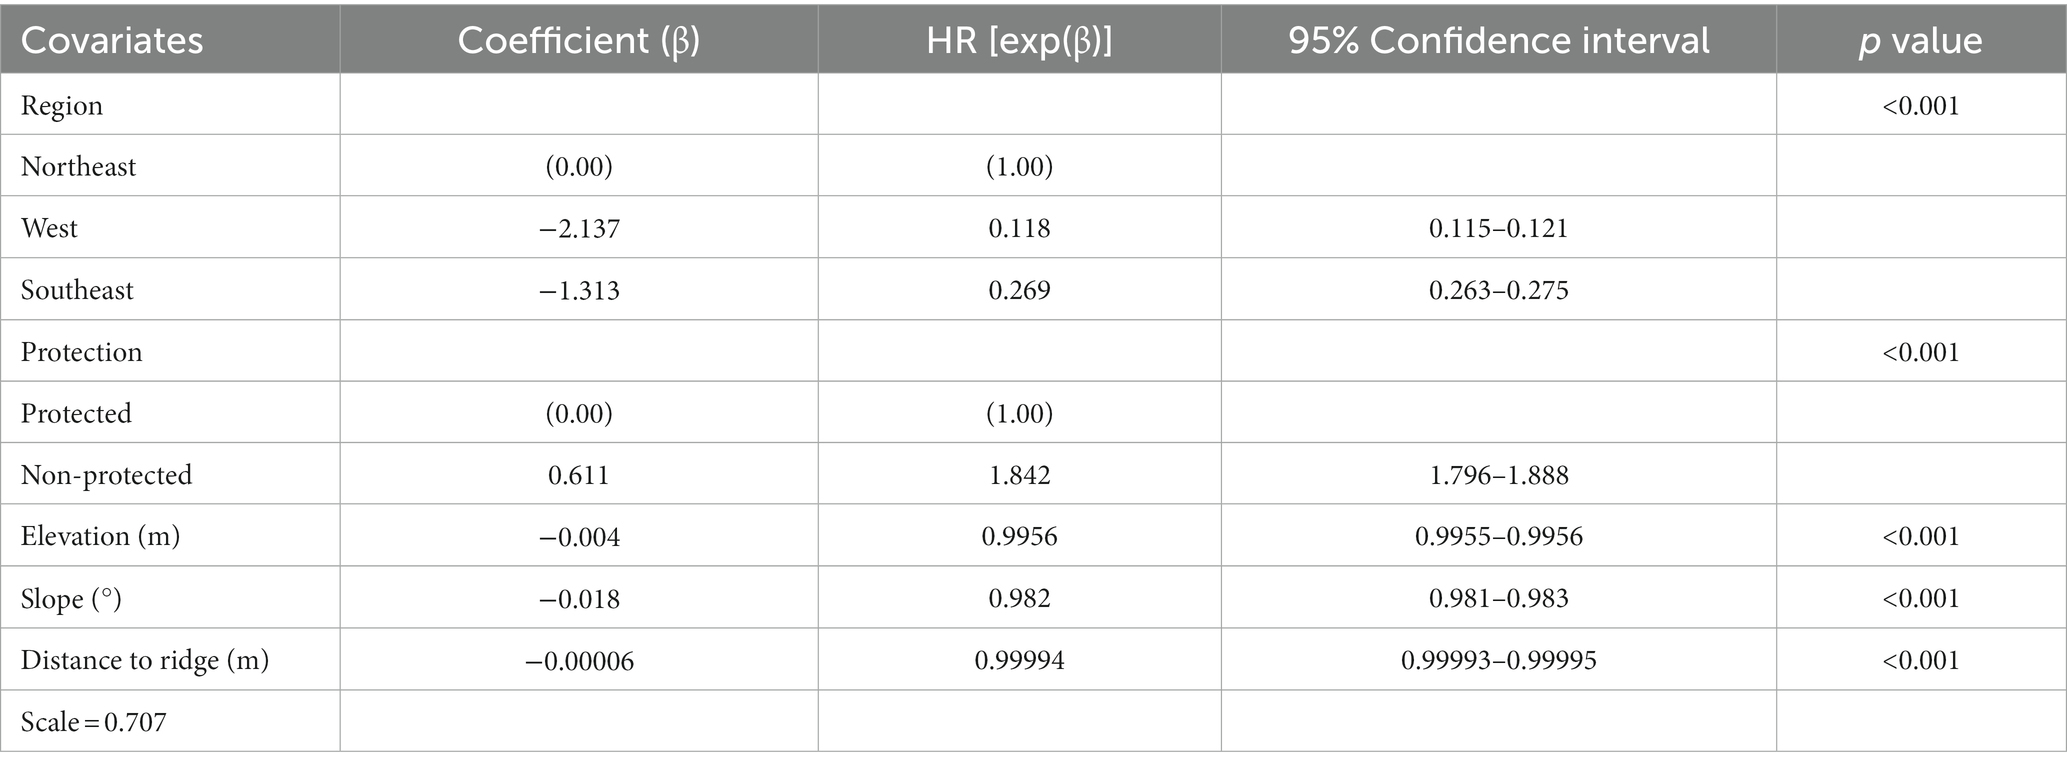
Table 6. Hazard ratios (HR) from the Weibull regression model for the deforestation dataset.
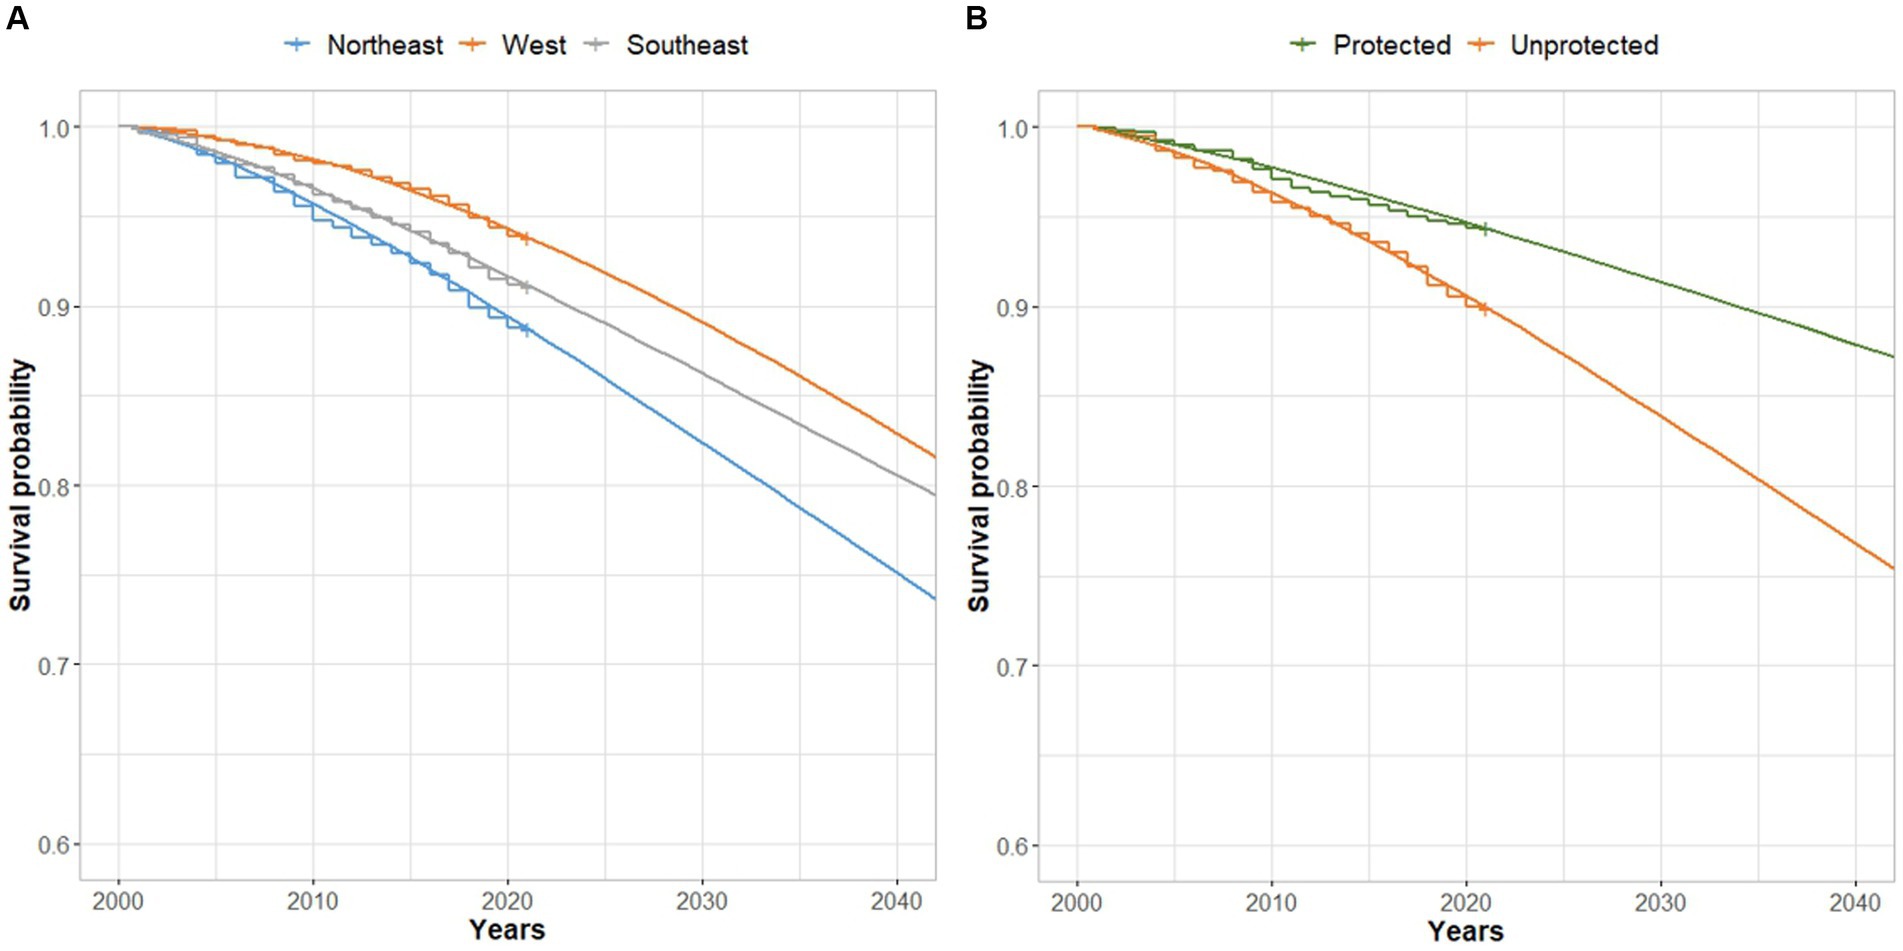
Figure 4. Predicted survival curves, based on a Weibull regression model, showing the effect of (A) regions and (B) protection area.
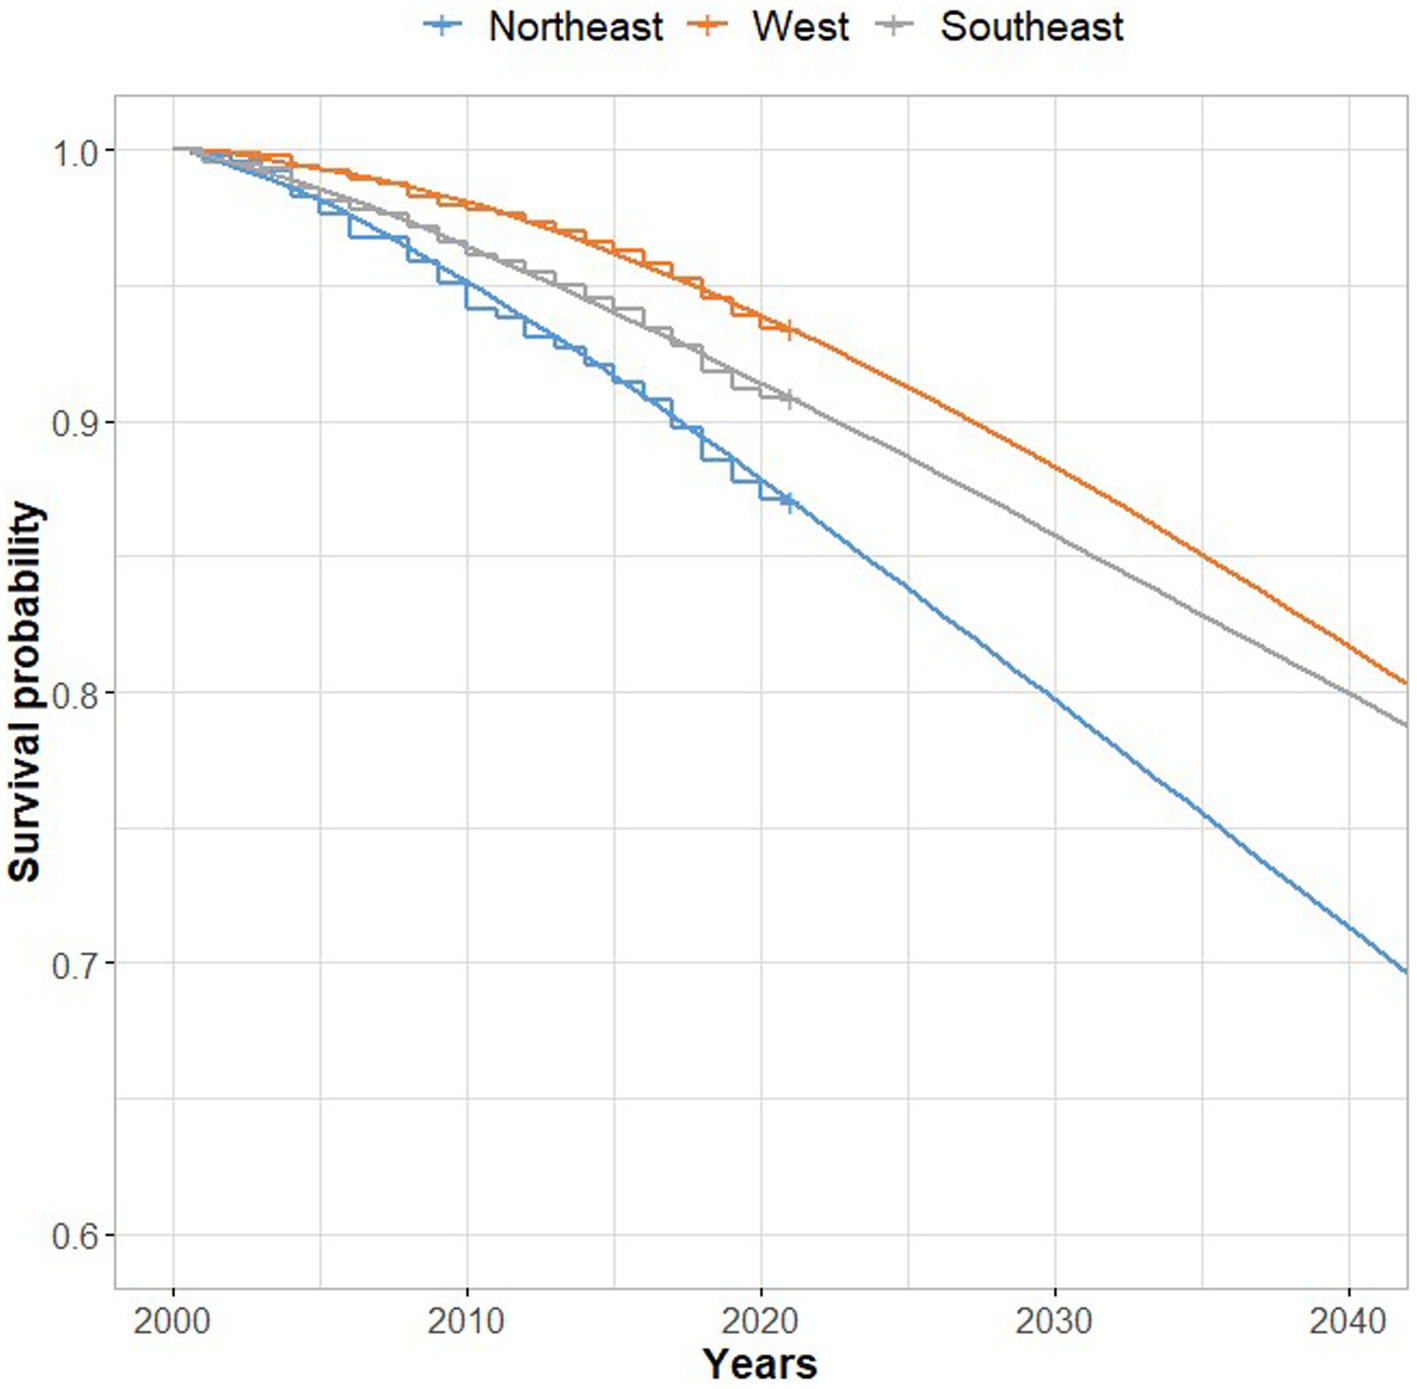
Figure 5. Predicted survival curves, based on a Weibull regression, showing the effect on regions of unprotected area.
4. Discussion
To understand the characteristics and regional context of deforestation, we conducted two different analyses that related to each other: first, we analyzed land cover change and forest characteristics using maps that are spatially accurate but cover discrete time periods (LC maps) or single period (FT map); second, we used temporally detailed GFC data to model trends in deforestation over time. This approach complements the weaknesses of both datasets, one lacking temporal detail and the other with relatively large uncertainties.
4.1. Land cover change
Urbanization and agricultural expansion have been acknowledged as major driving forces of deforestation (Greenberg et al., 2005; Morton et al., 2006; López-Carr, 2021). The FAO (2020) reported that agriculture has the biggest impact on deforestation (~ 80%), followed by construction (15%), and urbanization (~ 5%); however, the driving factors vary by country, geographic region, and era. Contrary to the results of previous studies, the decrease in forest in the study area occurred simultaneously with decreasing agricultural and residential areas. However, the net decreasing rate of agricultural lands is more rapid (−30%) than that of forest areas (−8%; Table 3). The net decreasing rate of residential areas is even more drastic; 10.3 km2 of the residential area on the 2002 LC map decreased to 2.5 km2 on the 2020 LC map (−75%). However, transportation infrastructure area increased by 2.6 times (from 5.9 to 15.4 km2). This suggests that deforestation may continue to increase even in rural areas with declining populations. Figure 6A shows a constructed road after deforestation in 2003. During the two decades, the areas of barren and grassland have shown a 5.9-and 5.6-fold increase, respectively (Table 3), while 86% of the barren land on the 2020 LC map is artificial. Part of the barren land area is a construction site that is temporarily barren. The grassland areas are more difficult to interpret. Some areas may be sites with grass growth on abandoned land, but some areas may be classified as grassland when seedlings are planted after logging (Figure 6B). The exchange of agricultural land and forest area is worth noting. The changed area from forests to agricultural lands is similar to the area changed from agricultural lands to forests (Table 4). But the conditions under which the change occurs are different: forests with suitable conditions for agriculture are changing to agricultural land. In contrast, the new forests are growing on agricultural land that is difficult to farm, i.e., abandoned farmland. This pattern of forest expansion is found in places where large-scale migration to urban areas takes place (Cervera et al., 2019; Ameztegui et al., 2021).
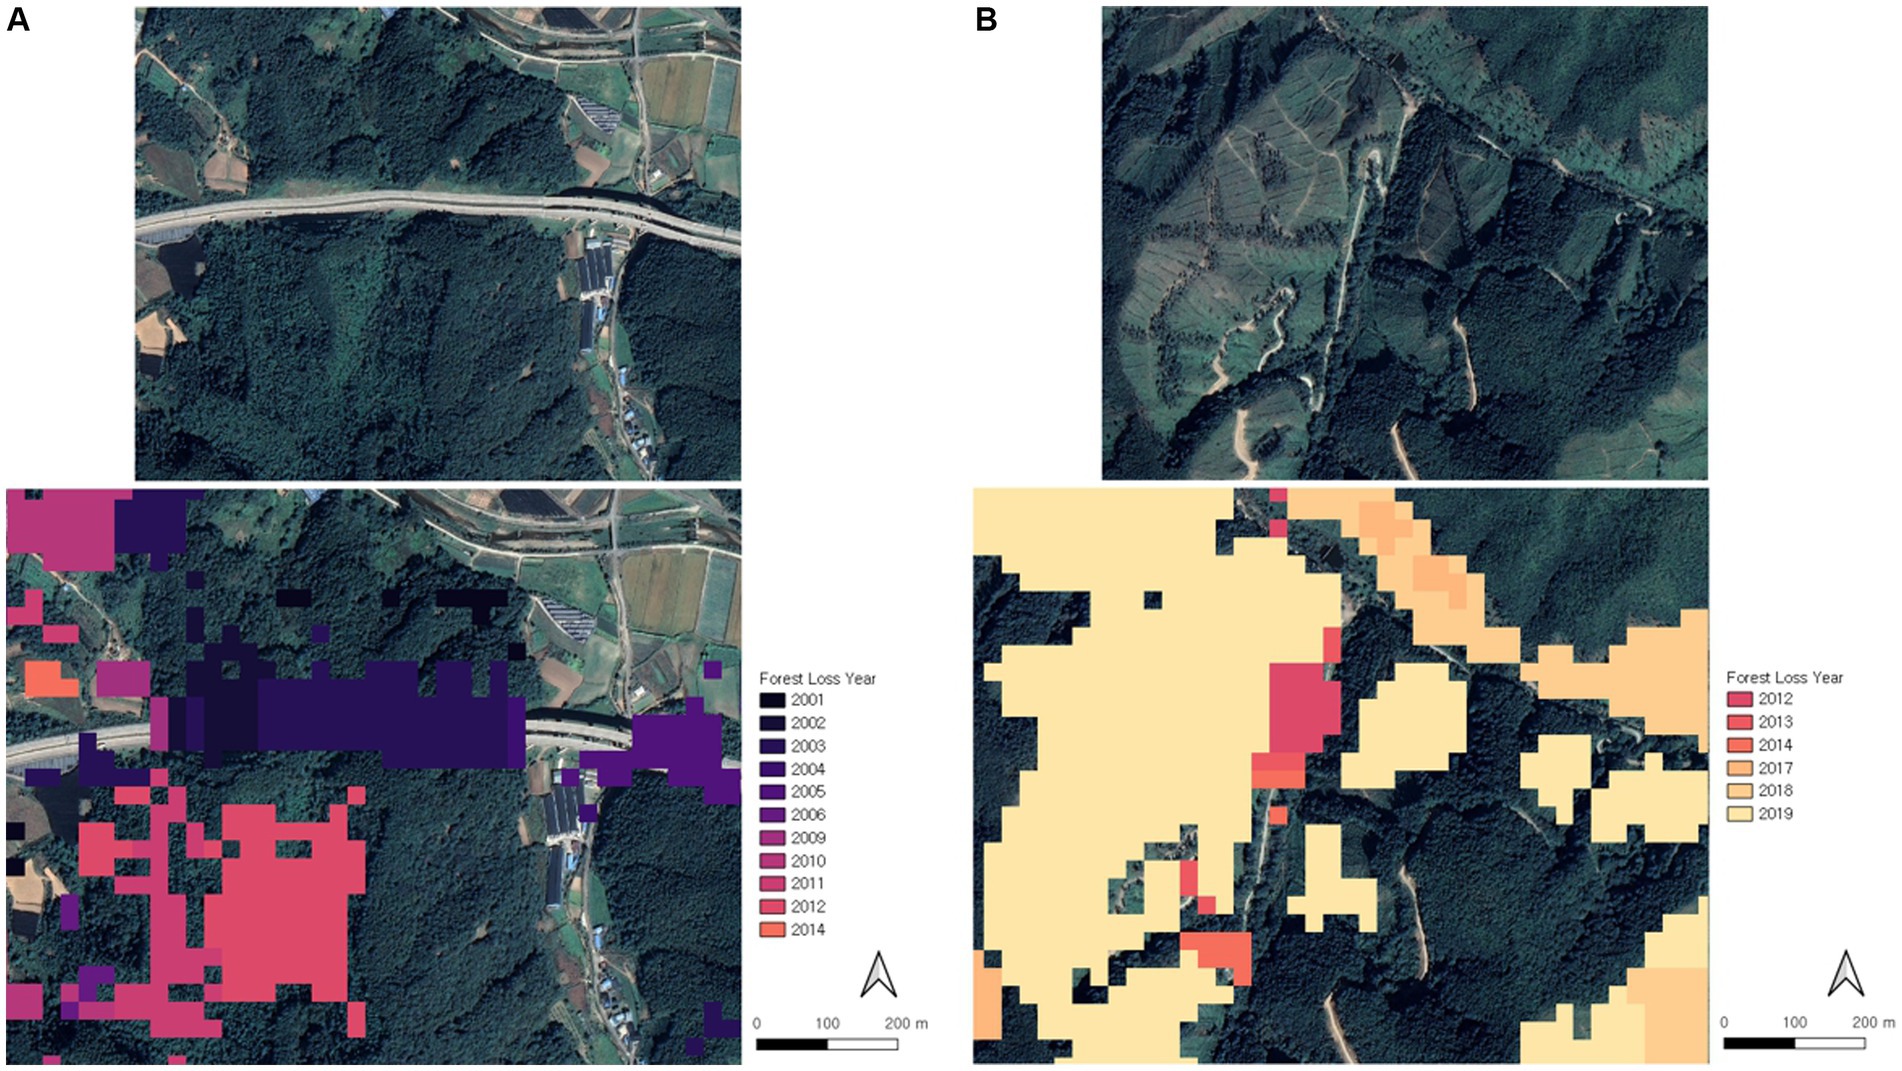
Figure 6. Deforestation cases (A) constructed infrastructure (35.7734 ° N, 127.4712° E; B) post-logging reforestation (35.7411 ° N, 127.4642° E; google satellite images). Image data: Google.
Post-logging reforestation does not permanently destroy forest areas. However, the planted trees have a different species composition and vertical structure from the surrounding forests, and they take abundant time to obtain functional homogeneity with the surrounding forests. In addition to the amount of forest loss, the decline causes forest fragmentation (Figure 2). Although forest fragmentation analysis was not conducted because it deviates from the subject of this study, a study in Jinan-gun, which is located in the study area, revealed that forest fragmentation around the mountain village is progressing (Kang et al., 2012).
4.2. Characteristics of forest
Government led reforestation policies started in 1973 are supporting the increase of overall growth of forests in South Korea (Bae et al., 2012; Park and Lee, 2014). Forests less than 40-years-old dominate in the study area. Considering that the data from the early 2010s was used to create the FT map, the forests were mainly regenerated after the 1970s. Tree planting carried out as part of the reforestation policies has facilitated forest regeneration, but natural regeneration of Pinus densiflora and Quercus spp. also occurred in large areas. Naejangsan Natural Park and the surrounding areas were the main habitats of old forests (≥ 41 years old). The lack of old forests in the mountain regions indicates the extensive use of timber and woodland resources by the villagers before the 1970s. Since forest management after Korean War focused on the supply of fuel wood, fast-growing trees were selected as the main reforestation species (Bae et al., 2014). As a result, the larch, rigida pine, and tulip tree occupy the largest area in the afforestation sites. However, due to changing socioeconomic conditions, these species have less economic value currently, as fuel wood is no longer needed. In addition, naturally regenerated forest, especially oak forest, is considered to have low economic value. The forest dominated by these species are used for logging and replanting on a massive scale (Figure 6B). However, logging a matured forest to grow a managed young forest changes the forest structure and undermines habitat continuity and biodiversity (Hagar et al., 2014; Kuuluvainen and Gauthier, 2018).
4.3. Survivorship of mountain forest
Deforestation can be affected by several factors. Forests located near villages and infrastructure are more likely to be removed or degraded than are remote forests (Greenberg et al., 2005; Sharma et al., 2020). Additionally, deforestation can be affected by topographical characteristics such as slope and elevation (Sharma et al., 2020; Feng et al., 2021). We applied the Weibull regression to model the forest survivorship and covariates that affect it. The northeast region has been affected more by deforestation than have the other regions (Figure 4A). As the northeast has the largest forest, the high risk in the region (Table 4) imposes a larger deforestation area (Figure 3).
Protected areas lose less forest than non-protected area, but there has been a loss of ~5% of forest in protected areas over the past 20 years. Since the early 2010s, deforestation rates have decreased due to an increase in protected areas. Not all protected areas area strictly protected as are national parks. Thus, even in protected areas forest loss may occur. Sustainable management of unprotected areas is essential for the conservation of the Jeongmack mountain range; the forest of this area has long been the ground for socio–ecological interactions in Korea. Excessive expansion of protected area can undermine forest use and the socio–ecological interactions. Temporal deforestation caused by logging and planting need to be regulated in a more organized manner. Therefore, it is necessary to expand the forestry direct payment project, which started in 2022, to motivate the preservation of forests without damaging them.
In contrast, the areas of higher elevation and steep slope are less affected by deforestation because the high elevation and steep slopes impose restrictions on land use. Notably, however, as the distance to the ridge decreases, the risk of deforestation increases (Table 6); that is, the closer the area to the ridge, the greater the risk of deforestation. Incidentally, there are many villages on the mountain range. The original villages were located on the periphery of the mountain range owing to the mild habitat condition. Thus, new developments accompanying deforestation occur mainly in undeveloped areas such as forest near mountain ridges. However, if the ridge area elevation is high, the area would have a low risk of deforestation because the elevation factor (coefficient: −0.004) compensates for the increased risk owing to the distance factor (coefficient: −0.00006) at the same unit meter.
Unplanned forest destruction or unauthorized deforestation, such as wildfires or illegal logging, are regularly monitored by the authorities. However, assessing the deforestation risk and preparing preemptive countermeasures based on the evaluation is difficult with only monitoring. However, survival analysis makes it possible to assess the risk of deforestation quantitatively and predict long term deforestation based on the covariates and estimated risk. Figure 7 shows the deforestation risk in 2022 calculated based on the Weibull regression results. The value changes depending on the year of prediction. The northern part of the mountain range is at a high deforestation risk, which has a relatively low elevation and gentle slope. The findings and method of this study could contribute to better forest management in Jeongmack mountain range, South Korea, but it is not restricted to this area.
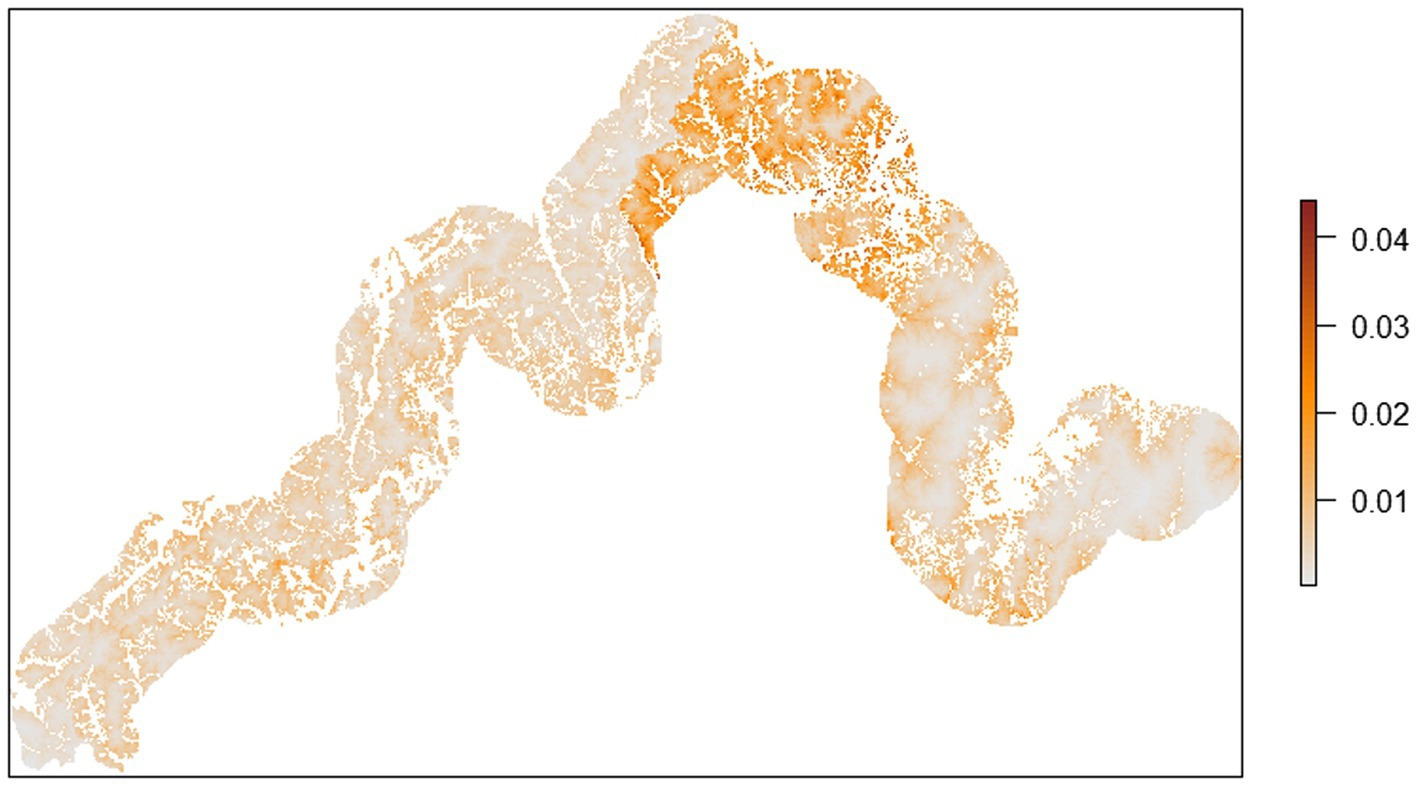
Figure 7. Estimated deforestation risk in 2022.
5. Limitations of the study
There are several weaknesses and potential limitations to this study. The analyses are based on the published datasets. We have to admit no accuracy assessment of the GFC dataset has been conducted on a regional scale. The LC maps and FT map are quality controlled GIS data. However, the datasets have uncertainty related to the weakness in dating. Given the time it takes to create these data, there may be a time lag of one to 2 years between the information used and when the data is available. In contrast, GFC data provides continuous information over time, but has high accuracy uncertainty (Galiatsatos et al., 2020; Shimizu et al., 2020). Galiatsatos et al. (2020) found that the annual accuracy varies with the availability of cloud-free imagery. If cloud-free imagery is not available for the year in which deforestation occurs, deforestation detection is postponed until the next year in which imagery is available. Shimizu et al. (2020) reported a scale issue, the GFC dataset tend to miss forest disturbances smaller than 3 ha. Counting for the limitation of the GFC dataset, the results might underestimate the deforestation area and hazard ratios. Overall, including spatial and temporal accuracy assessments will improve the reliability of deforestation analysis.
It is worth noting that the survival analysis did not take into account the time-varying covariates. The covariates used in the research were all static; however, some covariates (e.g., distance to built-up area) vary over time and they can affect the deforestation risk. The time varying covariates of survival analysis models can provide in-depth information for assessing deforestation risk. The use of additional factors such as population change, economic growth, and climatic conditions will improve the performance of the model.
Data availability statement
The original contributions presented in the study are included in the article/Supplementary material, further inquiries can be directed to the corresponding author.
Author contributions
The study was designed by KC and M-SB. Data collection and analysis were conducted by S-JK, KC, and TD. The manuscript writing was performed by KC and TD. All authors contributed to the article and approved the submitted version.
Funding
This study was supported by National Institute of Forest Science, Republic of Korea, through the ‘Systematization of forest space management in Baekdudaegan, Jeongmack and development of conservation and restoration systems by zone’. This research was partly supported by the Basic Science Research Program through the National Research Foundation of Korea (NRF) [2020R1I1A1A01067345], funded by the Ministry of Education.
Conflict of interest
The authors declare that the research was conducted in the absence of any commercial or financial relationships that could be construed as a potential conflict of interest.
Publisher’s note
All claims expressed in this article are solely those of the authors and do not necessarily represent those of their affiliated organizations, or those of the publisher, the editors and the reviewers. Any product that may be evaluated in this article, or claim that may be made by its manufacturer, is not guaranteed or endorsed by the publisher.
Supplementary material
The Supplementary material for this article can be found online at:
https://www.frontiersin.org/articles/10.3389/ffgc.2023.1183509/full#supplementary-material
References
Adams, C., Chamlian Munari, L., Van Vliet, N., Sereni Murrieta, R. S., Piperata, B. A., Futemma, C., et al. (2012). Diversifying incomes and losing landscape complexity in Quilombola shifting cultivation communities of the Atlantic rainforest (Brazil). Hum. Ecol. 41, 119–137. doi: 10.1007/s10745-012-9529-9
Ameztegui, A., Morán-Ordónez, A., Márquez, A., Blázquez-Casado, Á., Pla, M., Villero, D., et al. (2021). Forest expansion in mountain protected areas: trends and consequences for the landscape. Landsc. Urban Plan. 216:104240. doi: 10.1016/j.landurbplan.2021.104240
An, L., and Brown, D. G. (2008). Survival analysis in land change science: integrating with GIScience to address temporal complexities. Ann. Assoc. Am. Geogr. 98, 323–344. doi: 10.1080/00045600701879045
Bae, J. S., Joo, R. W., and Kim, Y. S. (2012). Forest transition in South Korea: reality, path and drivers. Land Use Policy 29, 198–207. doi: 10.1016/j.landusepol.2011.06.007
Bae, J. S., Lee, K. H., Lee, Y. G., Youn, H. J., Park, C. R., Choi, H. T., et al. (2014). Lessons Learned from the Republic of Korea’s National Reforestation Programme. Korea Forest Service, Daejeon, Republic of Korea. Available at: https://www.cbd.int/ecorestoration/doc/Korean-Study_Final-Version-20150106.pdf.
Barlow, J., Lennox, G. D., Ferreira, J., Berenguer, E., Lees, A. C., Mac Nally, R., et al. (2016). Anthropogenic disturbance in tropical forests can double biodiversity loss from deforestation. Nature 535, 144–147. doi: 10.1038/nature18326
Buckingham, K., and Hanson, C. (2015). The restoration diagnostic case example South Korea. South Korea: World Resources Institute.
Cervera, T., Pino, J., Marull, J., Padró, R., and Tello, E. (2019). Understanding the long-term dynamics of forest transition: from deforestation to afforestation in a Mediterranean landscape (Catalonia, 1868–2005). Land Use Policy 80, 318–331. doi: 10.1016/j.landusepol.2016.10.006
Cho, K. H., Hong, S. K., and Cho, D. S. (2008). Ecological role of mountain ridges in and around Gwangeung Royal Tomb forest in Central Korea. Journal of Plant Biology 51, 387–394. doi: 10.1007/BF03036058
Choi, Y. K. (2004). “Baekdudaegan, the central Axis of the Korean peninsular: the path toward management strategies regarding to its concepts” in Ecological issues in a changing world. eds. S. K. Hong, J. A. Lee, B. S. Ihm, A. Farina, Y. Son, and E. S. Kim (Dordrecht: Springer), 355–383.
Choi, G., Jeong, Y., and Kim, S. I. (2019). Success Factors of National-Scale Forest Restorations in South Korea, Vietnam, and China. Sustainability 11, 1–17. doi: 10.3390/su11123488
Choi, S. M., Kweon, H. K., Lee, J. W., Choi, Y. H., and Choi, T. J. (2014). A study on deterioration of Ridge Trail in Jeongmaek. Korean Journal of Environment and Ecology 28, 450–456. doi: 10.13047/KJEE.2014.28.4.450
Chung, M. Y., López-Pujol, J., and Chung, M. G. (2016). Is the Baekdudaegan “the southern Appalachians of the east”? A comparison between these mountain systems, focusing on their role as glacial refugia, Korean Journal of Plant Taxonomy 46, 337–347. doi: 10.11110/kjpt.2016.46.4.337
Chung, M. Y., Son, S., Suh, G. U., Herrando-Moraira, S., Lee, C. H., López-Pujol, J., et al. (2018). The Korean Baekdudaegan Mountains: a glacial refugium and a biodiversity hotspot that needs to be conserved. Front. Genet. 9, 1–7. doi: 10.3389/fgene.2018.00489
Environmental Spatial Information Service. (2023). Land cover mapping guidelines. Available at: https://egis.me.go.kr/bbs/landcover.do (Accessed May 24, 2023).
FAO. (2020). Global forest resources assessment 2020 in Main report. Rome: Food and Agriculture Organization of the United Nations.
Feng, Y., Ziegler, A. D., Elsen, P. R., Liu, Y., He, X., Spracklen, D. V., et al. (2021). Upward expansion and acceleration of forest clearance in the mountains of Southeast Asia. Nature Sustainability 4, 892–899. doi: 10.1038/s41893-021-00738-y
Galiatsatos, N., Donoghue, D. N., Watt, P., Bholanath, P., Pickering, J., Hansen, M. C., et al. (2020). An assessment of global forest change datasets for national forest monitoring and reporting. Remote Sens. 12:1790. doi: 10.3390/rs12111790
Global Forest Watch. (2021). South Korea deforestation rates & statistics. Available at: https://www.globalforestwatch.org/dashboards/country/KOR/ (Accessed July 2, 2022).
Greenberg, J. A., Kefauver, S. C., Stimson, H. C., Yeaton, C. J., and Ustin, S. L. (2005). Survival analysis of a neotropical rainforest using multitemporal satellite imagery. Remote Sens. Environ. 96, 202–211. doi: 10.1016/j.rse.2005.02.010
Hadi, K., Krasovskii, A., Maus, V., Yowargana, P., Pietsch, S., Rautiainen, M., et al. (2018). Monitoring deforestation in rainforests using satellite data: a pilot study from Kalimantan, Indonesia. Forests 9, 1–26. doi: 10.3390/f9070389
Hagar, J. C., Eskelson, B. N. I., Haggerty, P. K., Nelson, S. K., and Vesely, D. G. (2014). Modeling marbled murrelet (Brachyramphus marmoratus) habitat using LiDAR-derived canopy data. Wildl. Soc. Bull. 38, 237–249. doi: 10.1002/wsb.407
Hansen, M. C., Potapov, P. V., Moore, R., Hancher, M., Turubanova, S. A., Tyukavina, A., et al. (2013). High-resolution global maps of 21st-century forest cover change. Science 342, 850–853. doi: 10.1126/science.1244693
Hayes, P. (2010). Sustainable security in the Korean peninsula: envisioning a northeast Asian biodiversity corridor. The Korean Journal of International Studies 8, 197–229.
Hosonuma, N., Herold, M., Sy, V. D., Fries, R. S. D., Brockhaus, M., Verchot, L., et al. (2012). An assessment of deforestation and forest degradation drivers in developing countries. Environ. Res. Lett. 7:044009. doi: 10.1088/1748-9326/7/4/044009
Jang, G. S., Jeon, S. W., and Kim, S. S. (2008). Analyzing characteristics of forest damage withing the Geum-Buk mountain range. Journal of the Korean Institute of Landscape Architecture 36, 55–63.
Kang, W., Koh, I., Park, C. R., and Lee, D. (2012). An analysis of changes in forest fragmentation and morphology in surrounding landscapes of maeulsoops and Jinan-gun. Korean J Ecol Environ. 26, 941–951.
Kim, K. H., and Zsuffa, L. (1994). Reforestation of South Korea: the history and analysis of a unique case in forest tree improvement and forestry. For. Chron. 70, 58–64. doi: 10.5558/tfc70058-1
Kuuluvainen, T., and Gauthier, S. (2018). Young and old forest in the boreal: critical stages of ecosystem dynamics and management under global change. Forest Ecosystems 5, 1–15. doi: 10.1186/s40663-018-0142-2
Larrea-GallegosIan, G., and Vázquez-Rowe, I. (2021). Exploring machine learning techniques to predict deforestation to enhance the decision-making of road construction projects. J. Ind. Ecol. 26, 225–239. doi: 10.1111/jiec.13185
Lee, E. T., and Wang, J. W. (2003). Statistical methods for survival data analysis. Wiley Series in Probability and Statistics, Wiley, New York.
López-Carr, D. (2021). A review of small farmer land use and deforestation in tropical Forest Frontiers: implications for conservation and sustainable livelihoods. Land 10, 1–23. doi: 10.3390/land10111113
Mayfield, H. J., Smith, C., Gallagher, M., and Hockings, M. (2020). Considerations for selecting a machine learning technique for predicting deforestation. Environ. Model Softw. 131:104741. doi: 10.1016/j.envsoft.2020.104741
Mon, M. S., Mizoue, N., Htun, N. Z., Kajisa, T., and Yoshida, S. (2012). Factors affecting deforestation and forest degradation in selectively logged production forest: a case study in Myanmar. For. Ecol. Manag. 267, 190–198. doi: 10.1016/j.foreco.2011.11.036
Morton, D. C., DeFries, R. S., Shimabukuro, Y. E., Anderson, L. O., Arai, E., Espirito-Santo, F. D. B., et al. (2006). Cropland expansion changes deforestation dynamics in the southern Brazilian Amazon. PNAS 103, 14637–14641. doi: 10.1073/pnas.0606377103
Park, M., and Lee, H. (2014). Forest policy and law for sustainability within the Korean peninsula. Sustainability 6, 5162–5186. doi: 10.3390/su6085162
Pir Bavaghar, M. (2016). Deforestation modelling using logistic regression and GIS. J. For. Sci. 61, 193–199. doi: 10.17221/78/2014-JFS
QGIS Development Team. (2023). QGIS geographic information system. Open Source Geospatial Foundation Project. Available at: http://qgis.osgeo.org
R Core Team. (2023). R: A language and environment for statistical computing. R Foundation for Statistical Computing, Vienna, Austria. Available at: https://www.R-project.org/
Rosa, I. M., Purves, D., Souza, C. Jr., Ewers, R. M., et al. (2013). Predictive modelling of contagious deforestation in the Brazilian Amazon. PLoS One 8:e77231. doi: 10.1371/journal.pone.0077231
Sandker, M., Finegold, Y., D'Annunzio, R., and Lindquist, E. (2017). Global deforestation patterns: comparing recent and past forest loss processes through a spatially explicit analysis. Int. For. Rev. 19, 350–368. doi: 10.1505/146554817821865081
Sharma, P., Thapa, R. B., and Matin, M. A. (2020). Examining forest cover change and deforestation drivers in Taunggyi District, Shan State, Myanmar. Environ. Dev. Sustain. 22, 5521–5538. doi: 10.1007/s10668-019-00436-y
Shimizu, K., Ota, T., and Mizoue, N. (2020). Accuracy assessments of local and global Forest change data to estimate annual disturbances in temperate forests. Remote Sens. 12:2438. doi: 10.3390/rs12152438
Songer, M., Myint, A., Senior, B., DeFries, R., and Leimgruber, P. (2008). Spatial and temporal deforestation dynamics in protected and unprotected dry forests: a case study from Myanmar (Burma). Biodivers. Conserv. 18, 1001–1018. doi: 10.1007/s10531-008-9490-5
Tadono, T., Nagai, H., Ishida, H., Oda, F., Naito, S., Minakawa, K., et al. (2016). Generation of the 30 M-mesh global digital surface model by Alos prism. ISPRS – Int. Arch. Photogramm. Remote Sens. Spatial Inf. Sci. XLI-B4, 157–162. doi: 10.5194/isprsarchives-XLI-B4-157-2016
Therneau, T. M., and Grambsch, P. M. (2000). Modeling survival data: Extending the cox model. Springer: New York.
Vance, C., and Geoghegan, J. (2002). Temporal and spatail modeling of tropical deforestation: a survival analysis linking satellite and household survey data. Agric. Econ. 27, 317–332.
Wang, N., Brown, D. G., An, L., Yang, S., and Ligmann-Zielinska, A. (2013). Comparative performance of logistic regression and survival analysis for detecting spatial predictors of land-use change. Int. J. Geogr. Inf. Sci. 27, 1960–1982. doi: 10.1080/13658816.2013.779377
Yao, Y., Liang, S., Cheng, J., Lin, Y., Jia, K., and Liu, M. (2014). Impacts of deforestation and climate variability on terrestrial evapotranspiration in subarctic China. Forests 5, 2542–2560. doi: 10.3390/f5102542
Yu, J., Choi, W., Lee, S., and Choi, J. (2016). Forest degradation and spatial distribution of Forest land development. Journal of the Korea Society of Environmental Restoration Technology 19, 101–110. doi: 10.13087/kosert.2016.19.6.101
Keywords: mountain range, deforestation, survival analysis, Weibull regression, land cover change
Citation: Dhakal T, Cho KH, Kim S-J and Beon M-S (2023) Modeling decline of mountain range forest using survival analysis. Front. For. Glob. Change. 6:1183509. doi: 10.3389/ffgc.2023.1183509
Edited by:
Manfred J. Lexer, University of Natural Resources and Life Sciences Vienna, AustriaReviewed by:
Yan Gao, Universidad Nacional Autonoma de Mexico, MexicoPolyanne Gomide, Universidade Federal de Lavras, Brazil
Copyright © 2023 Dhakal, Cho, Kim and Beon. This is an open-access article distributed under the terms of the Creative Commons Attribution License (CC BY). The use, distribution or reproduction in other forums is permitted, provided the original author(s) and the copyright owner(s) are credited and that the original publication in this journal is cited, in accordance with accepted academic practice. No use, distribution or reproduction is permitted which does not comply with these terms.
*Correspondence: Ki Hwan Cho, holidaycho@gmail.com