Fine-grained water availability drives divergent trait selection in Amazonian trees
 Flávia R. C. Costa1*
  Carla Lang2
  Thaiane R. Sousa1
  Thaise Emilio3 Adriane Esquivel-Muelbert4,5
  Juliana Schietti6
- 1Coordenação de Pesquisas em Biodiversidade, Instituto Nacional de Pesquisas da Amazônia (INPA), Manaus, Brazil
- 2Programa de Pós-Graduação em Botânica, Instituto Nacional de Pesquisas da Amazônia (INPA), Manaus, Brazil
- 3Programa Nacional de Pós-Doutorado (PNPD), Programa de Pós-Graduação em Ecologia, University of Campinas UNICAMP, Campinas, Brazil
- 4School of Geography, Earth and Environmental Sciences, University of Birmingham, Birmingham, United Kingdom
- 5The Birmingham Institute of Forest Research (BIFoR), University of Birmingham, Birmingham, United Kingdom
- 6Departamento de Biologia, Universidade Federal do Amazonas, Manaus, Brazil
Water availability is an important driver of plant functional biogeography. Most studies focus on the effects of precipitation, and neglect the contribution of groundwater as a source when the water table depth (WTD) is accessible to roots. Previous studies suggested that shallow water tables select for acquisitive traits. These studies have mostly contrasted shallow vs. deep water tables, without considering a more fine-grained perspective within shallow water tables or the temporal WTD behavior. Here we tested whether the degree of variation in WTD translates into divergent modes of trait selection. We expect constantly shallow WTD leading to the selection of acquisitive traits, whilst high fluctuation of WTD would lead to tree communities with more conservative traits. We used community and trait data (wood density and leaf traits) from 25 1-ha forest monitoring plots spread over 600 km in central Amazonia, covering a gradient of shallow to intermediate (0–8 m deep) WTD along the Purus-Madeira interfluve. Wood density was measured directly in trunk cores (498 trees) and leaf traits (Specific Leaf Area, Leaf Dry Mass Content, Leaf Thickness) of >6,000 individuals were estimated with FT-NIR (Fourier-Transformed Near-Infrared Spectroscopy) spectral models calibrated with cross-Amazonian data. We observed a turnover of families, genera, and species along the gradient of temporal WTD fluctuation range. This taxonomic turnover was accompanied by a change in wood traits, with higher wood density associated to higher WTD fluctuation and higher climatic water deficit. Leaf traits, however, varied in the opposite direction than initially hypothesized, i.e., trees had more acquisitive traits toward intermediate WTD with higher fluctuation. Based on those results, we propose that the effect of WTD selection should be conceptualized in a quadratic form, going from water excess in very shallow WTD (<2 m, limiting condition due to anoxia, selecting conservative traits), to moist in intermediate WTD (between 2 and 5 m deep, favorable condition with constant water supply, selecting acquisitive traits), to water deficit in deep WTD (>5 m, limiting condition, with conservative traits again).
Introduction
Water supply, along with temperature, are the key determinants of vegetation distribution patterns worldwide (Whittaker, 1975). At large scales, precipitation amount and seasonality determine the major vegetation types. Within the precipitation gradient the access to the groundwater modifies the structure and functioning of the vegetation at the landscape scale (Roebroek et al., 2020; Sousa et al., 2022). Controlled by topography (Fan et al., 2017), the access to groundwater has been shown to influence the ecology and dynamics of Amazonian forests (Esteban et al., 2020; Sousa et al., 2020, 2022). In this region, locations under shallow water table may function as hydrological refuges during droughts (Esteban et al., 2020; Sousa et al., 2020). However, our knowledge of the ecological role of water table depth (WTD) comes from only a few sites and we lack information on the role of the temporal variation of WTD. As climate change may lead to varying degrees of exposure of these forests to drought conditions, understanding the role of WTD and its variation on the ecology of tropical forest becomes critical to predict their functioning (Costa et al., 2022).
Shallow water table forests are generally conceptualized as environments with constantly wet soils that provide enough water to sustain plants, where the only potential stress arrives from seasonal waterlogging (Costa et al., 2022). The shallow rooting imposed by shallow water tables generates anchoring instability and consequent higher tree mortality (Gale and Hall, 2001; Ferry et al., 2010; Toledo et al., 2016), creating a generally more open canopy with higher light penetration to the understory. The higher availability of resources (light and water) would then benefit species with acquisitive and hydraulically vulnerable traits. Most of the literature so far agrees with this perspective [review in Costa et al. (2022)].
This conceptualization, however, does not take into consideration that water table depth fluctuates along time, both intra and inter-annually. The temporal variation may be very modest in some sites, a few centimeters, or wide, up to several meters (Miguez-Macho and Fan, 2012). This temporal variation in water table levels is associated with climate and topographic variation, tending to be lower where topographic heterogeneity is higher and climates wetter (Miguez-Macho and Fan, 2012; Costa et al., 2022), although soil texture may also intervene. In flatter landscapes and especially under more seasonal climates, a forest may experience conditions of very shallow water table (up to the surface of the soil, for example) during some months of the year, but deep levels in other months, when water can get far from the reach of roots, as root depth tends to be constrained by the most superficial water table level (Fan et al., 2017). Under a higher WTD variation, soil water conditions should vary strongly within years, and may go from waterlogging to moist to dry. This wide variation can be expected to generate stress. Thus, instead of the high water availability described for the constantly shallow water tables, this highly variable conditions could translate into the opposite trait selection, i.e., of conservative strategies and hydraulically resistant xylems. Under a dominance of wet conditions in constantly shallow water tables, plant traits would be selected by resource abundance, and to reduce the stress of waterlogging, since the less dense tissues associated to the acquisitive strategy can provide a better distribution of the limited soil oxygen (Mommer et al., 2006). Lower density tissues may arise from larger amounts of intercellular spaces (Villar et al., 2013). On the other hand, under widely varying water table levels, plant traits would be mostly selected by the limitation of resources, i.e., the water deficit at the lowest water table levels. Thus, more conservative traits would be selected as the WTD fluctuation gets higher and when combined to larger climatic water deficits.
Understanding functional trait distribution along varying water table depths and regimes is critical for predictions of the impacts of climate change. One important expectation is that forests on shallow water tables can function as hydrological refuges from the more frequent droughts under climate change, due to the maintenance of moist soils. However, if those forests do have acquisitive-low resistance traits, they can be expected to collapse if droughts are strong enough to decrease water table levels beyond the reach of roots. In this study, we investigate the floristic and functional turnover of tree communities along a gradient of WTD temporal variation spanning a ∼600 km transect in central Amazonia. We test the hypothesis that the degree of variation in water table levels translates into divergent modes of trait selection. Our prediction is that water table levels that are constantly shallow (low average depth, low amplitude/deviation) lead to a selection of acquisitive traits, while water table levels that vary (higher amplitude/deviation) between shallow (within the range of roots) and deep (outside the range of roots) lead to a selection of conservative traits.
The collection of individual-level functional data is still laborious (Paine et al., 2011), and few studies collect these data for all the individuals of a site or multiple sites. Most studies focus either on small areas or on the collection of functional data for a few individuals per species or even only for the dominant species (Homolová et al., 2013). Spectroscopy has been suggested as a shortcut for the estimation of traits, allowing wide coverage of individuals or at least ecosystems, as it can be used to indirectly estimate morphological and biochemical traits through models calibrated with direct measurements (Acuna and Murphy, 2006; Asner et al., 2014; Tsuchikawa and Kobori, 2015; Costa et al., 2018). Trait estimation with spectroscopy is possible because the reflectance, absorbance and transmittance of light depend on the size, density and shape of plant tissues and its chemical components (Cavender-Bares et al., 2017). This technique is fast, and allows collection of a much larger number of samples than with direct measurements. We here take advantage of spectrometry to estimate leaf traits of more than 6,000 trees—the widest on-the-ground coverage of individual level traits in tropical studies so far.
Materials and methods
Study area
The study site is the Purus-Madeira interfluve in central Amazonia, Brazil. Twenty-five 1 ha plots were sampled in nine sites along 600 km of the BR 319 highway. These sites have been established by the Brazilian Program for Biodiversity Research (PPBio) and follow the RAPELD design (Costa and Magnusson, 2010). In brief, each site consists of straight 5 km trails separated by 1 km, and plots are distributed along the trails 1 km apart. Plots are established following the altitudinal contour line of the starting point, such that within-plot variation in altitude and thus WTD is minimized, while the variation among plots is maximized.
The Purus–Madeira interfluvial region has a relatively recent geological origin with unstable sediments from Late Pleistocene or Early Holocene and predominantly flat topography (Sombroek, 2000). Elevation above sea level varies from 27 to 80 m along the highway (shuttle radar topography data). This region is part of the Amazon basin “loamy plains” (Sombroek, 2000), a landform covering around 11% of the Amazon basin. Soils are mainly Gleysols and Plinthosols with poor drainage, and the predominant texture is silt to fine sand (Sombroek, 2000). Large areas are waterlogged during the rainy season, and many of the small streams dry out during the dry season. The water-table is shallow, within 7 m of the surface throughout the year in most of the region but some areas stay with a short column of flooding (∼50 cm) when the water-table reaches the highest levels (Moulatlet et al., 2014). The mean annual rainfall varies from 2,000 to 2,400 mm, the number of consecutive months in which these forests are under atmospheric water deficit, i.e., less than 100 mm of rainfall (Aragão et al., 2007), varies from 1 month in the north of the highway to 4 months per year in the south (Sombroek, 2001). The vegetation is classified as lowland dense rainforest in the north and lowland open rainforest dominated by palms in the south (BRASIL 1974).
Taxonomic composition
The taxonomic information was collected for all tree stems with diameter at breast height (DBH) >10 cm. Trees with DBH ≥30 cm were sampled in 1 ha and trees with DBH between 10 and 30 cm were sampled in a sub-sample of 0.5 ha of each plot. Botanical vouchers were collected between 2015 and 2016. A total of 9,926 trees in the 25 plots (91.4% of all trees) were identified to the higher taxonomic resolution as possible. Only 16% of the vouchers could not be identified to the species level. Vouchers were identified mostly by Lorena M. Rincón, with the support of Alberto Vicentini and Marisabel Adrianzen (Lauraceae), Paulo Assunção (Lecythidaceae and miscellaneous), Mario Terra Araujo (Sapotaceae), Tatiana Carvalho (Eclinusa), Ana S. Andrade, Priscila Souza, and Carlos V. Gonzales (miscellaneous).
Wood density
Wood samples were collected from the trunk of 498 trees (3 to 25 trees per plot, mean = 19.9, sd = 4.0) for basic wood density (WD) determination. All sampled trees had DBH ≥30 cm and were randomly selected along each plot. Wood samples were collected at 1.2 m above the soil with an increment borer of 5.15 mm of diameter. The length of the wood sample was proportional to the tree diameter. For each tree, we marked on the borer the radius length and used this mark as a reference to reach the trunk pith. In trees presenting wood decay, hollow or extremely hard wood, the sample was shorter than the trunk radius. Immediately after sampling, the bark was taken off, the wood core sample was measured with a caliper and fresh volume was determined by multiplying the cylinder length by its area. Samples were then taken to the laboratory and oven dried for 72 h at 105°C for dry mass determination (0.0001 g precision). Wood density was calculated by the ratio between dry mass and fresh volume (g/cm3).
Leaf functional and spectral data collection
Leaf functional traits were collected for 2,121 trees distributed in five sampling sites across the Amazon, covering most of the soil and climate gradients (Lang, 2020), to calibrate the FT-NIR spectral models. Of this number, 229 trees from six plots (20–80 individuals per plot, mean = 38.2, sd = 23.8) were sampled in the BR-319 study site. Sampled individuals were between 1 and 10 cm DBH. From each individual a branch was collected from the best-illuminated canopy side, avoiding signs of illness and epiphylls, and kept in wet bags until processing. The three healthiest and mature leaves were measured for thickness (LT, mm) with a micrometer (middle part, avoiding main and secondary veins), weighed while fresh, scanned with the portable scanner CI — 202, CID — Bio Science, dried at 60°C for 72 h (or until dry weight) and weighted for dry weights (precision of weights 0.0001 g). Petioles and rachises were not included in the area and weight measurements. Specific leaf area (SLA, cm2/g) is the leaf area per unit of leaf dry mass, calculated by pooling the three leaves per plant (or all the leaflets of one compound leaf), and by dividing their leaf area over their dry mass. The leaf dry matter content (LDMC, mg/g) was calculated as the dry mass over the fresh mass of these tissues.
The same leaves used for trait measurements were scanned with FT-NIR after drying, taking one reading at the adaxial and another at the abaxial surface, in the middle part of the leaf, avoiding main veins and places with any visible signs of disease. Leaf and branch spectra were collected with a Thermo Nicollet spectrophotometer (Thermo Fischer Scientific, Waltham, MA, USA), using the Antaris FT-NIR II Method Development System (MDS). The spectral readings are expressed as absorbance values from the wavelengths of 1,000–2,500 nm in the near-infrared and the spectrum for each sample reading consists of 1,557 absorbance values. Each reading produced by the instrument was the average of 16 measurements of absorbance at a certain wavelength, with a resolution of 8 cm–1. This resolution was chosen based on the visual examination of several samples with resolution between 4 and 16 cm–1 for the detection of noise and on the literature (Braga et al., 2011; Pastore et al., 2011). A black, opaque material was placed over the point where the spectral readings were collected to avoid light scattering. A background calibration reading was performed before each reading was taken.
The models to estimate functional traits from leaf spectra were developed with Partial Least Square regressions (PLSR) with the R package pls (Liland et al., 2022). PLSR is a widely used method for analyzing spectral data of biological materials and is very well-suited to the high multi-collinearity present in this kind of data (Nicolaï et al., 2007; Serbin et al., 2014; Couture et al., 2016). PLSR reduces the number of collinear predictor variables into a low number of latent non-correlated variables (Serbin et al., 2014, Couture et al., 2016). The efficiency of models based on PLSR to predict functional traits from spectral data has been previously demonstrated (e.g., Asner et al., 2014; Serbin et al., 2014).
The spectra used for all models comprised the average of readings taken on both sides of the leaves, and all 1,557 variables (i.e., absorbance at each of 1,557 wavelengths) read for each sample. The first step in the modeling approach was to scan and clean the data set from outliers; i.e., values outside the known range of each trait or outside the 95% range of the observed values. We also evaluated biplots among traits to localize points too far from the expected correlation and then checked for potential errors. The optimal number of components for an effective model for each trait, while avoiding over-fitting, was selected by minimizing the prediction residual sum of squares (PRESS). PRESS was calculated for successively more complex models (including a larger number of components), through a 10-fold cross-validation. Each of the cross-validations used 90% of the data points for model construction and 10% for validation, these subsets were selected at random. The models for which PRESS was a minimum were then selected as the best for each trait, and for these, the root mean squared error of prediction (RMSE) and R2 reported are the averages of the cross-validation (Serbin et al., 2014; Costa et al., 2018).
These models were used to estimate leaf trait values for all the plant collections available for each plot (6,448 individuals, 65% of the total 9,926 trees). Two dried leaves per voucher were scanned in the FT-NIR as described above, and the average of these four spectral readings per sample was used as input to the predictive model. For individuals without botanical vouchers, traits were assigned according to a hierarchy of similarities with individuals for which trait values were available. Individuals belonging to species with traits available in the database had their values imputed based on the mean for the species. As for individuals identified only at the genus level, the attribution took place in two ways: the average of the genus per plot, if the number of samples was greater than five per plot, or else by the whole average of the genus across plots. The same logic was adopted for individuals identified only to the family level. Finally, in the case of samples without any botanical identification, we assigned the average trait for the plot.
Environmental data
Water table depth was monitored using piezometers between the years 2010 and 2013 in all plots. Each plot had one piezometer 7 m deep in the ground, monitored mostly every 1–2 months during this period, but up to 4 months in a few more distant plots. From those readings, the metrics describing the WTD—the average level over the period, the standard deviation and the range of variation, were calculated for each plot.
Maximum cumulative water deficit (MCWD) was calculated based on the long-term average of the annual MCWD of each plot, from 1971 to 2019, thus reflecting the climatic conditions experienced by each plot over time and corresponding to the time window of our dataset. The MCWD corresponded to the maximum value of the monthly accumulated climatic water deficit reached in each location (i.e., the difference between precipitation and evapotranspiration within each hydrological year; Muelbert et al., 2019). The hydrological year is defined as starting in the wettest month of each site, determined from its precipitation time series, thus adjusting for differences in seasonality among sites. This metric represents the sum of water-deficit values over consecutive months when evapotranspiration is greater than precipitation (Aragão et al., 2007). Precipitation data were extracted from the TerraClimate dataset (Abatzoglou et al., 2018), at c. 4 km (1/24th degree) spatial resolution, from 1971 to 2019. Monthly evapotranspiration was assumed to be fixed at 100 mm/month, considering that Amazonian forest canopies have a nearly constant evapotranspiration rate (Shuttleworth, 1988; Rocha et al., 2004).
The available phosphorus content and the exchangeable base content (sum of Ca2+, Mg2+, and K+) were used as proxies of soil fertility. Soil chemical properties were analyzed in a compound sample derived from 24 subsamples from the first 30 cm depth of soil collected along the central line of each plot. The samples were air-dried, sieved through a 2 mm sieve and bulked to produce composite samples. Available Ca2+ and Mg2+ were extracted by KCl 1N method; available K+ and P by Mehlich’s I extraction solution, and read by atomic spectrometry. Na+ levels were below the spectrometer detection capacity. Analyses were conducted at the Plant and Soil Thematic Laboratory at INPA (Manaus, Brazil). The protocols for soil analyses followed Donagema et al. (2011).
Data analysis
Non-metric multidimensional scaling (NMDS) was used to reduce the dimensionality of the taxonomic composition at the levels of species, genus, and family to one ordination axis. NMDS was run over dissimilarities calculated with the Bray-Curtis index on species relative abundances, with the basic settings of the metaMDS function of the vegan R package (Oksanen et al., 2019), but allowing for extended dissimilarities when necessary. The ordination axis was then used as the response variable representing the community composition at each taxonomic level. The variation of the original data captured by the NMDS axes was obtained by regression of the matrix of original floristic distances among samples, calculated with the same dissimilarity index used in the ordination, and the matrix of distances among samples obtained from the final NMDS solution (McCune and Grace, 2002). Indicator taxa at each taxonomic level were determined with the metric of Dufrêne and Legendre (1997), tested with 999 permutations, with the R package indicspecies (De Cáceres and Legendre, 2022). With this metric, we assessed the significance and strength of species associations (fidelity and specificity) to conditions of low (≤5 m) and high (>5 m) WTD fluctuation.
The values of leaf traits estimated with FT-NIR spectroscopy or imputed based on taxonomy were summarized in an average value across all individuals of each plot (Community Means based on individuals), for each trait.
Multiple regression models to explain the response variables representing taxonomic composition (ordination axes at species, genus and family levels) and functional traits (WD for 498 sampled individuals, average WD per plot, Community Means of leaf traits) were built including as predictors the focal WTD metrics (mean and temporal variation per plot) and covariates to control for the known effects of climate seasonality (MCWD) and soil fertility (phosphorus and exchangeable base content). The models included also the expected interaction between the hydrological variables, MCWD and WTD mean or temporal variation. The full models were submitted to model selection with the function dredge on the R package MuMin v.1.47.1 (Bartón, 2022), to determine the rank of models with the lowest AIC that best predict the response variables. Akaike’s Information Criterion (AIC) was adopted as a measure of goodness of fit. AIC penalizes parameter-rich models to prevent over-fitting. This procedure is preferable to sequential searching protocols in avoiding Type-I error because the models are not explicitly compared through statistical tests (MacNally, 2000). Models were adjusted with Ordinary Least Squares regression and the normal quantile plots and residual vs. fits plots were examined to check assumptions of normality and homoscedasticity, indicating no need for transformations or other distribution families. Correlations among the predictors described above were previously examined to ensure that only non-correlated or weakly correlated (r < 0.6) variables were used in the models (Supplementary Figure 1).
Results
The NMDS ordinations captured 67% (family level), 55% (genus level), and 52% (species level) of the taxonomic dissimilarity among plots in one dimension. The NMDS one-dimensional scores representing the taxonomic composition at the family, genus and species levels varied along the gradient of WTD fluctuation range, in the models that also control for soil fertility (phosphorus) and MCWD (Table 1). Other metrics of the WTD (sd, mean) did not explain the taxonomic turnover. The best model for species composition included only the WTD range (Figure 1A), and the second best (Δ AIC = 0.6) included the WTD range and the phosphorus content, although the effect of phosphorus was not significant (p = 0.11). The species with the most significant indicator values on plots with low WTD range were Abarema adenophora, Schefflera morototoni, Licania prismatocarpa, Humiriastrum villosum, and Tachigali melanocarpa (among 18 indicator species), while plots with high WTD range had only Monopteryx inpae (Supplementary Table 1) as an indicator. The best model for genus composition included the interaction of WTD fluctuation range and the MCWD (Figure 1B). When the WTD fluctuation range is low (blue line), there is a small change of the genus composition along MCWD, but when the WTD range is high (red line) there is a strong genus turnover from sites with high to low MCWD (Figure 1B). Genera with significant indicator values for plots with low WTD fluctuation were Abarema, Parkia, Vochysia, Humiriatrum, Schefflera, and Moronobea (Supplementary Table 2). The best model for family composition included only the WTD fluctuation range (Figure 1C), and this model was the only one with <2 Δ AIC. Families with large loadings and abundances on plots with low WTD range were Salicaceae, Humiriaceae, Vochysiaceae, while those were Calophyllaceae, Primulaceae, Urticaceae where the WTD has a large fluctuation. However, the only family with a significant indicator value for plots with low WTD fluctuation (<5 m) was Araliaceae (IndiVal = 0.73, p = 0.023).
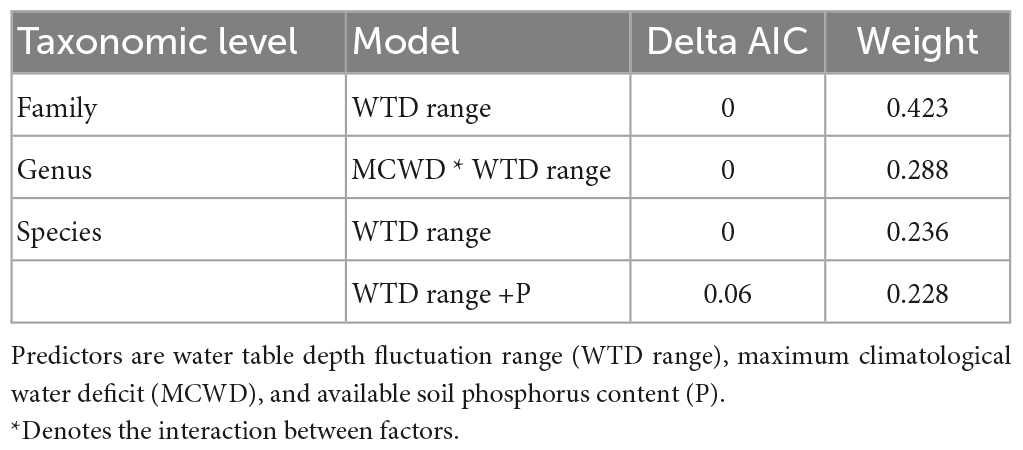
Table 1. Selection of models to predict the community taxonomic composition [non-metric multidimensional scaling (NMDS) ordination axis] at three levels, of 25 plots distributed along the Purus-Madeira interfluve, central Amazonia.
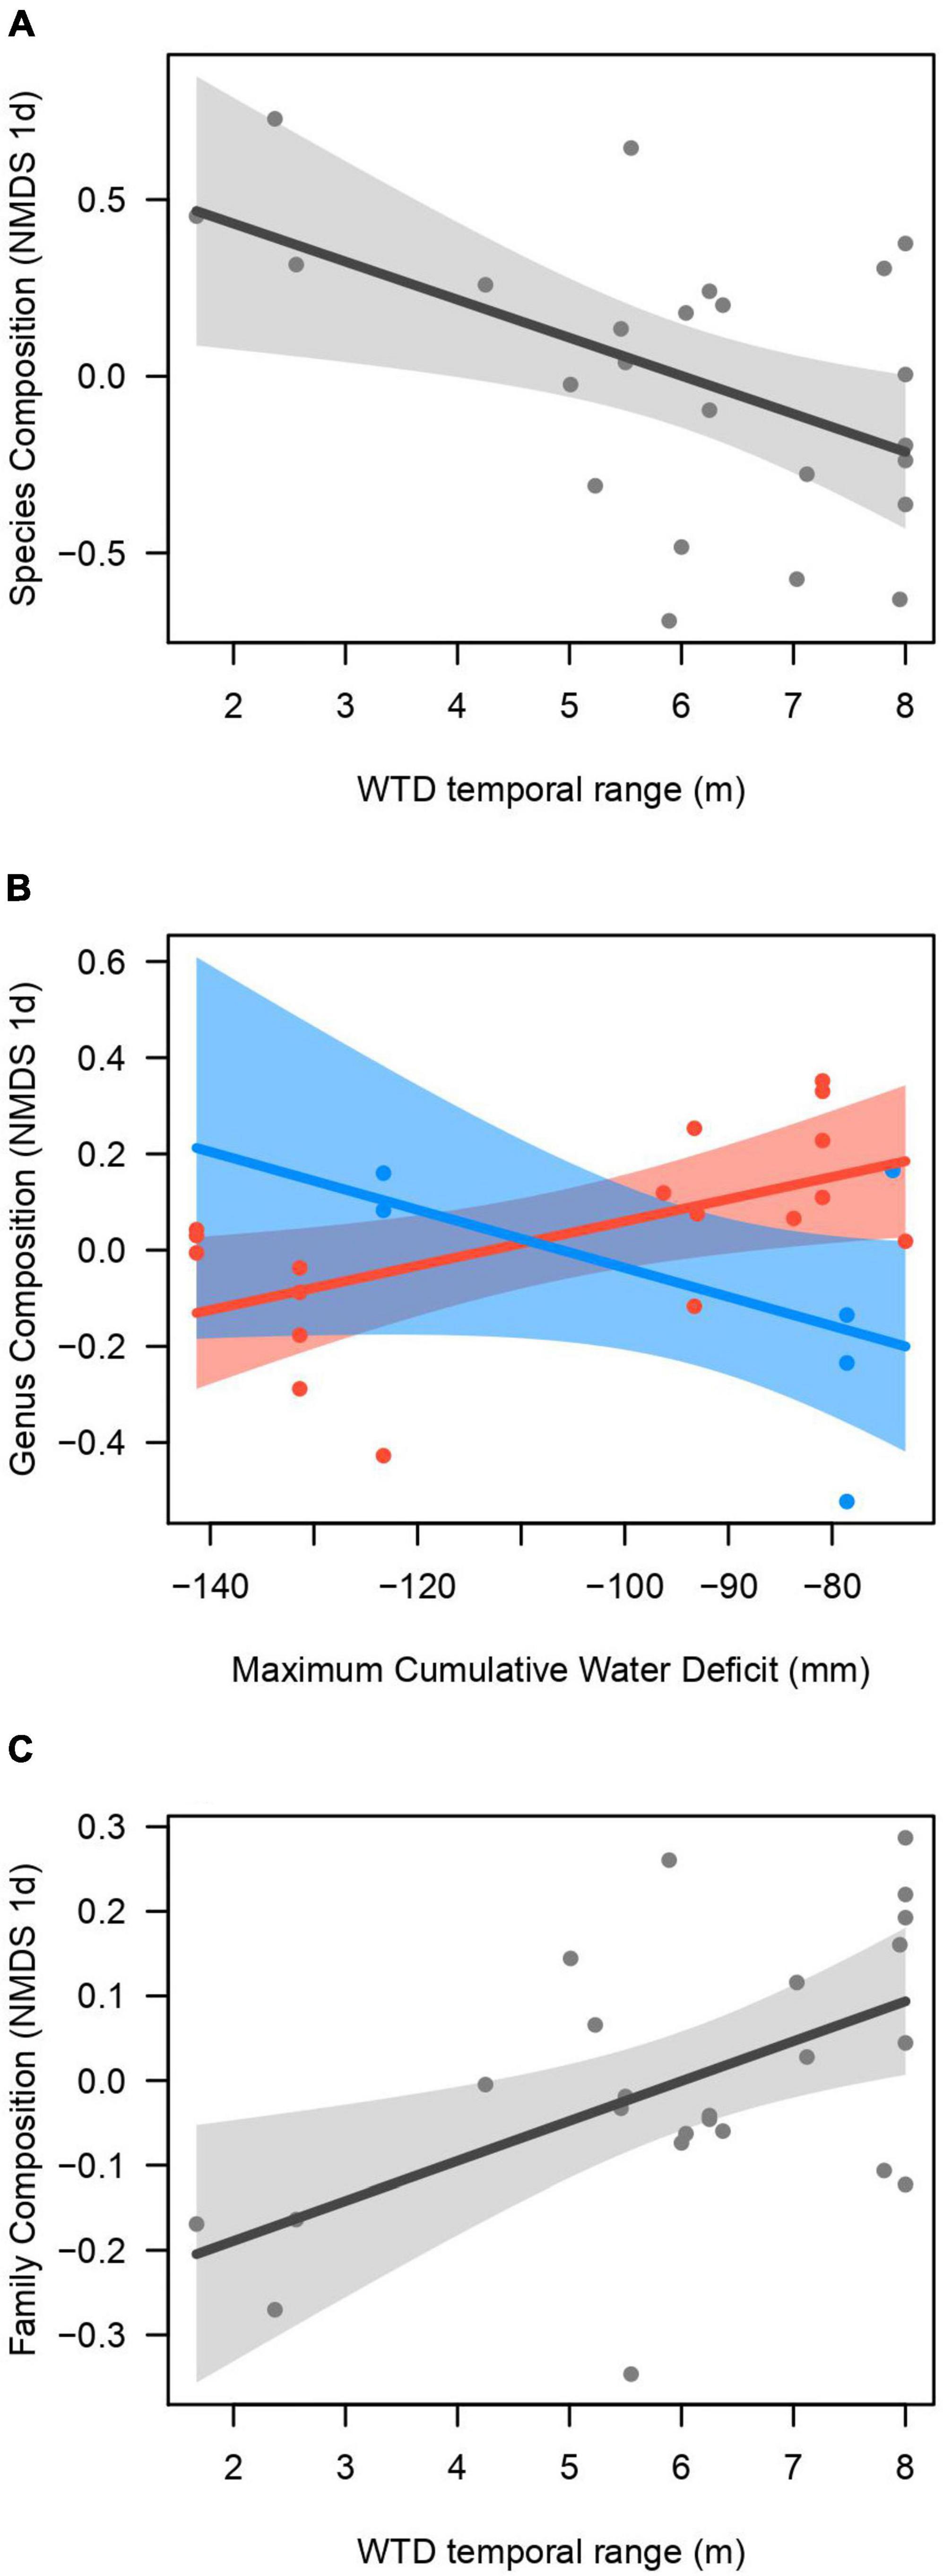
Figure 1. Plots of the best models to explain community taxonomic composition (reduced to one axis with non-metric multidimensional scaling, NMDS) at the, (A) species, (B) genus, and (C) family levels, of 25 plots distributed along the Purus-Madeira interfluve, central Amazonia. (B) Shows the interactive effect of maximum cumulative water deficit (MCWD) and water table depth (WTD) range on the genera composition; the red line denotes high WTD range (>5 m) and the blue line low WTD range (≤5 m).
The wood density varied along the gradients of WTD range, MCWD and soil nutrients. For the WD of the 498 individuals measured in situ, all of the five best models with <2 Δ AIC included MCWD and WTD fluctuation range (and the four best models included the interaction between those variables), while some include soil phosphorus content or exchangeable cation content, or both (Table 2). The best model includes the interaction of MCWD and WTD range (Figure 2A), indicating that WD varies along the MCWD gradient only when the WTD fluctuation range is high (>5 m). Thus, WD increases when the water deficit is highest, in the combination of higher MCWD (more negative values) and a larger range of fluctuation of the WTD (bstd = 0.31, p < 0.001, Figure 2B). Among plots with a low WTD fluctuation range, WD decreases with phosphorus content (bstd = 0.39, p < 0.001, Figure 2C). A similar interaction pattern is recovered when the WD of the 498 individuals is averaged at the plot level (High WTD range: MCWD bstd = −0.05, p = 0.007; Low WTD range: MCWD bstd = −0.06, p = 0.72), although the most parsimonious model includes only MCWD (Table 2).
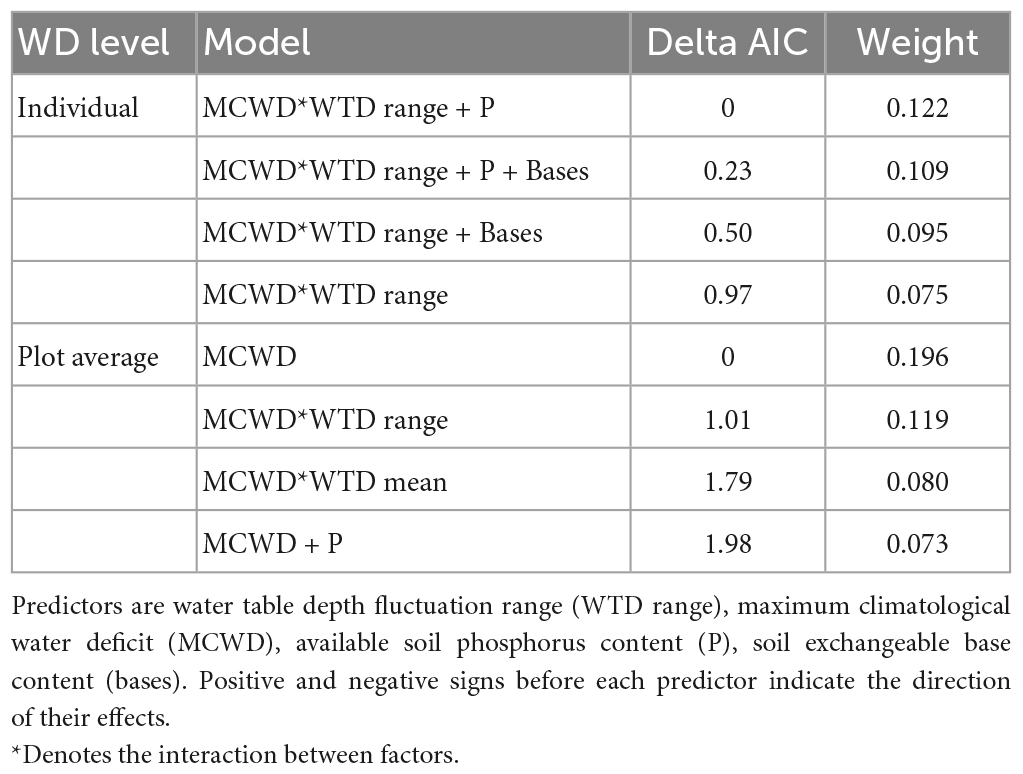
Table 2. Selection of models to predict wood density at the individual (N = 498) and plot levels, of 25 plots distributed along the Purus-Madeira interfluve, central Amazonia.
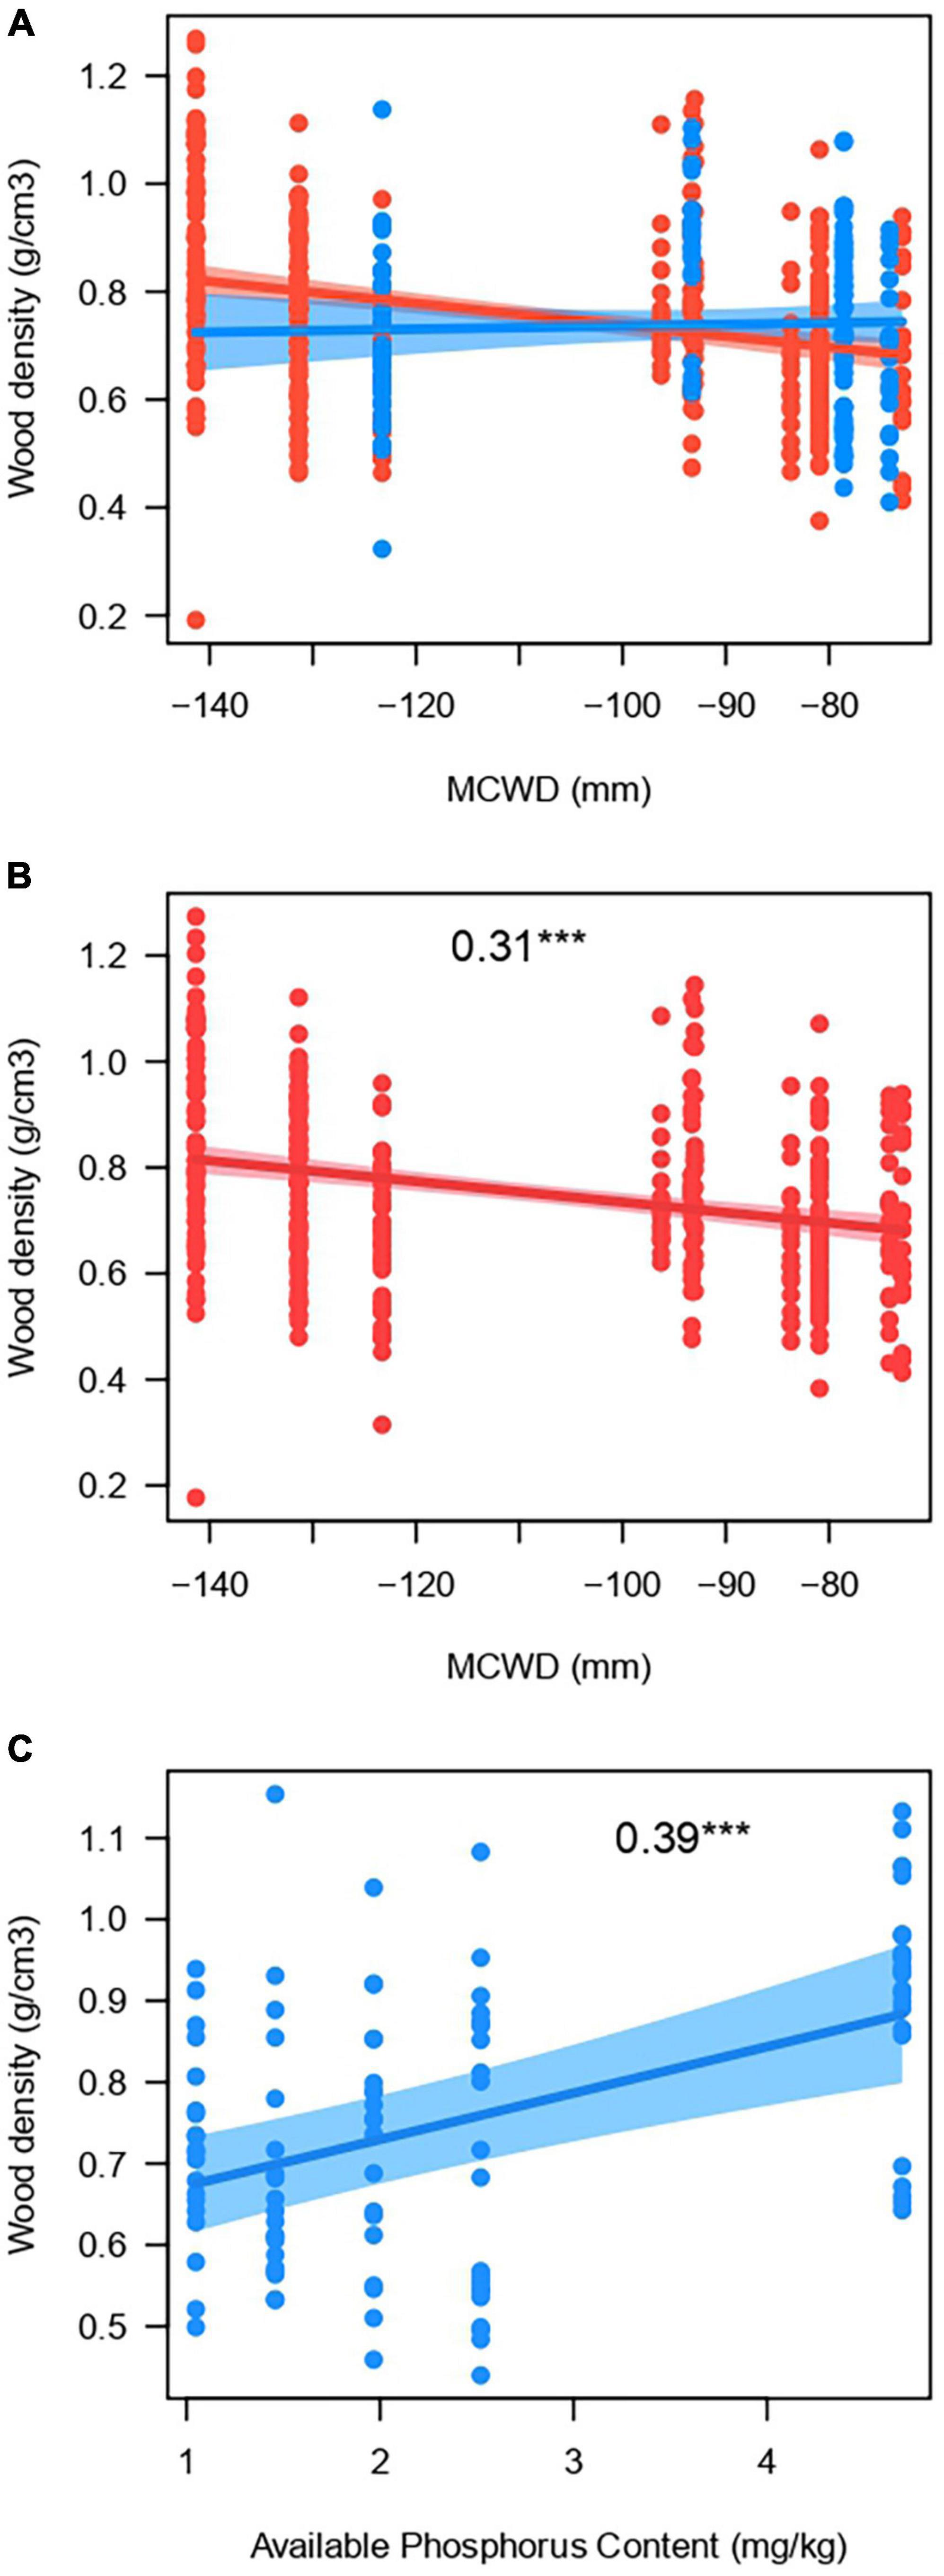
Figure 2. Plots of the best model to explain wood density (WD) of 498 individuals distributed in 25 plots along the Purus-Madeira interfluve, central Amazonia. (A) The effect of the interaction between maximum cumulative water deficit (MCWD) and water table depth fluctuation range (WTD range) on WD; in red the sites with high WTD range (>5 m) and blue the ones with low range (≤5 m). (B) The effect of MCWD on WD on plots with high (>5 m, red color as in (A)] water table depth fluctuation range. (C) The effect of soil phosphorus content on plots with low [<5 m, blue color as in (A)] water table depth fluctuation range. Standardized regression coefficients are shown inside plots, followed by the significance level (***p < 0.001).
Few species in our dataset had enough individuals for intraspecific analyses (five species with more than ten individuals). It was therefore not possible to implement a hierarchical model testing the contributions of within vs. between species to the WD differences along environmental gradients. When examining the regression models for the five most abundant species none of these showed a response to WTD mean or temporal fluctuation (Supplementary Table 3). A plot of wood density against WTD temporal fluctuation for all species shows that trends are varied and do not point to a single pattern, in contrast to the more consistent trends along the MCWD gradient (Supplementary Figure 2).
The models for the estimation of traits from spectroscopy attained a good to reasonable fit and had low errors for SLA (r2 = 0.83, %RMSEr = 0.11), LDMC (r2 = 0.78, %RMSE = 0.09) and LT (r2 = 0.63, %RMSEr = 0.15) (Supplementary Table 4 and Supplementary Figure 3). WTD fluctuation mean or range were included in the best models (<2 Δ AIC) to explain the community means of SLA and LT estimated with spectroscopy, generally in combination with soil nutrients (Table 3). The standard deviation of the WTD levels over time was not related to the community means of leaf traits. The best model for CMSLA included the WTD mean (bstd = 0.50, p < 0.05) and soil phosphorus content (bstd = 0.42, p < 0.05) and the second-best model included only the WTD mean (Δ AIC = 1.90). CMSLA increased with the phosphorus content and the WTD mean (Figures 3A, B). The best model for the CMLT only included phosphorus (bstd = −0.43, p < 0.05), the second best (Δ AIC = 0.32) included phosphorus (bstd = −0.52, p < 0.05) and the WTD mean (bstd = −0.30, p = 0.7), and the third (Δ AIC = 0.34) included the WTD fluctuation range and phosphorus. CMLT decreased with phosphorus and with WTD mean (Figures 3C, D). The best model for the CMLDMC included the sum of exchangeable bases (bstd = 0.40) and MCWD (bstd = 0.46), the second best (Δ AIC = 0.36), included phosphorus besides the previous two predictors, the third (Δ AIC = 1.97), included phosphorus and MCWD, and the WTD range was included only in the fourth best model (Δ AIC = 1.98). CMLDMC decreased with nutrients (both P and bases) and toward lower (less negative) MCWD (Figures 3E, F). Models based on a subset of plots excluding two with high phosphorus levels, which had large leverage, still produced very similar results, and only for SLA the effect of phosphorus dropped out of the models within 2 Δ AIC (Table 3). Models based on CM calculated only from individuals with traits estimated by NIR spectrometry (not including those imputed through taxonomy) produced also similar results, but with an inversion for LDMC and LT (WTD mean was the best predictor for LDMC, while only phosphorus predicted LT (Supplementary Table 5).
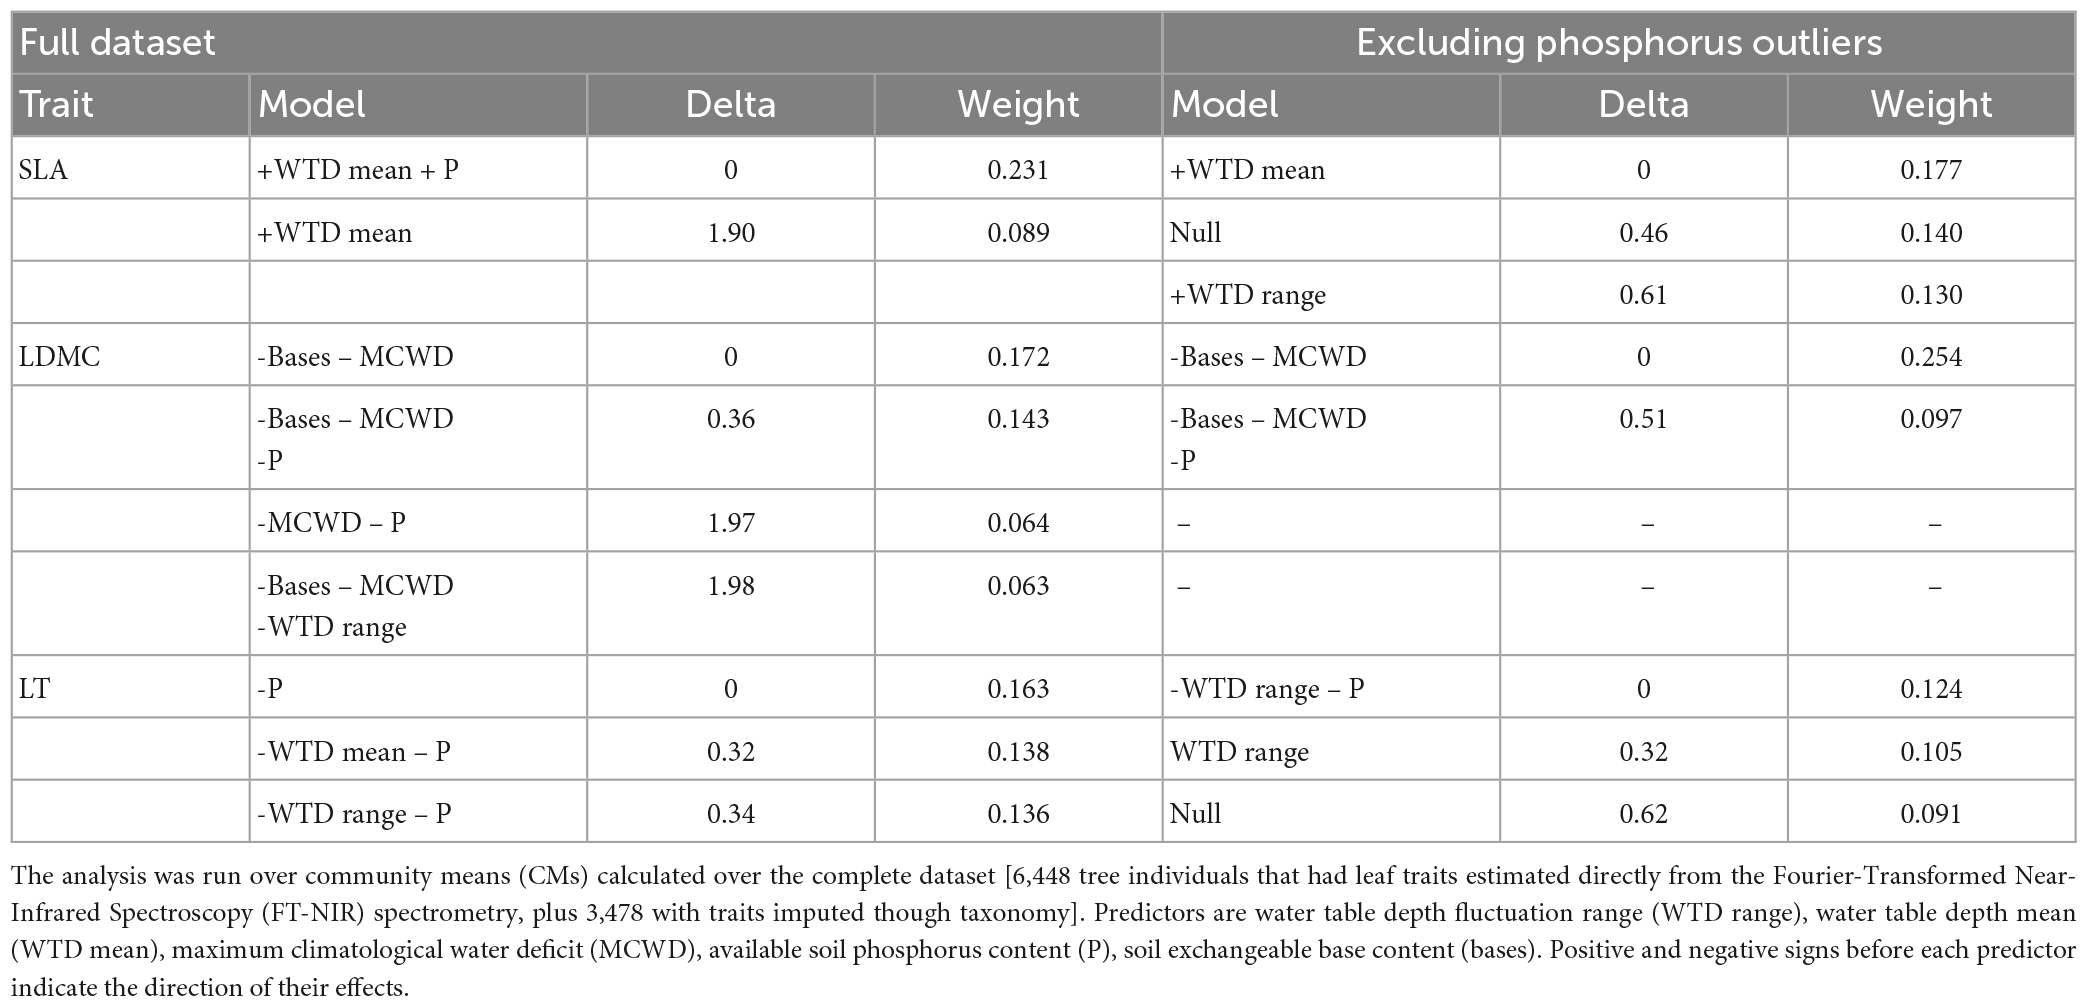
Table 3. Selection of models to predict the community means (CM) of the specific leaf area (SLA), leaf dry matter content (LDMC) and leaf thickness (LT) of 25 plots distributed along the Purus-Madeira interfluve, central Amazonia.
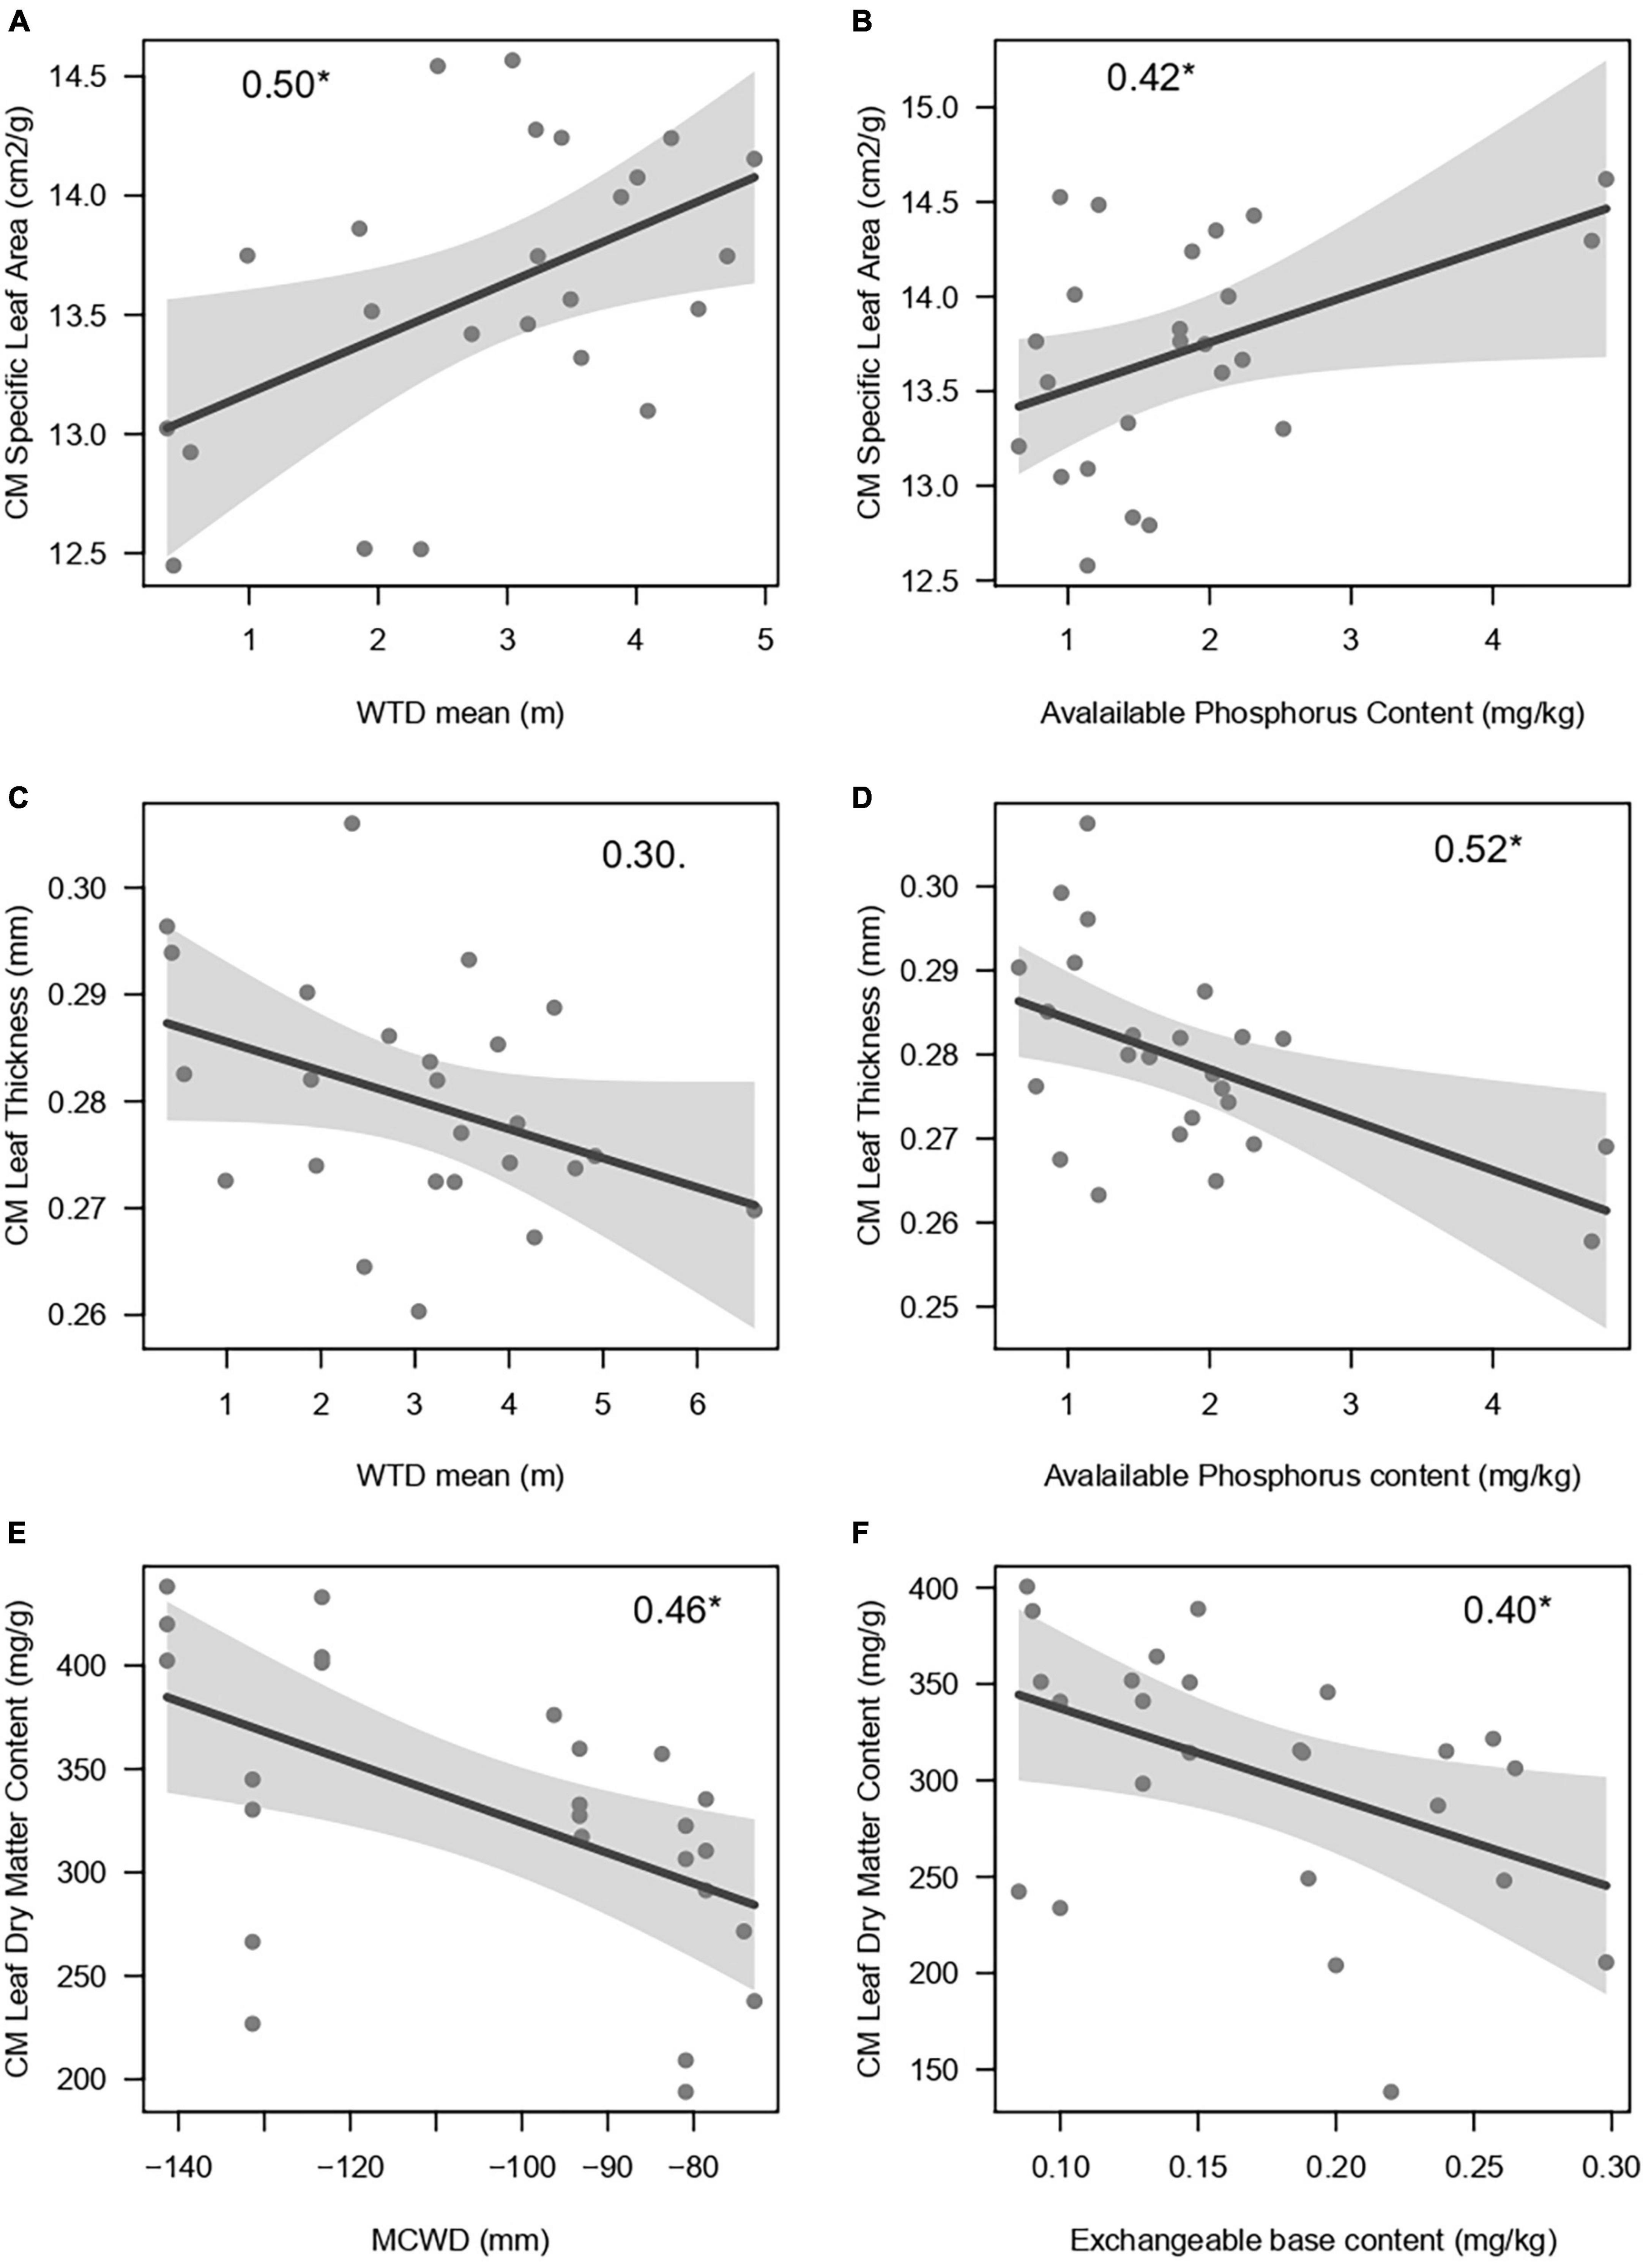
Figure 3. Plots of the best models to explain the community means of leaf traits of 25 plots distributed along the Purus-Madeira interfluve, central Amazonia. The analyses were run over community means (CMs) calculated with the complete dataset (6,448 tree individuals that had leaf traits estimated directly from the FT-NIR spectrometry, plus 3,478 with traits imputed though taxonomy). Panels (A, C, E) depict relationships of leaf traits with the hydrological predictors Water Table Depth (WTD) mean and Maximum Cumulative Water Deficit (MCWD). Panels (B, D, F) depict relationships of leaf traits with soil fertility metrics. Standardized regression coefficients are shown inside plots, followed by the significance level (p < 0.01, *p < 0.5). WTD, water table depth; MCWD, Maximum Cummulative Water Deficit.
Discussion
We proposed to test if the degree of variation in water table levels translates into divergent modes of trait selection, with low fluctuation of WTD levels (i.e., constantly shallow) leading to the selection of acquisitive traits, but the opposite (conservative traits) when the temporal WTD fluctuation is high. We first detected a taxonomic composition turnover along the gradient of WTD fluctuation range, indicating a turnover of families, genera, and species from forests with low to high WTD fluctuation ranges. This taxonomic turnover was accompanied by a change in wood traits, with higher wood density associated with the combination of high WTD fluctuation and high climatic water deficit, i.e., when the water deficit is higher. Leaf traits, however, varied mostly as a function of WTD mean and in the opposite direction than initially hypothesized, i.e., trees had more acquisitive traits toward intermediate WTD with higher fluctuation along the year. These results call for a re-appraisal of the initial hypothesis.
A quadratic model of trait variation along soil hydrology
Most of the literature so far indicates that shallow water tables (as compared to deep ones) select for acquisitive plant traits, such as lower wood density (Kraft et al., 2008; Ferry et al., 2010; Liu et al., 2014; Toledo et al., 2016; Cosme et al., 2017; Fontes et al., 2020), higher SLA (Kraft et al., 2008; Liu et al., 2014; Cosme et al., 2017; Fontes et al., 2020; Schmitt et al., 2020), and also hydraulically vulnerable plants with a low resistance to embolism (Oliveira et al., 2019; Fontes et al., 2020; Garcia et al., 2021). These trends agree with a conceptualization of shallow water table forests as environments with a dominance of wet soil conditions. At the same time, some results from forests in Amazonian white sand and floodplain forests (both habitats with large temporal water table fluctuations, either below or above ground) go in the opposite direction, showing higher leaf sclerophylly, i.e., higher leaf thickness and LMA in floodplain forests [review in Parolin et al. (2010)], and higher LMA, WD, and xylem resistance in white sand forests (Fontes et al., 2020). Parolin et al. (2010) have noted that “Many of the same anatomical characteristics that help a plant survive flooding can also alleviate drought stress … Morphological adaptations against drought stress include small, thick leaves with sclerophyllous structures and increased epicuticular waxes to reduce transpiration (Medina, 1983; Waldhoff et al., 1998). Such structures are found in the leaves of most Amazonian floodplain tree species.” According to those observations, we expected that within shallow water table sites, there would be another layer of differentiation of forests, manifested as groups of species with functional traits adjusted to divergent water table fluctuation regimes (low and high fluctuation).
However, we did not find results that support the hypothesis of divergent modes of trait selection according to the water table fluctuation regime in the expected direction, or in coordination among leaf and wood traits. This indicates that our initial hypothesis is not adequate to describe the functional organization of forests, and suggests that a new conceptualization of the effects of WTD on forests is needed to support further investigations. Although the literature shows an association of the wet conditions of shallow water table sites with acquisitive traits, most studies tend to contrast shallow to deep water table sites without a clear characterization of the WTD levels and fluctuation regimes, an important shortcoming to the understanding of mechanisms. How wet or waterlogged, and for how long, are the soils of forests where acquisitive traits have been documented? With the new results of this study, it becomes clear that not all the hydrological conditions created by shallow water tables lead to the selection of acquisitive traits, but also that the direction of the leaf trait selection is the reverse. Actually, based on the combination of these and previous literature results, we propose that the effect of WTD selection on traits should be conceptualized in a quadratic form. The gradient starts with (1) the shallowest WTD, where underground water levels remain close to the surface all or most of the year, i.e., anoxic and limiting conditions to growth may predominate leading to the selection of conservative leaf traits; then in (2) the intermediate positions where WTD levels are still shallow (<5 m deep) but the waterlogging is of short duration as the water table gets deep enough seasonally allowing soil aeration, the acquisitive traits may get selected as the limiting conditions imposed by water excess are small; and finally, (3) toward deeper WTD levels and especially if combined with soils with low water holding capacity, there should be again a selection of conservative traits due to the water deficit experienced at least seasonally. In short, the gradient goes from water excess (limiting condition) to moist (favorable condition) to water deficit (limiting condition again). This perspective had been put forward before by Costa et al. (2022), but the interpretation of the trait’s association was misled by the data focusing only on the shallow vs. deep WTD contrast. The perspective provided by the examination of the fine-scale variations of WTD in this study was crucial to detect the transition of conservative to acquisitive strategies within the group of shallow WTD sites. At the same time, it is important to note that this model describes mostly the leaf traits (see the discussion of wood density below).
In experimental settings, waterlogging has been shown to lead to increased LMA (i.e., decreased SLA), with the interpretation that the soil anaerobic environment limits root respiration and consequently root water uptake, thus representing a state physiologically analogous to water deficit, inducing the formation of conservative tissues (Poorter et al., 2009). At the same time, mild or less persistent waterlogging may be overcome by an efficient air diffusion system, as provided by intercellular spaces from leaf to root. A large amount of intercellular species in leaves reduces its mass relative to volume, and is generally associated to higher SLA (Poorter et al., 2009; Villar et al., 2013). The results found here indirectly indicate the extent of the waterlogging experienced by trees, which should be persistent on the sites where conservative leaf traits were consistently found.
Wood density did not change along the gradient of WTD temporal fluctuation as hypothesized, with higher wood density associated to high WTD fluctuation and vice-versa. Actually, higher wood densities were found when high WTD fluctuation occurred in climatically drier sites, i.e., when plants were exposed to longer seasonal dry periods and water table levels getting low mostly concomitantly (see Costa et al., 2022; Figure 3E). At the same time, we do not see any increase in wood density in sites with higher climatic water deficit when water table levels are more stable along the year. These results suggest a displacement of the quadratic model proposed above as the climate becomes drier. Then, under mostly wet climates (as described above), the sequence of filtering would be conservative-acquisitive-conservative as we move from shallow/constant to shallow/higher fluctuation to deep WTD. In drier climates, the first condition would be missing, maybe due to the higher transpiration demands decreasing the excess water in the very shallow WTD. Then the functional gradient following the WTD gradient would start with acquisitive plants where shallow WTD counterbalance the dry climate (favorable moist conditions), and then change straightly to conservative plants as the water table gets a little deeper and more fluctuating (water deficit). At the large scale of the Amazon basin, the results of Marca-Zevallos et al. (2022) somehow echo our findings here, when considering only the WTD mean – they found higher wood densities when higher climatic water deficits combine with deep water tables. These findings indicate that climate seasonality, together with water table depth mean and temporal variation affect tree wood density, and more broadly should affect the patterns of filtering of other traits as well.
We detected a compositional turnover along the gradient of WTD fluctuation range for all taxonomic levels. At the genus level this turnover was modulated by the climatic water deficit. Changes in species composition along topographic and WTD gradients are commonly documented (e.g., Valencia et al., 2004; Jirka et al., 2007; Costa et al., 2009; Schietti et al., 2014; Zuleta et al., 2020) and seem to underlie a large component of the functional turnover (Emilio et al., 2021; Rocha et al., 2022). Since water table depths and regimes are tightly linked to topography, they may vary widely within small areas, at the landscape level. The existence of this mosaic of different species assemblages within the landscape, due to WTD filtering, may prove critical to allow short to medium-term migration of resistant species to sites that may have lost species due to intensifying droughts. Thus, although areas with intermediate WTD and larger fluctuation select for acquisitive leaf traits and as such may suffer from droughts in the short-term, migration from near sites could buffer some of the negative effects in the medium-term. This hypothesis still needs to be validated, but suggests the need for conservation of large areas to provide the opportunity for migration.
Spectroscopy to advance functional mapping of forests
Previous studies have demonstrated that leaf reflectance can be used to estimate a series of biochemical and structural leaf traits. Most of these studies have focused on remote sensing (Curran, 1989; Kokaly and Clark, 2009; Asner et al., 2014; Martin et al., 2018), but another line of evidence has shown that some traits can be well-estimated from dry herbarium samples (Costa et al., 2018). We here advanced this field, by applying the NIR spectrometry to estimate leaf traits of more than 6,000 individuals, a density of sampling that would be unfeasible for direct measurements of even the simple functional traits used here. In the challenging conditions of fieldwork in remote areas of the Amazon as in this study, with no to very limited energy supply, temporary camps, limited space and time, taking pictures or scanning leaves, weighing, and drying this amount of specimens is simply not possible. Regional scale functional studies then tend to rely on the measurement of a small number of individuals of the most abundant species, with the known consequences of missing the intraspecific variation (Bolnick et al., 2011; Violle et al., 2012). The approach used here is similar in coverage to those based on remote sensing with airplanes (Asner et al., 2014), but of course much less expensive and thus accessible to tropical scientists. It provides a route to expand the field of functional biogeography.
Limitations of this study and the way forward
Although we have shown that WTD mean and temporal variation affects some of the traits examined here, the proposed new hypothesis needs to be examined across larger climate and soil gradients, since these also affect functional traits (e.g., ter Steege et al., 2006; Fyllas et al., 2009) and affect the temporal behavior of the water table levels (Costa et al., 2022). The greatest limitation to expand this study is the availability of in situ water table depth monitoring data for long enough periods to provide a good estimate of means and the temporal fluctuation. Although some models have estimated those properties across the Amazon (Miguez-Macho and Fan, 2012), the resolution of the products (∼ 270 m–1 km) is coarse in relation to the scale of the spatial changes in WTD (less than 100 m in many sites) and the related biological changes (Schietti et al., 2014). Thus, local hydrological monitoring, preferentially at the vegetation plots, is still necessary to allow proper tests of the controls of groundwater on the functioning of the Amazon.
Another limitation is the lack of root and hydraulic traits, which can be expected to be more directly related to the responses of plants to the hydrological environment. A link between plant hydraulics and the economic spectra has been proposed by Oliveira et al. (2021), such that acquisitive plants would also have lower resistance to embolism, what is supported by some data (Markesteijn et al., 2011), including also in the central Amazon (Cosme et al., 2017; Oliveira et al., 2019). Although this alignment of strategies can be expected to hold in general, alignments are seldom perfect and the diversity that derives from the mismatch needs to be investigated in wider hydrological contexts. Root depth is controlled by WTD, but we still don’t know if trees associated to sites with high temporal variation in WT levels have the capacity to grow roots fast enough to follow these seasonal WTD changes. Lopez and Kursar (2003) suggested that the capacity to make roots under flooded conditions and not flooding tolerance per se is potentially the trait that allows dominance of some species in conditions where water excess is followed by water deficit. Thus, the dynamics of root growth along soil profiles with changing hydrological conditions is a key trait to understand the responses of shallow WTD forests to climate change.
Our results are not conclusive on the contributions of intra and interspecific variation to the variation in wood density along the environmental gradients. Clearly, the sample size per species needs to increase to allow a better examination of this question. The existence of a clear species turnover along the gradient of WTD fluctuation range suggests that this component should have a strong contribution to the changes in functional properties. At the same time, intraspecific variation of some traits according to WTD have also been found (Schmitt et al., 2020; Garcia et al., 2021), pointing to the need of a larger effort to understand the potential for adjustments of species to the changing hydrological conditions as climate changes.
Conclusion
The results obtained here suggest that forests in very shallow and constant WT, under wet climates, may be resistant to climate change induced droughts through more than one protective mechanism — the permanence of wet conditions even during droughts but also through the more conservative traits. At the same time, forests in intermediate shallow water tables that potentially fluctuate more over time will be protected as long as water table levels do not drop strongly. The mostly acquisitive functional traits of these forests prompt them to be more vulnerable if the water supply is strongly decreased. This is, however, a preliminary conclusion, since the response of forests depends on the combination of plant traits and the intensity and frequency of changes in the climate (see Costa et al., 2022). Clearly, the model proposed here to explain changes in tree functional traits along soil hydrological gradients needs to be evaluated in a wider context, considering other geological and geomorphological settings, and under a broader climatic gradient, which may result in different water table behaviors. Most importantly, WTD and MCWD are only proxies of the water content in the soil, which is the variable that actually affects plants and needs to be quantified properly to allow greater understanding of the functioning of forests.
Data availability statement
The datasets analyzed for this study are available in the forestplots.net repository (data on the floristic inventory), and the PPBio (https://ppbio.inpa.gov.br/en/repository) repository (data on functional traits).
Author contributions
FC conceptualized the study. CL, TS, TE, AE-M, and JS collected data. FC and CL analyzed the data. FC drafted the manuscript with contributions from JS and CL. All authors contributed to the article and approved the submitted version.
Funding
The funding for data collection was provided by Conselho Nacional de Desenvolvimento Científico e Tecnológico — CNPq via grants Hidroveg (473308/2009-6), PPBio Manaus (558318/2009-6). FINEP and CNPq, grant to Projeto Cenários (52.0103/2009-2), Amazonas State Research Foundation (FAPEAM) and São Paulo State Research Foundation (FAPESP), grant to Hidroveg (465/2010), Amazonas State Research Foundation (FAPEAM) and Newton Fund via the Natural Environment Research Council (NE/M022021/1), and Amazonas State Research Foundation (FAPEAM) grant to PRONEX-FAPEAM (1600/2006). Student fellowships and support to Graduate Programs at INPA were granted by the Coordenação de Aperfeiçoamento de Pessoal de Nível Superior—Brasil (CAPES)—Finance Code 001.
Acknowledgments
We thank the infrastructure provide by the Instituto Nacional de Pesquisas da Amazônia (INPA), the Programa de Pesquisa em Biodiversidade (PPBio) Manaus, INCT CENBAM and RAINFOR, and the field assistants and residents of the BR-319 highway who helped in the logistics and data collection, and without whom this research would not be possible.
Conflict of interest
The authors declare that the research was conducted in the absence of any commercial or financial relationships that could be construed as a potential conflict of interest.
The handling editor GV declared a past co-authorship with the author FC.
Publisher’s note
All claims expressed in this article are solely those of the authors and do not necessarily represent those of their affiliated organizations, or those of the publisher, the editors and the reviewers. Any product that may be evaluated in this article, or claim that may be made by its manufacturer, is not guaranteed or endorsed by the publisher.
Supplementary material
The Supplementary Material for this article can be found online at: https://www.frontiersin.org/articles/10.3389/ffgc.2023.1112560/full#supplementary-material
References
Abatzoglou, J. T., Dobrowski, S. Z., Parks, S. A., and Hegewisch, K. C. (2018). TerraClimate, a high-resolution global dataset of monthly climate and climatic water balance from 1958–2015. Sci. Data 5:170191. doi: 10.1038/sdata.2017.191
Acuna, M. A. and Murphy, G. E. (2006). Use of near infrared spectroscopy and multivariate analysis to predict wood density of Douglas-fir from chain saw chips. Forest. Prod. J. 56, 67–72.
Aragão, L. E. O. C., Malhi, Y., Roman-Cuesta, R. M., Saatchi, S., Anderson, L. O., and Shimabukuro, Y. E. (2007). Spatial patterns and fire response of recent Amazonian droughts. Geophys. Res. Lett. 34, 1–5. doi: 10.1029/2006GL028946
Asner, G. P., Martin, R. E., Carranza-Jimenez, L., Sinca, F., Tupayachi, R., Anderson, C. B., et al. (2014). Functional and biological diversity of foliar spectra in tree canopies throughout the Andes to Amazon region. New Phytol. 204, 127–139. doi: 10.1111/nph.12895
Bolnick, D. I., Amarasekare, P., Araújo, M. S., Bürger, R., Levine, J. M., Novak, M., et al. (2011). Why intraspecific trait variation matters in community ecology. Trends Ecol. Evol. 26, 183–192. doi: 10.1016/j.tree.2011.01.009
Braga, J. W. B., Pastore, T. C. M., Coradin, V. T. R., Camargos, J. A. A., and da Silva, A. R. (2011). The use of near infrared spectroscopy to identify solid wood specimens of Swietenia macrophylla (CITES APPENDIX II) Jez. IAWA 22, 68–74.
Cavender-Bares, J., Gamon, J. A., Hobbie, S. E., Madritch, M. D., Meireles, J. E., Schweiger, A. K., et al. (2017). Harnessing plant spectra to integrate the biodiversity sciences across biological and spatial scales. Am. J. Bot. 104, 966–969. doi: 10.3732/ajb.1700061
Cosme, L. H. M., Schietti, J., Costa, F. R. C., and Oliveira, R. S. (2017). The importance of hydraulic architecture to the distribution patterns of trees in a central Amazonian forest. New Phytol. 215, 113–125. doi: 10.1111/nph.14508
Costa, F. R. C., and Magnusson, W. E. (2010). The need for large-scale, integrated studies of biodiversity - the experience of the program for biodiversity research in Brazilian Amazonia. Nat. Conserv. 8, 3–12. doi: 10.4322/natcon.00801001
Costa, F. R. C., Guillaumet, J. L., Lima, A. P., and Pereira, O. S. (2009). Gradients within gradients: The mesoscale distribution patterns of palms in a central Amazonian forest. J. Veg. Sci. 20, 69–78. doi: 10.1111/j.1654-1103.2009.05314.x
Costa, F. R. C., Lang, C., Almeida, D. R. A., Castilho, C. V., and Poorter, L. (2018). Near-infrared spectrometry allows fast and extensive predictions of functional traits from dry leaves and branches. Ecol. Appl. 28, 1157–1167. doi: 10.1002/eap.1728
Costa, F. R. C., Schietti, J., Stark, S. C., and Smith, M. N. (2022). The other side of tropical forest drought: Do shallow water table regions of Amazonia act as large-scale hydrological refugia from drought? New Phytol 237, 703–706. doi: 10.1111/nph.17914
Couture, J. J., Singh, A., Rubert-Nason, K. F., Serbin, S. P., Lindroth, R. L., and Townsend, P. A. (2016). Spectroscopic determination of ecologically relevant plant secondary metabolites. Methods Ecol. Evol. 7, 1402–1412. doi: 10.1111/2041-210X.12596
Curran, P. J. (1989). Remote-sensing of foliar chemistry. Remote Sens. Environ. 30, 271–278. doi: 10.1016/0034-4257(89)90069-2
De Cáceres, M., and Legendre, P. (2022). Associations between species and groups of sites: Indices and statistical inference. Ecology 90, 3566–3574. doi: 10.1890/08-1823.1
Donagema, G. K., de Campos D. V. B, Calderano S. B., Teixeira W. G., and Viana J. H. M. (2011). Manual de métodos de análises de solo. Rio de Janeiro: Embrapa Solos.
Dufrêne, M., and Legendre, P. (1997). Species assemblages and indicator species: The need for a flexible asymmetrical approach. Ecol. Monogr. 67, 345–366. doi: 10.2307/2963459
Emilio, T., Pereira, H., and Costa, F. R. C. (2021). Intraspecific variation on palm leaf traits of co-occurring species—does local hydrology play a role? Front. For. Glob. Chang. 4:715266. doi: 10.3389/ffgc.2021.715266
Esteban, E. J. L., Castilho, C. V., Melgaço, K. L., and Costa, F. R. C. (2020). The other side of droughts: Wet extremes and topography as buffers of drought negative effects in an Amazonian forest. New Phytol 229, 1995–2006. doi: 10.1111/nph.17005
Fan, Y., Miguez-Macho, G., Jobbágy, E. G., Jackson, R. B., and Otero-Casal, C. (2017). Hydrologic regulation of plant rooting depth. Proc. Natl. Acad. Sci. U.S.A. 114, 10572–10577. doi: 10.1073/pnas.1712381114
Ferry, B., Morneau, F., Bontemps, J. D., Blanc, L., and Freycon, V. (2010). Higher treefall rates on slopes and waterlogged soils result in lower stand biomass and productivity in a tropical rain forest. J. Ecol. 98, 106–116. doi: 10.1111/j.1365-2745.2009.01604.x
Fontes, C. G., Fine, P. V. A., Wittmann, F., Bittencourt, P. R. L., Piedade, M. T. F., Higuchi, N., et al. (2020). Convergent evolution of tree hydraulic traits in Amazonian habitats: Implications for community assemblage and vulnerability to drought. New Phytol. 228, 106–120. doi: 10.1111/nph.16675
Fyllas, N. M., Patino, S., Baker, T. R., Bielefeld Nardoto, G., Martinelli, L. A., Quesada, C. A., et al. (2009). Basin-wide variations in foliar properties of Amazonian forest: Phylogeny, soils and climate. Biogeosciences 6, 2677–2708. doi: 10.5194/bg-6-2677-2009
Gale, N., and Hall, P. (2001). Factors determining the modes of tree death in three bornean rain forests. J. Veg. Sci. 12, 337–346.
Garcia, M. N., Hu, J., Domingues, T. F., Groenendijk, P., Oliveira, R. S., and Costa, F. R. C. (2021). Local hydrological gradients structure high intraspecific variability in plant hydraulic traits in two dominant central Amazonian tree species. J. Exp. Bot. 73, 939–952. doi: 10.1093/jxb/erab432
Homolová, L., Malenovsky, Z., Clevers, J. G. P. W., Garcia-Santos, G., and Schaepman, M. E. (2013). Review of optical-based remote sensing for plant trait mapping. Ecol. Complex. 15, 1–16. doi: 10.1016/j.ecocom.2013.06.003
Jirka, S., McDonald, A. J., Johnson, M. S., Feldpausch, T. R., Couto, E. G., and Riha, S. J. (2007). Relationships between soil hydrology and forest structure and composition in the southern Brazilian Amazon. J. Veg. Sci. 18, 183–194. doi: 10.1111/j.1654-1103.2007.tb02529.x
Kraft, N. J. B., Forest, A., Valencia, R., and Ackerly, D. D. (2008). Functional traits and niche-based tree community assembly in an Amazonian forest. Science 322, 580–582. doi: 10.1126/science.1160662
Kokaly R. F. and Clark, R. N. (2009). Spectroscopic determination of leaf biochemistry using band-depth analysis of absorption features and stepwise multiple linear regression. Remote Sens. Environ. 67, 267–287. doi: 10.1016/S0034-4257(98)00084-4
Lang, C. (2020). Espectroscopia do Infravermelho Próximo (FT-NIR) como um atalho para estudos funcionais e taxonômicos em larga escala na Amazônia. Tese de Doutorado. Manaus: Instituto Nacional de Pesquisas da Amazônia (INPA).
Liland, K. H., Mevik, B.-H., Wehrens, R., and Hiemstra, P. (2022). Package pls: Partial Least Squares and Principal Component Regression. R Package Version 2.8.1.
Liu, J., Yunhong, T., and Slik, J. W. F. (2014). Topography related habitat associations of tree species traits, composition and diversity in a Chinese tropical forest. For. Ecol. Manag. 330, 75–81. doi: 10.1016/j.foreco.2014.06.045
Lopez, O. R., and Kursar, T. A. (2003). Does flood tolerance explain tree species distribution in tropical seasonally flooded habitats? Oecologia 136, 193–204. doi: 10.1007/s00442-003-1259-7
MacNally, R. (2000). Regression and model-building in conservation biology, biogeography and ecology: The distinction between–and reconciliation of–’predictive’and ‘explanatory’models. Biodivers. Conserv. 9, 655–671. doi: 10.1023/A:1008985925162
Marca-Zevallos, M. J., Moulatlet, G. M., Sousa, T. R., Schietti, J. Coelho, L. D. S. (2022). Local hydrological conditions influence tree diversity and composition across the Amazon basin. Ecography 79, 23–30. doi: 10.1111/ecog.06125
Markesteijn, L., Poorter, L., Bongers, F., Paz, H., and Sack, L. (2011). Hydraulics and life history of tropical dry forest tree species: Coordination of species’ drought and shade tolerance. New Phytol. 191, 480–495. doi: 10.1111/j.1469-8137.2011.03708.x
Martin, R. E., Chadwick, K. D., Brodrick, P. G., Carranza-Jimenez, L., Vaughn, N. R., and Asner, G. P. (2018). An approach for foliar trait retrieval from airborne imaging spectroscopy of tropical forests. Remote Sens. 10:199. doi: 10.3390/rs10020199
McCune, B., and Grace, J. B. (2002). Analysis of ecological communities. Gleneden Beach, OR: MjM Software Design.
Medina, E. (1983). “Adaptations of tropical trees to moisture stress.” in: Ecosystems of the world: Tropical rain forest ecosystems, ed. F. B. Golley (Amsterdam: Elsevier Scientific Publishing Co.), 225–237.
Miguez-Macho, G., and Fan, Y. (2012). The role of groundwater in the Amazon water cycle: 1. Influence on seasonal streamflow, flooding and wetlands. J. Geophys. Res. Atmos. 117, 1–30. doi: 10.1029/2012JD017539
Mommer, L., Lenssen, J. P. M., Huber, H., Visser, E. J. W., and De Kroon, H. (2006). Ecophysiological determinants of plant performance under flooding: A comparative study of seven plant families. J. Ecol. 94, 1117–1129. doi: 10.1111/j.1365-2745.2006.01175.x
Moulatlet, G. M., Costa, F. R. C., Rennó, C. D., Emilio, T., and Schietti, J. (2014). Local hydrological conditions explain floristic composition in lowland Amazonian forests. Biotropica 46, 395–403. doi: 10.1111/btp.12117
Muelbert, A. E., Brienen, R. J. W., Baker, T. R., Dexter, K. G., Lewis, S. L., Feldpausch, T. R., et al. (2019). Compositional response of Amazon forests to climate change. Glob. Chang. Biol. 25, 39–56. doi: 10.1111/gcb.14413
Nicolaï, B. M., Beullens, K., Bobelyn, E., Peirs, A., Saeys, W., Theron, K. I., et al. (2007). Nondestructive measurement of fruit and vegetable quality by means of NIR spectroscopy: A review. Postharvest Biol. Technol. 46, 99–118. doi: 10.1016/j.postharvbio.2007.06.024
Oksanen, J., Blanchet, F. G., Friendly, M., Kindt, R., Legendre, P., Mcglinn, D., et al. (2019). Package “vegan” Title community ecology package (version 2.6-2). Available online at: https://cran.r-project.org/web/packages/vegan/vegan.pdf (accessed April 2022).
Oliveira, R. S., Costa, F. R. C., van Baalen, E., de Jonge, A., Bittencourt, P. R., Almanza, Y., et al. (2019). Embolism resistance drives the distribution of Amazonian rainforest tree species along hydro-topographic gradients. New Phytol. 221, 1457–1465. doi: 10.1111/nph.15463
Oliveira, R. S., Eller, C. B., Barros, F.V., Hirota, M., Brum, M., Bittencourt, P., et al. (2021). Linking plant hydraulics and the fast–slow continuum to understand resilience to drought in tropical ecosystems. New Phytol. 230, 904–923. doi: 10.1111/nph.17266
Paine, C. E. T., Baraloto, C., Chave, J., and Herault, B. (2011). Functional traits of individual trees reveal ecological constraints on community assembly in tropical rain forests. Oikos 120, 720–727. doi: 10.1111/j.1600-0706.2010.19110.x
Parolin, P., Lucas, C., Piedade, M. T. F., and Wittmann, F. (2010). Drought responses of flood-tolerant trees in Amazonian floodplains. Ann. Bot. 105, 129–139. doi: 10.1093/aob/mcp258
Pastore, T. C. M., Braga, J. W. B., Coradin, V. T. R., Magalhães, W. L. E., Okino, E. Y. A., Camargos, J. A. A., et al. (2011). Near infrared spectroscopy (NIRS) as a potential tool for monitoring trade of similar woods: Discrimination of true mahogany, cedar, andiroba, and curupixá. Holzforschung 65, 73–80. doi: 10.1515/HF.2011.010
Poorter, H., Niinemets, Ü, Poorter, L., Wright, I. J., and Villar, R. (2009). Causes and consequences of variation in leaf mass per area (LMA): A meta-analysis. New Phytol. 182, 565–588. doi: 10.1111/j.1469-8137.2009.02830.x
Rocha, H. R., Goulden, M. L., Miller, S. D., Menton, M. C., Pinto, L. D. V. O., De Freitas, H. C., and Silva Figueira, A. M. (2004). Seasonality of water and heat fluxes over a tropical forest in eastern Amazonia. Ecol. Appl. 14, S22–S32. doi: 10.1890/02-6001
Rocha, E. X., Nogueira, A., Costa, F. R. C., Burnham, R. J., Gerolamo, C. S., and Schietti, C. F. H. J. (2022). Liana functional assembly along the hydrological gradient in Central Amazonia. Oecologia 200, 183–197. doi: 10.1007/s00442-022-05258-w
Roebroek, C. T. J., Melsen, L. A., Van Dijke, A. J. H., Fan, Y., and Teuling, A. J. (2020). Global distribution of hydrologic controls on forest growth. Hydrol. Earth Syst. Sci. 24, 4625–4639. doi: 10.5194/hess-24-4625-2020
Schietti, J., Emilio, T., Rennó, C. D., Drucker, D. P., Costa, F. R. C., Nogueira, A., et al. (2014). Vertical distance from drainage drives floristic composition changes in an Amazonian rainforest. Plant Ecol. Divers. 7, 241–253. doi: 10.1080/17550874.2013.783642
Schmitt, S., Hérault, B., Ducouret, É, Baranger, A., Tysklind, N., Heuertz, M., et al. (2020). Topography consistently drives intra- and inter-specific leaf trait variation within tree species complexes in a Neotropical forest. Oikos 129, 1521–1530. doi: 10.1111/oik.07488
Serbin, S. P., Singh, A., McNeil, B. E., Kingdon, C. C., and Townsend, P. A. (2014). Spectroscopic determination of leaf morphological and biochemical traits for northern temperate and boreal tree species. Ecol. Appl. 24, 1651–1669. doi: 10.1890/13-2110.1
Sombroek, W. (2000). Amazon landforms and soils in relation to biological diversity. Acta Amaz. 30:81. doi: 10.1590/1809-43922000301100
Sombroek, W. (2001). Spatial and temporal patterns of Amazon rainfall consequences for the planning of agricultural occupation and the protection of primary forests. AMBIO 30, 388–396.
Sousa, T. R., Schietti, J., Coelho de Souza, F., Esquivel-Muelbert, A., Ribeiro, I. O., Emílio, T., et al. (2020). Palms and trees resist extreme drought in Amazon forests with shallow water tables. J. Ecol. 108, 2070–2082. doi: 10.1111/1365-2745.13377
Sousa, T. R., Schietti, J., Ribeiro, I. O., Emílio, T., Fernández, R. H., ter Steege, H., et al. (2022). Water table depth modulates productivity and biomass across Amazonian forests. Glob. Ecol. Biogeogr. 32, 1571–1588. doi: 10.1111/geb.13531
ter Steege, H., Pitman, N. C. A., Phillips, O. L., Chave, J., Sabatier, D., Duque, A., et al. (2006). Continental-scale patterns of canopy tree composition and function across Amazonia. Nature 443, 444–447. doi: 10.1038/nature05134
Toledo, J. J., Castilho, C. V., Magnusson, W. E., and Nascimento, H. E. M. (2016). Soil controls biomass and dynamics of an Amazonian forest through the shifting of species and traits. Brazilian J. Bot. 40, 451–461. doi: 10.1007/s40415-016-0351-2
Tsuchikawa, S. and Kobori, H. (2015). A review of recent application of near infrared spectroscopy to wood science and technology. J. Wood Sci. 61, 213–220. doi: 10.1007/s10086-015-1467-x
Valencia, R., Foster, R. B., Villa, G., Condit, R., Svenning, J. C., Hernández, C., et al. (2004). Tree species distributions and local habitat variation in the Amazon: Large forest plot in eastern Ecuador. J. Ecol. 92, 214–229. doi: 10.1111/j.0022-0477.2004.00876.x
Villar, R., Ruiz-Robleto, J., Ubera, J. L., and Poorter, H. (2013). Exploring variation in leaf mass per area (LMA) from leaf to cell: An anatomical analysis of 26 woody species. Am. J. Bot. 100, 1969–1980. doi: 10.3732/ajb.1200562
Violle, C., Enquist, B. J., McGill, B. J., Jiang, L., Albert, C. H., Hulshof, C., et al. (2012). The return of the variance: Intraspecific variability in community ecology. Trends Ecol. Evol. 27, 244–252. doi: 10.1016/j.tree.2011.11.014
Waldhoff, D., Junk, W. J., and Furch, B. (1998). Responses of three Amazonian tree species to drought and flooding under controlled conditions. Int. J. Ecol. Environ. Sci. 24, 237–252.
Keywords: functional biogeography, local hydrology, soil hydrology, topography, tropical forest
Citation: Costa FRC, Lang C, Sousa TR, Emilio T, Esquivel-Muelbert A and Schietti J (2023) Fine-grained water availability drives divergent trait selection in Amazonian trees. Front. For. Glob. Change 6:1112560. doi: 10.3389/ffgc.2023.1112560
Received: 30 November 2022; Accepted: 12 April 2023;
Published: 05 May 2023.
Edited by:
Geertje M. F. Van Der Heijden, University of Nottingham, United KingdomReviewed by:
Kaihao Cheng, The University of Hong Kong, Hong Kong SAR, ChinaDavid Bartholomew, Umeå University, Sweden
Copyright © 2023 Costa, Lang, Sousa, Emilio, Esquivel-Muelbert and Schietti. This is an open-access article distributed under the terms of the Creative Commons Attribution License (CC BY). The use, distribution or reproduction in other forums is permitted, provided the original author(s) and the copyright owner(s) are credited and that the original publication in this journal is cited, in accordance with accepted academic practice. No use, distribution or reproduction is permitted which does not comply with these terms.
*Correspondence: Flávia R. C. Costa, flaviacosta001@gmail.com