Mapping with height and spectral remote sensing implies that environment and forest structure jointly constrain tree community composition in temperate coniferous forests of eastern Washington, United States
 David M. Bell
 Matthew J. Gregory2
  Annie C. Smith
- 1Pacific Northwest Research Station, USDA Forest Service, Corvallis, OR, United States
- 2College of Forestry, Oregon State University, Corvallis, OR, United States
- 3Forest Resilience Division, Washington Department of Natural Resources, Olympia, WA, United States
Maps of species composition are important for assessing a wide range of ecosystem functions in forested landscapes, including processes shaping community structure at broader (e.g., climate) and finer (e.g., disturbance) scales. Incorporating recently available remotely sensed datasets has the potential to improve species composition mapping by providing information to help predict species presence and relative abundance. Using USDA Forest Service Forest Inventory and Analysis plot data and the gradient nearest neighbor imputation modeling approach in eastern Washington, USA, we developed tree species composition and structure maps based on climate, topography, and two sources of remote sensing: height from digital aerial photogrammetry (DAP) of pushbroom aerial photography and Sentinel-2 multispectral satellite imagery. We tested the accuracy of these maps based on their capacity to predict species occurrence and proportional basal area for 10 coniferous tree species. In this study region, climate, topography, and location explained much of the species occurrence patterns, while both DAP and Sentinel-2 data were also important in predicting species proportional basal area. Overall accuracies for the best species occurrence model were 68–92% and R2 for the proportional basal area was 0.08–0.55. Comparisons of model accuracy with and without remote sensing indicated that adding some combination of DAP metrics and/or Sentinel-2 imagery increased R2 for the proportional basal area by 0.25–0.45, but had minor and sometimes negative effects on model skill and accuracy for species occurrence. Thus, species ranges appear most strongly constrained by environmental gradients, but abundance depends on forest structure, which is often determined by both environment and disturbance history. For example, proportional basal area responses to moisture limitation and canopy height varied by species, likely contributing to regional patterns of species dominance. However, local-scale examples indicated that remotely sensed forest structures representing recent disturbance patterns likely impacted tree community composition. Overall, our results suggest that characterizing geospatial patterns in tree communities across large landscapes may require not only environmental factors like climate and topography, but also information on forest structure provided by remote sensing.
Introduction
Mapping tree species across large extents is critical for climate vulnerability assessments and adaptation planning across the globe (Stohlgren and Schnase, 2006; Aubin et al., 2018). Ecologists have often used tools like species distribution or niche modeling to quantify species distribution in terms of presence and absence along environmental gradients (Elith et al., 2006; Franklin, 2013). However, these environmental gradients alone may not capture community structure and species abundances (Canham and Thomas, 2010). Plant community assembly and structure depend on drivers at multiple spatial and temporal scales, including climate, topography, and disturbance (Brown et al., 2017). The use of remote sensing, which captures the current state of habitat characteristics or even direct observations of the species being studied, could dramatically advance our capacity to map community structure (Zimmermann et al., 2007; He et al., 2015). Remote sensing research focused on measures of diversity, forest types, or dominant species with multispectral, hyperspectral, or airborne lidar data (e.g., Laurin et al., 2016; Axelsson et al., 2021) has increased in frequency over the last three decades (Fassnacht et al., 2016). It is critical that we understand how interacting drivers might produce observed tree community patterns in complex landscapes and tree species mapping based on remote sensing may support such efforts.
In addition to understanding drivers of tree community structure, tree species mapping may support forest management in the face of an uncertain future. Under predicted climate change, we expect that temperate coniferous forests like those found in eastern Washington, USA, will likely experience greater frequency and severity of disturbance, such as wildfire (Westerling et al., 2006; Moritz et al., 2012; Westerling, 2016), insects outbreaks (Kolb et al., 2016), drought (Williams et al., 2012), and their interacting effects (Loehman et al., 2017; Agne et al., 2018), potentially leading to major changes in forests globally (Allen et al., 2015; Millar and Stephenson, 2015). Forest management increasingly aims to increase forest resistance and resilience to climate change and shifts in disturbance regimes (Schoennagel et al., 2017; Prichard et al., 2021; North et al., 2022), although the capacity of these forests to withstand such stressors may be declining (Forzieri et al., 2022). Management may be guided by regional monitoring and assessment programs that identify where disturbances are occurring (Kennedy et al., 2014; McDowell et al., 2015), the distribution of forests vulnerable to those disturbances (Littell et al., 2011; Mildrexler et al., 2016), and where forest management might help to restore ecosystem structure and function to minimize that vulnerability (Haugo et al., 2015; Hessburg et al., 2015; DeMeo et al., 2018; Barros et al., 2019). Because disturbance potential, forest vulnerability, and appropriate management approaches all depend on the status of forest stands and their configuration within their landscapes, managers require spatially explicit data characterizing not just species presence and absence, but tree community composition and structure (Washington State Department of Natural Resources, 2020).
Broadly distributed and consistently measured national forest inventory data characterize the tree communities across regions (e.g., tree species, densities, and diameters) and when integrated with multispectral satellite remote sensing can form the basis for wall-to-wall mapping of measured forest attributes (McRoberts and Tomppo, 2007; Tomppo et al., 2008; White et al., 2016). Multispectral satellite remote sensing (e.g., Landsat, Sentinel-2) is appealing for forest mapping using sparse forest inventory data because of its low cost, global coverage, long-temporal record, large scene-size, and the spectral and spatial resolution appropriate for characterizing vegetation attributes (Cohen and Goward, 2004). Furthermore, the Landsat and Sentinel-2 mutlispectral time-series likely serve as a good basis for forest composition mapping at national scales (Fassnacht et al., 2016). For example, the USDA Forest Service Forest Inventory and Analysis (FIA) plots and 30-m, multi-decadal, multispectral Landsat satellite imagery support regional (Davis et al., 2015; Bell et al., 2021) and national (Riley et al., 2016) mapping of forest structure and composition in the United States. Still, regional and national mapping of tree species composition remains challenging.
Challenges in tree species mapping highlight not only technical vegetation mapping difficulties but also fundamental uncertainties in factors controlling tree community patterns in managed and unmanaged landscapes. Recent regional and national tree community composition mapping efforts in USA and elsewhere may rely on spectral indices and seasonal dynamics in imagery from MODIS (e.g., Isaacson et al., 2012; Wilson et al., 2012; Zhang et al., 2018), Landsat (e.g., Ohmann et al., 2011; Adams et al., 2020), and Sentinel-2 (Hoscilo and Lewandowska, 2019; Malcolm et al., 2021) multispectral imagery. However, due to the fact that many forested areas contain multiple tree species that vary in occurrence and abundance at fine spatial scales, there is a need for finer-scale remote sensing that can capture variation in forest composition and structure. For example, adding forest canopy height information derived from lidar dramatically improved forest structure predictions in central Oregon, USA, but resulted in inconsistent improvements in the prediction of species occurrence (Zald et al., 2014). Environmental gradients can dominate the mapping of species occurrence at broad scales (Ohmann and Gregory, 2002; Ohmann et al., 2011), but may have little effect on species abundance within their distribution (Canham and Thomas, 2010; Canham and Murphy, 2016). Abundance and occurrence are clearly not independent, sometimes requiring the modification of mapped species data based on their known ranges (Duveneck et al., 2015), presumably to reduce commission when species are predicted beyond their known extent. Even after constructing models and maps, species presence and abundance are likely to covary due to unaccounted for drivers or interactions among species (Clark et al., 2014; Pollock et al., 2014).
The emergence of new remote sensing platforms may provide a basis for improving species composition mapping by providing structural information to help differentiate species presence and relative abundance. The use of digital aerial photogrammetry (DAP) to generate height and cover information (e.g., Bohlin et al., 2012) may help to refine elements of local community composition. The development of new capacities for deriving three-dimensional information from stereo-photography and the capacity to collect data over large areas at relatively low costs have resulted in increasing interest in the use of DAP for a variety of forest monitoring and mapping applications (Goodbody et al., 2019). High-quality information on forest structure (e.g., DAP) is beginning to provide detailed forest structural data similar to lidar, but are regularly collected across large areas (e.g., entire states) during a single year (White et al., 2015). Pushbroom aerial photography, which forms the basis for statewide aerial photography from the National Agricultural Image Program (NAIP) in USA, presents differing challenges to frame-based photography, but can still be used to enhance forest inventory estimation and modeling (Strunk et al., 2020, 2022). Additionally, the greater temporal and spatial resolution, as well as radiometric characteristics, of Sentinel-2 satellite imagery compared to Landsat may improve model performance for forest structure (Flood, 2017; Astola et al., 2019; Grabska et al., 2019). Exploration of differing combinations of environmental and remote sensing datasets may highlight the contributions of each information source (Strunk et al., 2022).
To address the need for improved mapping of species composition as well as to understand the appropriate use of maps, we examined how the addition of new remote sensing products with higher spatial and temporal resolution and consistency (DAP and Sentinel-2) influenced coniferous tree species composition mapping in eastern Washington, USA. We leveraged existing field observations provided by the US Forest Service with remote sensing and environmental covariates to model and map tree species occurrence and abundance across eastern Washington. For our study system, we asked two questions: (1) What combinations of environmental and remote sensing data provide the best accuracy for predicting species composition? (2) What do differences in model performance for mapping species occurrence and abundance indicate about the factors controlling tree species distributions?
Materials and methods
Study area
Our study area was the forested regions of eastern Washington state, USA (Figure 1). This area includes portions of the eastern Cascade Mountains, the northern Blue Mountains, and western portions of the Crown of the Rocky Mountains. Across this area, climate varies substantially as does forest height (Figure 1). We focus on the ten most common species in the study area, representing seven genera of western coniferous tree species, each occurring on at least 10% of the forest inventory plots in the region (Table 1). The gradients in biophysical conditions support various tree species adapted to different conditions, as indicated by a wide range of drought and fire tolerance.
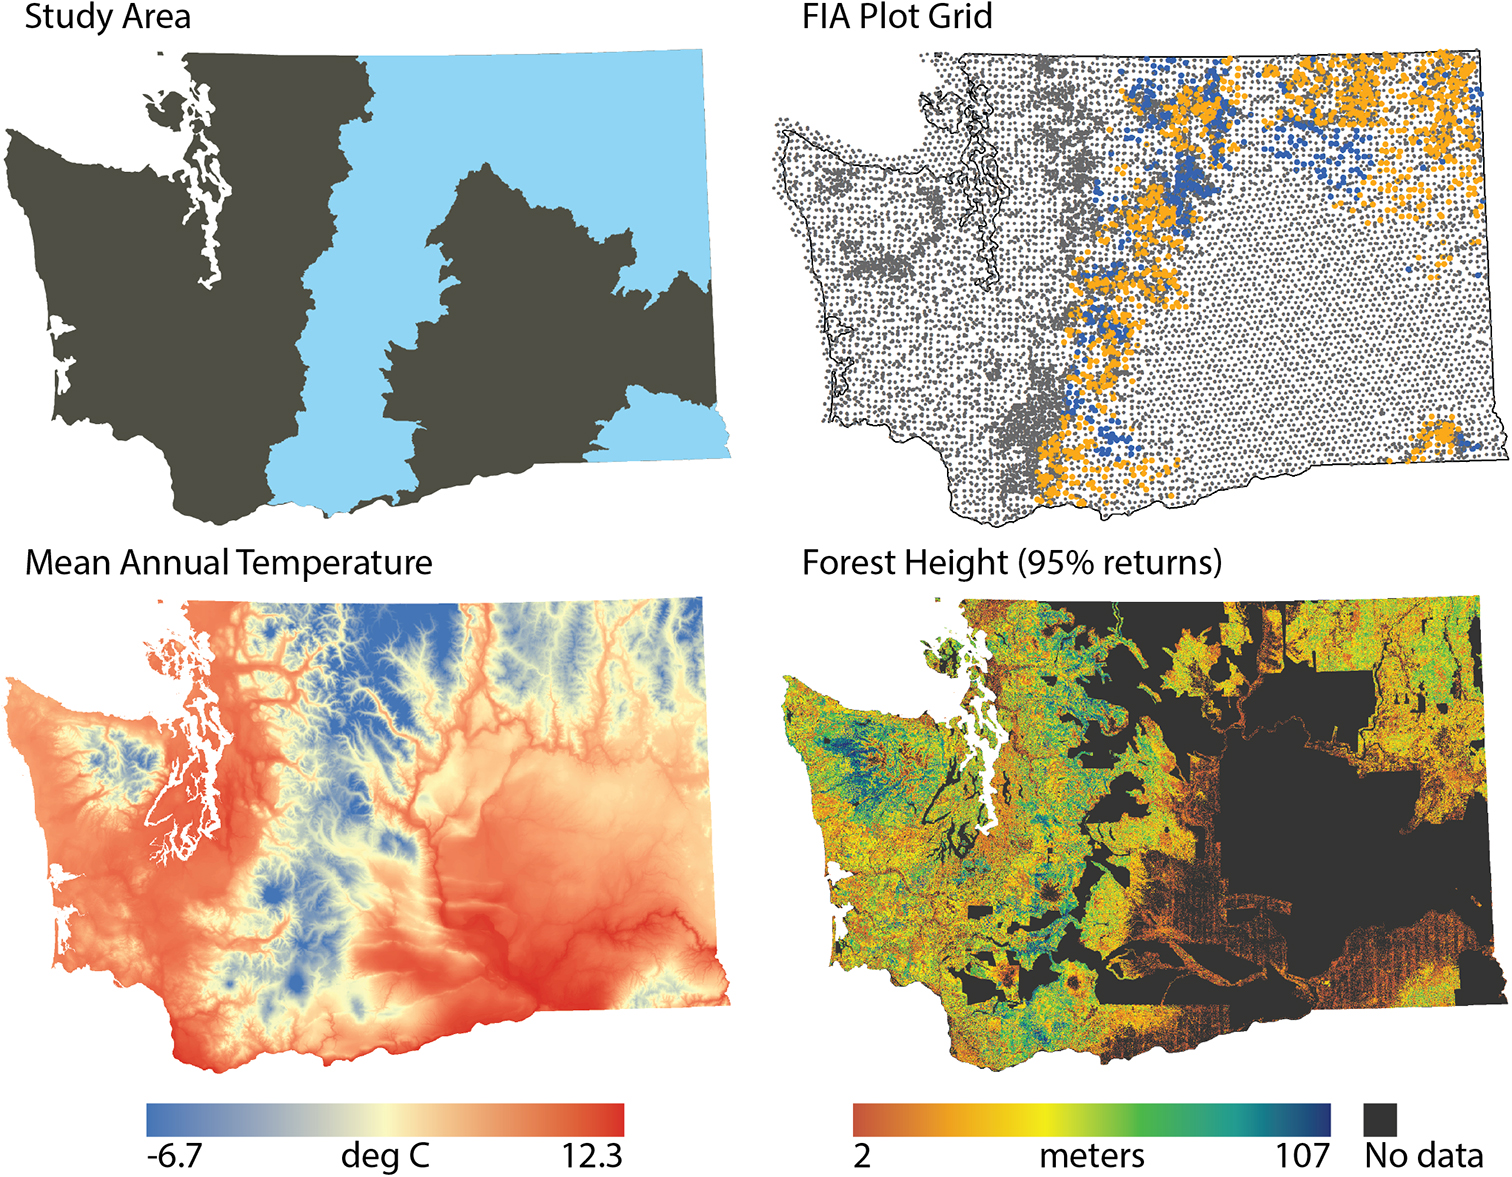
Figure 1. Study area map, highlighting the study area (blue), the distribution of FIA plots (gray = not in this study, orange = this study with DAP, blue = this study without DAP), mean annual temperature (blue = cooler, red = warmer) (Wang et al., 2016), and DAP vegetation height (orange = shorter, blue = taller).
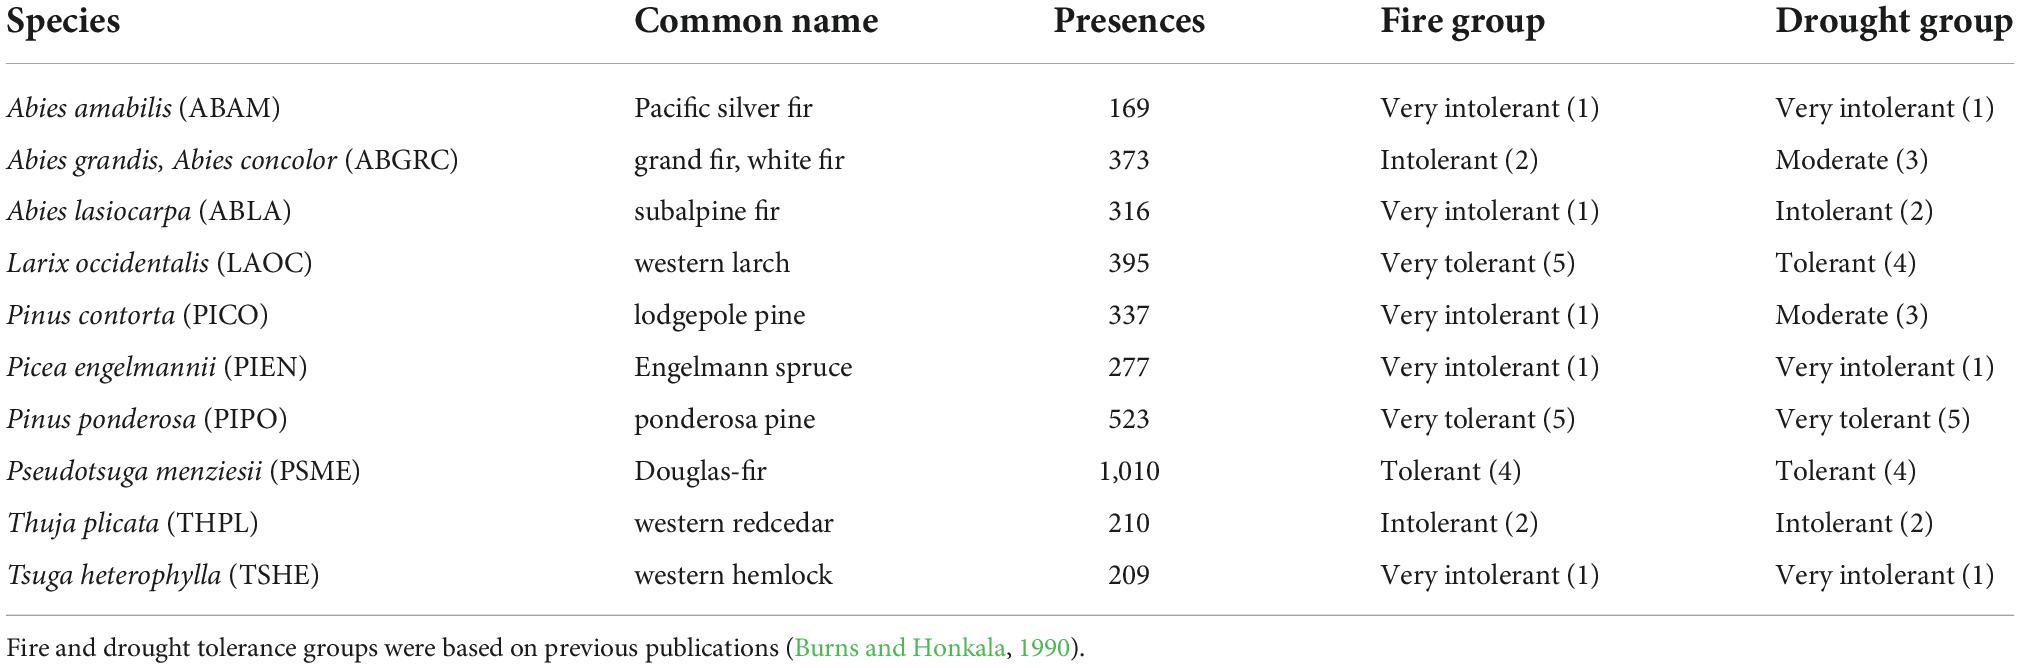
Table 1. Ten most common species in the study area (1,415 total forest inventory plots).
Tree species occurrence and abundance data
Forest inventory data provide the basis for both model calibration and validation. The FIA data provide field-based measurements of forest conditions, which characterize, among other things, tree species presence and abundance. Inventory plots used a nested plot design (four nested 13.5-m2 microplots, 168.3 m2 subplots, and 1,012.2-m2 macroplots, depending on tree diameter) distributed across roughly one hectare. Individual live and standing dead tree measurements included diameter, height, and species. We define a proportional basal area as the live basal area of a given species (m2 ha–1) relative to the total basal area of the plot. Species were considered present when the live basal area was greater than 0 m2 ha–1, and absent otherwise. We used plots with at least 50% of their area classified as forest (i.e., at least 10% stocked) or forest-capable (evidence of the previous forest and undeveloped for non-forest use, such as agriculture) (Bechtold and Patterson, 2005). We focus on FIA plots in the study region measured during the five years prior to the acquisition of the DAP and Sentinel-2 data: 2012–2016 (Figure 1): 1,027 plots for areas with DAP and 1,415 plots for the entire study area.
Geospatial data
We focused on several groups of geospatial covariates related to the environment and remote sensing of forest vegetation. In this section, we describe key environmental, DAP, and multispectral geospatial data sources. All geospatial data were reprojected and resampled to Washington South State Plane projection, resulting in 20.1-m (66-ft) pixels. Thus, pixels are roughly the footprint of the Sentinel-2 satellite imagery for the bands used in the calculation of tasseled cap indices (20 m). Processing of Sentinel-2 covariate rasters occurred on Google Earth Engine (Gorelick et al., 2017), with all other processing occurring on physical workstations.
Environmental data
For environmental gradients related to tree species composition, we focused on three covariate groups (climate, topography, and location), with geospatial variable selection and processing generally following previously published approaches (Ohmann and Gregory, 2002; Battles et al., 2018; Kennedy et al., 2018). To represent climatic variation, we extracted a variety of climate variables representing annual and seasonal temperature and precipitation patterns (Supplementary Table 1) from ClimateNA, a 90-m downscaled version of PRISM 1981–2010 climate normals (Wang et al., 2016). For water deficit and snow water equivalent, we leveraged 90-m resolution data generated for and described previously using 30-year normal (1981–2010) (Dobrowski et al., 2013; Cansler et al., 2022). To represent topographic variation, we calculated a variety of topographic variables related to elevation, slope, aspect, topographic position, and exposure to incoming radiation (Supplementary Table 2) based on 10-m digital elevation models (Gesch et al., 2002; Gesch, 2007) and resampled to 20.1-m before computing derivative products. To represent other geographic constraints on forest structure and composition (e.g., historical dispersal barriers) and to limit the imputation of individual plots across large geographic distances (Ohmann and Gregory, 2002), we used x- and y-coordinates in the projected coordinate system. Similar to spatial errors included in some species distribution modeling approaches (Dormann et al., 2007), location may act as a proxy for a variety of ecological drivers of species composition, including unexplored climate variables, soils, species genetics, road or riparian corridors, and historical impediments to species migration.
Digital aerial photogrammetry data
High-quality information on forest structure provided by DAP consistently collected across large areas (e.g., entire states) during a single year is beginning to provide detailed forest structural data similar to lidar (White et al., 2015; Strunk et al., 2020). To represent vegetation structural characteristics of forest ecosystems, we used DAP variables (Supplementary Table 3) generated from 3D point clouds derived by processing 40-cm resolution, stereo pushbroom aerial photography from the NAIP with an advanced photogrammetric software (Strunk et al., 2020). NAIP imagery was collected in 2017 for the state of Washington, and processed by the Washington Department of Natural Resources (WADNR), with metrics derived using FUSION (McGaughey, 2016), described in detail elsewhere (Strunk et al., 2020). 3D point clouds were normalized by the digital elevation model from overlapping lidar data (i.e., point height minus ground elevation) prior to applying “GridMetrics” in FUSION at a 20.1-m resolution to generate rasters of DAP variables, such as cover, height above 1st to 99th percentile heights, and measures of return height variability, skewness, and kurtosis (Supplementary Table 3). While such pushbroom imagery may result in more error compared to either lidar or DAP based on frame cameras, these data can be useful for forest inventory and modeling applications (White et al., 2015). NAIP imagery is collected statewide on a regular basis (every 2 years), potentially making DAP preferable to lidar when considering cost and spatial and temporal coverage.
Multispectral remote sensing data
To represent the spectral properties of forest ecosystems, we used the tasseled cap transformation to generate brightness, greenness, and wetness from Sentinel-2 data at 20.1-m pixel resolution. The tasseled cap transformation reduces Landsat imagery to three orthogonal indices (brightness, greenness, and wetness) (Crist and Cicone, 1984). Past work in this region has demonstrated the utility of tasseled cap indices for mapping forest cover, structure, and composition (Cohen and Spies, 1992; Cohen et al., 2001; Ohmann and Gregory, 2002; Ohmann et al., 2011, 2014; Bell et al., 2021) as well as other regions (e.g., Hall et al., 2006; Powell et al., 2010; Beaudoin et al., 2014; Wilson et al., 2018). First, we extracted all Sentinel-2 top-of-atmosphere images from 2017 and 2018 from Julian days 180–270 to represent the snow-free growing season (June–August). We then processed each image to perform cloud masking and dark object removal (Temporal Dark Outlier Mask method) (Chastain et al., 2019). To select the image that most closely represents the center of the distribution of processed images, we identified the medoid as an image for that pixel which minimizes the squared differences between the median and the observation across bands (Flood, 2013). Finally, we calculated the tasseled-cap indices for the medoid for each pixel (Shi and Xu, 2019).
Spatial variation in remote sensing
Spatial variation in DAP and Sentinel-2, potentially representing heterogeneity in forest structure and composition, was characterized as the standard deviation in DAP PCA axes (see below) and Sentinel-2 tasseled cap brightness, greenness, and wetness using a 1.01-ha moving window (5-by-5 pixels). Thus, standard deviation in DAP and Sentinel-2 spectral variables (hereafter, DAP_sd and S2_sd, respectively) are roughly equivalent to FIA plot-scale variation in remote sensing.
Principal components analysis
Given a large number of potential geospatial predictor variables (48 total), we reduced the number of covariates while still representing the variation in covariates relevant to mapping forest structure and composition by applying a principal components analysis (PCA) to each of three covariate groups: climate (14; Supplementary Table 1), topography (7; Supplementary Table 2), and DAP (19; Supplementary Table 3). For these covariate groups, we used the first three PCA axes for modeling and mapping as they accounted for greater than 98% of the variation (Supplementary Table 4) while still reducing the number of orthogonal covariates used for modeling. We did not apply PCA to Sentinel-2 or location groups as these groups include three (brightness, greenness, and wetness) and two (x and y) covariates, respectively. Therefore, for the seven covariate groups, a maximum of 20 predictors were included in modeling and mapping. PCAs were performed in ArcGIS Pro 2.6 using the geoprocessing tool names “Principal Components.”
Statistical modeling and mapping
There are many statistical modeling options for species composition mapping, each with its own advantages and disadvantages. For example, univariate (e.g., random forest regression) and multivariate (e.g., nearest neighbor) non-parametric approaches are widely used in remote sensing applications due to their flexibility (e.g., Henderson et al., 2019). Joint modeling of multiple species provides a coherent prediction of actual communities (Clark et al., 2014, 2017; Pollock et al., 2014), indicating that multivariate approaches are preferred for species mapping. In this study, we leverage gradient nearest neighbor imputation for mapping tree species community patterns as it is a multivariate method that preserves community structure as part of the modeling and mapping process (Ohmann et al., 2011).
Gradient nearest neighbor imputation (GNN) is a non-parametric modeling approach, which uses canonical correspondence analysis (CCA; Ter Braak, 1986) to define a feature, or gradient, space in which k nearest neighbor imputation can be performed (Ohmann and Gregory, 2002). GNN has been used extensively for mapping both forest structure and species composition (Ohmann and Gregory, 2002; Wilson et al., 2012, 2013; Ohmann et al., 2014; Kennedy et al., 2018; Bell et al., 2021), so we provide only a brief description here. Initially, a gradient space is defined with which similarity among plots and pixels can be calculated. The gradient space uses a CCA to relate an environment matrix to a species matrix. The species matrix traditionally uses species abundances, but our species matrix was composed of the species-by-size class basal areas as we have found that this better represents forest structural and compositional gradients in forests (Ohmann and Gregory, 2002). For the environment matrix, we use geospatial predictors (or transformations of them, such as PCAs described above) related to both the physical environment (climate, topography, and location) and the observed condition of forests (remote sensing). All pixels and plots are transformed into the gradient space based on the results of the CCA. Based on those locations in the gradient space, every pixel is assigned the tree community (as represented by the basal area of each tree species) observed on the plot minimizing the distance in gradient space from the focal pixel. In this study, we imputed only the nearest neighbor (k = 1) rather than averaging over several neighbors (k > 1). Therefore, maps of species presences and abundances reflect only those observed conditions from FIA plots, which avoids unrealistic combinations of species that can occur when averaging across more than one neighbor.
The focal response variables that we modeled were species-level basal area and we used these values to calculate species occurrence (species basal area >0 m2 ha–1) and proportional basal area (species basal area/total basal area) for our 10 focal species (Table 1). We modeled species-level basal areas to facilitate aggregation and scaling of predictions in a sensible fashion, such that for any set of pixels to aggregate, we first summed species-level basal area and total basal area across pixels and then calculated proportional basal area based on these sums. Models incorporating DAP data used only 1,027 plots for which these data were available, with all other models using 1,415 plots. To avoid spurious predictions associated with rare species, we report results for the 10 most common species in the dataset (Table 1). Our model fitting used the average covariate values for the plot footprint (5-by-5 pixels) and species basal area for the entire plot. Model predictions were performed for each pixel, with predictions being aggregated to the plot level (average of 25 pixels).
Model selection, comparison, and mapping
To select the best combination of covariate groups for mapping tree communities, we compared all 127 different combinations of the seven covariate groups (excluding the null model with no covariates and an intercept only) based on their capacity to predict species presence or absence and species proportional basal area. We quantified model skill in differentiating presence and absence using true skill statistic and overall accuracy (% correctly classified). True skill statistic (TSS) is a measure of model accuracy that takes into account omission and commission, but is not as sensitive as Cohen’s kappa is too low or high prevalence (Allouche et al., 2006). We used R2 and root mean square error (RMSE) to quantify the accuracy of proportional basal area predictions. We used a modified leave-one-out procedure (Ohmann and Gregory, 2002) for assessing model accuracy. The modified leave-one-out procedure generates the average prediction for each mapped attribute for the 25 pixels overlapping the FIA plot footprints based on the first independent neighbor at each pixel (i.e., the plot with the minimal multi-dimensional Euclidean distance in gradient space), ensuring that for the purposes of model accuracy that imputed predictions are independent of each individual plot being assessed. Previous analyses indicate that this modified leave-one-out procedure performs similarly to a traditional leave-one-out cross-validation (Ohmann and Gregory, 2002).
We identified the combination of covariate groups that produced the best performance for each individual species. Because proportional basal area depends on not just one species, but all species, separate models for each species were not possible. To balance performance across species as well as both prediction of species occurrence and proportional basal area, we identified a community consensus model for which the majority of species (>50%) included those covariate groups for the best performing models in terms of at least one of four performance metrics: TSS, overall accuracy, R2, or RMSE.
Using the community consensus model identified during model selection and 20.1-m rasters of all covariate groups, we generated rasters of species basal area across the entire footprint of the DAP dataset (Figure 1). We mapped the basal area for each of the 10 focal tree species and calculated the total basal area as the sum of species basal area at 20.1-m resolutions.
To quantify modeled species’ sensitivity to key environmental and forest structural conditions, we examined the relationships between predicted proportional basal area and moisture limitation or canopy height across the 1,027 FIA plots. Moisture limitation was represented by water deficit, which is related to the difference between potential and actual evapotranspiration (Lutz et al., 2010; Dobrowski et al., 2013). Forest canopy height was represented by the 95th percentile height from the DAP metrics. Similar metrics for lidar, such as the 95th percentile height or returns, are strongly related to forest structure and complexity (Kane et al., 2010a,b). Because we are focused on proportional data, we modeled proportional basal area as a function of water deficit or 95th percentile height with a linear regression truncated at zero and one. To fit models, we used the function tobit in the AER package (Kleiber and Zeileis, 2008) within the R statistical computing environment version 4.0.3 (R Development Core Team, 2020). Based on these models, we generated mean and 95% confidence intervals for predictions.
Results
Identifying best covariate groups: The community consensus model
The combination of covariate groups that resulted in the highest-performing models for species occurrence and proportional basal area differed by species and metric under consideration (Table 2). For most species, tree species proportional basal area predictions were most accurate (greatest R2 and least RMSE) for models that included climate, topography, location, DAP, Sentinel-2, and S2_sd covariate groups. For species occurrence predictions, model skill (TSS) was greatest for models including climate, topography, and location and overall accuracy was greatest for models including climate and location. Based on our criteria (predictor groups included in best models based on R2, RMSE, TSS, or overall accuracy for greater than 50% of species), we identify the community consensus model as the one including climate, topography, location, DAP, Sentinel-2, and S2_sd covariate groups. Note that this community consensus model is a compromise across all species as GNN predicts species occurrence and abundance conditioned on the rest of the community, resulting in a community consensus model that is not necessarily the best performing for any individual species. Unless otherwise stated, results reported for the remainder of this paper focus on the community consensus model.
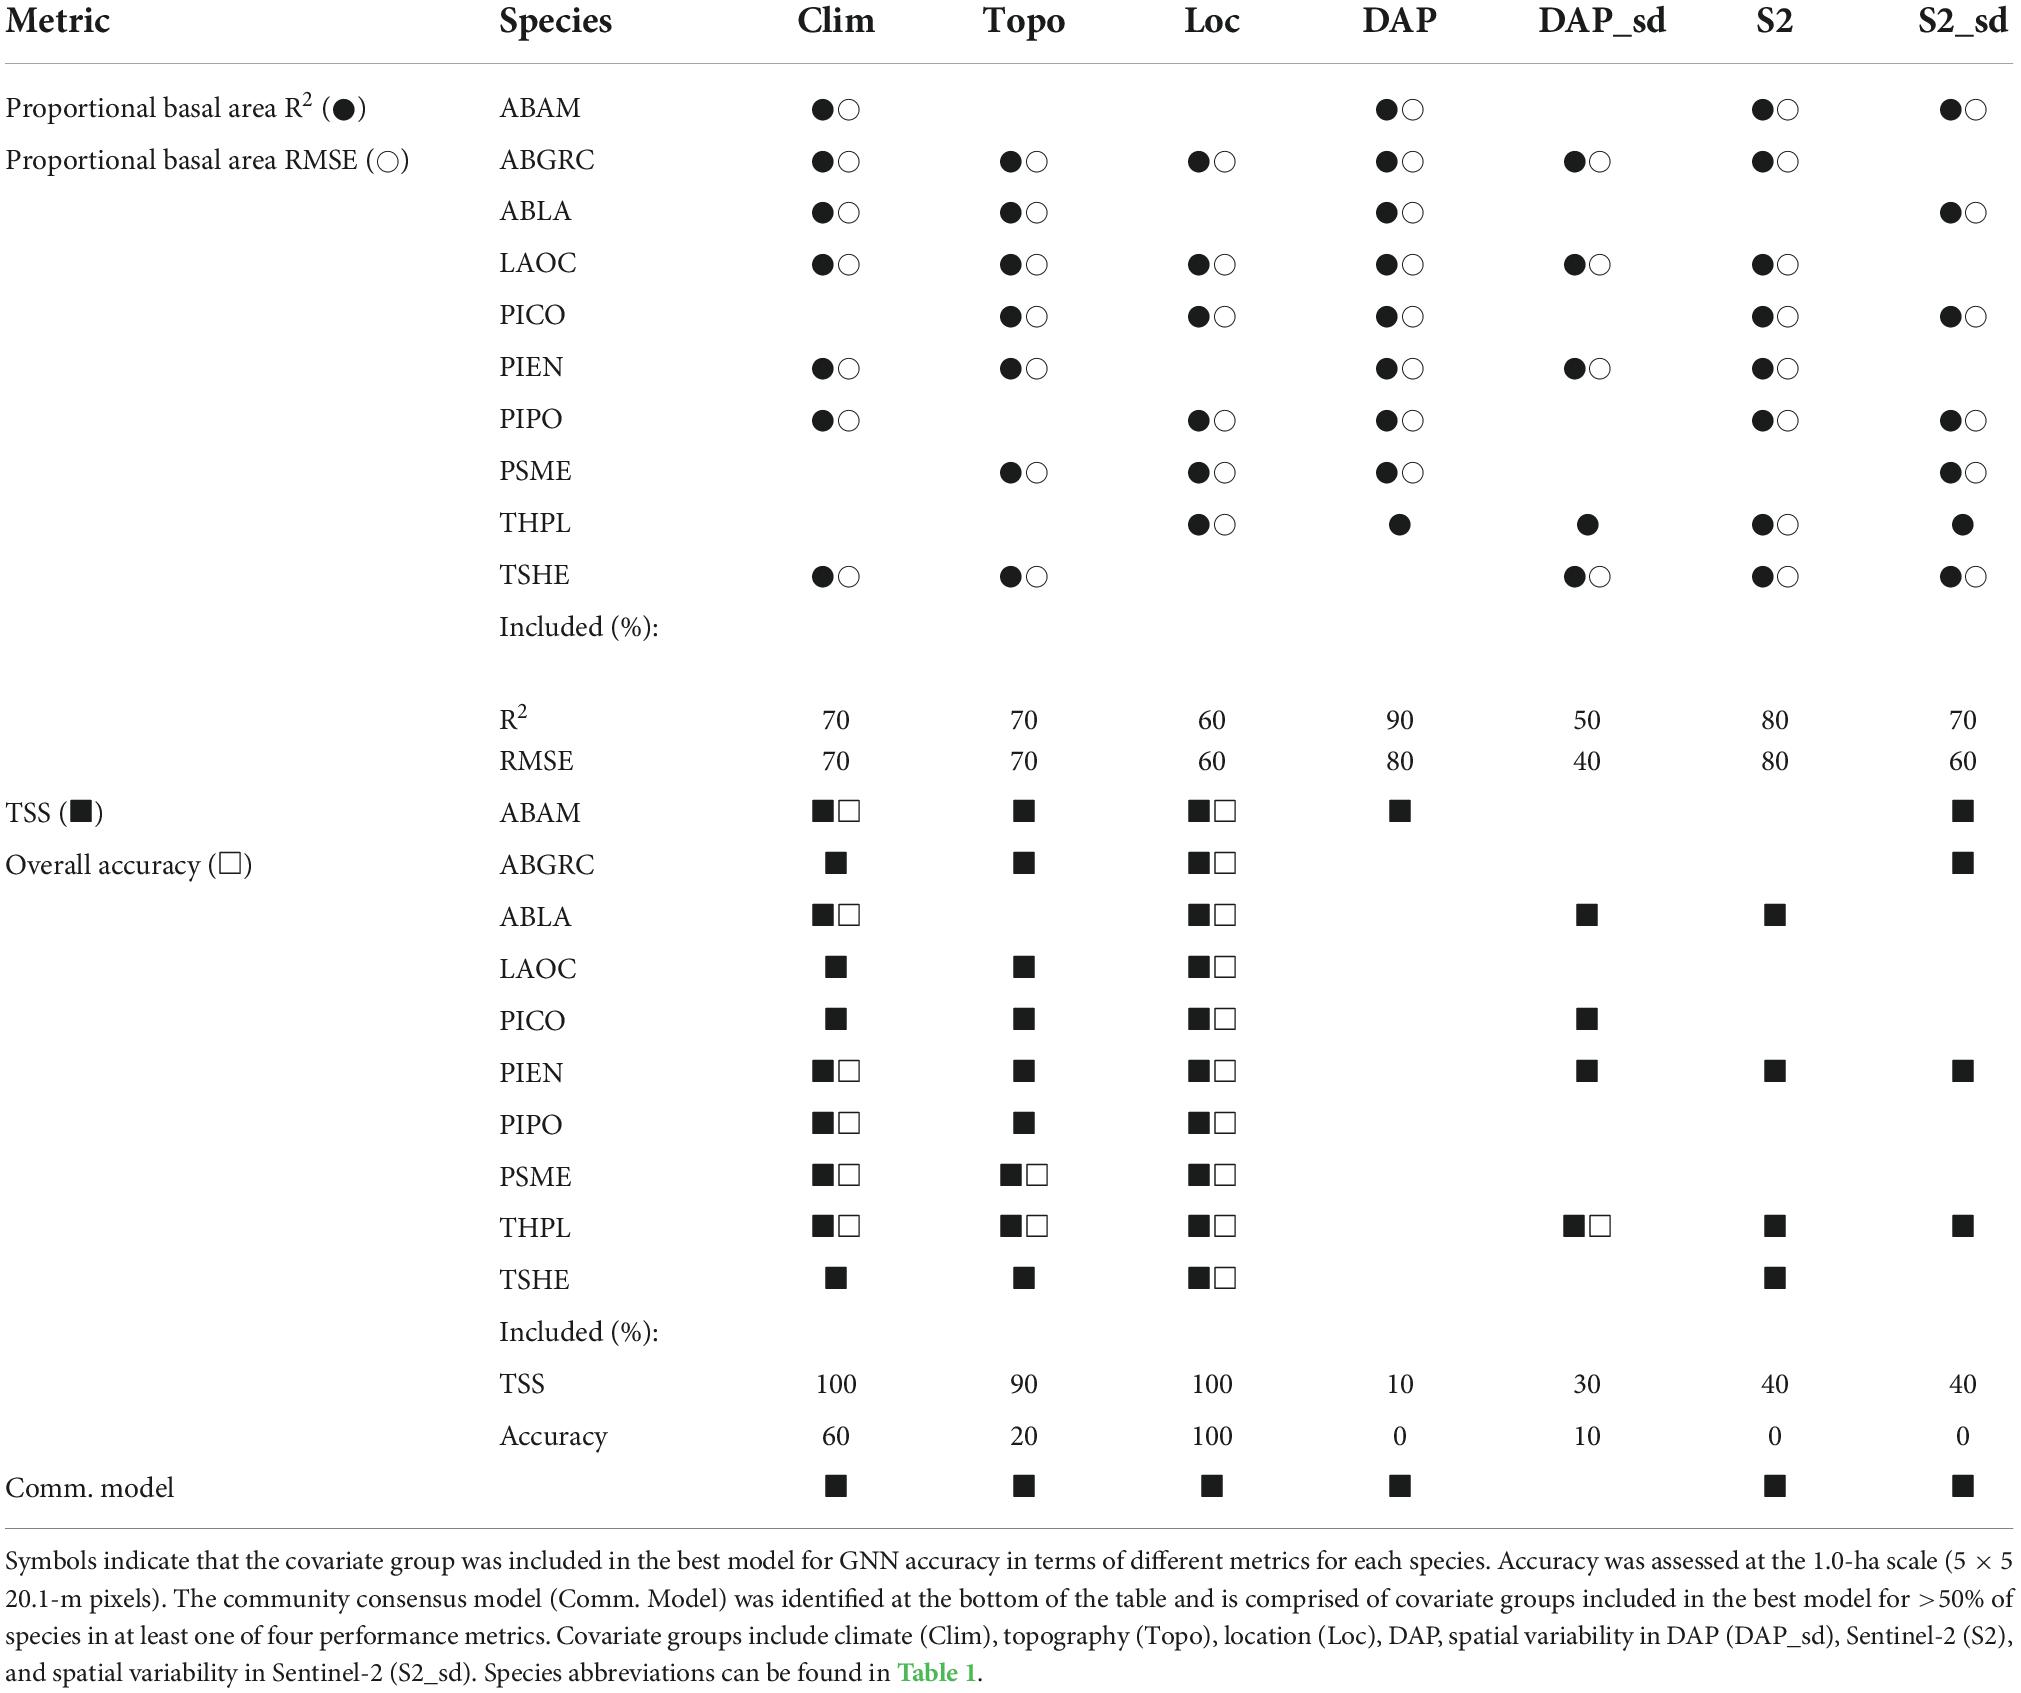
Table 2. Covariate group combinations for the best model for each species based on maximizing the performance metrics: R2 and RMSE for proportional basal area and TSS and overall accuracy for species occurrence.
Plot-level accuracy
Accuracy for the community consensus model varied depending upon the species and metric being examined (Figure 2). At the scale of individual plots (25 pixels), TSS ranged from 0.06 to 0.76 (mean = 0.43) and overall accuracy ranged from 47% to 83% (mean = 65%) for the community consensus model. Commission rates at the plot level were generally high (> 40%) for all species. Assuming extremely low basal area predictions (BA < 1 m2 ha–1) were functional absences of the species increased accuracy of occurrence predictions, with TSS ranging from 0.32 to 0.78 (mean = 0.52) and overall accuracy ranging from 68 to 92% (mean = 80%). For both standard predictions and predictions with species basal area set to zero for functional absences, R2 ranged from 0.08 to 0.55 (mean = 0.20) and RMSE ranged from 0.10 to 0.31 (mean = 0.15) for proportional basal area.
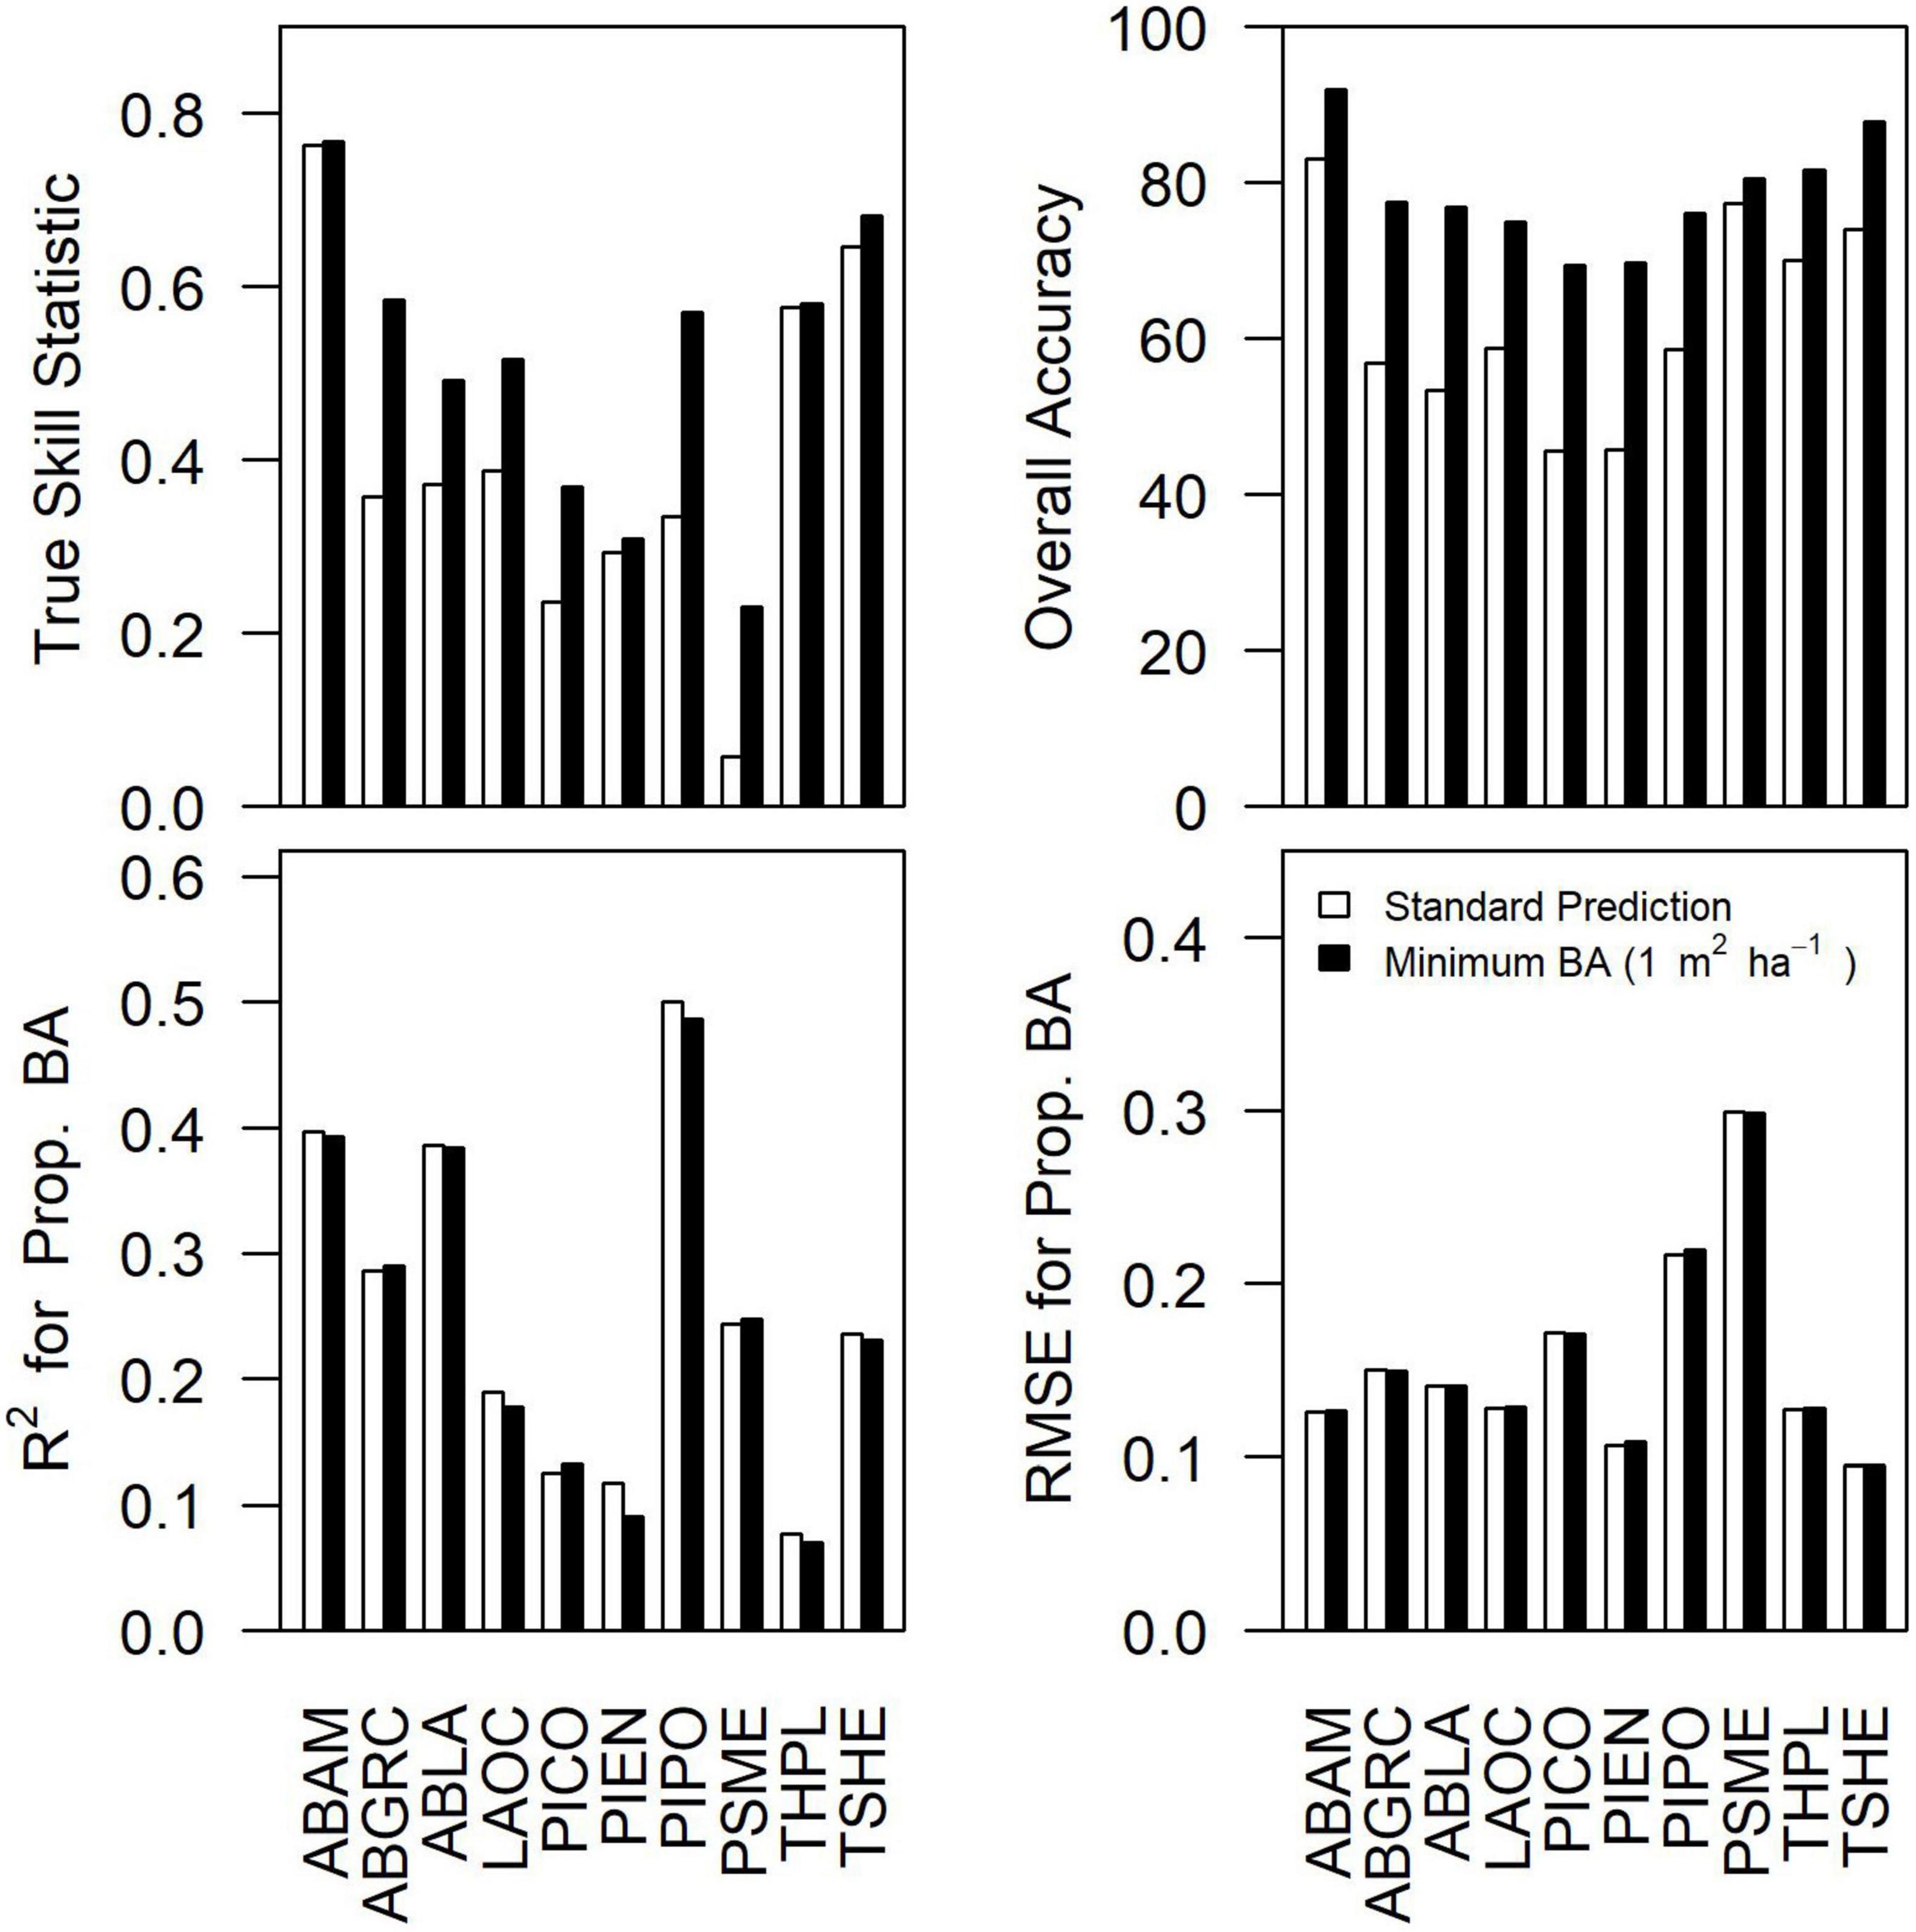
Figure 2. Differences in true skill statistic, overall accuracy, R2 for proportional basal area, and RMSE for the proportional basal area between the standard prediction from the consensus model and the predictions assuming species basal area less than 1 m2 ha–1 indicate species functional absence (i.e., BA = 0 m2 ha–1). Accuracy results based on standard GNN predictions aggregated over the 25-pixel footprint. Species abbreviations can be found in Table 1.
To assess the importance of remote sensing in the modeling of species composition, we examined the differences in the accuracy of occurrence predictions (TSS and overall accuracy) and proportional basal area (R2 and RMSE) for each species for the best performing models with and without Sentinel-2 and/or DAP (Figure 3). The addition of remote sensing increased TSS for 70% of species (−0.12 to 0.16; mean = 0.03) and decreased overall accuracy for 90% of species (−13 to 2%; mean = −5%). Including remote sensing led to dramatic increases in R2 for all species (0.24–0.45; mean = 0.33) and small reductions in RMSE for 80% of species (−0.06 to 0.00; mean = −0.02) for the proportional basal area.
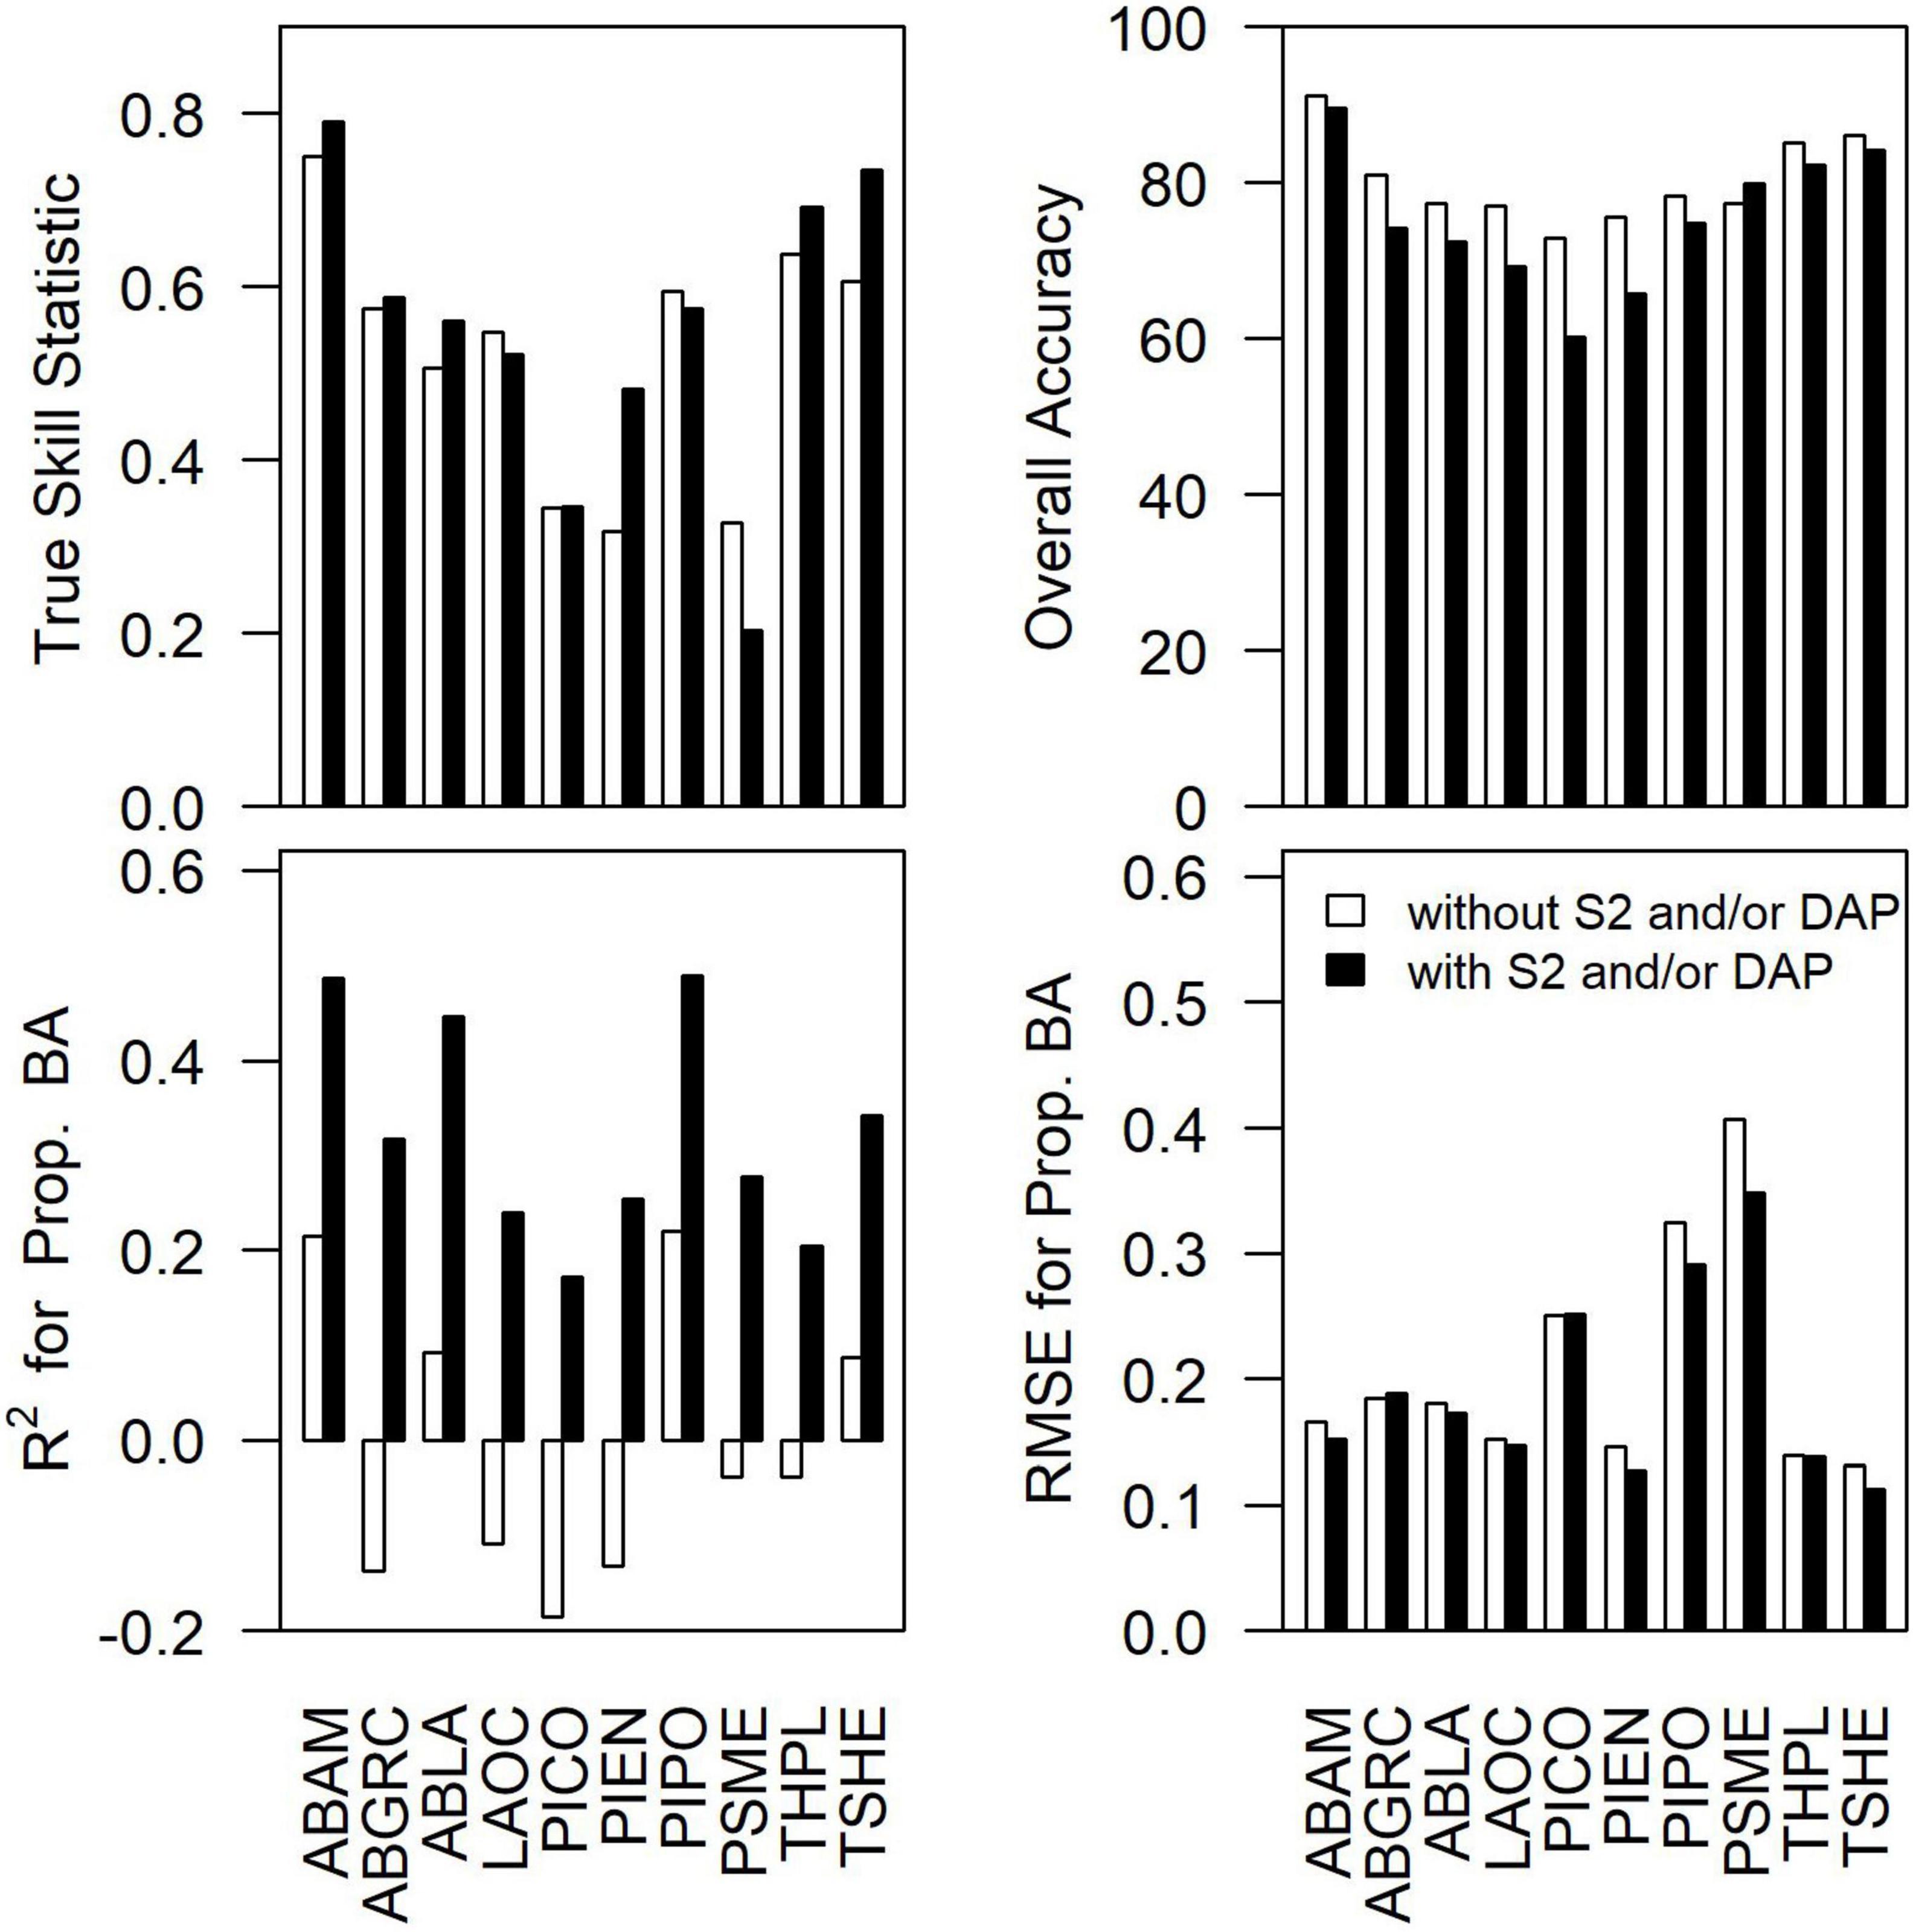
Figure 3. The difference in true skill statistic, overall accuracy, R2 for proportional basal area, and RMSE for the proportional basal area between the best performing species-level models with vs. without DAP and/or Sentinel-2 data. Species abbreviations can be found in Table 1.
Aggregating species by drought and fire tolerance groups indicated that proportional basal area was more predictable for very tolerant and very intolerant classes compared to moderate classes (Figure 4). While the variability in predictions relative to observations was relatively high (i.e., broad distributions), predictions averaged across plots tended to increase with observed values, though often underpredicting at greater levels. These results indicate that models can capture general patterns of species proportional basal area, though the best agreement (i.e., values closer to 1:1 line and ranges of predictions are narrower) between predicted and observed appears to be at the lower proportional basal area for most species, which is where there is the most plot support. The underprediction of the proportional basal area appeared greatest for moderate drought tolerance and intolerant drought and fire groups.
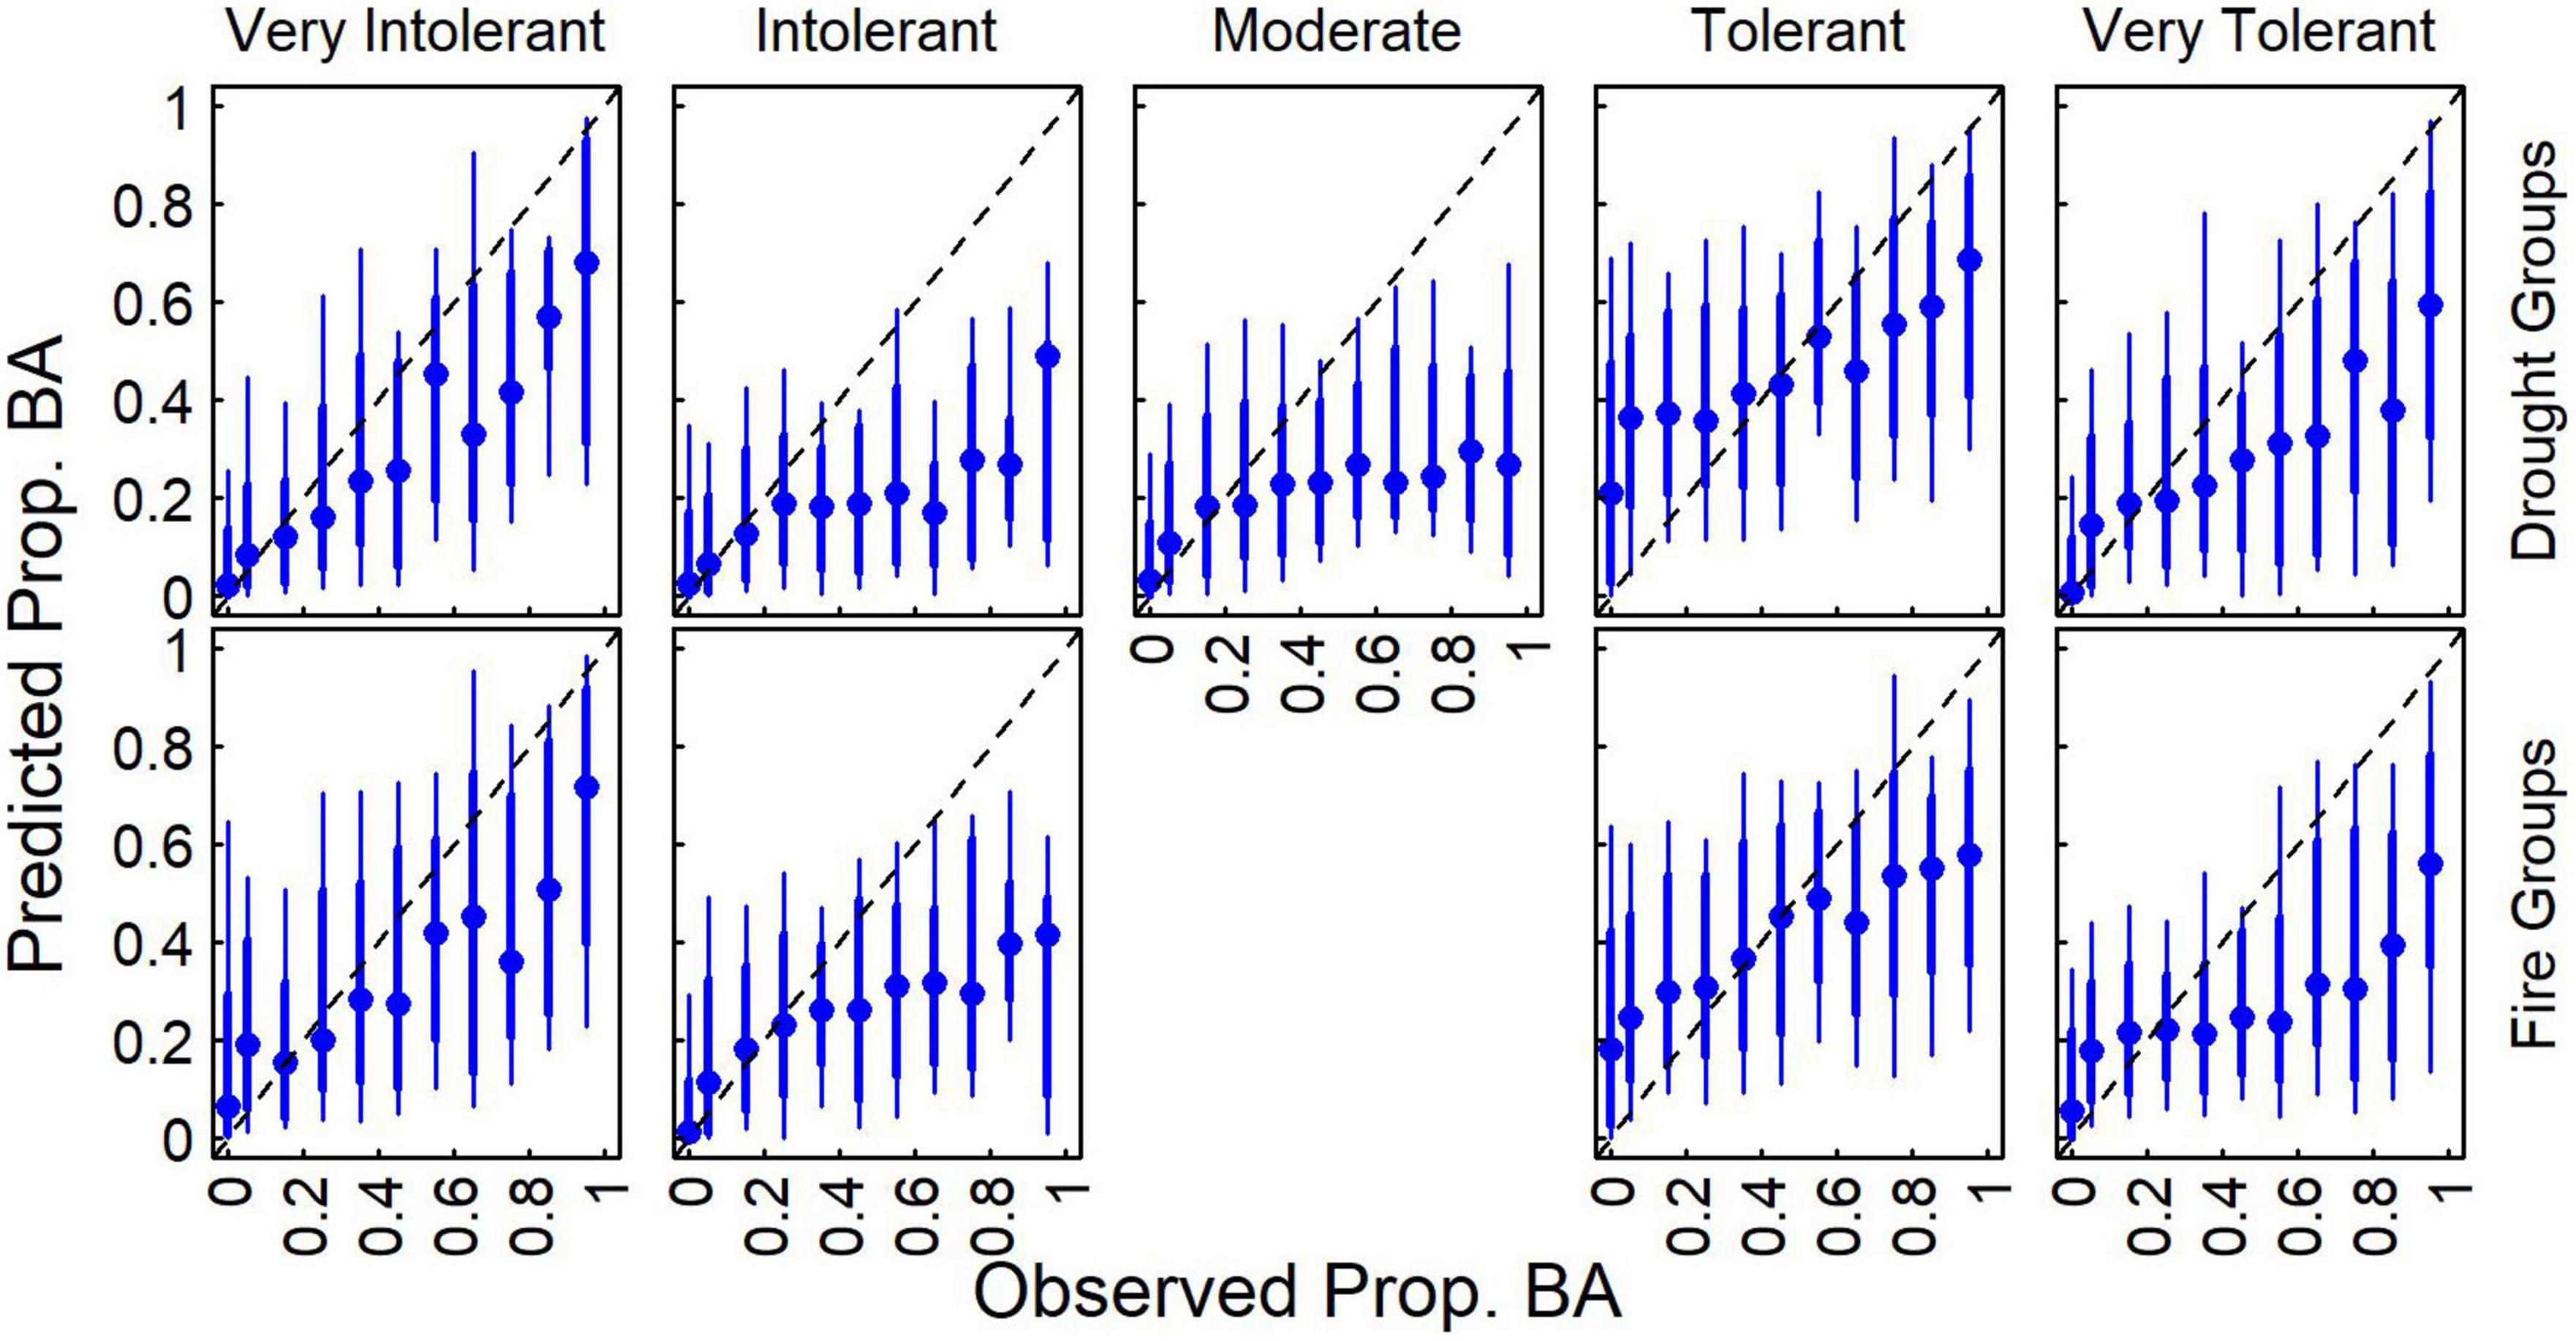
Figure 4. Distribution of predicted proportional basal area compared to observed values for each of the five drought groups based on the community consensus model (Table 2). Median (blue points), 16th to 84th percentile ranges (thick blue line), and 5th to 95th percentile ranges (thin blue line) predictions across observations are also presented.
Regional and local patterns in species composition
Mapping predicted proportional basal area across the entire study region (eastern WA forests) highlights divergent distributions in proportional basal area, and thus species dominance, among species (Figure 5) likely associated with broad-scale climatic controls. While P. menzeisii is found in most (78%) forests in the region, it dominates (proportional basal area >0.5) most strongly in the southwestern and northwestern portions of the study area. The drought-tolerant P. ponderosa also dominates over relatively large areas, most notably along the lower elevational fringes of the study area. Other species appear to be locally dominant, but not over such large areas.
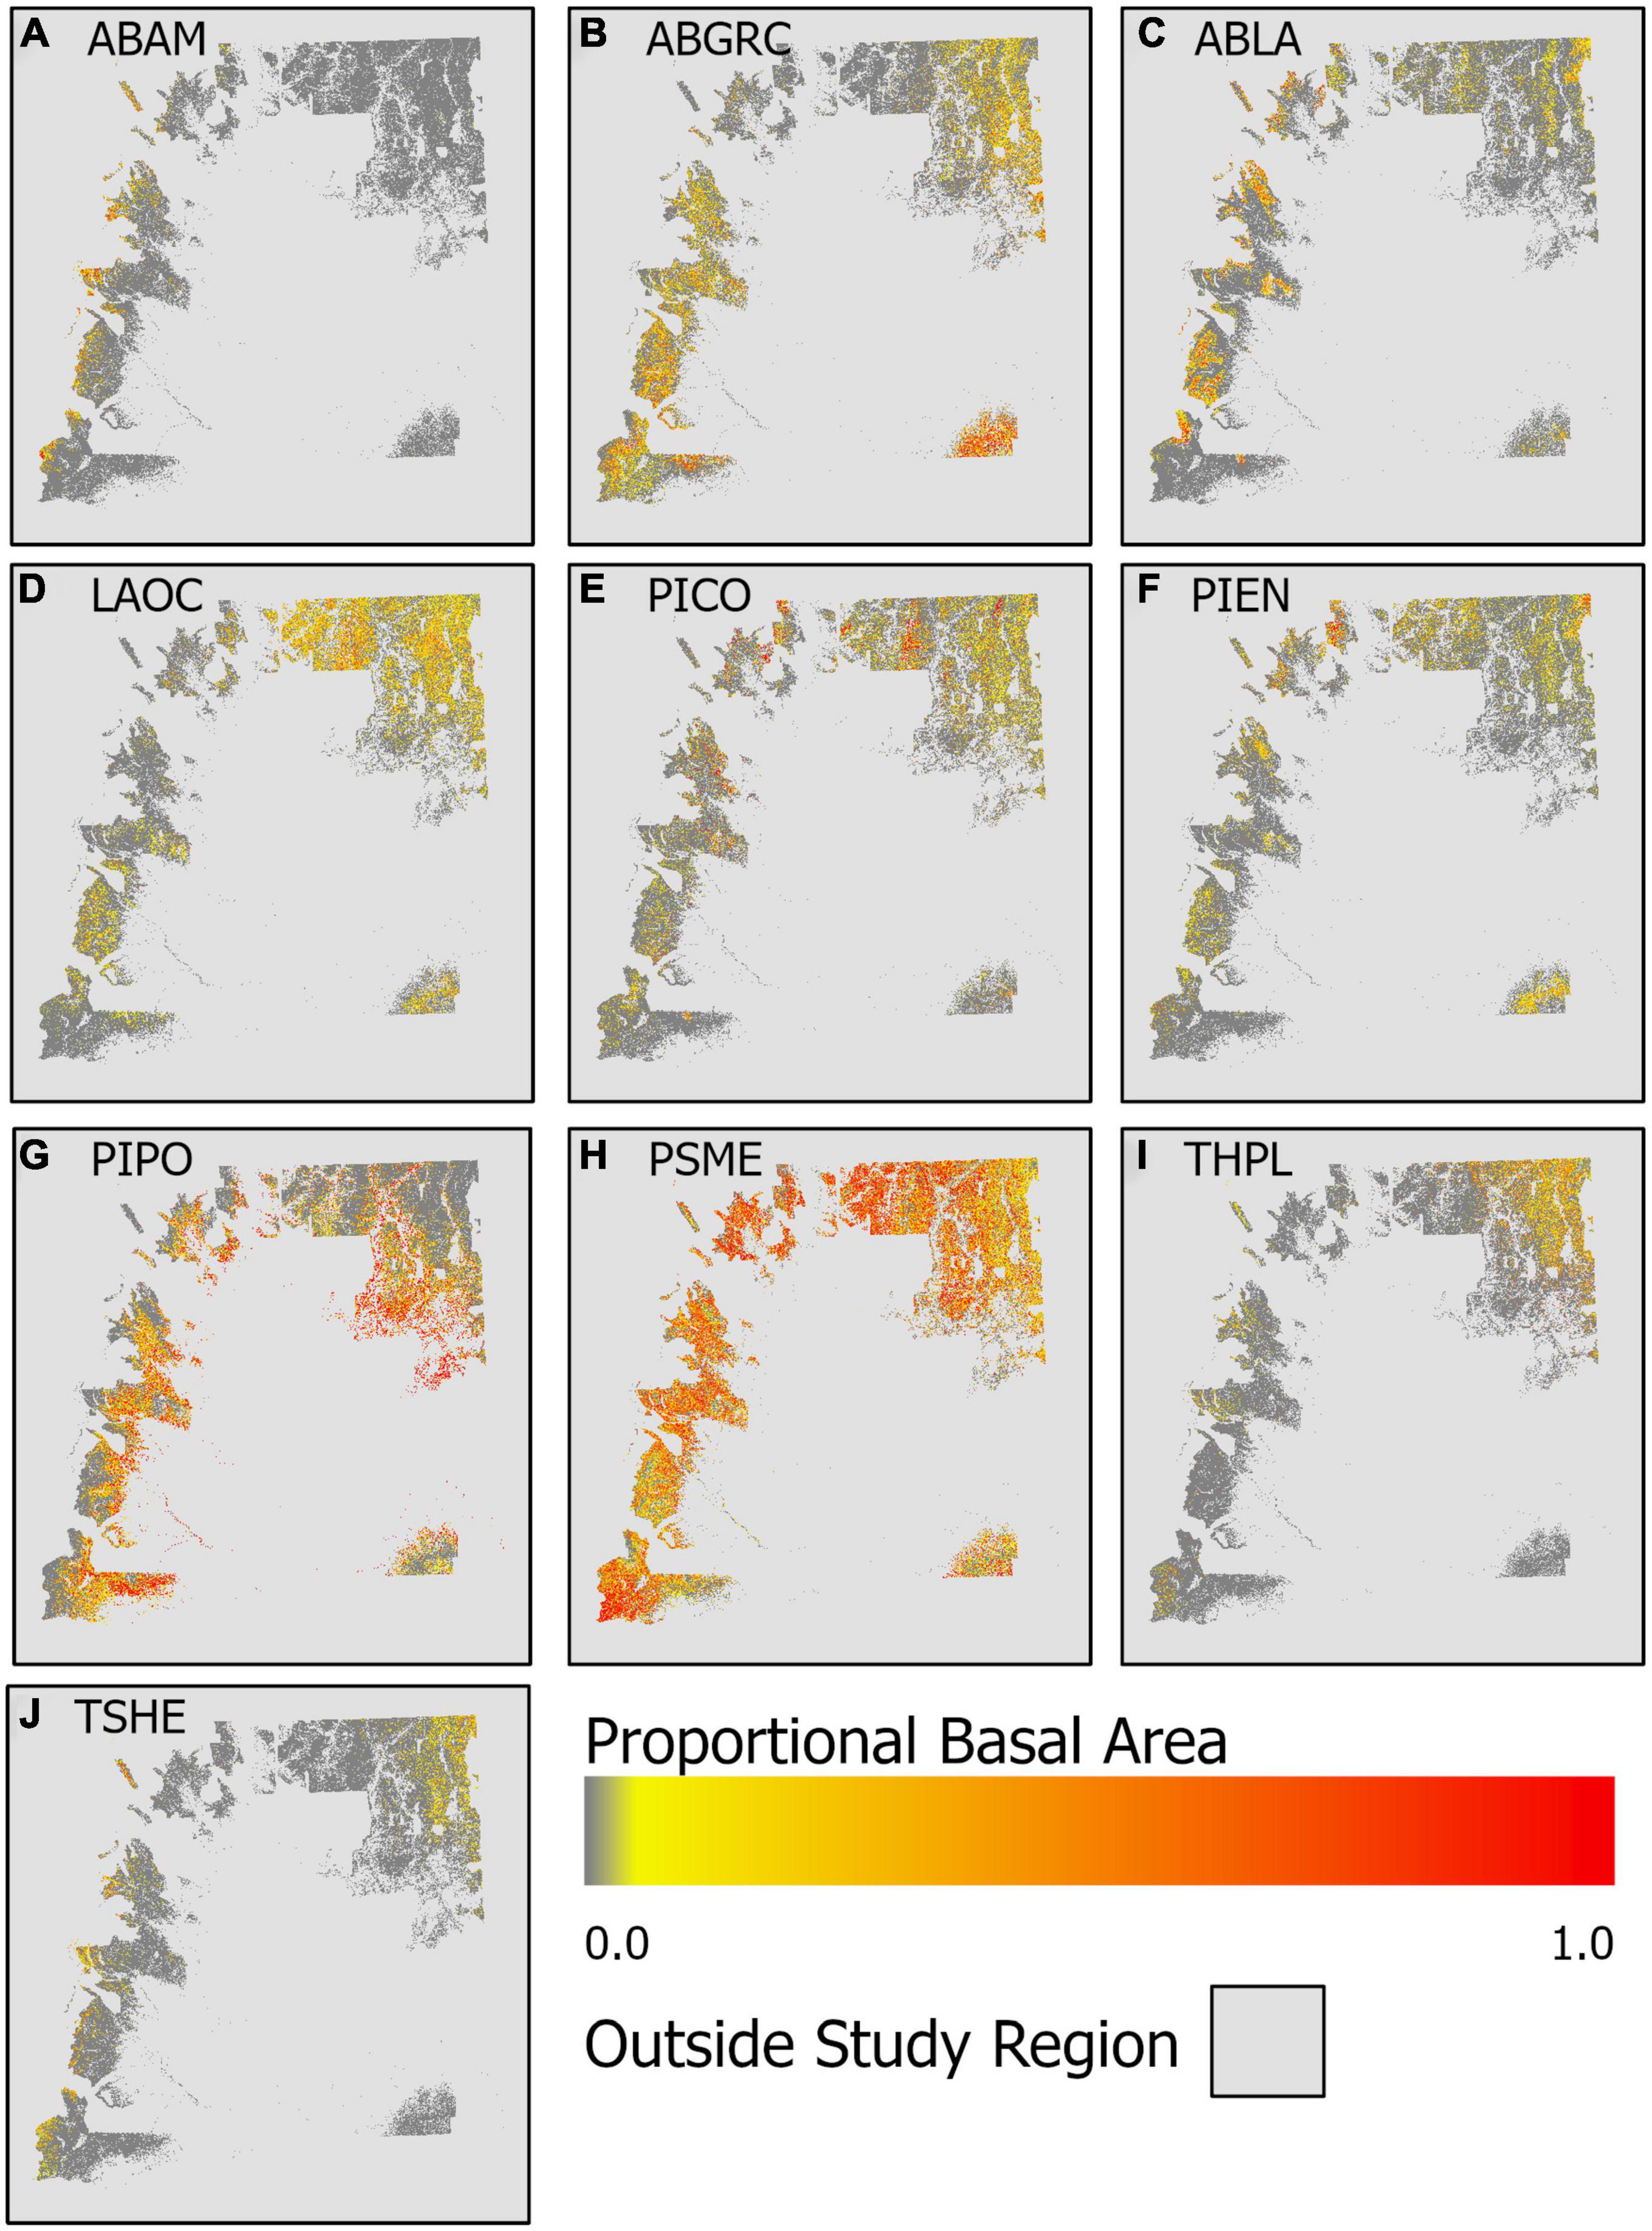
Figure 5. Spatial patterns of predicted proportional basal area for the 10 species: (A) A. amabilis (ABAM), (B) A. grandis and A. concolor (ABGRC), (C) A. lasciocarpa (ABLA), (D) L. occidentalis (LAOC), (E) P. contorta (PICO), (F) P. engemannii (PIEN), (G) P. ponderosa (PIPO), (H) P. mensiesii (PSME), (I) T. plicata (THPL), and (J), T. heterophylla (TSHE).
Given that species can be grouped based on tolerance to stressors or disturbance agents, such as drought (e.g., Figure 4), we examined patterns of proportional basal area of tree species grouped by drought and fire tolerance in relation to moisture limitation. To represent moisture limitation, we use the difference between potential and actual evapotranspiration, or annual water deficit (sensu Lutz et al., 2010), with increasing values indicating that local water availability is not sufficient to track atmospheric demand. The proportional basal area of fire and drought tolerance groups varied as a function of water deficit (Figure 6). Very drought and fire tolerant tree species’ proportional basal area increased as the water deficit increased, whereas fire and drought intolerant and very-intolerant species increased their proportional basal area as the water-deficit decreased.
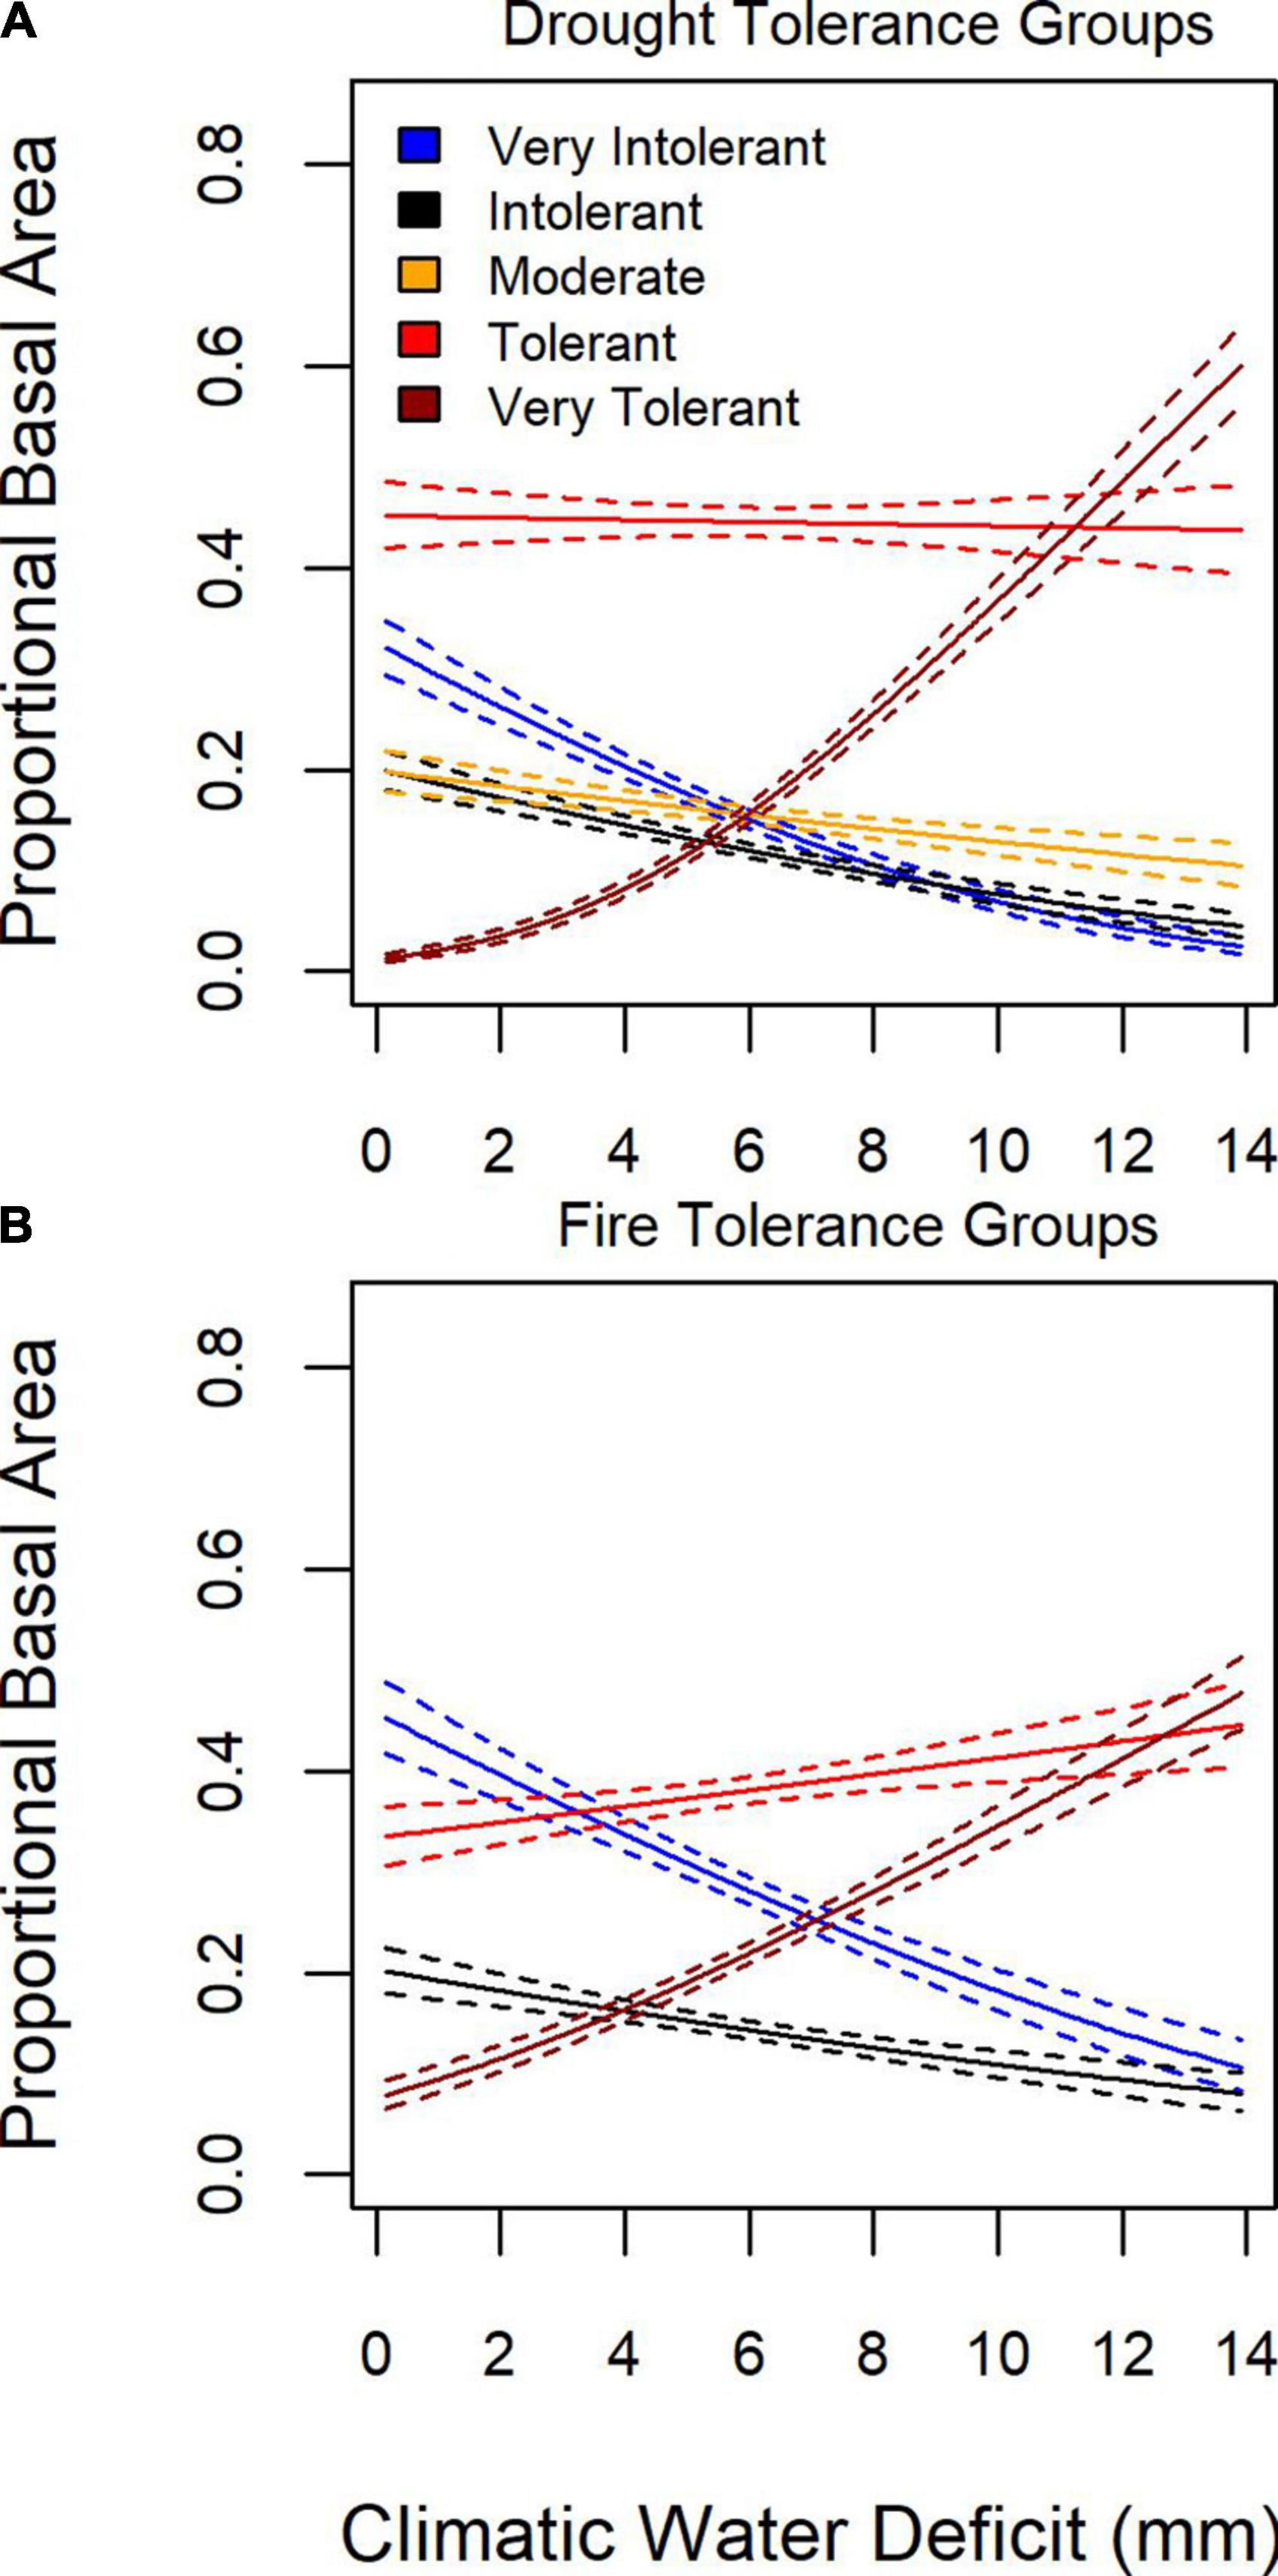
Figure 6. Mean (solid line) and 95% confidence interval (dashed line) for proportional basal as a function of water deficit for (A) five drought tolerance groups and (B) four fire tolerance groups.
To understand how local forest structural conditions might constrain tree community composition, we examined species proportional basal area as a function of 95th percentile height. Four species decreased and six species increased proportional basal area with 95th percentile height (Figure 7). For low 95th percentile heights, P. menziessi, P. ponderosa, and A. lasciocarpa were the most common, whereas, at greater 95th percentile heights, P. menziessi and T. heterophylla were the most common.
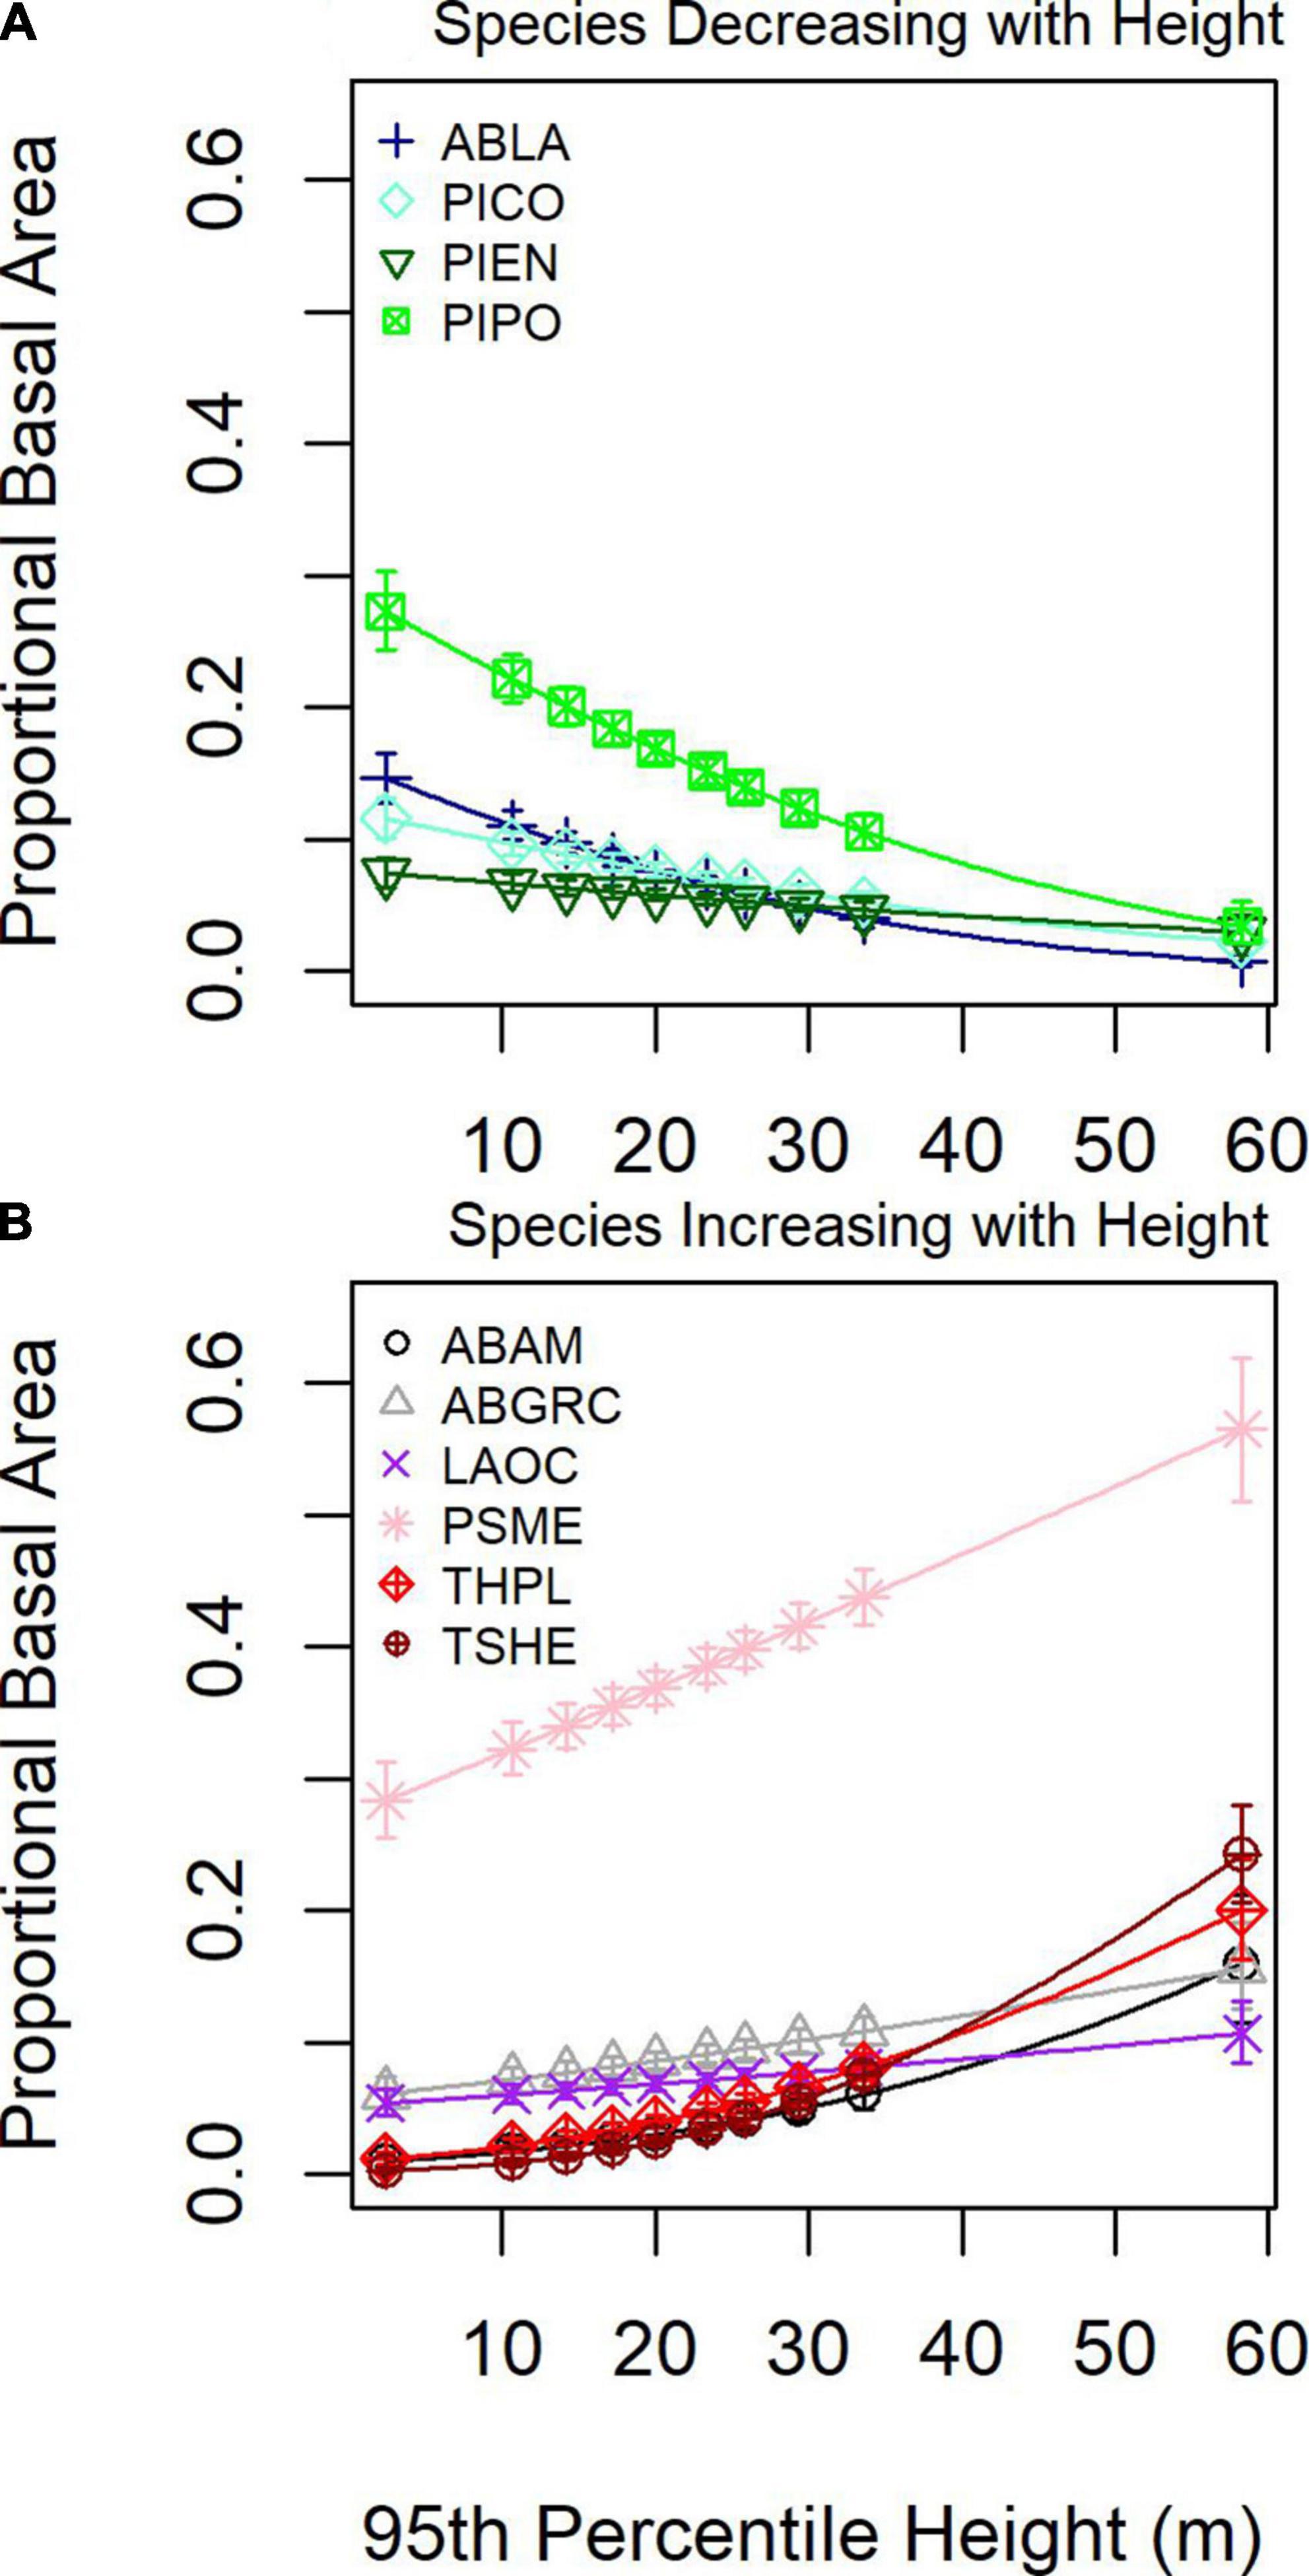
Figure 7. Mean (line and symbols) and 95% confidence interval (whiskers) for proportional basal as a function of 80th percentile height from DAP for (A) four species showing an increasing response and (B) six species showing a decreasing response.
At the landscape level, tree species’ compositional patterns and their relationships to stand structure may be more complex. For example, in an area in the southwestern portion of our study region, the signature of a previous timber harvest (low basal area region in the southern portion of the map) is reflected not only in the total basal area, but also in proportional basal area of three dominant species in this area (Figure 8). The young, low basal area forests (Figure 8D) were dominated by P. menzeisii (Figure 8A) and P. ponderosa (Figure 8C). In contrast, older, high basal area forests (Figure 8D) were dominated by P. menzeisii (Figure 8A) and A. grandis and concolor (Figure 8B). Furthermore, the young forests exhibit substantial heterogeneity with patches of near complete dominance of P. ponderosa.
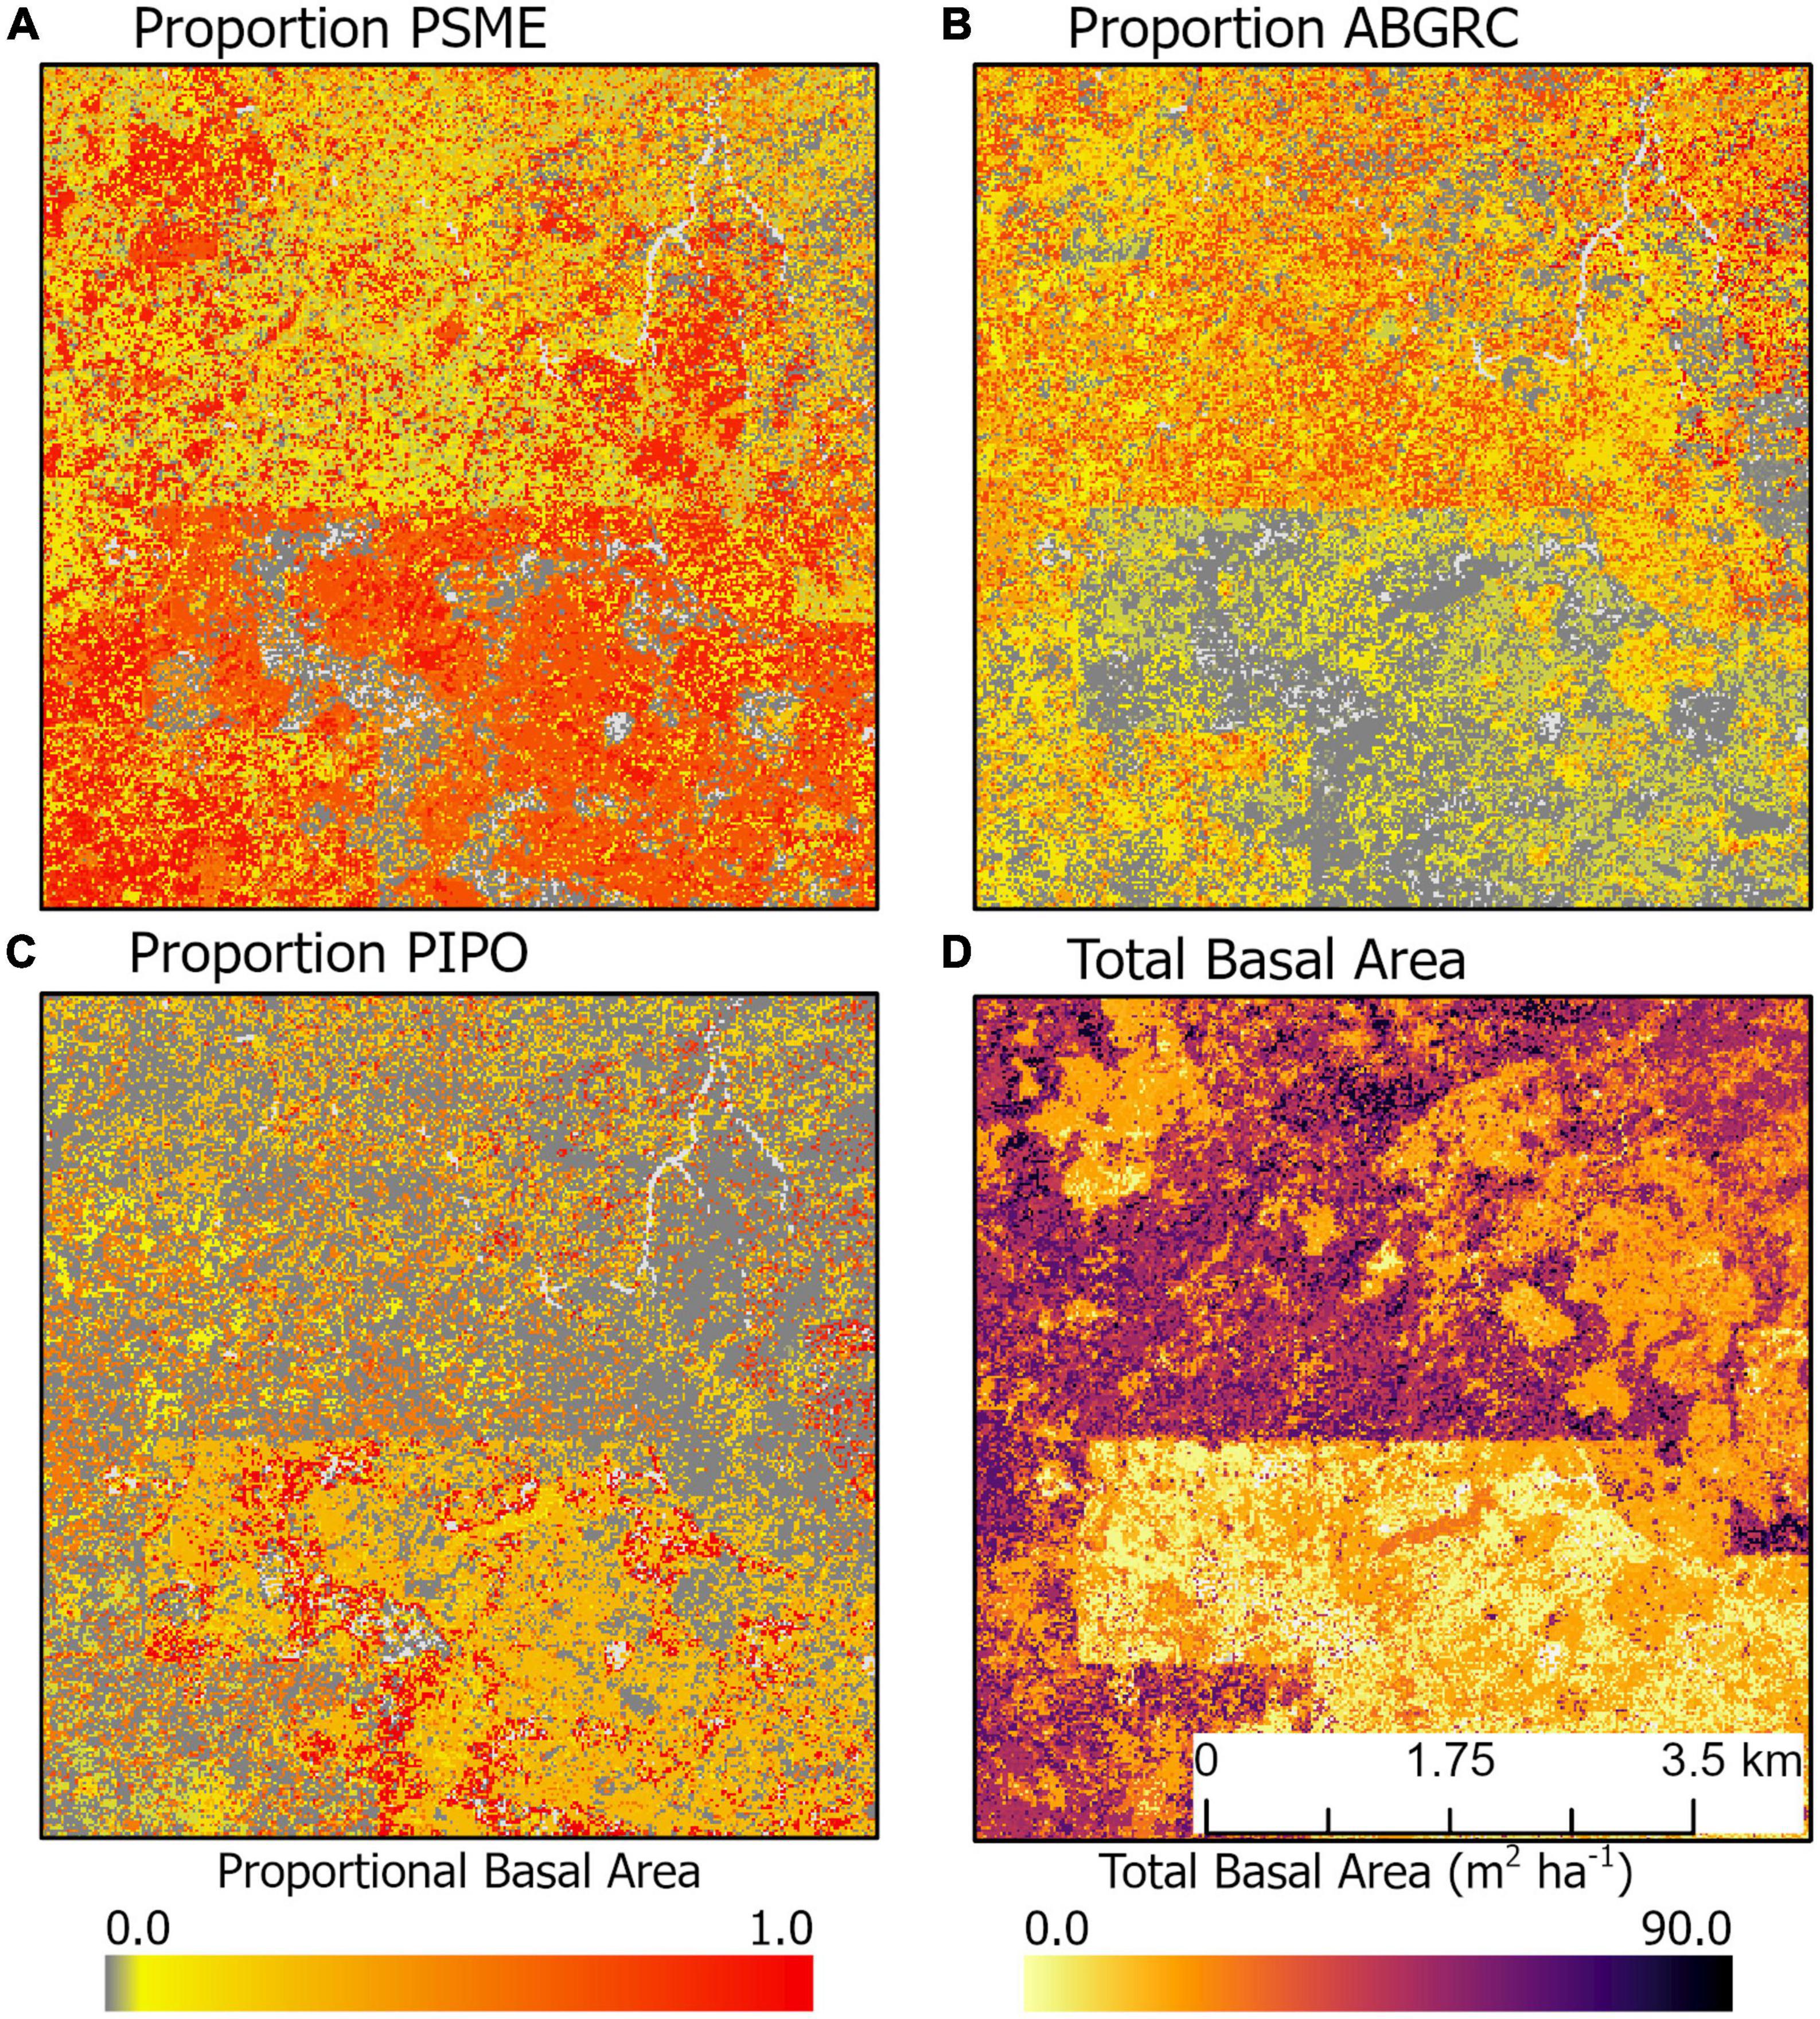
Figure 8. Example of spatial variation in the proportional basal area of (A) P. menzeisii, (B) A. grandis and A. concolor, and (C) P. ponderosa compared to (D) total basal area. This area is northeast of Trout Lake, WA, United States.
Discussion
The literature regarding tree species classification has been expanding but is usually too localized to form the basis for forest inventory or regional approaches (Fassnacht et al., 2016). The current research provides a regional approach to tree species community mapping while also addressing the multi-scale drivers of coniferous tree species occurrence and abundance in eastern Washington, USA. The differences in predictive capacity of models with and without remote sensing observed in this study imply that abiotic environmental drivers, such as climate and topography, are insufficient to explain geographic patterns of tree community structure for 10 coniferous tree species in eastern Washington, USA. In our eastern Washington study region, incorporating remote sensing into modeling and mapping improved proportional basal area predictions, but not necessarily presence and absence predictions (Figures 2, 3), results similar to others in the region. For example, the addition of height information from lidar with satellite imagery and environmental data for GNN resulted in little improvement in species basal area predictions in central Oregon (Zald et al., 2014). In western Washington, climate, topography, and location without remote sensing explained most of the patterns of species presence and absence (Ohmann and Gregory, 2002; Ohmann et al., 2007). Therefore, results from this and previous studies indicate that the addition of remote sensing is most useful for species abundance as opposed to species occurrence in the Pacific Northwest, USA.
The substantial increases in R2 for the proportional basal area (0.24–0.45; Figure 3) further supports the concept that remote sensing (e.g., forest height and spectral properties) provide valuable improvements to tree species distribution predictions (Zimmermann et al., 2007; He et al., 2015), including relative abundance related to forest stand structure. As noted for tree species distribution modeling (Canham and Thomas, 2010), our forest mapping results support the idea that environmental conditions constrain species ranges (e.g., Rehfeldt et al., 2006; Ohmann et al., 2007; Coops and Waring, 2011), but local forest dynamics processes, such as disturbance, post-disturbance seed production and regeneration, and fine-scale variation in topo-edaphic conditions, may be more important for species abundance and dominance. Such multi-scale drivers form the basis of metacommunity ecology frameworks for integrating local and regional ecological dynamics (Thompson et al., 2020).
Geographic patterns in tree species’ proportional basal area implied the dominant controls on tree community structure depended on the scale of inference. Across the entire study region, species exhibited distinct distributions and areas of community dominance (Figure 5), which might be related to plant functional traits. When species were aggregated based on drought or fire tolerance (Table 1), very intolerant and very tolerant groups’ tree proportional basal area were better predicted compared to moderate tolerance groups (Figure 4), indicating potentially common drivers of species distribution and dominance for species specialized to specific moisture conditions, either wet or dry. The mean proportional basal area for intolerant and very intolerant drought and fire species decreased with water deficit and the very tolerant group increased (Figure 6), indicating that water limitation was an important broad-scale constraint on tree species community composition. Additionally, the proportional basal area of some species increased and other decreased with canopy height across the entire study region (Figure 7). The patterns were generally consistent with the increasing dominance of P. menziessi, T. heterophylla, T. plicata, and A. amabilis (Figure 5) in taller forests often associated with the western extent of our study region (Figure 1). That gradient may reflect broad-scale differences in plant community associated with the influence of moisture limitation on forest productivity. However, at smaller scales (e.g., sub-kilometer), proportional basal area patterns appeared to be related to forest biomass, perhaps reflecting the local role of forest disturbance in shaping species dominance (Figure 8).
As our results indicate, accurate and scalable predictions of species composition based on satellite imagery remain challenging (sensu Walsh, 1980). In terms of species occurrence, commission errors were substantial, though censoring small basal area predictions (<1 m2 ha–1) to zero dramatically improved performance while having little effect on proportional basal area predictions (Figure 2). It seems likely to us that pixel aggregation (25 pixels forming the plot footprint) contributed to the commission errors, which would also explain why excluding low basal area species seems to dramatically improve accuracy for species occurrence predictions but have little influence of proportional basal area (Figure 2). Substantial uncertainties in predicting forest composition and dominance (e.g., Figure 4) were observed even when examining better-predicted species (e.g., PIPO). There was some indication of improvements in accuracy when grouping by drought or fire tolerance (Figure 4), implying that communities of tree species may be constrained by common environmental filters.
We anticipate several areas for improvement of species composition mapping in the Pacific Northwest and elsewhere. Our current study was limited by the available plot pool due to the area where data were available (Figure 1) and the time frame for which we had plot data (2012–2016). Temporal mismatches between the remote sensing (2017) and the plot data may also have contributed to modeling and mapping errors which we expect would improve as additional years of remote sensing become available. As additional plot measurements and remote sensing years are integrated into mapping frameworks, we anticipate improved maps. We expect reduced noise in Sentinel-2 imagery going forward as surface reflectance calculations are being applied to the backlog of imagery and temporal smoothing associated with change detection algorithms can be applied as the satellite’s tenure approaches a decade (Kennedy et al., 2018; Bell et al., 2021). As that time series grows longer, the rapid return frequency of the Sentinel-2 constellation will facilitate improved characterization of phenological metrics useful for species mapping with multispectral data (Wilson et al., 2012; Pasquarella et al., 2018; Puletti et al., 2018; Grabska et al., 2019; Adams et al., 2020).
High-resolution aerial photography, upon which DAP is based, may also provide a basis for characterizing sub-pixel forest structures relevant to identifying tree species. Texture metrics of NAIP imagery can be useful in mapping canopy and sub-canopy tree species, such as in montane and subalpine forests in southern Colorado (Savage et al., 2017). Furthermore, if DAP can become a common extension of the existing state-wide imagery acquisitions of NAIP, there will be opportunities to incorporate wall-to-wall vegetation height information into interannual and decadal monitoring programs.
This research focused only on eastern Washington, USA, and the 10 coniferous tree species that dominate those landscapes. Across these landscapes, forests differ dramatically in structure, from open woodlands to closed canopy, multi-layered forests, and climate varies substantially, with for example mean annual temperature ranging from −6.7 to 12.3°C (Figure 1). However, it is possible that our results would not be replicated in other geographies where different species dominate or different processes shape species composition and community structure. Community ecology in general has recognized the importance of multiscale drivers of community assembly and structure (Brown et al., 2017), but there is still a need to understand how the importance of differing processes variy across landscapes with different species pools, climates, and disturbance histories. Additionally, location variables used in modeling may perform as a proxy for other environmental drivers, including climate and topography, soils, historical patterns of disturbance associated with human activity, and limitations to dispersal not explicitly represented in the analyses. In particular, it would be interesting to examine species distributional patterns as a function of proximity to human population centers as those areas may differentially impact disturbance dynamics. Future research should examine variation in the predictive capacity of environmental vs. remote sensing data for tree species composition across other regions to assess the generality of our results.
Conclusion
This study highlights the utility of remote sensing as a foundation for mapping tree species composition, especially when the proportional basal area of tree species and their dominance in local communities must be assessed. We found that in eastern Washington, USA, differing combinations of environmental data (climate and location) were typically sufficient to predict the occurrence of 10 temperate coniferous tree species, but that topography and remote sensing were also required to predict tree community structure and composition. Differences in model performance, specifically the greater contribution of remote sensing to the prediction of proportional basal area vs. presence and absence, show how different ecological processes may constrain species abundance (forest disturbance and structure) vs. occurrence (environmental niche). Further work is needed to assess the generality of these results across biomes and plant functional types. However, new remote sensing, such as Sentinel-2 and DAP, appears promising as a basis for mapping as well as making inferences on the fine and broad-scale processes contributing to spatial patterns in biodiversity and community structure.
Data availability statement
Publicly available datasets were analyzed in this study. This data can be found here: This project used publicly available data, including USDA Forest Service Forest Inventory and Analysis data (https://apps.fs.usda.gov/fia/datamart/datamart.html), Sentinel-2 imagery (https://developers.google.com/earth-engine/datasets/catalog/COPERNICUS_S2_SR), topography data (https://www.usgs.gov/programs/national-geospatial-program/national-map), and the climate data (https://www.prism.oregonstate.edu/). DAP data were generated by WADNR and are not currently publicly available (contact co-author Annie Smith). Forest inventory plot coordinates are not distributed to protect landowner privacy.
Author contributions
DB led the overall project, in coordination with MG, DC, and AS. DB and MG led data analysis and initial manuscript writing. All authors contributed to the project development and data acquisition, final manuscript writing and review.
Funding
This research was made possible through funding provided by WADNR Forest Resilience Division (Agreement #93-100006) and the USDA Forest Service Pacific Northwest Research Station and Northwest Region (R6) (19-JV-11261959-064).
Acknowledgments
Plot inventory data were provided by the USDA Forest Service Forest Inventory and Analysis Program, the USDA Forest Service Northwest Region, and WADNR. Climate and DAP data were provided by WADNR. This research benefitted from conversations with Garrett Meigs and Jacob Strunk.
Conflict of interest
The authors declare that the research was conducted in the absence of any commercial or financial relationships that could be construed as a potential conflict of interest.
Publisher’s note
All claims expressed in this article are solely those of the authors and do not necessarily represent those of their affiliated organizations, or those of the publisher, the editors and the reviewers. Any product that may be evaluated in this article, or claim that may be made by its manufacturer, is not guaranteed or endorsed by the publisher.
Author disclaimer
Opinions expressed in this report may not necessarily reflect the position of the U.S. Department of Agriculture or the Forest Service.
Supplementary material
The Supplementary Material for this article can be found online at: https://www.frontiersin.org/articles/10.3389/ffgc.2022.962816/full#supplementary-material
References
Adams, B., Iverson, L., Matthews, S., Peters, M., Prasad, A., and Hix, D. M. (2020). Mapping forest composition with landsat time series: An evaluation of seasonal composites and harmonic regression. Remote Sensing 12:610. doi: 10.3390/rs12040610
Agne, M. C., Beedlow, P. A., Shaw, D. C., Woodruff, D. R., Lee, E. H., Cline, S. P., et al. (2018). Interactions of predominant insects and diseases with climate change in Douglas-fir forests of western Oregon and Washington, U.S.A. For. Ecol. Manag. 409, 317–332. doi: 10.1016/j.foreco.2017.11.004
Allen, C. D., Breshears, D. D., and McDowell, N. G. (2015). On underestimation of global vulnerability to tree mortality and forest die-off from hotter drought in the Anthropocene. Ecosphere 6:129. doi: 10.1890/ES15-00203.1
Allouche, O., Tsoar, A., and Kadmon, R. (2006). Assessing the accuracy of species distribution models: prevalence, kappa and the true skill statistic (TSS). J. Appl. Ecol. 43, 1223–1232. doi: 10.1111/j.1365-2664.2006.01214.x
Astola, H., Häme, T., Sirro, L., Molinier, M., and Kilpi, J. (2019). Comparison of sentinel-2 and landsat 8 imagery for forest variable prediction in boreal region. Remote Sens. Environ. 223, 257–273. doi: 10.1016/j.rse.2019.01.019
Aubin, I., Boisvert-Marsh, L., Kebli, H., McKenney, D., Pedlar, J., Lawrence, K., et al. (2018). Tree vulnerability to climate change: improving exposure-based assessments using traits as indicators of sensitivity. Ecosphere 9:e02108. doi: 10.1002/ecs2.2108
Axelsson, A., Lindberg, E., Reese, H., and Olsson, H. (2021). Tree species classification using Sentinel-2 imagery and Bayesian inference. Int J Appl. Earth Obs. Geoinf. 100:102318. doi: 10.1016/j.jag.2021.102318
Barros, A. M., Ager, A. A., Day, M. A., and Palaiologou, P. (2019). Improving long-term fuel treatment effectiveness in the National Forest System through quantitative prioritization. For. Ecol. Manag. 433, 514–527. doi: 10.1016/j.foreco.2018.10.041
Battles, J. J., Bell, D. M., Kennedy, R. E., Saah, D. S., Collins, B. M., York, R. A., et al. (2018). “Innovations in measuring and manageing forest carbon stocks in California,” in A report for California’s Fourth Climate Change Assessment. CCCA4-CNRA-2018-014, Sacramento, CA: California Natural Resources Agency.
Beaudoin, A., Bernier, P. Y., Guindon, L., Villemaire, P., Guo, X. J., Stinson, G., et al. (2014). Mapping attributes of Canada’s forests at moderate resolution through kNN and MODIS imagery. Canad. J. For. Res. 44, 521–532. doi: 10.1139/cjfr-2013-0401
Bechtold, W. A., and Patterson, P. L. (2005). The enhanced forest inventory and analysis program — national sampling design and estimation procedures. general tehcnical report SRS-GTR-80. Asheville, NC: USDA Forest Service, Southern Research Station, 85.
Bell, D. M., Acker, S. A., Gregory, M. J., Davis, R. J., and Garcia, B. A. (2021). Quantifying regional trends in large live tree and snag availability in support of forest management. For. Ecol. Manag. 479:118554. doi: 10.1016/j.foreco.2020.118554
Bohlin, J., Wallerman, J., and Fransson, J. E. S. (2012). Forest variable estimation using photogrammetric matching of digital aerial images in combination with a high-resolution DEM. Scand. J. For. Res. 27, 692–699. doi: 10.1080/02827581.2012.686625
Brown, B. L., Sokol, E. R., Skelton, J., and Tornwall, B. (2017). Making sense of metacommunities: dispelling the mythology of a metacommunity typology. Oecologia 183, 643–652. doi: 10.1007/s00442-016-3792-1
Burns, R. M., and Honkala, B. H. (1990). “Silvics of North America,” in Agriculture Handbook 654, Vol. 1, Washington, D.C: U.S. Department of Agriculture, Forest Service.
Canham, C. D., and Murphy, L. (2016). The demography of tree species response to climate: Seedling recruitment and survival. Ecosphere 7:e01424. doi: 10.1002/ecs2.1424
Canham, C. D., and Thomas, R. Q. (2010). Frequency, not relative abundance, of temperate tree species varies along climate gradients in eastern North America. Ecology 91, 3433–3440. doi: 10.1890/10-0312.1
Cansler, C. A., Kane, V. R., Hessburg, P. F., Kane, J. T., Jeronimo, S. M. A., Lutz, J. A., et al. (2022). Previous wildfires and management treatments moderate subsequent fire severity. For. Ecol. Manag. 504:119764. doi: 10.1016/j.foreco.2021.119764
Chastain, R., Housman, I., Goldstein, J., and Finco, M. (2019). Empirical cross sensor comparison of Sentinel-2A and 2B MSI, Landsat-8 OLI, and Landsat-7 ETM+ top of atmosphere spectral characteristics over the conterminous United States. Remote Sens. Environ. 221, 274–285. doi: 10.1016/j.rse.2018.11.012
Clark, J. S., Gelfand, A. E., Woodall, C. W., and Zhu, K. (2014). More than the sum of the parts: forest climate response from joint species distribution models. Ecol. Appl. 24, 990–999. doi: 10.1890/13-1015.1
Clark, J. S., Nemergut, D., Seyednasrollah, B., Turner, P. J., and Zhang, S. (2017). Generalized joint attribute modeling for biodiversity analysis: median-zero, multivariate, multifarious data. Ecol. Monogra. 87, 34–56. doi: 10.1002/ecm.1241
Cohen, W. B., and Goward, S. N. (2004). Landsat’s role in ecological applications of remote sensing. BioScience 54, 535–545. doi: 10.1641/0006-3568(2004)054[0535:LRIEAO]2.0.CO;2
Cohen, W. B., and Spies, T. A. (1992). Estimating structural attributes of Douglas-fir/western hemlock forest stands from landsat and SPOT imagery. Remote Sens. Environ. 41, 1–17. doi: 10.1016/0034-4257(92)90056-P
Cohen, W. B., Maiersperger, T. K., Spies, T. A., and Oetter, D. R. (2001). Modelling forest cover attributes as continuous variables in a regional context with Thematic Mapper data. Int. J. Remote Sens. 22, 2279–2310. doi: 10.1080/01431160121472
Coops, N. C., and Waring, R. H. (2011). Estimating the vulnerability of fifteen tree species under changing climate in Northwest North America. Ecol. Model. 222, 2119–2129. doi: 10.1016/j.ecolmodel.2011.03.033
Crist, E. P., and Cicone, R. C. (1984). A physically-based transformation of Thematic Mapper data — The TM Tasseled Cap. IEEE Trans. Geosci. Remote Sens. 22, 256–263. doi: 10.1109/TGRS.1984.350619
Davis, R. J., Ohmann, J. L., Kennedy, R. E., Cohen, W. B., Gregory, M. J., Yang, Z., et al. (2015). Northwest Forest Plan–the first 20 years (1994-2013): status and trends of late-successional and old-growth forests. General Technical Report PNW-GTR-911. Portland. OR: USDA Forest Service, Pacific Northwest Research Station, 112. doi: 10.2737/PNW-GTR-911
DeMeo, T., Haugo, R., Ringo, C., Kertis, J., Acker, S., Simpson, M., et al. (2018). Expanding our understanding of forest structural restoration needs in the pacific northwest. Northwest Sci. 92:18. doi: 10.3955/046.092.0104
Dobrowski, S. Z., Abatzoglou, J., Swanson, A. K., Greenberg, J. A., Mynsberge, A. R., Holden, Z. A., et al. (2013). The climate velocity of the contiguous United States during the 20th century. Glob. Change Biol. 19, 241–251. doi: 10.1111/gcb.12026
Dormann, C. F., McPherson, J. M., Araújo, M. B., Bivand, R., Bolliger, J., Carl, G., et al. (2007). Methods to account for spatial autocorrelation in the analysis of species distributional data: a review. Ecography 30, 609–628. doi: 10.1111/j.2007.0906-7590.05171.x
Duveneck, M. J., Thompson, J. R., and Wilson, B. T. (2015). An imputed forest composition map for New England screened by species range boundaries. For. Ecol. Manag. 347, 107–115. doi: 10.1016/j.foreco.2015.03.016
Elith, J., Graham, C. H., Anderson, R., Dudik, M., Ferrier, S., Guisan, A., et al. (2006). Novel methods improve prediction of species’ distributions from occurrence data. Ecography 29, 129–151. doi: 10.1111/j.2006.0906-7590.04596.x
Fassnacht, F. E., Latifi, H., Stereńczak, K., Modzelewska, A., Lefsky, M., Waser, L. T., et al. (2016). Review of studies on tree species classification from remotely sensed data. Remote Sens. Environ. 186, 64–87. doi: 10.1016/j.rse.2016.08.013
Flood, N. (2013). Seasonal composite landsat TM/ETM+ images using the medoid (a Multi-Dimensional Median). Remote Sens. 5, 6481–6500. doi: 10.3390/rs5126481
Flood, N. (2017). Comparing Sentinel-2A and Landsat 7 and 8 Using Surface Reflectance over Australia. Remote Sens. 9:659. doi: 10.3390/rs9070659
Forzieri, G., Dakos, V., McDowell, N. G., Ramdane, A., and Cescatti, A. (2022). Emerging signals of declining forest resilience under climate change. Nature 7923, 534–539. doi: 10.1038/s41586-022-04959-9
Franklin, J. (2013). Species distribution models in conservation biogeography: developments and challenges. Divers. Distrib. 19, 1217–1223. doi: 10.1111/ddi.12125
Gesch, D. B. (2007). “The national elevation dataset. Pages 99–118,” in Digital elevational model technologies and applications: The DEM Users Manual, 2nd Edn, ed. D. Maune Bethesda, MD: American Society for Photogrammetry and Remote Sensing.
Gesch, D., Oimoen, M., Greenlee, S., Nelson, C., Steuck, M., and Taylor, D. (2002). The national elevation dataset. Photogramm. Eng. Remote Sens. 68, 5–11.
Goodbody, T. R. H., Coops, N. C., and White, J. C. (2019). Digital aerial photogrammetry for updating area-based forest inventories: A review of opportunities, challenges, and future directions. Curr. For. Rep. 5, 55–75. doi: 10.1007/s40725-019-00087-2
Gorelick, N., Hancher, M., Dixon, M., Ilyushchenko, S., Thau, D., and Moore, R. (2017). Google Earth Engine: Planetary-scale geospatial analysis for everyone. Remote Sens. Environ. 202, 18–27. doi: 10.1016/j.rse.2017.06.031
Grabska, E., Hostert, P., Pflugmacher, D., and Ostapowicz, K. (2019). Forest stand species mapping using the sentinel-2 time series. Remote Sens. 11:1197. doi: 10.3390/rs11101197
Hall, R. J., Skakun, R. S., Arsenault, E. J., and Case, B. S. (2006). Modeling forest stand structure attributes using Landsat ETM+ data: Application to mapping of aboveground biomass and stand volume. For. Ecol. Manag. 225, 378–390. doi: 10.1016/j.foreco.2006.01.014
Haugo, R., Zanger, C., DeMeo, T., Ringo, C., Shlisky, A., Blankenship, K., et al. (2015). A new approach to evaluate forest structure restoration needs across Oregon and Washington, USA. For. Ecol. Manag. 335, 37–50. doi: 10.1016/j.foreco.2014.09.014
He, K. S., Bradley, B. A., Cord, A. F., Rocchini, D., Tuanmu, M. N., Schmidtlein, S., et al. (2015). Will remote sensing shape the next generation of species distribution models? Remote Sens. Ecol. Conserv. 1, 4–18. doi: 10.1002/rse2.7
Henderson, E. B., Bell, D. M., and Gregory, M. J. (2019). Vegetation mapping to support greater sage-grouse habitat monitoring and management: multi- or univariate approach? Ecosphere 10:e02838. doi: 10.1002/ecs2.2838
Hessburg, P. F., Churchill, D. J., Larson, A. J., Haugo, R. D., Miller, C., Spies, T. A., et al. (2015). Restoring fire-prone Inland Pacific landscapes: seven core principles. Landscape Ecol. 30, 1805–1835. doi: 10.1007/s10980-015-0218-0
Hoscilo, A., and Lewandowska, A. (2019). Mapping forest type and tree species on a regional scale using multi-temporal sentinel-2 data. Remote Sens. 11:929. doi: 10.3390/rs11080929
Isaacson, B. N., Serbin, S. P., and Townsend, P. A. (2012). Detection of relative differences in phenology of forest species using Landsat and MODIS. Landscape Ecol. 27, 529–543. doi: 10.1007/s10980-012-9703-x
Kane, V. R., Bakker, J. D., McGaughey, R. J., Lutz, J. A., Gersonde, R. F., and Franklin, J. F. (2010a). Examining conifer canopy structural complexity across forest ages and elevations with LiDAR data. Canad. J. For. Res. 40, 774–787. doi: 10.1139/X10-064
Kane, V. R., McGaughey, R. J., Bakker, J. D., Gersonde, R. F., Lutz, J. A., and Franklin, J. F. (2010b). Comparisons between field- and LiDAR-based measures of stand structural complexity. Canad. J. For. Res. 40, 761–773. doi: 10.1139/X10-024
Kennedy, R. E., Andréfouët, S., Cohen, W. B., Gómez, C., Griffiths, P., Hais, M., et al. (2014). Bringing an ecological view of change to Landsat-based remote sensing. Front. Ecol. Environ. 12:339–346. doi: 10.1890/130066
Kennedy, R. E., Ohmann, J., Gregory, M., Roberts, H., Yang, Z., Bell, D. M., et al. (2018). An empirical, integrated forest biomass monitoring system. Environ. Res. Lett. 13:41001. doi: 10.1088/1748-9326/aa9d9e
Kleiber, C., and Zeileis, A. (2008). Applied Econometrics with R. New York, NY: Springer-Verlag. doi: 10.1007/978-0-387-77318-6
Kolb, T. E., Fettig, C. J., Ayres, M. P., Bentz, B. J., Hicke, J. A., Mathiasen, R., et al. (2016). Observed and anticipated impacts of drought on forest insects and diseases in the United States. For. Ecol. Manag. 380, 321–334. doi: 10.1016/j.foreco.2016.04.051
Laurin, G. V., Puletti, N., Hawthorne, W., Liesenberg, V., Corona, P., Papale, D., et al. (2016). Discrimination of tropical forest types, dominant species, and mapping of functional guilds by hyperspectral and simulated multispectral Sentinel-2 data. Remote Sens. Environ. 176, 163–176. doi: 10.1016/j.rse.2016.01.017
Littell, J. S., McKenzie, D., Kerns, B. K., Cushman, S., and Shaw, C. G. (2011). Managing uncertainty in climate-driven ecological models to inform adaptation to climate change. Ecosphere 2:art102. doi: 10.1890/ES11-00114.1
Loehman, R. A., Keane, R. E., Holsinger, L. M., and Wu, Z. (2017). Interactions of landscape disturbances and climate change dictate ecological pattern and process: spatial modeling of wildfire, insect, and disease dynamics under future climates. Landscape Ecol. 32, 1447–1459. doi: 10.1007/s10980-016-0414-6
Lutz, J. A., van Wagtendonk, J. W., and Franklin, J. F. (2010). Climatic water deficit, tree species ranges, and climate change in Yosemite National Park. J. Biogeogra. 37, 936–950. doi: 10.1111/j.1365-2699.2009.02268.x
Malcolm, J. R., Brousseau, B., Jones, T., and Thomas, S. C. (2021). Use of Sentinel-2 Data to Improve Multivariate Tree Species Composition in a Forest Resource Inventory. Remote Sens. 13:4297. doi: 10.3390/rs13214297
McDowell, N. G., Coops, N. C., Beck, P. S. A., Chambers, J. Q., Gangodagamage, C., Hicke, J. A., et al. (2015). Global satellite monitoring of climate-induced vegetation disturbances. Trends Plant Sci. 20, 114–123. doi: 10.1016/j.tplants.2014.10.008
McGaughey, R. J. (2016). FUSION / LDV : Software for LIDAR Data Analysis and Visualization, FUSION Version 3.60+. Page US Department of Agriculture, Forest Service. Seattle, WA: Pacific Northwest Research Station.
McRoberts, R. E., and Tomppo, E. O. (2007). Remote sensing support for national forest inventories. Remote Sens. Environ. 110, 412–419. doi: 10.1016/j.rse.2006.09.034
Mildrexler, D., Yang, Z., Cohen, W. B., and Bell, D. M. (2016). A forest vulnerability index based on drought and high temperatures. Remote Sens. Environ. 173, 314–325. doi: 10.1016/j.rse.2015.11.024
Millar, C. I., and Stephenson, N. L. (2015). Temperate forest health in an era of emerging megadisturbance. Science 349, 823–826. doi: 10.1126/science.aaa9933
Moritz, M. A., Parisien, M.-A., Batllori, E., Krawchuk, M. A., Van Dorn, J., Ganz, D. J., et al. (2012). Climate change and disruptions to global fire activity. Ecosphere 3, 1–22. doi: 10.1890/ES11-00345.1
North, M. P., Tompkins, R. E., Bernal, A. A., Collins, B. M., Stephens, S. L., and York, R. A. (2022). Operational resilience in western US frequent-fire forests. For. Ecol. Manag. 507:120004. doi: 10.1016/j.foreco.2021.120004
Ohmann, J. L., and Gregory, M. J. (2002). Predictive mapping of forest composition and structure with direct gradient analysis and nearest- neighbor imputation in coastal Oregon, U.S.A. Canad. J. For. Res. 32, 725–741. doi: 10.1139/x02-011
Ohmann, J. L., Gregory, M. J., and Roberts, H. M. (2014). Scale considerations for integrating forest inventory plot data and satellite image data for regional forest mapping. Remote Sens. Environ. 151, 3–15. doi: 10.1016/j.rse.2013.08.048
Ohmann, J. L., Gregory, M. J., and Spies, T. A. (2007). Influence of environment, disturbance, and ownership on forest vegetation of coastal Oregon. Ecol. Appl. 17, 18–33. doi: 10.1890/1051-0761(2007)017[0018:IOEDAO]2.0.CO;2
Ohmann, J. L., Gregory, M. J., Henderson, E. B., and Roberts, H. M. (2011). Mapping gradients of community composition with nearest-neighbour imputation: extending plot data for landscape analysis. J. Veg. Sci. 22, 660–676. doi: 10.1111/j.1654-1103.2010.01244.x
Pasquarella, V. J., Holden, C. E., and Woodcock, C. E. (2018). Improved mapping of forest type using spectral-temporal Landsat features. Remote Sens. Environ. 210, 193–207. doi: 10.1016/j.rse.2018.02.064
Pollock, L. J., Tingley, R., Morris, W. K., Golding, N., O’Hara, R. B., Parris, K. M., et al. (2014). Understanding co-occurrence by modelling species simultaneously with a Joint Species Distribution Model (JSDM). Methods Ecol. Evol. 5, 397–406. doi: 10.1111/2041-210X.12180
Powell, S. L., Cohen, W. B., Healey, S. P., Kennedy, R. E., Moisen, G. G., Pierce, K. B., et al. (2010). Quantification of live aboveground forest biomass dynamics with Landsat time-series and field inventory data: A comparison of empirical modeling approaches. Remote Sens. Environ. 114, 1053–1068. doi: 10.1016/j.rse.2009.12.018
Prichard, S. J., Hessburg, P. F., Hagmann, R. K., Povak, N. A., Dobrowski, S. Z., Hurteau, M. D., et al. (2021). Adapting western North American forests to climate change and wildfires: 10 common questions. Ecol. Appl. 31:e02433. doi: 10.1002/eap.2433
Puletti, N., Chianucci, F., and Castaldi, C. (2018). Use of Sentinel-2 for forest classification in Mediterranean environments. Ann. Silvic. Res. 42, 32–38.
R Development Core Team (2020). R: A language and environment for statistical computing, Version 4.0.3. Vienna: R Foundation for Statistical Computing.
Rehfeldt, G. E., Crookston, N. L., Warwell, M. V., and Evans, J. S. (2006). Empirical analyses of plant-climate relationships for the Western United States. Int. J. Plant Sci. 167, 1123–1150. doi: 10.1086/507711
Riley, K. L. I, Grenfell, C., and Finney, M. A. (2016). Mapping forest vegetation for the western United States using modified random forests imputation of FIA forest plots. Ecosphere 7:e01472. doi: 10.1002/ecs2.1472
Savage, S. L., Lawrence, R. L., and Squires, J. R. (2017). Mapping post-disturbance forest landscape composition with Landsat satellite imagery. For. Ecol. Manag. 399, 9–23. doi: 10.1016/j.foreco.2017.05.017
Schoennagel, T., Balch, J. K., Brenkert-Smith, H., Dennison, P. E., Harvey, B. J., Krawchuk, M. A., et al. (2017). Adapt to more wildfire in western North American forests as climate changes. Proc. Natl Acad. Sci. U. S. A. 114, 4582–4590. doi: 10.1073/pnas.1617464114
Shi, T., and Xu, H. (2019). Derivation of Tasseled Cap Transformation Coefficients for Sentinel-2 MSI At-Sensor Reflectance Data. IEEE J. Sel. Top. Appl. Earth Obs. Remote Sens. 12, 4038–4048. doi: 10.1109/JSTARS.2019.2938388
Stohlgren, T. J., and Schnase, J. L. (2006). Risk analysis for biological hazards: What we need to know about invasive species. Risk Anal. 26, 163–173. doi: 10.1111/j.1539-6924.2006.00707.x
Strunk, J. L., Bell, D. M., and Gregory, M. J. (2022). Pushbroom photogrammetric heights enhance state-level forest attribute mapping with landsat and environmental gradients. Remote Sens. 14:3433. doi: 10.3390/rs14143433
Strunk, J. L., Gould, P. J., Packalen, P., Gatziolis, D., Greblowska, D., Maki, C., et al. (2020). Evaluation of pushbroom DAP relative to frame camera DAP and lidar for forest modeling. Remote Sens. Environ. 237:111535. doi: 10.1016/j.rse.2019.111535
Ter Braak, C. J. F. (1986). Canonical correspondence analysis: A new eigenvector technique for multivariate direct gradient analysis. Ecology 67, 1167–1179. doi: 10.2307/1938672
Thompson, P. L., Guzman, L. M., De Meester, L., Horváth, Z., Ptacnik, R., Vanschoenwinkel, B., et al. (2020). A process-based metacommunity framework linking local and regional scale community ecology. Ecol. Lett. 23, 1314–1329. doi: 10.1111/ele.13568
Tomppo, E., Olsson, H., Ståhl, G., Nilsson, M., Hagner, O., and Katila, M. (2008). Combining national forest inventory field plots and remote sensing data for forest databases. Remote Sens. Environ. 112, 1982–1999. doi: 10.1016/j.rse.2007.03.032
Walsh, S. J. (1980). Coniferous tree species mapping using LANDSAT data. Remote Sens. Environ. 9, 11–26. doi: 10.1016/0034-4257(80)90044-9
Wang, T., Hamann, A., Spittlehouse, D., and Carroll, C. (2016). Locally downscaled and spatially customizable climate data for historical and future periods for North America. PLoS One 11:e0156720. doi: 10.1371/journal.pone.0156720
Washington State Department of Natural Resources (2020). Forest health assessment and treatment framework (RCW 76.06.200). Olympia, WA: Washington State Department of Natural Resoures.
Westerling, A. L. R. (2016). Increasing western US forest wildfire activity: sensitivity to changes in the timing of spring. Philos. Trans. R. Soc. B: Biol. Sci. 371, 20150178. doi: 10.1098/rstb.2015.0178
Westerling, A. L., Hidalgo, H. G., Cayan, D. R., and Swetnam, T. W. (2006). Warming and earlier spring increase Western U.S. forest wildfire activity. Science 313, 940–943. doi: 10.1126/science.1128834
White, J. C., Coops, N. C., Wulder, M. A., Vastaranta, M., Hilker, T., and Tompalski, P. (2016). Remote sensing technologies for enhancing forest inventories: A review. Canad. J. Remote Sens. 42, 619–641. doi: 10.1080/07038992.2016.1207484
White, J. C., Stepper, C., Tompalski, P., Coops, N. C., and Wulder, M. A. (2015). Comparing ALS and image-based point cloud metrics and modelled forest inventory attributes in a complex coastal forest environment. Forests 6, 3704–3732. doi: 10.3390/f6103704
Williams, A. P., Allen, C. D., Macalady, A. K., Griffin, D., Woodhouse, C. A., Meko, D. M., et al. (2012). Temperature as a potent driver of regional forest drought stress and tree mortality. Nat. Clim. Change 3, 292–297. doi: 10.1038/nclimate1693
Wilson, B. T., Knight, J. F., and McRoberts, R. E. (2018). Harmonic regression of Landsat time series for modeling attributes from national forest inventory data. ISPRS J. Photogramm. Remote Sens. 137, 29–46. doi: 10.1016/j.isprsjprs.2018.01.006
Wilson, B. T., Lister, A. J., and Riemann, R. I. (2012). A nearest-neighbor imputation approach to mapping tree species over large areas using forest inventory plots and moderate resolution raster data. For. Ecol. Manag. 271, 182–198. doi: 10.1016/j.foreco.2012.02.002
Wilson, B. T., Woodall, C. W., and Griffith, D. M. (2013). Imputing forest carbon stock estimates from inventory plots to a nationally continuous coverage. Carbon Balance Manag. 8, 1–15. doi: 10.1186/1750-0680-8-1
Zald, H. S. J., Ohmann, J. L., Roberts, H. M., Gregory, M. J., Henderson, E. B., McGaughey, R. J., et al. (2014). Influence of lidar, Landsat imagery, disturbance history, plot location accuracy, and plot size on accuracy of imputation maps of forest composition and structure. Remote Sens. Environ. 143, 26–38. doi: 10.1016/j.rse.2013.12.013
Zhang, Q., He, H. S., Liang, Y., Hawbaker, T. J., Henne, P. D., Liu, J., et al. (2018). Integrating forest inventory data and MODIS data to map species-level biomass in chinese boreal forests. Canad. J. For. Res. 48, 461–479. doi: 10.1139/cjfr-2017-0346
Keywords: digital aerial photogrammetry (DAP), nearest neighbor imputation, Sentinel-2, tree community, forest mapping
Citation: Bell DM, Gregory MJ, Churchill DJ and Smith AC (2022) Mapping with height and spectral remote sensing implies that environment and forest structure jointly constrain tree community composition in temperate coniferous forests of eastern Washington, United States. Front. For. Glob. Change 5:962816. doi: 10.3389/ffgc.2022.962816
Received: 06 June 2022; Accepted: 07 October 2022;
Published: 22 November 2022.
Edited by:
Guobao Xu, Northwest Institute of Eco-Environment and Resources (CAS), ChinaReviewed by:
Andrei G. Lapenas, Albany State University, United StatesPiermaria Corona, Council for Agricultural and Economics Research (CREA), Italy
Copyright © 2022 Bell, Gregory, Churchill and Smith. This is an open-access article distributed under the terms of the Creative Commons Attribution License (CC BY). The use, distribution or reproduction in other forums is permitted, provided the original author(s) and the copyright owner(s) are credited and that the original publication in this journal is cited, in accordance with accepted academic practice. No use, distribution or reproduction is permitted which does not comply with these terms.
*Correspondence: David M. Bell, david.bell@usda.gov