Spatial distributions and multi-factor driving mechanism of landslide in southern Liaodong Peninsula
 Yuanyuan Li1
  Defeng Zheng
 Tingkai Nian
- 1School of Geography, Liaoning Normal University, Dalian, Liaoning, China
- 2State Key Laboratory of Coastal and Offshore Engineering, Dalian Univ. of Technology, Dalian, Liaoning, China
Coastal areas are characterized by high levels of urbanization and also the most active and highly sensitive to geological activities. Due to the impact of global climate change, landslides occur frequently in coastal areas, which have significantly impacted the sustainable socio-economic development of the region. Therefore, studying the spatial distribution of landslides and the factors that drive them holds immense practical significance for the geohazards prevention and mitigation work and optimization of ecological security patterns in coastal areas. This study takes the southern Liaodong Peninsula as the study area and analyzes the spatial distribution characteristics and influence mechanism of landslides. We first applied the Getis-Ord Gi*, kernel density analysis techniques, and Ripley’s K function to explore the spatial distribution characteristics of landslides in the study area at different scales. Then, we employed the information value method to test for the linkage relationships between the driving factors and landslides. Finally, we utilized the geographical detector to reveal the potential impacts and interaction of the driving factors on landslides. The results showed that: (1) landslides in the Southern Liaodong Peninsula exhibit strong spatial clustering characteristics, and have a spatial scale effect; (2) the high susceptibility areas are mainly concentrated in the southern hilly regions and the mountainous regions in the northern parts of the study area; (3) The information value method reveals that there is an optimal combination of factors driving landslides. (4) The factor detector analysis reveals that the primary driver of landslide spatial distribution is the geomorphological types (q-value of 39.10%). (5) The interaction detector indicates that the interplay of all driving factor pairs exhibited an enhanced effect, which is not a simple superposition effect but bivariate and non-linear. The collective influence of natural factors and human activities holds a more substantial influence over landslide development and distribution. The research offers guidance for the execution of landslide prevention initiatives and the establishment of preservation policies for the ecological environment in the southern Liaodong Peninsula region.
1 Introduction
Landslide is a widespread natural disaster. It has the characteristics of regionality, multi-causality, strong destructiveness, and irremovability (Bozzolan et al., 2023). According to the GFLD (Global Fatal Landslide Database), 55,997 people have died due to landslides worldwide in the past 50 years (Dowling and Santi, 2014; Lin et al., 2017; Wu et al., 2023a). The spatial distribution of landslides is heterogeneous, with Asia accounting for 75% of the total and occurring mainly in developing countries (Froude and Petley, 2018; Lin et al., 2021). China’s geological environment is complex. Due to the extreme climate and human engineering activities occurring frequently (Dong et al., 2020; Guo et al., 2023), China has become one of the most serious landslide countries in the past few decades (Zhang and Huang, 2018; Huang et al., 2022). Major news websites and experts’ blogs (https://blogs-agu-org.translate.goog/landslideblog) show that landslides almost occur every day. It is important and necessary to find out where the landslide hotspots are and what factors can drive the occurrence of landslides. Such information would provide a crucial reference for researchers and decision-makers with a reliable basis for disaster prevention, mitigation, and regional planning. It has great significance for early warning of geological disasters.
In terms of the characteristics of the spatial distribution of landslides, many researchers have proposed various methods to research the distribution law of landslides by investigating the relative relationship between the location of landslides and the spatial location of factors such as slope, elevation, stratigraphic lithology, land use, precipitation and so on (Pardeshi et al., 2013; Bucci et al., 2016; Yang et al., 2021). Zhang and Huang (2018) analyzed the spatial distribution of landslide disasters by mapping historical landslide sites on different scales of administrative districts. Sepúlveda and Petley (2015) analyzed the relationship between hazard points and stratigraphic lithology as well as the spatial and temporal distribution of rainfall. Qiu et al. (2019) explored the spatial distribution characteristics of landslides using spatial point pattern analysis.
Focusing on the exploration of landslide driving factors exploring the landslide driving factors, it started in the 1950s and has since developed various methods, such as physical models, empirical models, and data models, and has achieved significant progress in theoretical research and technical methods (Kavzoglu et al., 2015; Pawluszek and Borkowski, 2017; Piacentini et al., 2018; Dahim et al., 2023). Pawluszek and Borkowski (2017) used the Analytic Hierarchy Process (AHP) method to study the contribution value of factors derived from the digital elevation model (DEM). Kavzoglu et al. (2015) used genetic algorithms to select 16 influencing factors and validated the results by the logistic regression (LR) model, which indicated that lithology and rainfall were the main controlling factors. Dahim et al. (2023) employed machine learning methods to filter a subset from the landslide factors database and to produce a landslide susceptibility map. Among these statistical analysis methods, the factor weight allocation process of the model built relying on the experience of experts is greatly affected by subjectivity (Bahrami et al., 2021). The methods based on machine learning offer higher prediction accuracy, but the modeling process is more complex and requires a large amount of basic dataset, which is difficult to obtain accurately on a large scale. Therefore, it also limits the accuracy of the assessment results and the applicability of the method (Kavzoglu et al., 2014; Zhu et al., 2018). Nevertheless, the above-mentioned traditional analysis methods are effective in identifying the effect of individual driving elements on spatial distribution characteristics of variables, they are not suitable for revealing the strength of the driving factors and the magnitude of their interactions (Sepúlveda and Petley, 2015; Tang et al., 2021). Therefore, they cannot fully explain the comprehensive impact of the driving mechanism. Many previous studies have shown that the development and distribution of landslides are often comprehensive consequences of the combination and interaction of multiple factors (Bahrami et al., 2021; Hua et al., 2021).
To address such issues, the geographical detector (GeoDetector) serves as a statistical model that can reveal the drivers based on spatial heterogeneity. It can utilize the interaction of influencing factors to perform correlation analysis on target variables and assess the degree of these factors impact the target variables (Wang and Xu, 2017). The major advantage of this approach is that it does not require linear assumptions for the relationship between the response and explanatory variables, as well as between the explanatory variable pairs. This method objectively reveals the spatial correlation between them (Zhou et al., 2018; Song et al., 2020). Additionally, it can be applied to various types of explanatory variables and the outputs have an elegant form and definite physical meaning in the model. The GeoDetector method has been successfully applied to spatial and spatiotemporal prediction and decision-making in a wide field of natural disasters (Wang et al., 2022; Zhang Y. et al., 2023), air pollution (Bai et al., 2019; Xu et al., 2021), public health (Qiao et al., 2019), and engineering (Song et al., 2021), etc.
Landslides in various regions exhibit distinct characteristics. The Liaodong Peninsula region, which is situated amidst the sea on three sides, has a typical low mountainous and hilly environment and coastal landform characteristics. Approximately 82.9% of its total area is covered by mountains and hills, while its coastline spans about 2211km. It is also the geographical center of the “Northeast Asia Economic Circle” and an important node of the “Belt and Road”. The complex engineering geological conditions and rapid urbanization have significantly impacted the fragile geological and ecological environment. As a result, the geohazards occur frequently and have become an important limiting factor for the socio-economic sustainable development of the area. Several researchers have completed landslide susceptibility assessment work in the Southern Liaodong Peninsula area. Liu (2019) selected 8 evaluation indicators of elevation, elevation difference, slope, vegetation cover, land type, precipitation, soil erosion, and soil texture based on AHP and fuzzy comprehensive evaluation (FCE) method to assess the risk of debris flow in the northern mountains of the Dalian area. Li (2021) selected 9 indicators, such as elevation, slope, aspect, lithology, etc., and comprehensively analyzed the sensitivity of landslides in Zhuanghe using the information value (InforVal) model. Wang (2022) selected 11 factors, such as DEM data and its derivatives, as well as flood season precipitation, and mapped landslide sensitivity zones in Dalian area with the LR model. These research results can be used to identify high risk areas and are beneficial to local landslide prediction and management, but they fail to quantitatively calculate the degree of influence of specific geographical environment factors, and can not obtain the comprehensive influence of both natural and human factors and their interactions effecting on the spatial distribution of landslides.
In the present study, taking the Southern Liaodong Peninsula area as the study area, sixteen driving factors were selected to investigate the spatial variation patterns of landslides and reveal the landslide driving mechanisms based on the InforVal model and the GeoDetector method. Firstly, kernel density estimation and Getis-Ord Gi* were utilized to analyze the spatial distribution characteristics of landslide hazards and identify high-risk zones in the study area. Then the InforVal model was employed to analyze the linkage between landslides and driving factors and determine the best combination of factors for landslide occurrence. Finally, the GeoDetector model was used to identify the main driving factors of landslide distribution in the study area and the interaction patterns between various influencing factors. This study can provide more scientific support for local administration to establish effective disaster prevention and mitigation strategies to safeguard regional geologic and ecological safety.
2 Study area and data
This section first introduces the study area and the data used for landslide spatial distribution characteristics analysis, mainly including data sources and landslide driving factors. Then, it presents the main analysis methods, namely hot spot analysis, kernel density and InforVal method, and GeoDetector method, etc.
2.1 Study area
The southern Liaodong Peninsula is located between 120°58'E to 123°31'E, and 38°43'N to 40°10'N, covering a total area of 12,573.85 km2 and an elevation ranging from 0 to 1,110m above sea level, as shown in Figure 1. The remaining veins of the Qianshan Mountain run through the southern Liaodong Peninsula from northeast to southwest and enter the sea. The terrain gradually decreases in the southeast and northwest directions along Qianshan Mountain. Mountains are mainly concentrated in the northern regions and hills in the southern. The geomorphology types are various and topographic relief is significant. The southern Liaodong Peninsula has a warm temperate semi-humid monsoon climate with maritime features. Approximately 70% of the precipitation is concentrated from June to September (Wang et al., 2022). Typhoons in summer and autumn will also bring concentrated heavy rainfall (http://www.weather.gov.cn). The complex river networks are formed by the Yellow Sea and Bohai Sea water systems. Considering the stratigraphic and lithologic conditions, the Taikonian-Anshan Group and Lower Paleozoic-Liaohe Group, Mesozoic and Pleistocene strata are exposed in the study area (Liu, 2019). Meanwhile, there are obvious differences in lithology distribution, such as granite, diorite, and quartzite are mainly distributed in the northern mountainous areas, while the southern hilly areas are dominated by sandstone, conglomerate, and limestone. The geological structures are characterized by obvious neotectonic movements, which are mainly controlled by the Jinzhou Fault, the northern section of the Tanlu Fault, and the syncline from Heishijiao to Longwangmiao (Liu, 2019). Large earthquakes are rare, while small earthquakes are frequent within this area (Li, 2021). In 1861, a Ms6.1 magnitude earthquake occurred in the Jinzhou area. Recently, on August 23, 2023, another Ms4.6 shallow earthquake occurred in the Pulandian area. Strong tectonic activity, complicated topography, and concentrated rainfall provide a sufficient environment for landslide disaster breeding in the study area.
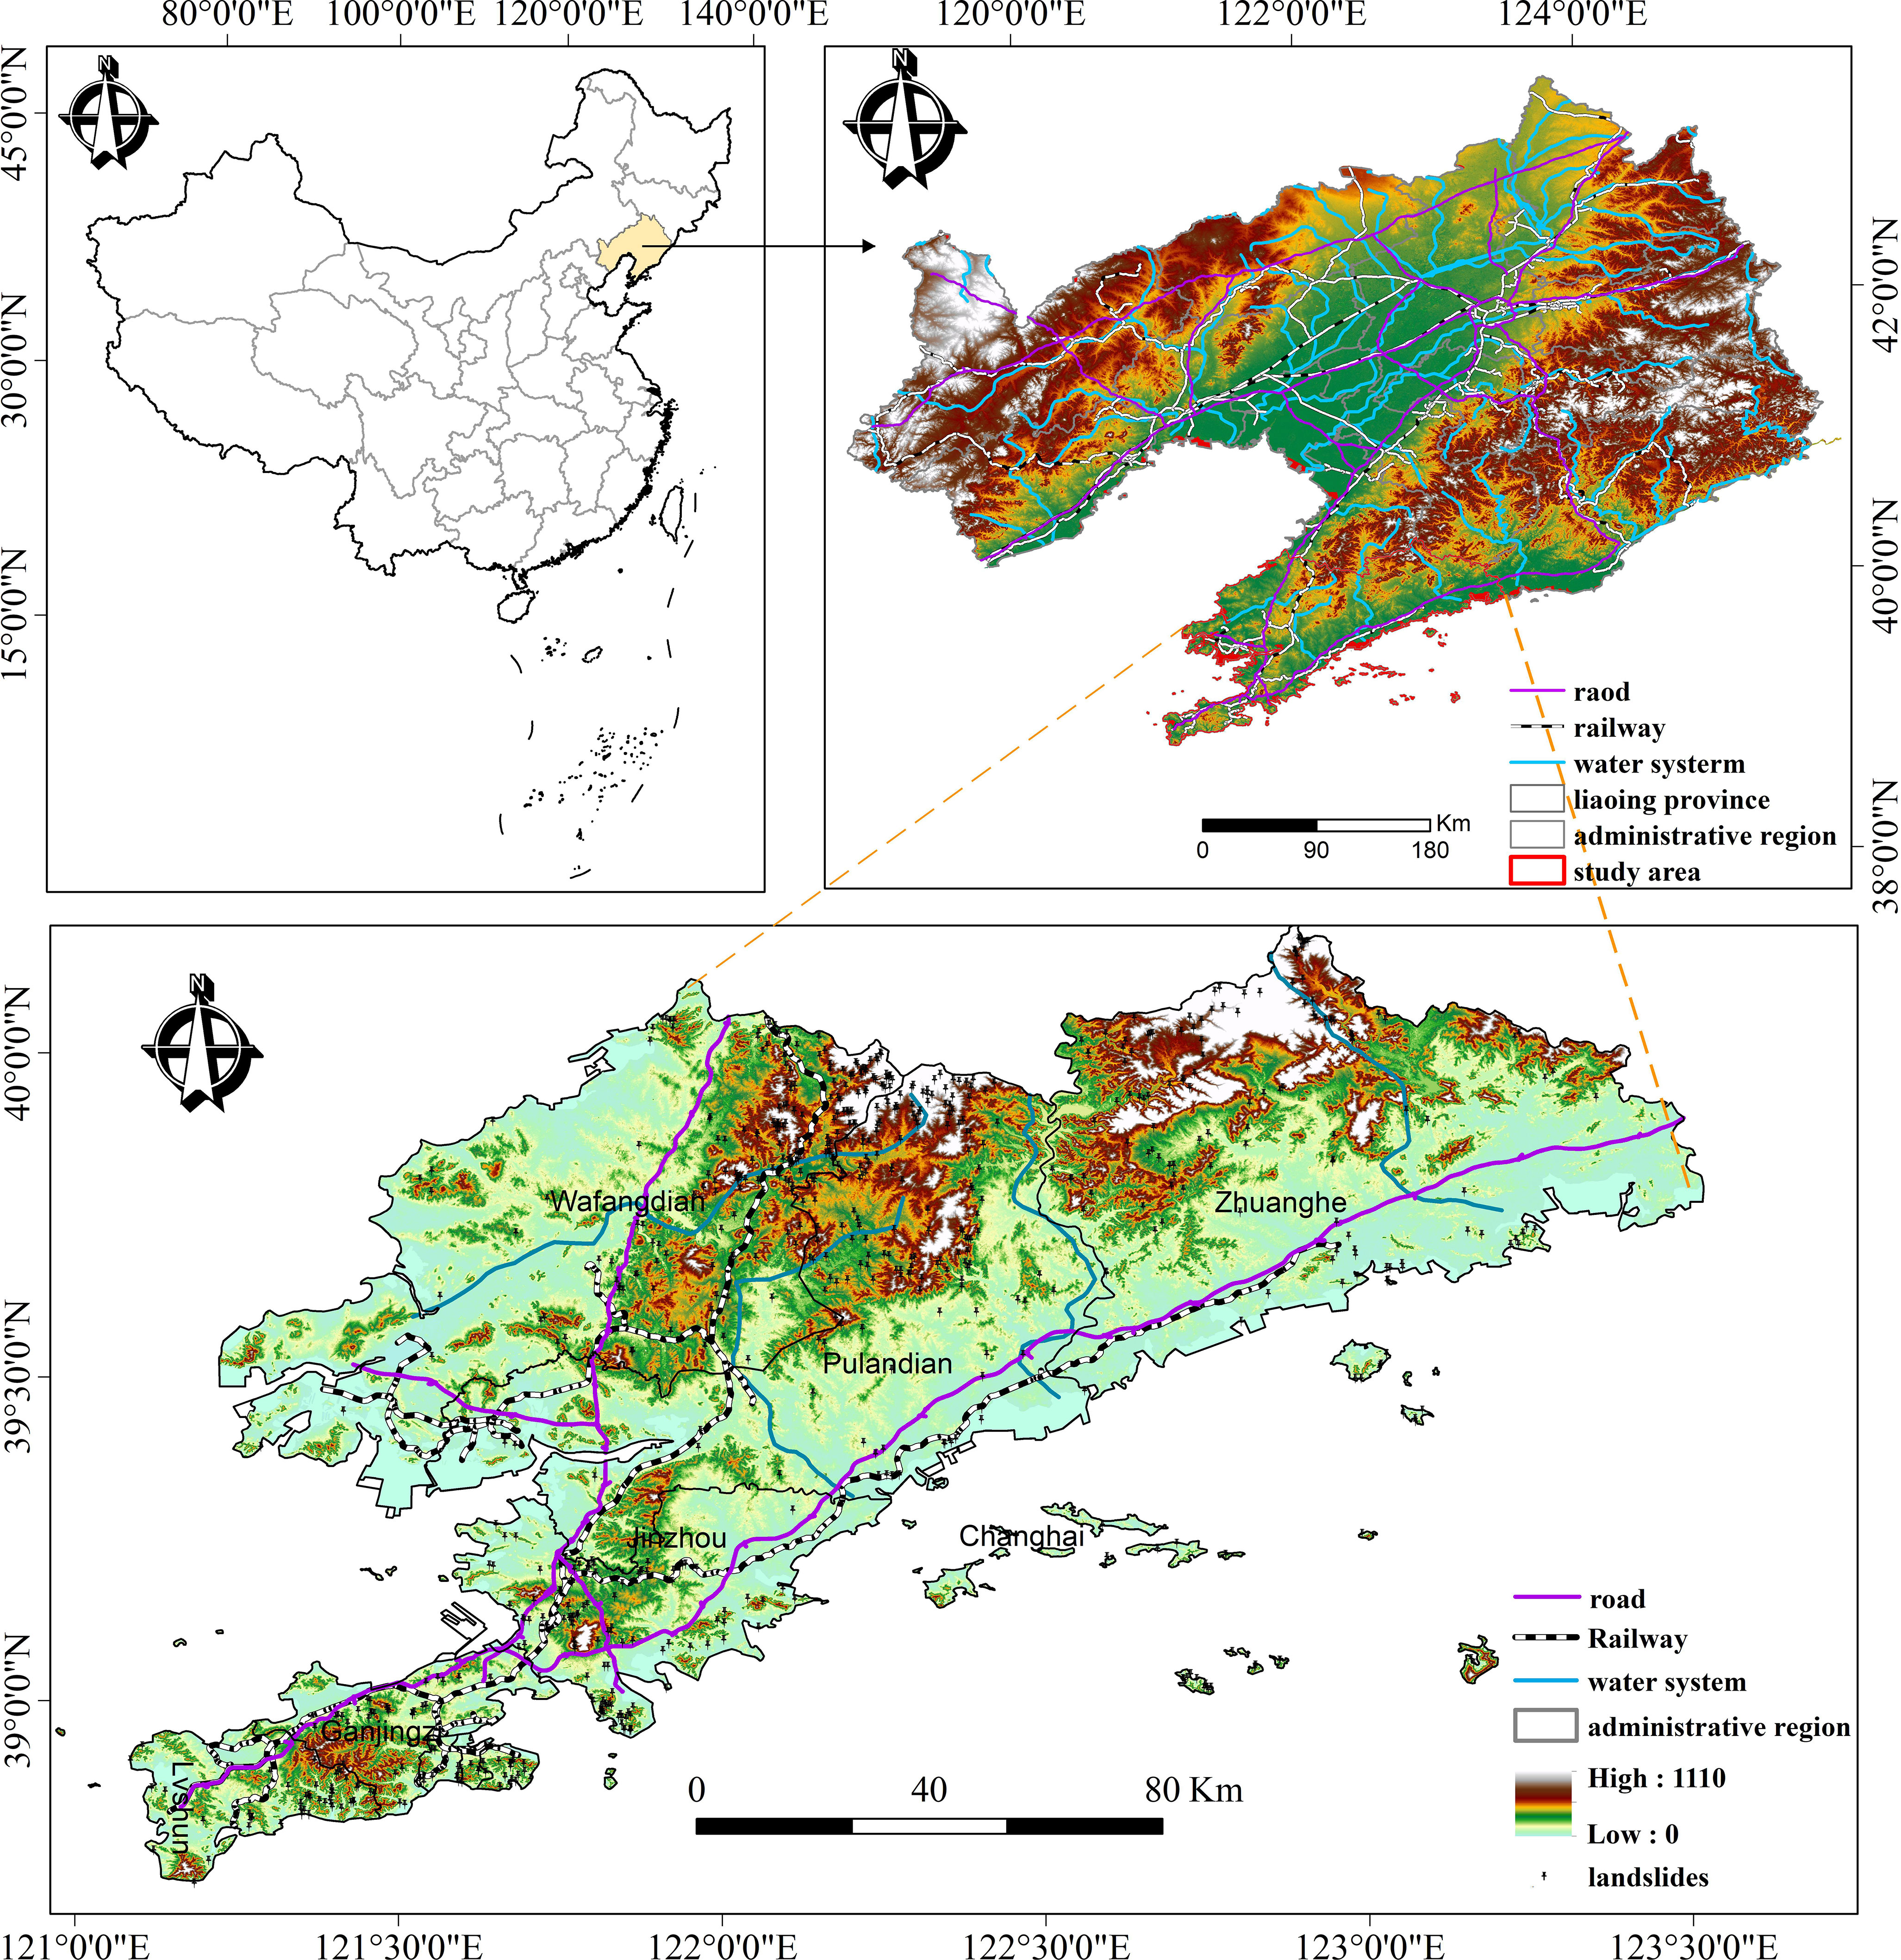
Figure 1 Map showing the landslides distribution in the study area.
2.2 Data used
According to the international landslide classification proposed by Varnes (1978), there are 726 historical landslides in the study area. These landslide points are interpreted from high-resolution remote sensing imagery, field investigations, and historical record data, and the sources for each landslide driving factor are shown in Table 1.
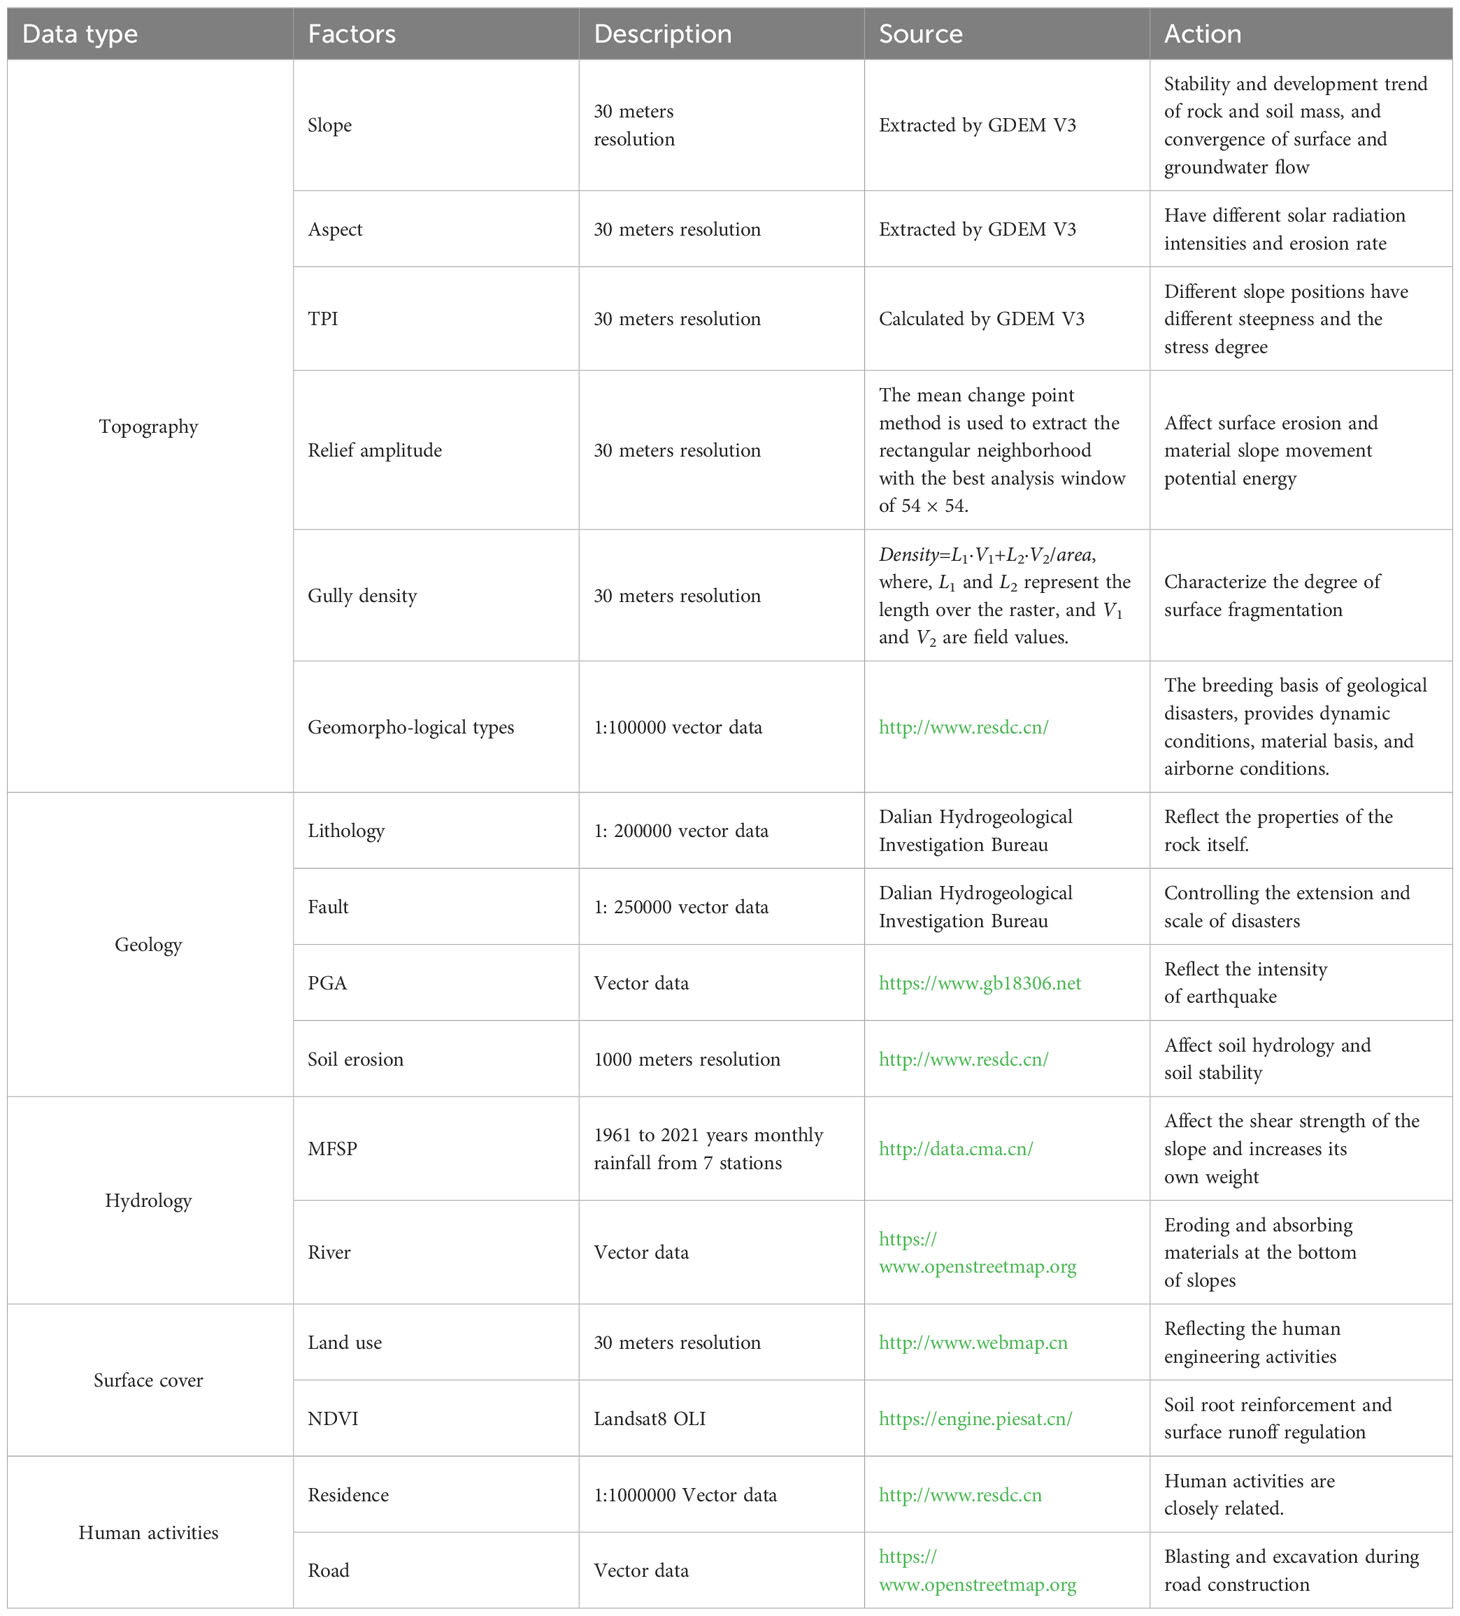
Table 1 Classification and description of landslide driving factors.
2.3 Landslide driving factors
Landslide occurrence is primarily caused by the inherent geological conditions of the slope (such as slope, geomorphology, and vegetation) and the interaction of external triggering factors (such as earthquake, precipitation, and human activities) (Chen et al., 2018; Wu et al., 2023a). Numerous researchers have conducted investigations considering various environmental factors. Following Ayalew and Yamagishi (2005), it is crucial to select landslide driving factors being measurable, complete, operational, and non-redundant. Several review articles have provided comprehensive analyses of their factors selection (Budimir et al., 2015; Reichenbach et al., 2018). In this paper, after combining the spatial patterns and intrinsic characteristics of landslides in the southern Liaodong Peninsula and referring to the relevant literature, 16 factors, including geomorphological types, aspect, slope, relief amplitude, gully density, lithology, TPI (topographic position index), soil erosion, distance to roads, distance to rivers, distance to faults, NDVI (normalized differential vegetation index), distance to the residence, PGA (peak ground acceleration), MFSP (mean flood season precipitation), and land use, were selected to construct a landslide driving factor system (Pourghasemi et al., 2018; Yu and Gao, 2020; Zhang J. et al., 2023). These influencing factors are commonly used in landslides to ensure that the model can be generalized to different regions (Dou et al., 2019; Chang et al., 2023). Among these factors, morphometric parameters such as aspect, slope, TPI and Relief amplitude were derived from 30 meters ASTER GDEM V3 (http://reverb.echo.nasa.gov) in ArcGIS10.8. Table 1 and Figure 2 describe the relationship between each factor and landslide. Among these factors, some of them had categorical values (TPI, soil erosion, land cover, etc.), whereas the others had continuous values (slope, NDVI, distance to roads, etc.). For these continuous factors, this paper reclassifies them according to the unsupervised discretization methods and the geographic environment of the study area. The details are shown in Table 2.
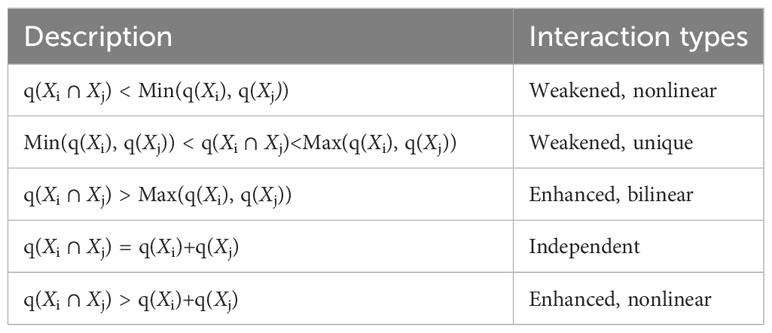
Table 2 Types of the interaction results.
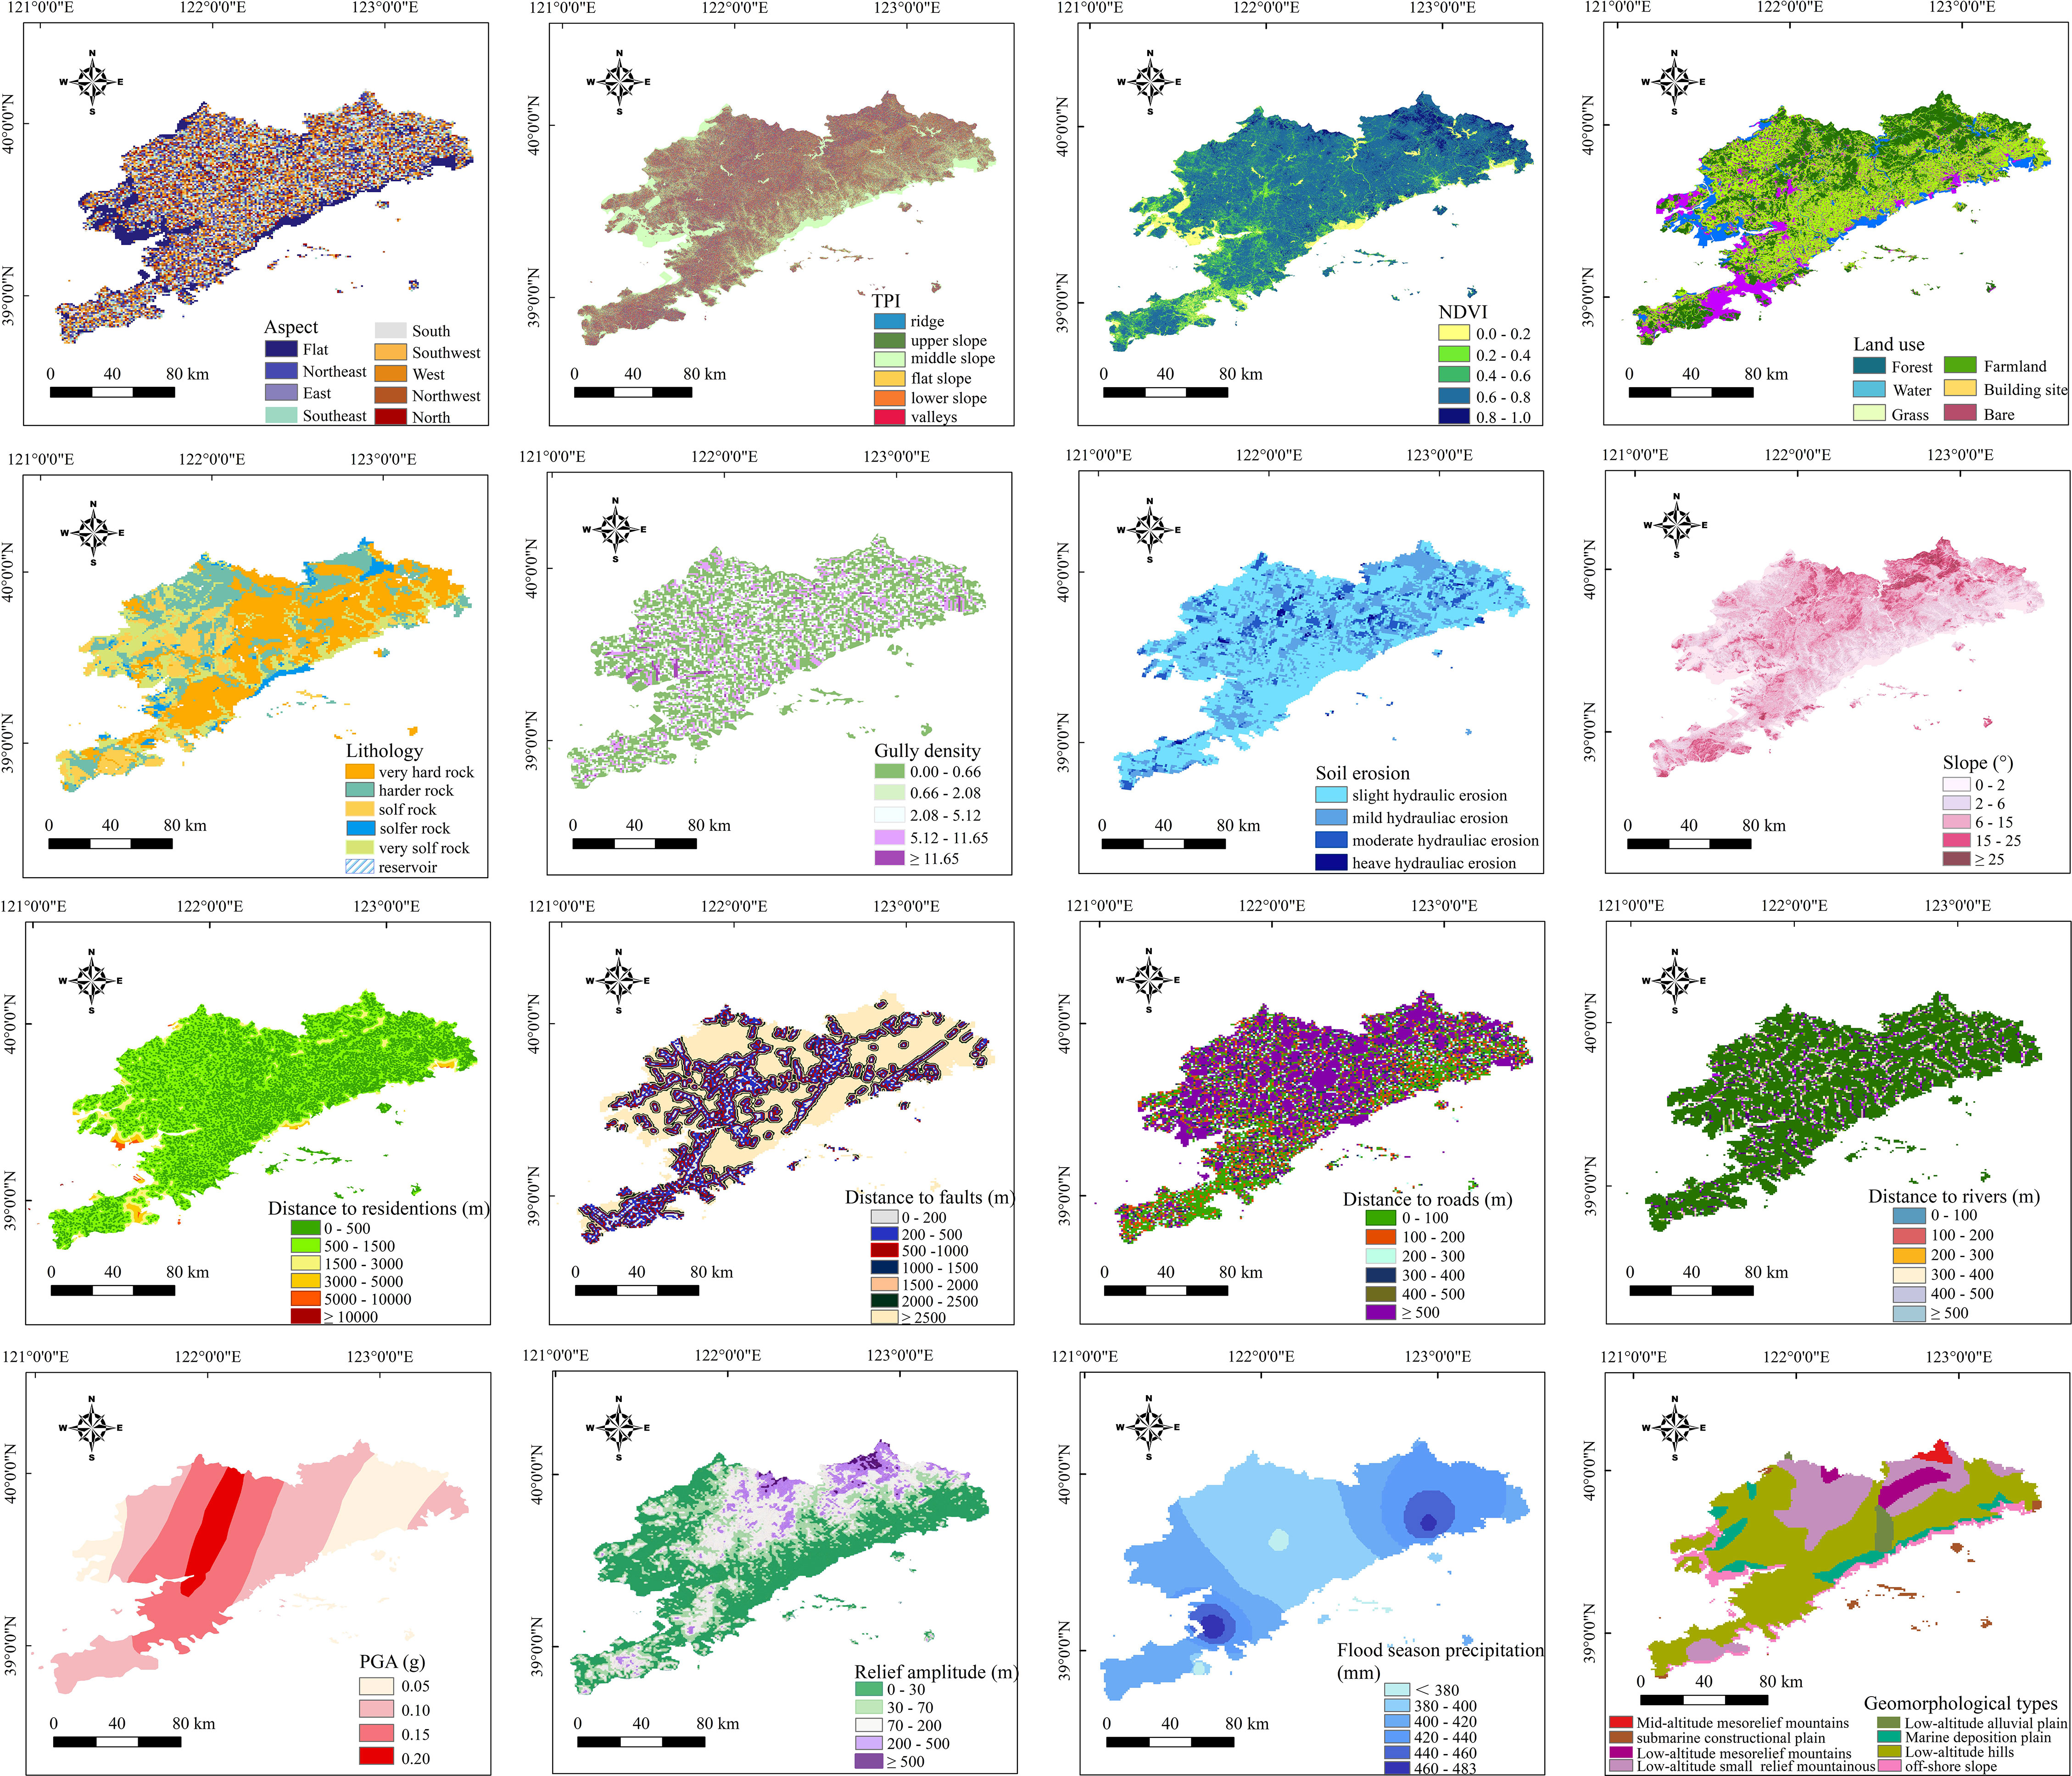
Figure 2 Landslides driving factors.
3 Methodology
3.1 Spatial distribution characteristics
The spatial distribution of landslides can be regarded as point events in two-dimensional space. Therefore, the point pattern analysis method in ecology can be used to study the spatial distribution of landslide disasters and quantitatively characterize its distribution pattern (Qiu et al., 2019). This work used the average nearest neighbor (ANN) method to explore whether landslide points have spatial aggregation characteristics. Additionally, we used Getis-Ord Gi* (hotspot analysis) and kernel density estimation methods to quantitatively analyze the degree of aggregation of landslide points in different areas. Furthermore, Ripley’s K function is employed to conduct dynamic quantitative research on landslide spatial distribution characteristics.
3.1.1 Average nearest neighbor
The average nearest neighbor index (IANN) is used to analyze the mutual proximity of the spatial distribution of point elements of ground objects. It can be obtained by calculating the ratio between the average observation distance of each nearest point pair and the nearest neighbor distance assuming a random distribution pattern (Shafabakhsh et al., 2017). Z-scores were used to test the statistical significance of the ANN analysis. p-value was used to test the reliability of the results of the study. The calculation formula of IANN is as follows Equation 1:
where: is the average distance between a landslide point and its nearest neighbor; n is the number of landslide points; A is the area of the study area. When < 1, the feature spatial distribution tends to be clustered, and the smaller the value, the higher the aggregation. > 1, the pattern shown tends to be discrete or competitive.
3.1.2 Getis-Ord Gi*
If landslides appear to be clustered in space, it means that within a certain area, there is local spatial autocorrelation between the landslides and the environmental elements of the area (Shen et al., 2021). To further explore the local spatial clustering feature, this paper uses the Getis-Ord Gi* method to generate a statistically significant Z-score to detect the high-value aggregation areas (hot spots) and low-value aggregation areas (cold spots) of landslides. The calculation following Equation 2 (Tsangaratos et al., 2017):
where: is the mean value; ωij is the spatial weight matrix. In this study, the study area is divided into regular 1km × 1km cell grids with a total number of 12,923, and the number of landslide points within different grids is calculated as the targets for spatial hotspot detection.
3.1.3 Kernel density analysis
According to Tobler’s First Law of Geography (Tobler, 1970), “Everything is related to everything else, but near things are more related than distant things”. It can be assumed that the probability of a landslide occurrence at a specific spatial location is caused by the natural environment or geological environment where it is located. Therefore, this probability estimate can directly indicate the susceptibility to landslides. This change in probability density can be used to analyze the spatial differentiation characteristics of landslides (Wang et al., 2020). The KDA method has favorable visualization, which enables a smooth representation of the clustering and dispersion of landslides in continuous space. This method only focuses on the landslide itself to analyze the distribution patterns of events and does not require any a priori hypothesis (Li et al., 2020). The kernel density analysis function f(x) is expressed in Equation 3:
where: n is the number of landslide points; r is the search radius value expressed in Equation 4:
where: Dm is the median distance from the weighted average center; DSD is the standard distance, and n is the number of landslide points. The higher the kernel density value, the stronger the degree of clustering of space events and the converse is true.
3.1.4 Ripley’s K function
The spatial distribution pattern of landslide events has a strong dependence on scale, and various distribution patterns may appear at different analysis scales (Wang et al., 2020). Ripley’s K function method reflects the degree of dependence of the landslide spatial distribution on a scale with the K(t) function. Compared with traditional methods, Ripley’s K function method not only overcomes the shortcoming that traditional methods can only analyze spatial distribution patterns at a single scale but also can maximize the use of spatial point information to describe the spatial pattern information at different scales. Ripley’s K function is subjected to variance correction and linearization to obtain the L(d) function. The estimation value of the L(d) function can provide a more intuitive way to determine the spatial distribution type of landslide events. If L(d) > 0, it means that the landslides exhibit a clustering distribution on the d scale, and a higher L(d) value shows a stronger aggregation intensity. When L(d) = 0, it indicates a random distribution, and when L(d)< 0, it represents a uniform distribution of landslides. The main calculation formulas are expressed in Equations 5, 6 (Wang et al., 2020):
where: n is the number of landslide points in the study; A is the area of the study area; d is the different spatial scales; and δij(d) is the distance between points i and j within scale d.
3.2 Information value model
The theoretical basis of the information value model is information theory, which uses the decrease of entropy in the process of landslides to characterize the possibility of landslide disaster events. The landslide phenomenon (Y) is affected by many factors (Xi). The InforVal model converts the measured values of multiple driving factors into information quantity values. The information value can evaluate the close relationship between specific driving factors and landslides (Lin et al., 2021). The advantage of this method is to be able to comprehensively study the “optimal combination of factors” that contribute most to landslides, rather than a single factor (Tan et al., 2015). The higher the information value, the bigger the possibility of landslides occurrence. According to the principle that statistical probability represents a priori probability, according to Equation 7 (Tang et al., 2021), the information value provided by factors x1, x2, …, xn on landslide disasters in the area is:
where I is the value of informativeness; N is the number of landslides in the study area; Nn is the number of landslides within the cells graded by the impact factor xi; S is the total area of the cells in the study area, and Sn is the area of the cells under the grading of the impact factor xi.
3.3 Geographical detector method
The geographical detector is a statistical model which combines GIS spatial overlay technology and set theory proposed by Wang et al. (2010), including factor, ecological, interaction, and risk detection modules). It has been widely used to identify the spatial stratified heterogeneity of variables and the driving forces in recent years (Han et al., 2021; Deng et al., 2022). The GeoDetector does not need to consider the collinearity problem between landslide driving factors because it combines spatial variance to quantify the relative importance of a single factor and its implicit interaction with the response variable (Wang and Xu, 2017; Jiang et al., 2022), and they can also quantify the interaction of any two driving factors on landslides. In this study, we mainly use the factor detection module and the interactive detection module to conduct a comprehensive analysis of the spatial relationship between driving factors and landslides in the study area.
3.3.1 Factor detection
The core idea of the GeoDetector model is based on the assumption that if an independent variable has a significant effect on a dependent variable, then the spatial distribution of the independent and dependent variables should be similar. This similarity can be expressed by calculating the q-statistic as the influencing factors’ explanatory power on the landslide distribution according to Equation 8 (Wang and Xu, 2017).
Where, k=1,2,3…m, indicates the classification of the landslides or factors; nh and n denote the number of elements on class k and the whole study area; and σ2 are the variance of the class k and the total variance, respectively. Generally, the range of q is [0, 1]. A larger q value indicates a stronger power of the driving factor to explain the distribution of landslides. The q value of 1 represents that the spatial heterogeneity of the landslide in the study area can be fully explained.
3.3.2 Interaction detection
Interaction detection identifies the interaction patterns between different driving factors by assessing whether the combination between two drivers (Xi and Xj) will increase or decrease the contribution to the spatial distribution of landslides, or whether driving factors will work independently of each other (Zhang Y. et al., 2023). The overlaying of factor layers Xi and Xj can generate a new factor layer and multiple subregions, and then the q-value of the interaction can be obtained, denoting q(Xi ∩ Xj). Finally, by comparing q(Xi ∩ Xj) with q(Xi) and q(Xj), there are five types of interactions between the two factors (Wang and Hu, 2012), as illustrated in Table 2.
4 Results and analysis
4.1 Landslides spatial distribution characteristics
In this paper, the IANN was calculated using CrimeState 3.3. The results showed that the value of IANN, the Z-score, and the p-value are 0.397, -28.478 and 0.001, respectively. It indicated that the landslide points exhibited a strong spatial clustering trend in the study area. In addition, the Getis-Ord Gi* and kernel density analysis technology based on the ArcGis10.8 spatial statistics module was employed to explore the local spatial clustering of landslides in the study area. The purpose is to answer the two questions “where” and “how”, i.e., where is the landslide disasters clustering zone? and how much it clustered.
According to the Getis-Ord Gi* method, the Gi* Z-score of the landslides in the southern Liaodong Peninsula was calculated, and the Z-score was divided into five classes using the natural break method, and then the cold/hot spot map of landslide distribution in the southern Liaodong Peninsula was obtained (Figure 3). As shown in Figure 3, the landslides are generally show a feature of “small dispersion and large concentration” in the study area. Considering the 99% confidence interval, hot spots are mainly concentrated in the southern hills areas and northern mountainous areas in the study area, which indicates that there are multiple continuous units with a high number of disasters in the above areas. These hotspot areas are highly sensitive to landslide disasters. It is mainly attributed to the larger topographic relief and stronger tectonic activities in the region, resulting in structurally fragmented rocks with weak weathering resistance providing material conditions for landslides, meanwhile, the higher elevation and steep slope provide dynamic conditions for the landslides occurrence. In our study area, the Ganjingzi, Shahekou, Xigang, Zhongshan, and Jinzhou districts have significant hotspot areas that account for a larger proportion of the total area. This is due to the southern region is also an area with frequent human engineering activities, which destroys the balance of the original geological environment and induces landslides. On the other hand, the cold spots are distributed in the eastern and western parts of the study area, demonstrating a large-scale and continuous distribution trend. Specifically, the eastern areas of Zhuanghe, the western sector of Wafangdian, and the southern region of the Pulandian district have significant cold spots that cover a larger proportion of the total study area (Figure 3).
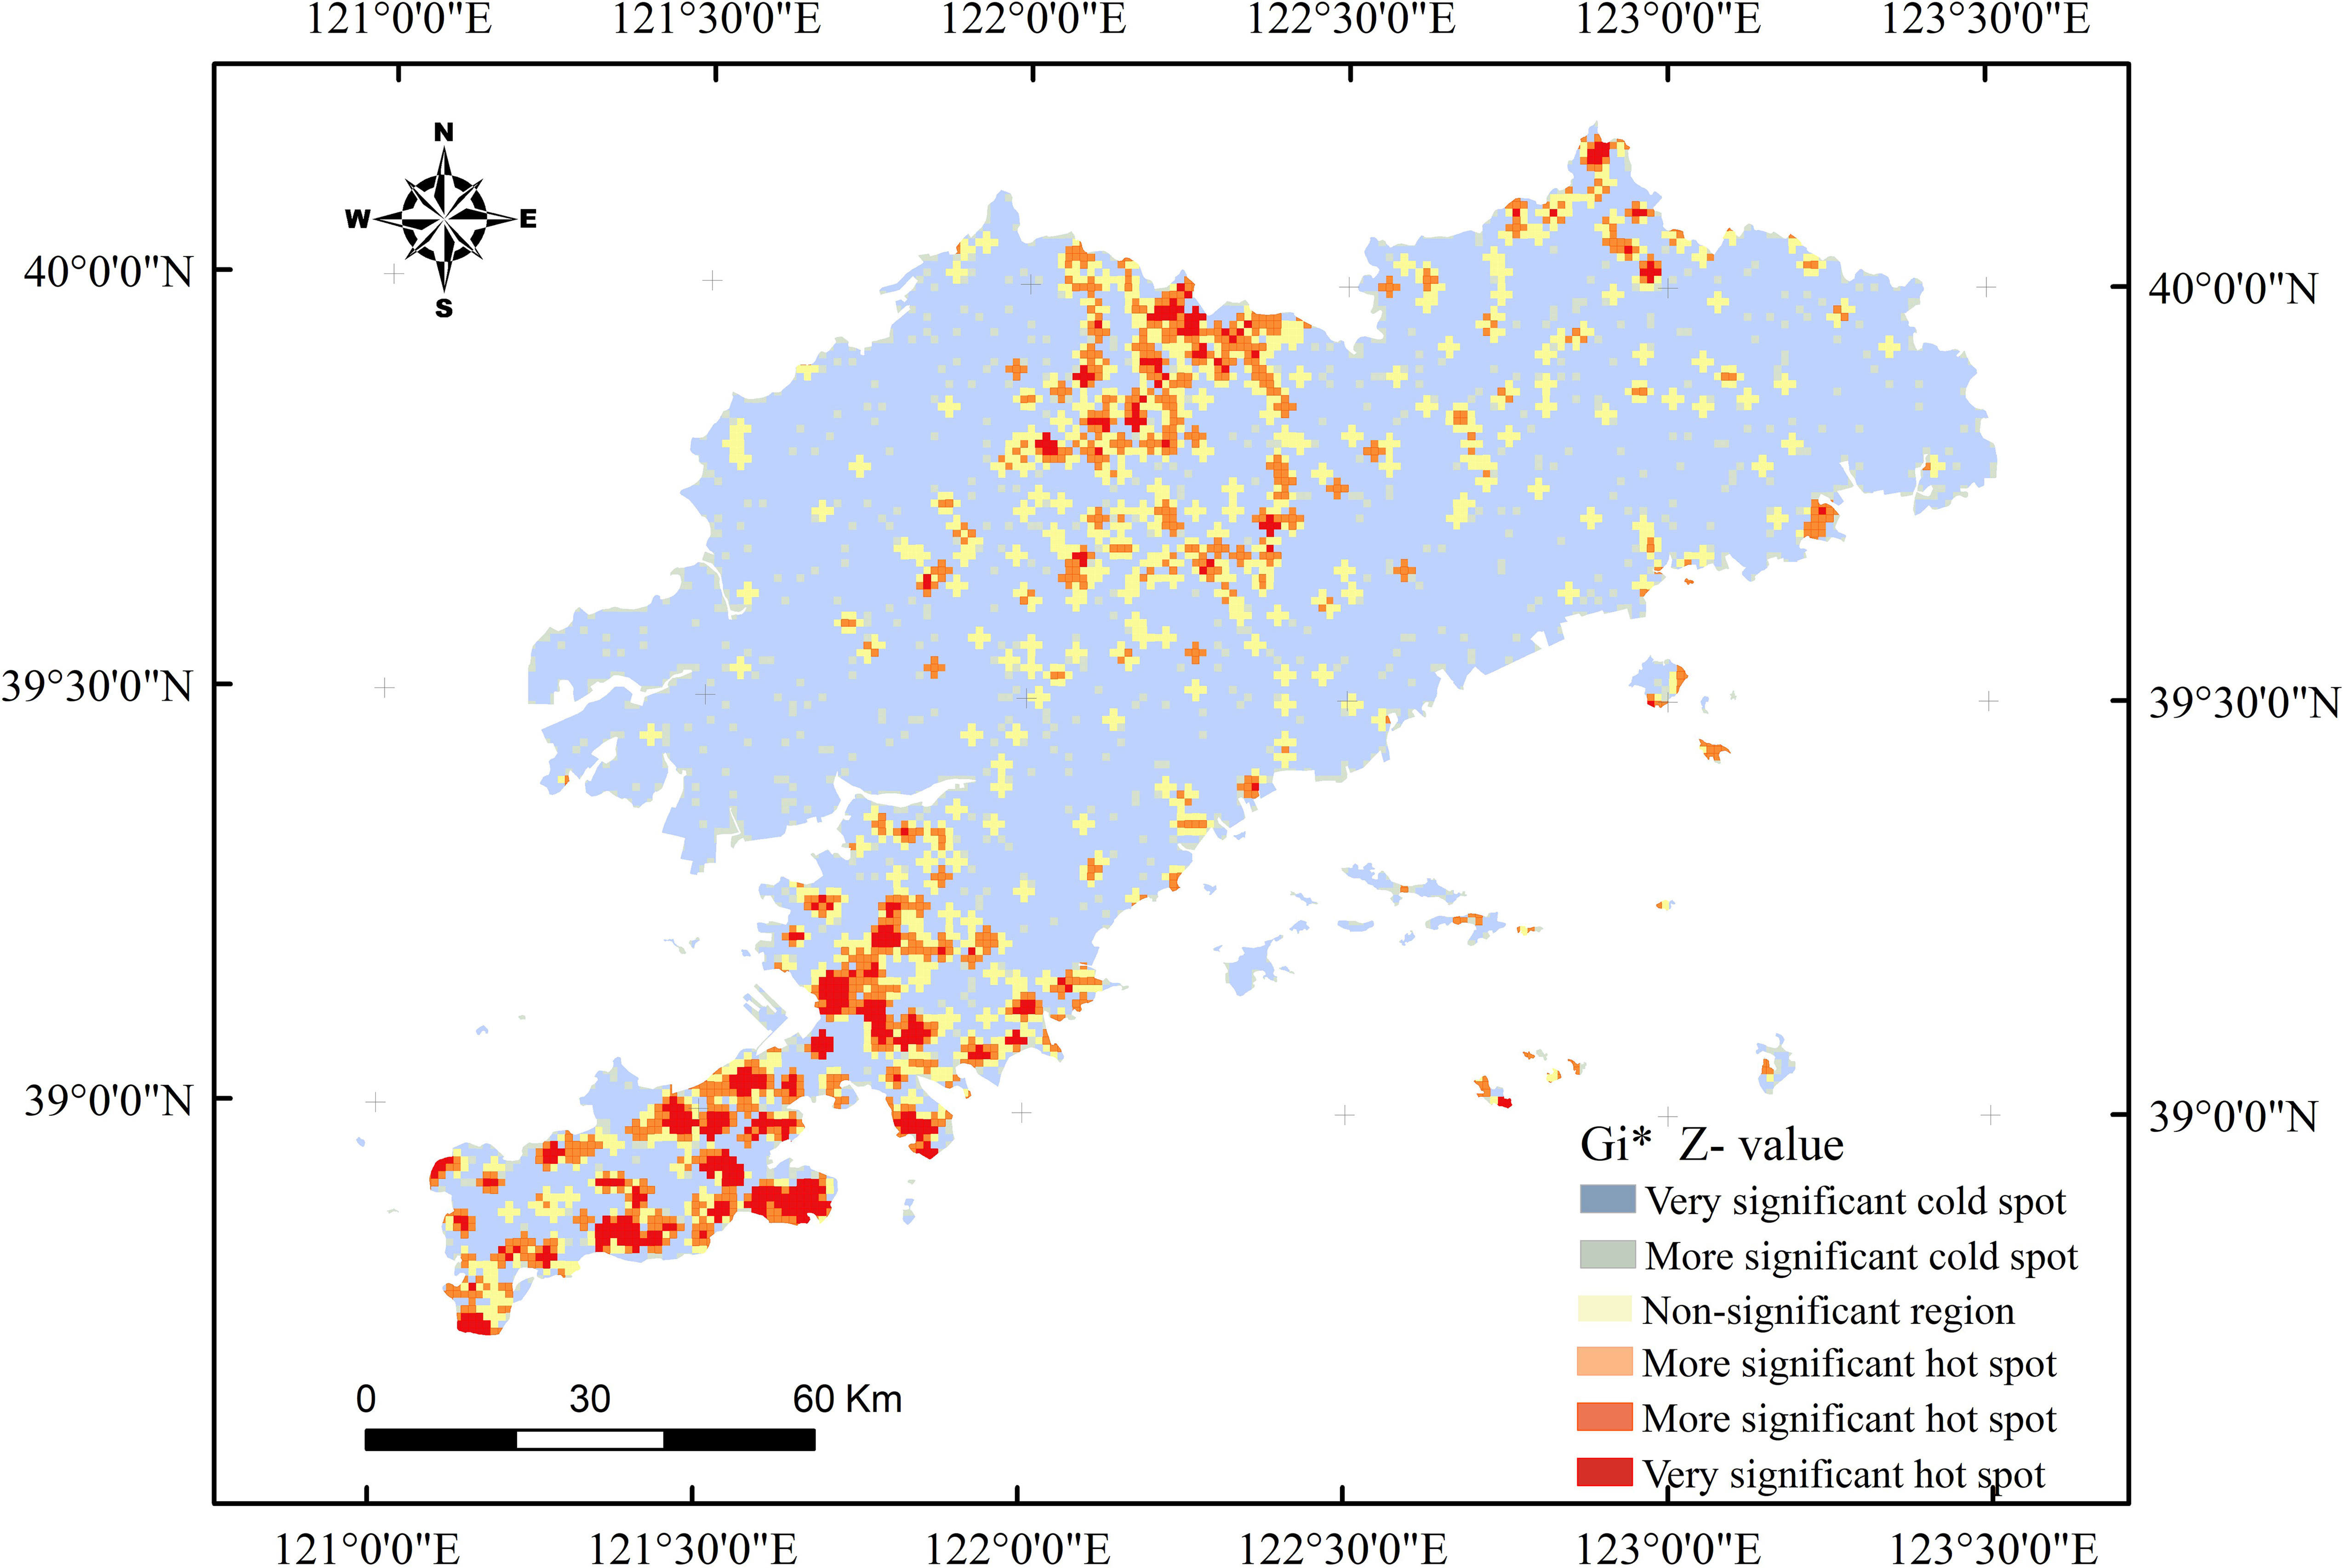
Figure 3 Hot spot map of historical landslide points distribution in the study area. ①Shahekou district; ② Xigang district; ③ Zhongshan district.
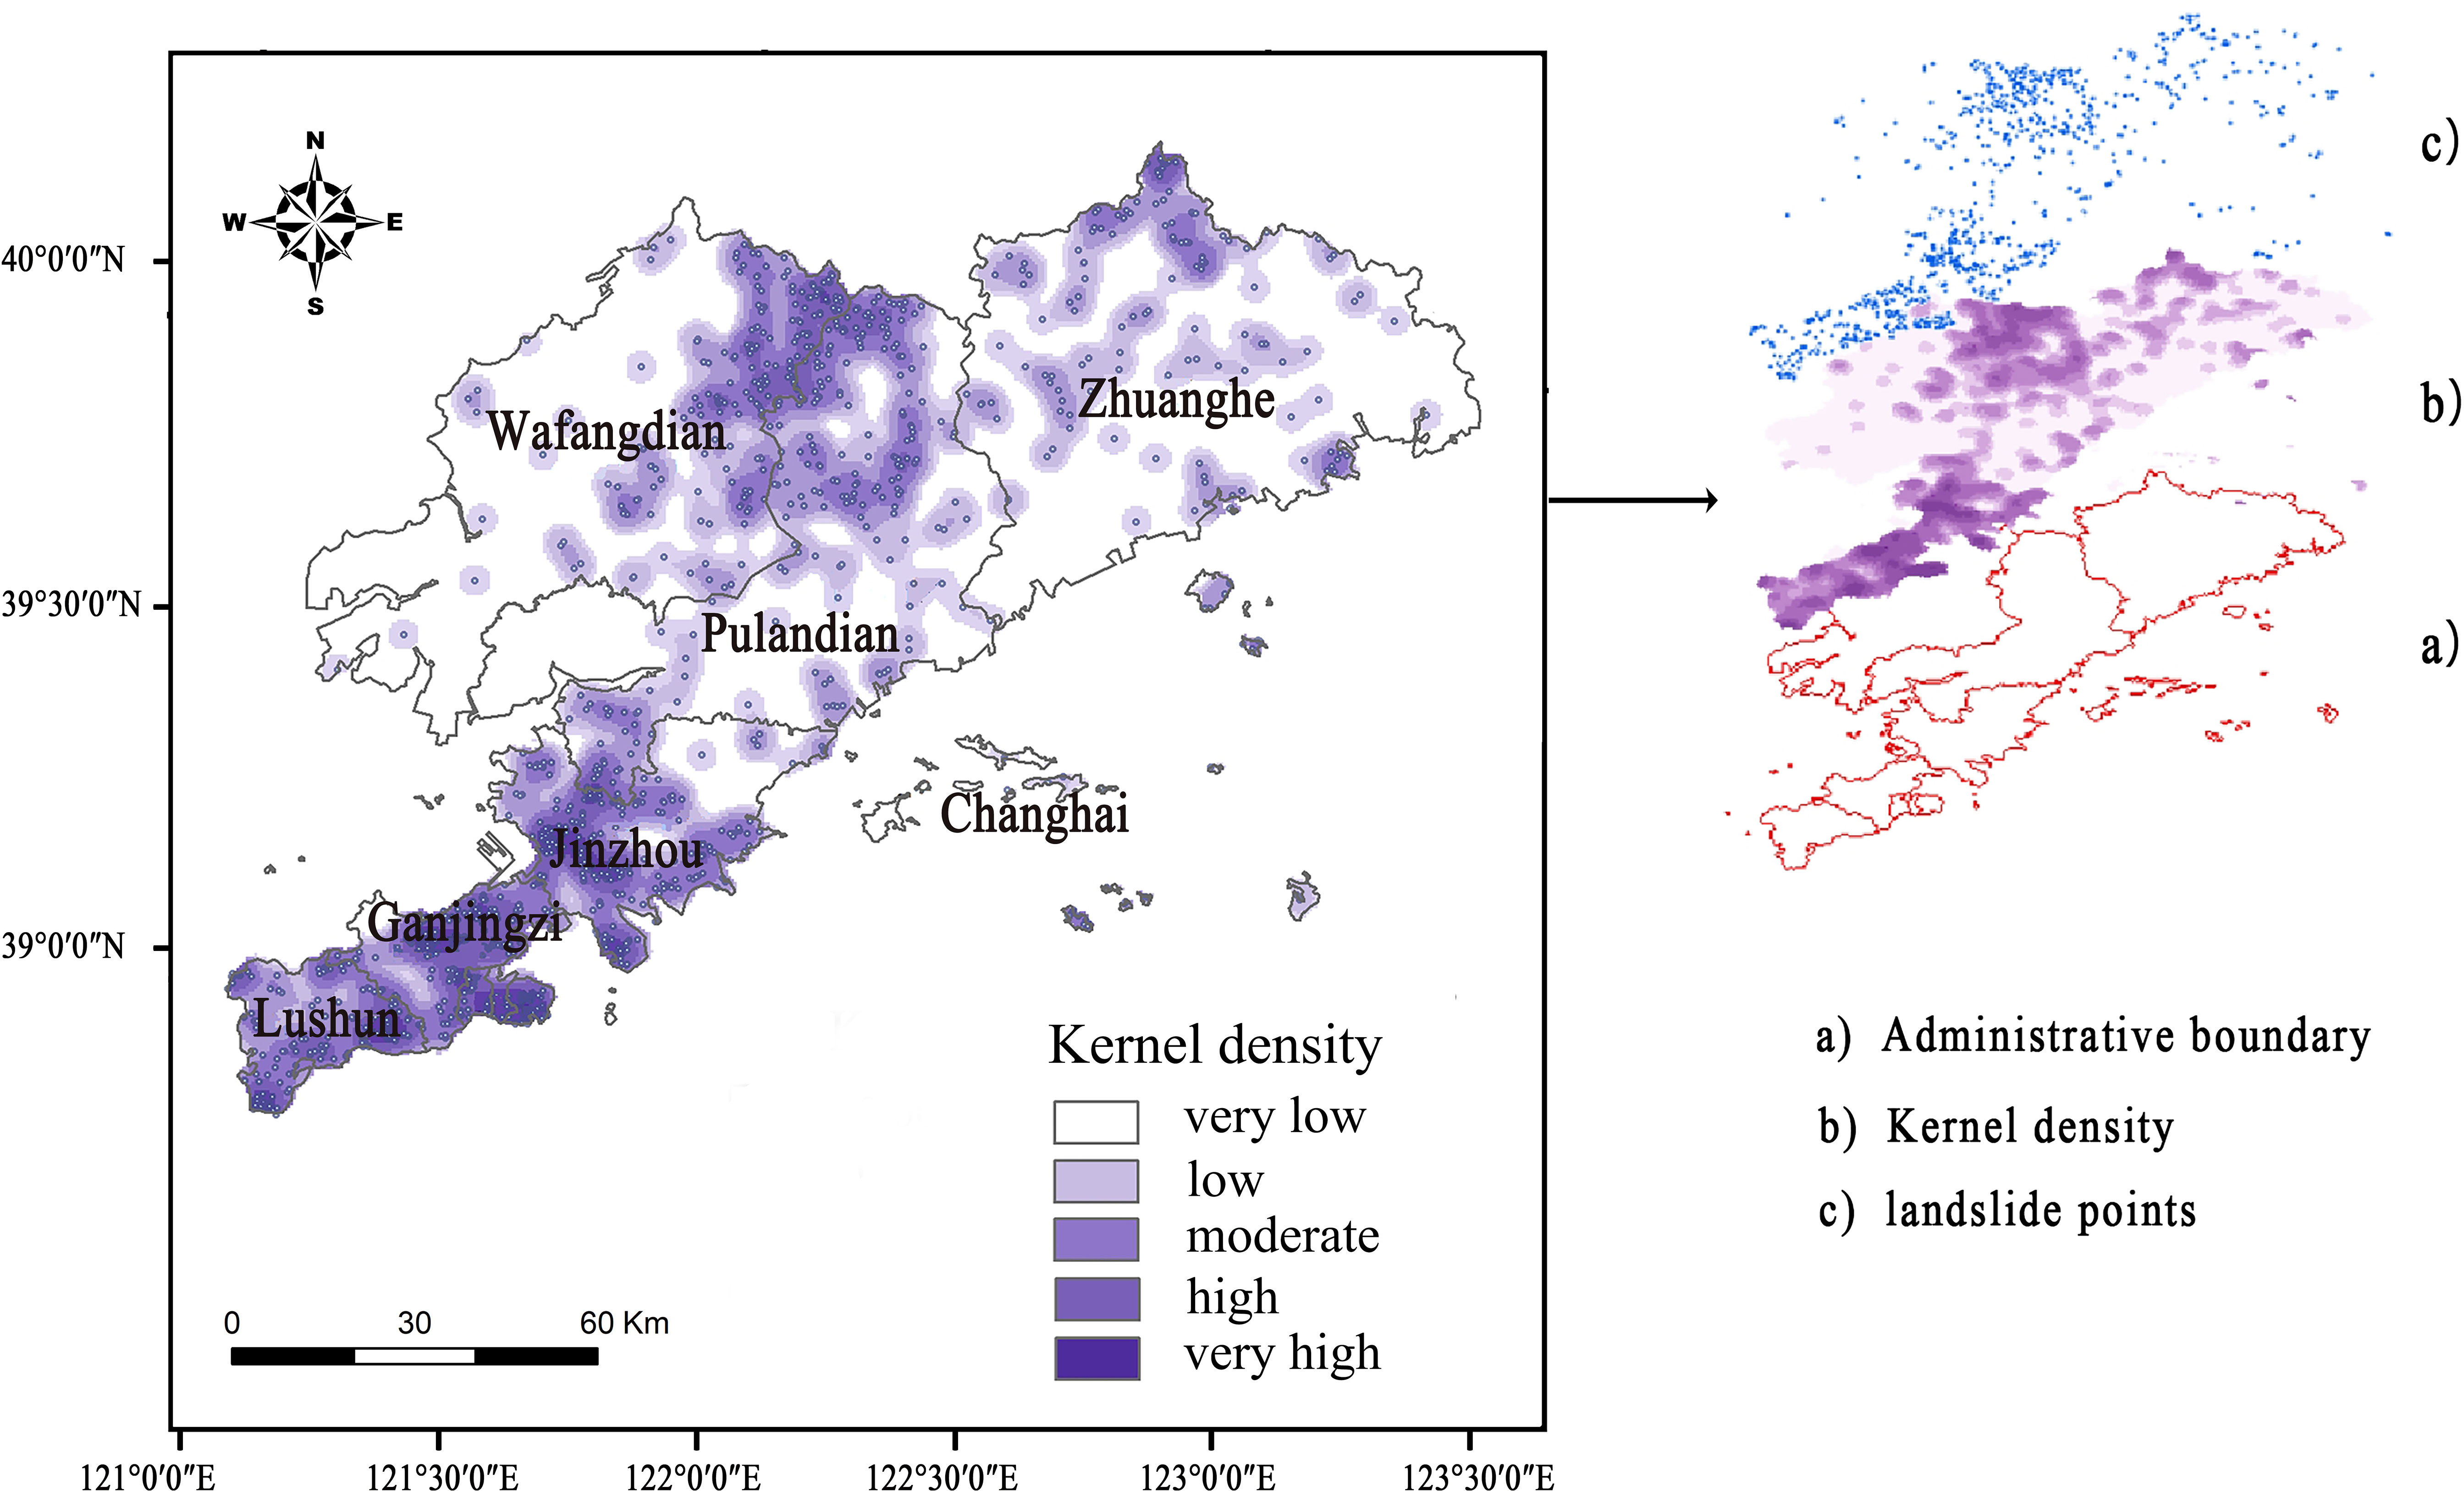
Figure 4 Kernel density estimation map of historical landslide points distribution in the study area.
To reveal the spatial aggregation of landslides at a smaller geographical scale in the southern Liaodong Peninsula, the kernel density analysis method was employed. The analysis pixel size was set at 500 m and the optimal search radius was determined to be 2 km after several verifications. The landslide spatial distribution characteristics are visualized and divided into five levels using the natural break method, namely very low, lower, moderate, higher, and very high areas. Subsequently, we obtained the landslides kernel density distribution map for the study area (Figure 4). From Figure 4, it is evident that the Dalian Binhai North Road area exhibits the highest kernel density value, surpassing 1.3, indicating a dense distribution of landslides in this region. Multiple agglomeration areas have been examined in Jinzhou District, and their distribution is irregular. These areas are primarily located in the hilly region on the west side of the Jinzhou Fault, the Xiaoyaowan Karst Area, and the Jinshitan Tourist Area in the east. In Zhuanghe City and Pulandian District, landslides are mainly found along Qianshan and other veins in the northeast-southwest direction. Additionally, a few clusters are present in the northern mountainous areas of Wafangdian City, even most of these areas have a low density of landslides.
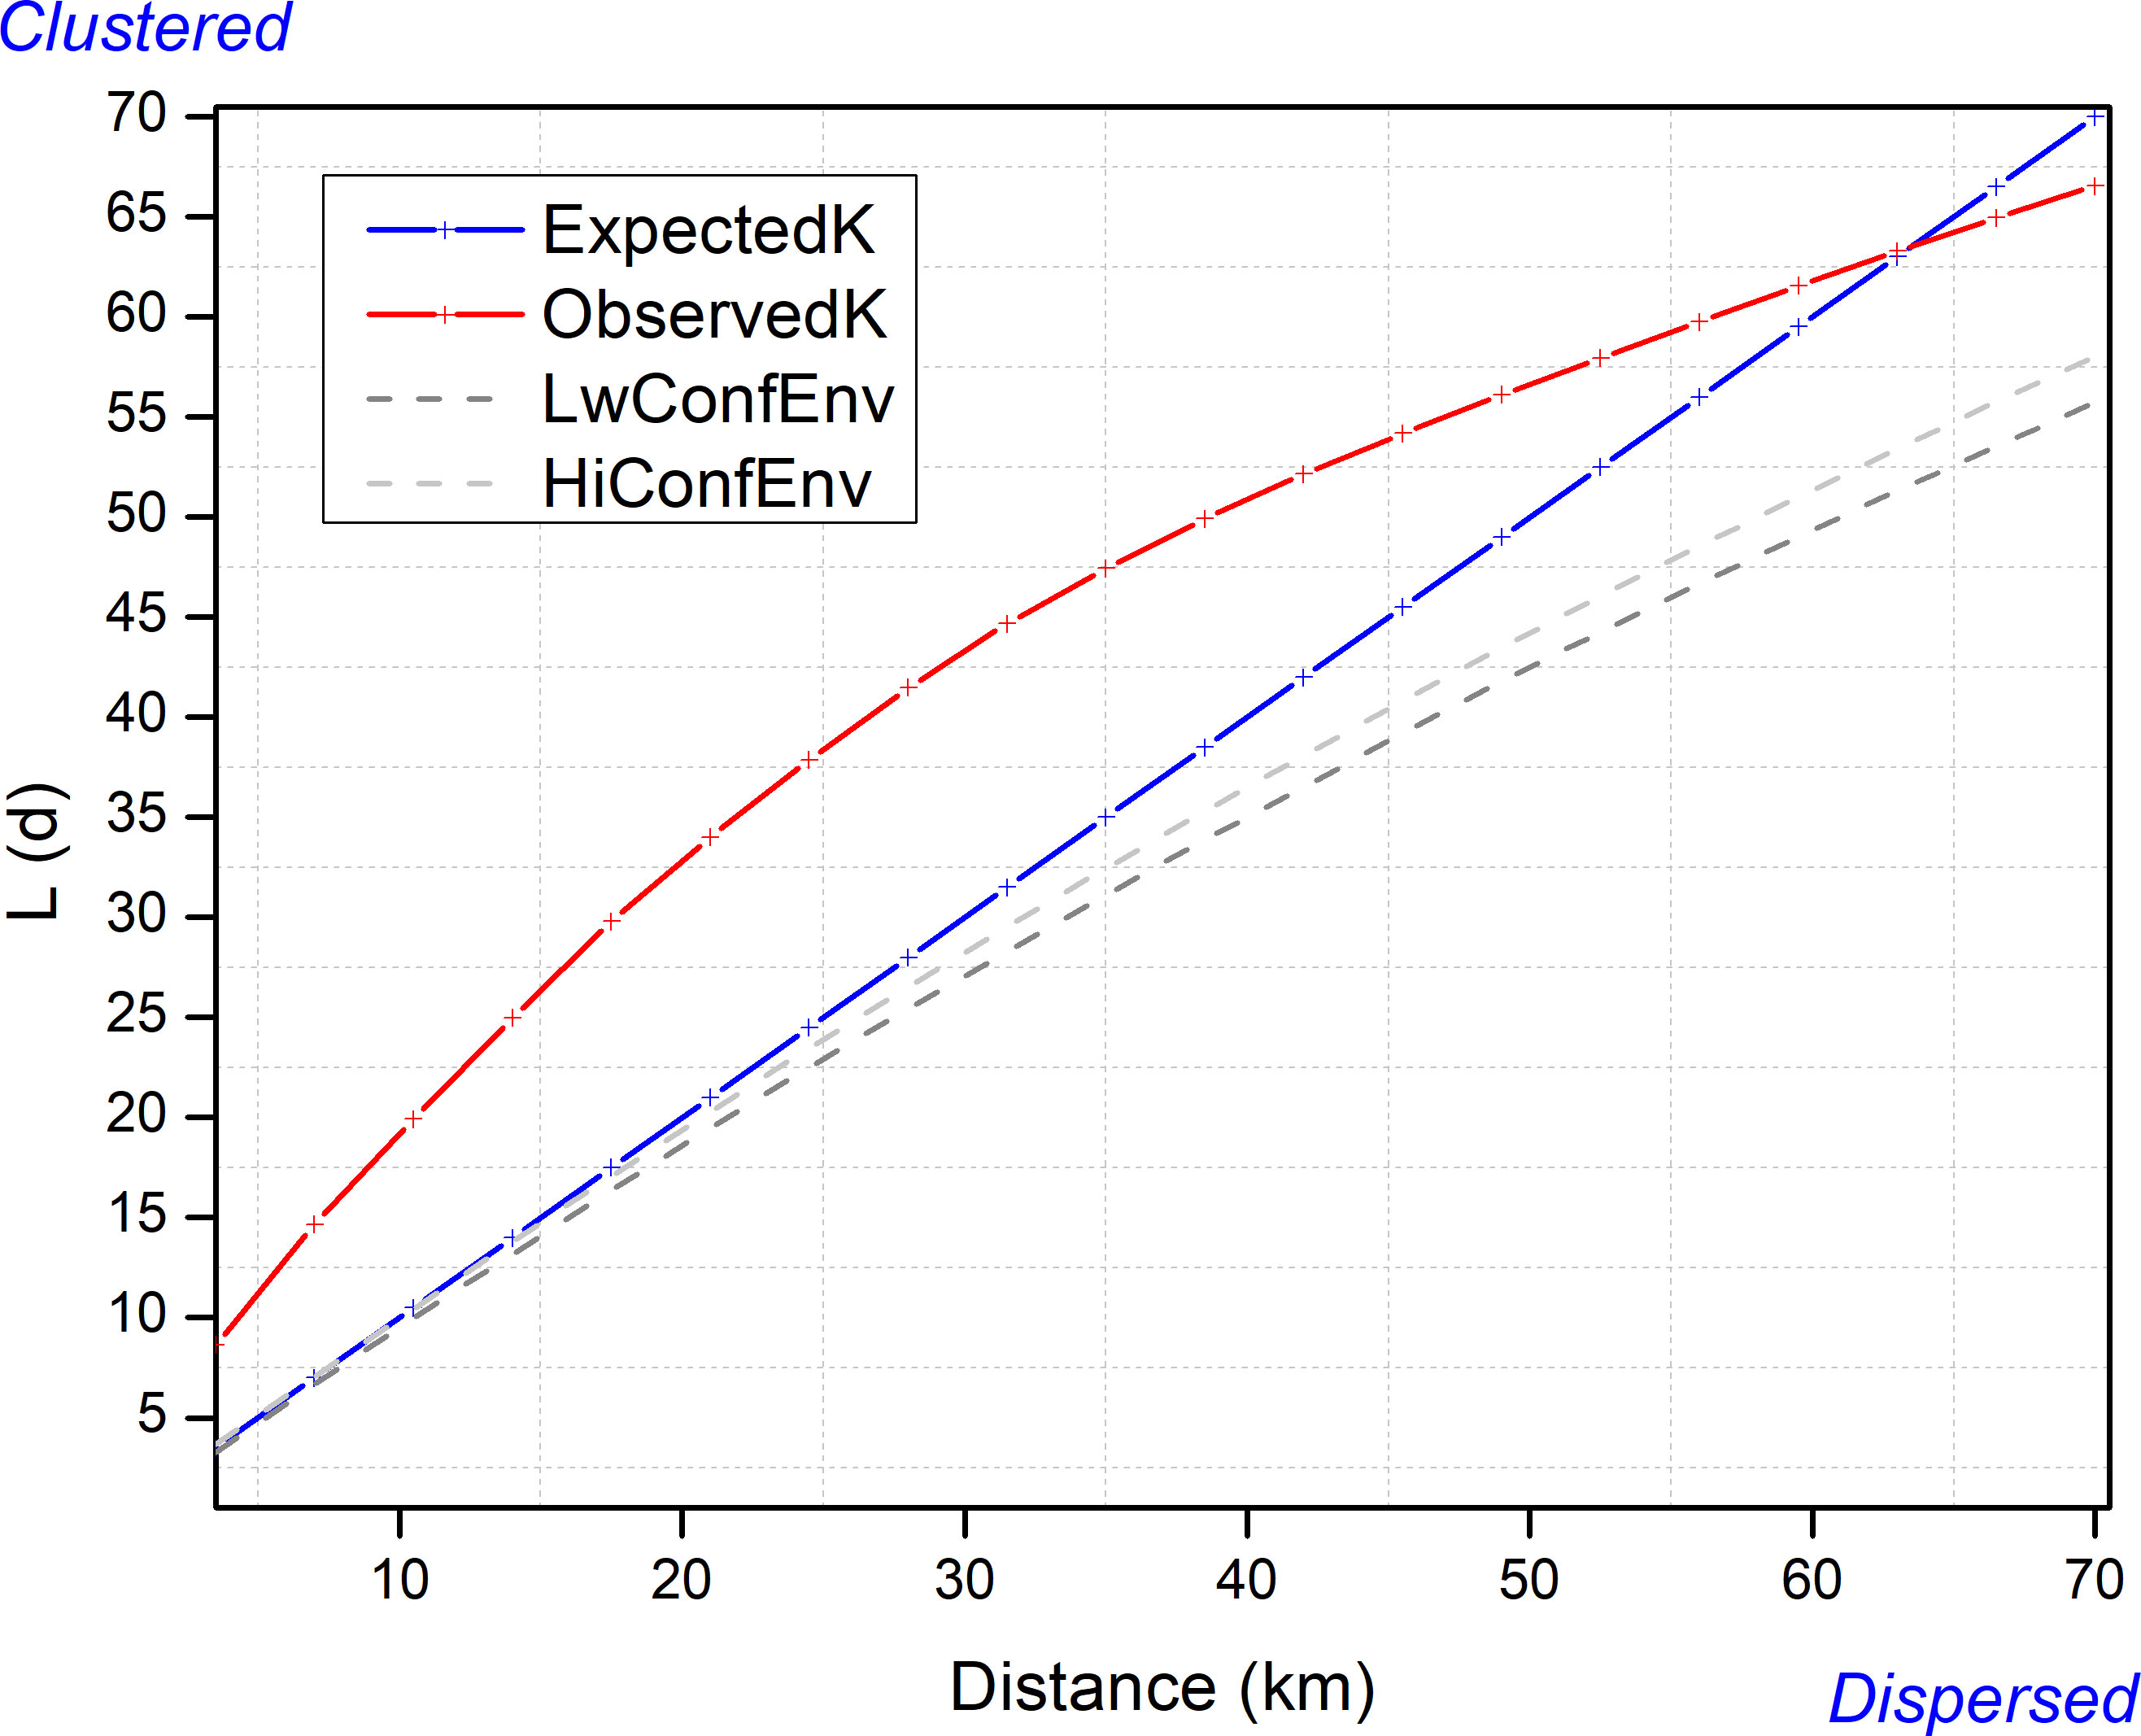
Figure 5 K-function spatial distribution of landslide points in the study area.
In summary, the results demonstrate that there is a strong spatial clustering and variability in the distribution of landslides in the study area, as indicated by both the Getis-Ord Gi* detection and kernel density estimation methods. Moreover, these findings suggest that the two methods can be effectively cross-validated by employing an appropriate search radius.
The Ripley’s K function is used to dynamically test the spatial scale dependence of landslide distribution in this study. The method involves conducting 199 Monte Carlo simulation tests with a 95% confidence interval and constructing an envelope line. If the observed values fall within the envelope line, it suggests that landslide events in the study area follow a random distribution. When the observed values exceed the upper envelope line, it indicates a significant spatial aggregation distribution. Conversely, if the observed values are lower than the lower envelope line, it suggests a significant uniform distribution of landslides. The difference between the observed value and the expected value curve represents the strength of the relevant aggregation or dispersion. Figure 5 shows that within the spatial range of 0 to 70km in the study area, the landslide points exhibit significant spatial aggregation distribution between 0 and 63km with 10km step increments. The degree of aggregation follows a pattern of initially increasing and then weakening, and the peak at 30.13km. This suggests that this spatial distance scale represents the maximum value of landslide agglomeration intensity. Upon exceeding 63km, the features are not obvious. In conclusion, the analysis using Ripley’s K function confirms the presence of spatial scale effects in the landslide point pattern in the study area, which aligns with the ANN analysis results.
4.2 Driving factors analysis
4.2.1 InforVal model analysis
The InforVal model was used to measure the contribution value of the 16 selected driving factors to the landslide distribution in the study area under the graded state. The generated information quantity index and its ranking are listed in Table 3. We can see that the best combination of key factors with greater contributions to landslide occurrence in the Southern Liaodong Peninsula area is the geomorphological type being Mid-altitude mesorelief mountains, slope being > 25°, aspect of the southeast, NDVI of 0.2 - 0.4, soft rock, building site, heavy hydraulic erosion, PGA of 0.2, lower slope, MFSP being > 460mm, relief amplitude of 200 - 500m, gully density of 0.56 - 1.84, and distance to residence being 1500 - 3000m, to rivers being 100 - 200m, to faults being < 200m, to roads being < 100m.
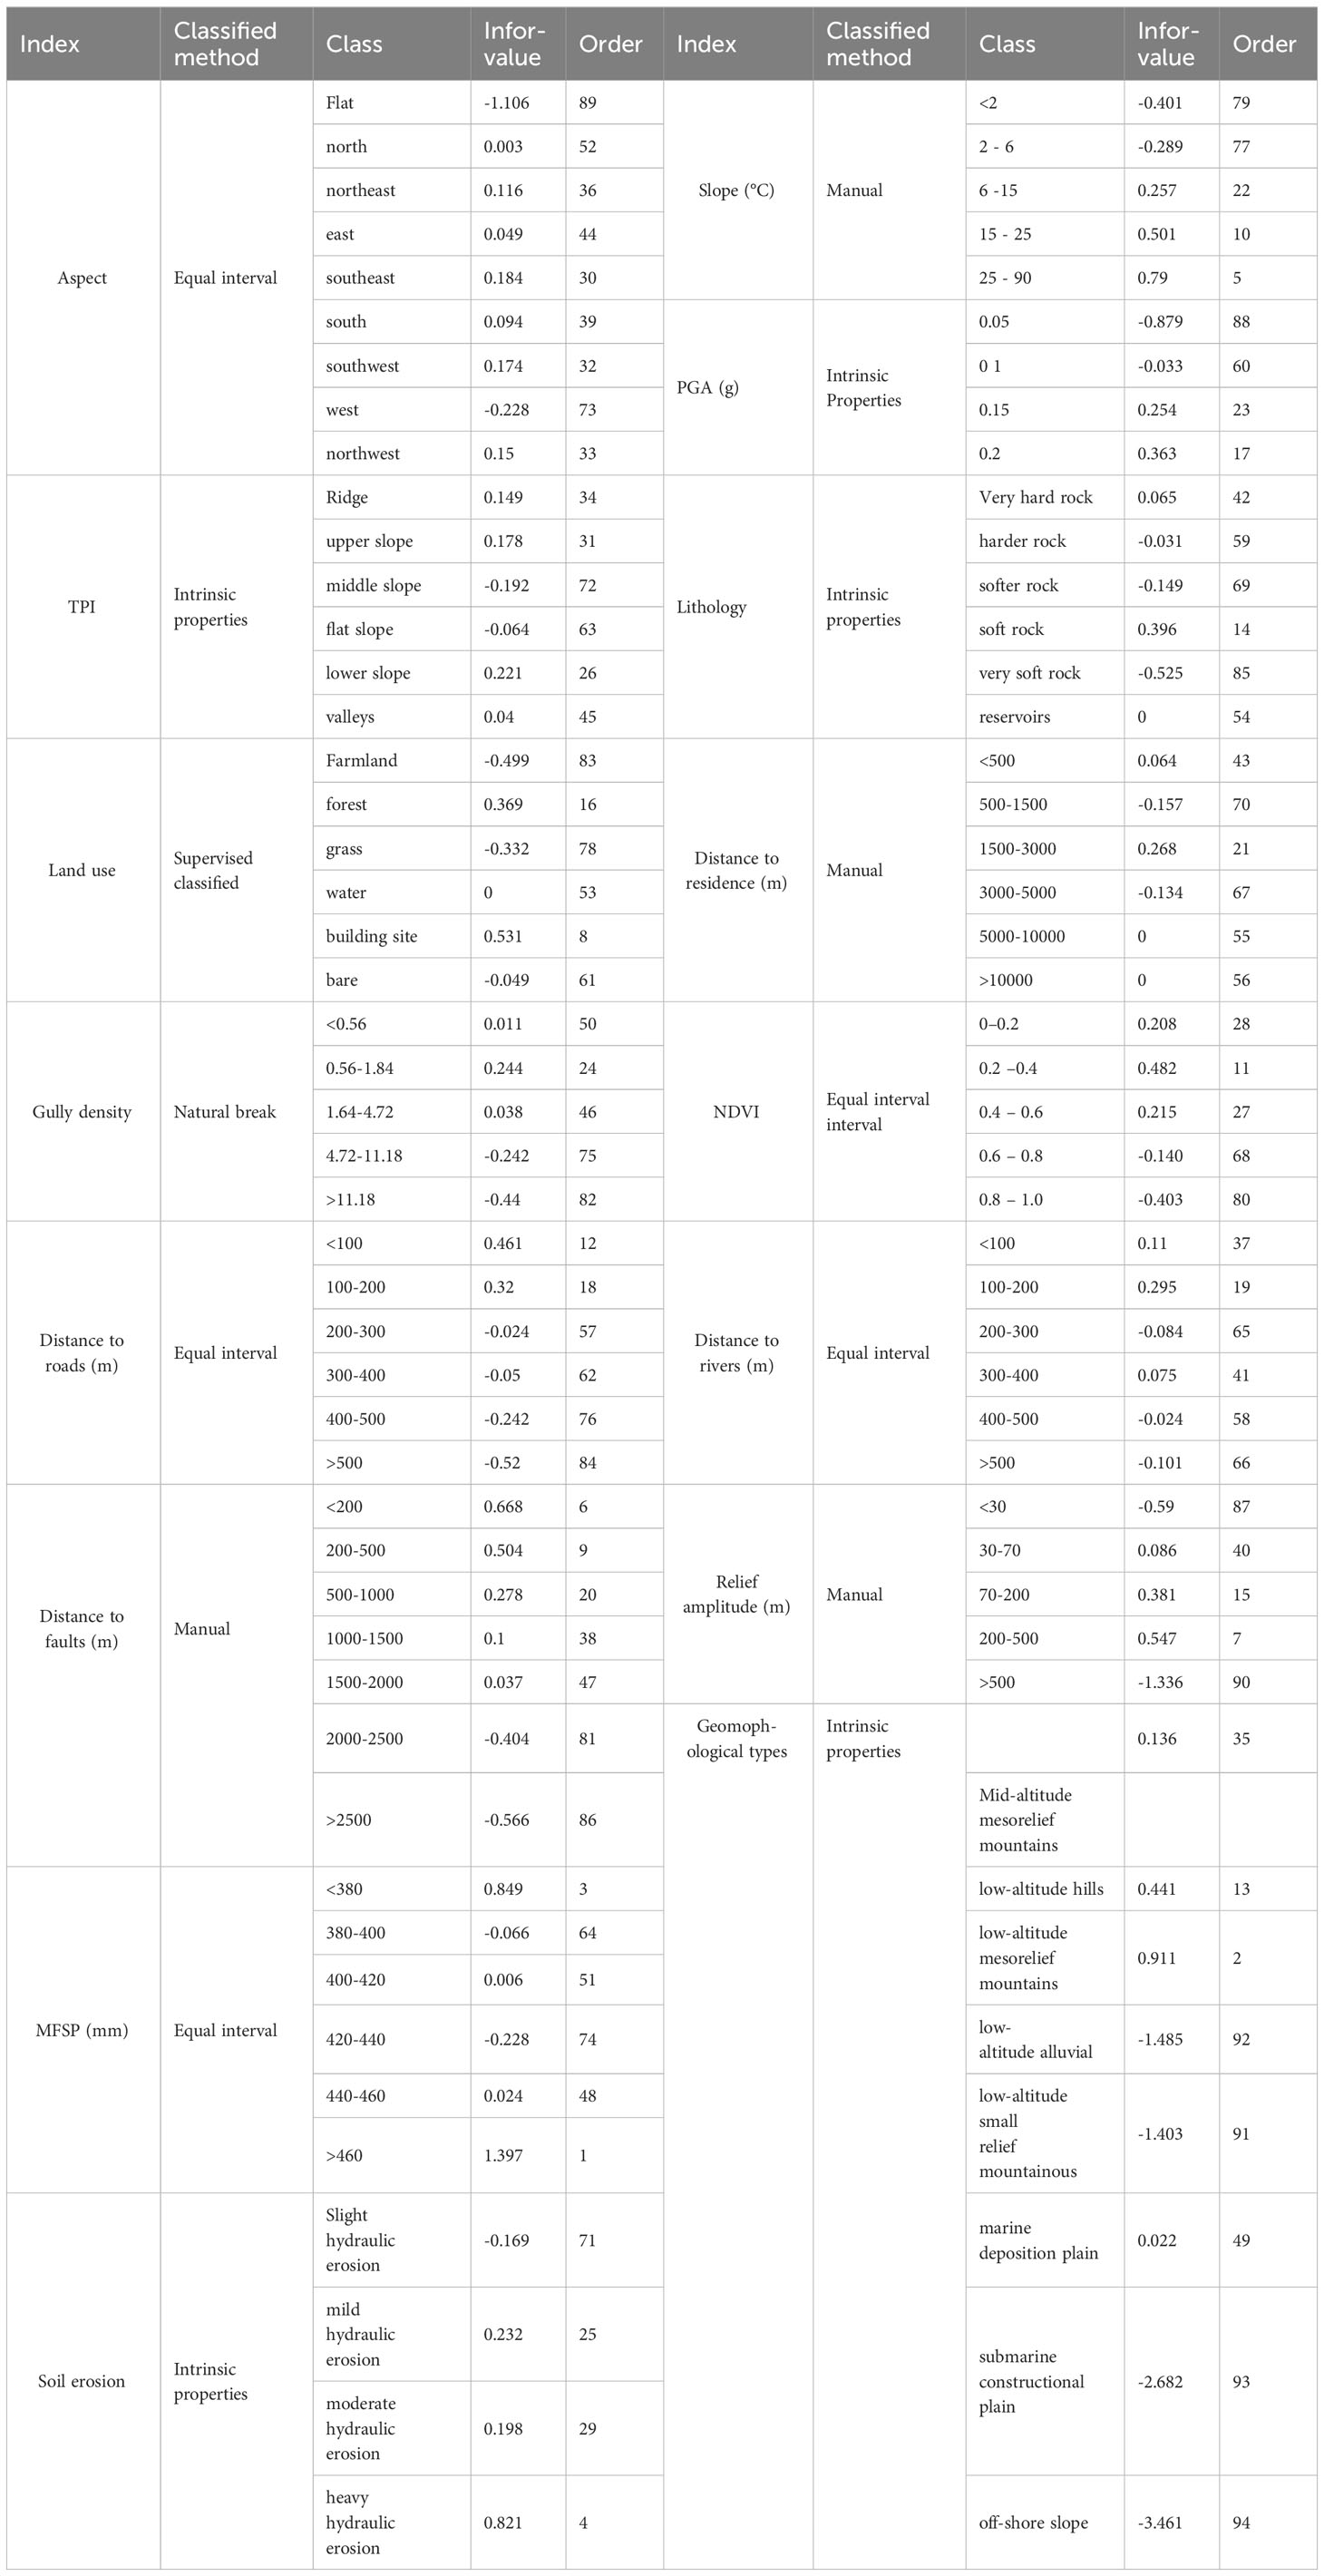
Table 3 Information value of each evaluation index.
4.2.2 GeoDetector model analysis
Although the InforVal model can measure how the driving factors are linked to landslides, it cannot quantitatively measure the specific action patterns and degree of influence of driving factors based on the heterogeneity of landslide spatial distribution. Therefore, to overcome these shortcomings, we present the results of the GeoDetector model analysis in this subsection. The study area is divided into 1km grid cells as the basic analysis scale. The center point of each grid is taken as the sampling point with a total number of 12,923. The landslide susceptibility results of each evaluation cell, assessed by the InforVal model, are used as the target variables of the GeoDetector model.
Factor detection was used to calculate the explanatory power (q-value) of each selected factor for the landslide distribution. The corresponding results and the ranking of q-values are shown in Table 4. The results indicate that all 16 driving factors passed the significance level test at 0.05, suggesting that all factors contribute to controlling the occurrence of landslides in the study area, and topographic factors and geological factors have a stronger explanatory power of the landslide distribution. Furthermore, there is variability in different driving factors on the landslides distribution. The explanatory powers of geomorphological types, relief amplitude, and slope, distance to faults, and land use on the landslide were 39.10%, 38.41%, 31.52%, 22.10% and19.81%, respectively, making them the main driving factors. Whereas the explanatory powers of TPI, PGA, aspect, and lithology were 19.41%, 15.09%, 14.13%, and 10.39%, respectively, indicating lower influences on the landslide in the investigation region. However, the remaining factors were relatively weak due to the explanatory power of them being less than 10 %.
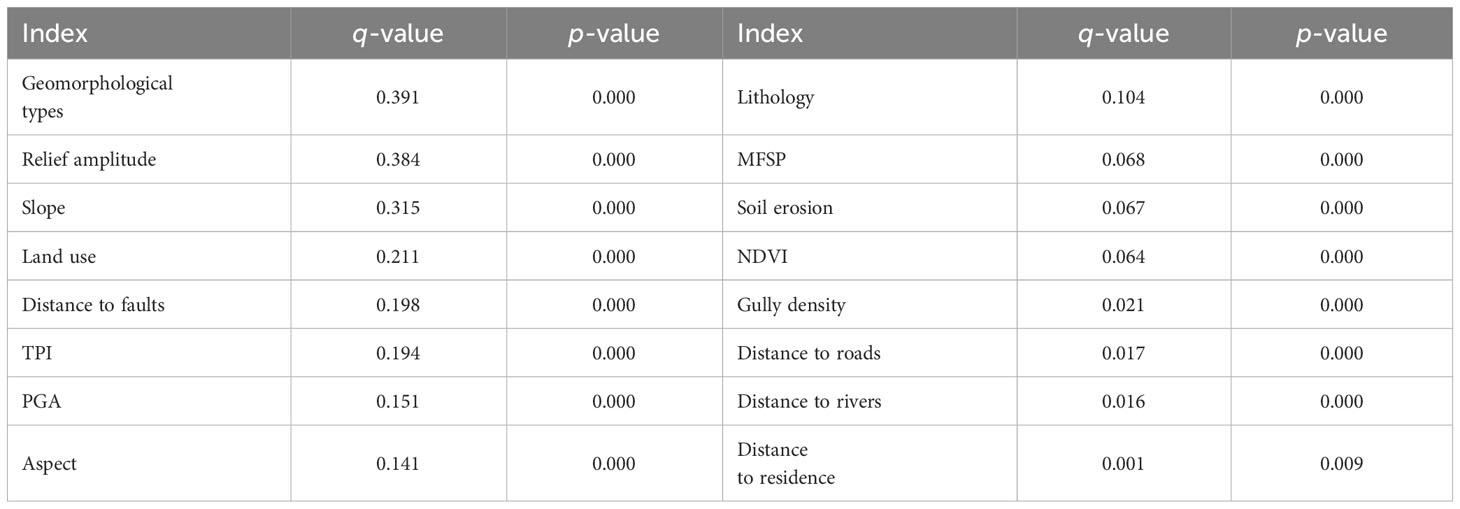
Table 4 The results by factor detector.
Low-altitude mountains and high hills are mainly distributed in the northern and southern regions in the study area. In mountainous areas, geological internal and external forces are active, resulting strong erosion and tectonic forces. As a result, the terrain has large differences in elevation and broken surface, as well as slope is steep, which is prone to landslide occurrence owing to slope instability. The slope determines the gravity effect on loose accumulations and broken rocks on the landslide surface, which reflects the initiating effect of gravity on landslides. The findings show that the greater the slope in the study area, the stronger the initiation of landslides by gravity, which is consistent with many previous research conclusions (Kavzoglu et al., 2014; Zhu et al., 2018). In view of land use types, the artificial surfaces are the areas where human activities are most frequent and the geographic environment is the most intensely transformed. There is a negative correlation between the density of landslides and the distance to faults. In other words, the closer the distance to the fault, the higher the probability of landslide occurrence, and the distribution is more concentrated. From the perspective of the mechanism of landslides, the active faults can induce seismic activity and form sliding surfaces, leading to slope instability. On the other hand, inactive faults may not trigger seismic activity, but they can gradually evolve into sliding surfaces. The rock along the fault tectonic zones becomes fractured and has low weather resistance, which induces landslides of varying scales (Zhang and Huang, 2018).
The interaction detection module can evaluate the increase or decrease in the explanatory power of the landslide distribution when two driving factors collaborate. Among the 16 driving factors, a total of 120 pairs of interaction effects are obtained using the interaction factor, as summarized in Table 5. From Table 5, each factor pair is shown to be larger than the q values of each factor, and smaller than the sum of the two factors’ q values. Hence, the interplay of all driving factor pairs exhibited an enhancement effect on landslide distribution. In the interaction results, bivariate and non-linear enhancements accounted for 57.50% and 42.50%, respectively. It indicated that there are no single-factor effects on the landslide in the southern Liaodong Peninsula region.
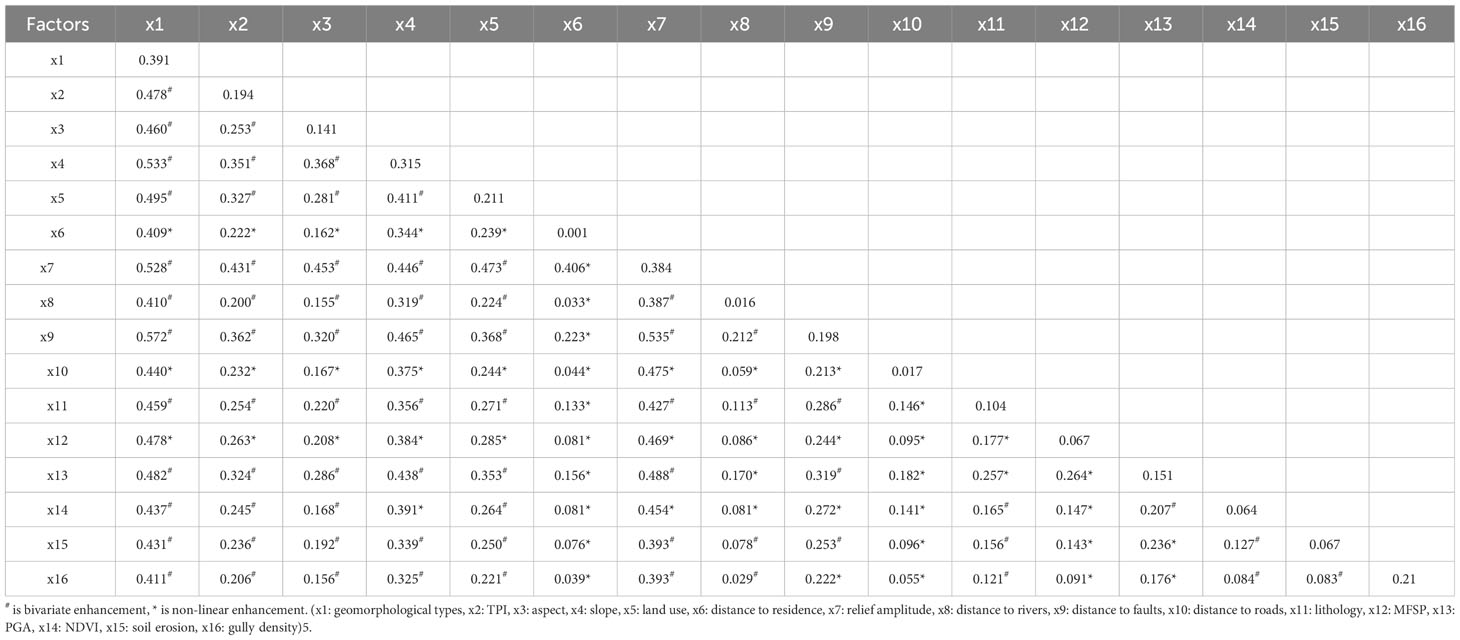
Table 5 Results of interactive probe.
The five most important interactive effects were associated with geomorphological types ∩ distance to faults (q = 0.572), relief amplitude ∩ distance to faults (q = 0.535), geomorphological types ∩ slope (q = 0.533), relief amplitude ∩ geomorphological types (q = 0.0.528), and geomorphological types ∩ land use (q = 0.495). Based on the findings from interaction detection, both natural and human factors exhibited obvious enhancement effects. It is noteworthy that the outcomes of the interaction detection analysis provided further evidence for the significant influence of human factors and the MFSP factors on the spatial distribution of landslides in the study region. In specifical analysis, the explanatory power of distance to residence, distance to roads, and MFSP, when independently affecting the landslide distribution is 0.001, 0.017, and 0.067, respectively. However, the outputs from the interaction probes reveal a nonlinear enhancement relationship between these factors and other factors. For instance, distance to residence ∩ land use (q = 0.406), distance to roads ∩ relief amplitude (q = 0.475), and MFSP ∩ slope (q = 0.384), respectively. In a word, the interaction of natural and human factors exhibited great effects on the landslides spatial distribution in the research area. The two-factor interactions are not simple superposition effects but bivariate and nonlinear enhancement effects.
5 Discussion
Landslide risk management plays an important role in natural disaster prevention and mitigation. As the research keeps growing, lots of methods evaluating and analyzing the occurrence and spatial distribution of landslides have been proposed and have matured in practice. In the last four decades, statistical analysis models have been extensively utilized (Youssef et al., 2014; Das and Lepcha, 2019; Nohani et al., 2019; Liu et al., 2020; Wu et al., 2023b). Different scholars have chosen appropriate methods according to the characteristics of their fields. However, there are still two main challenges in methods to explore the occurrence and spatial distribution of landslides. On the one hand, there are difficulties in determining the influence mechanisms between driving factors and landslides spatial distribution, which should be able to more realistically reveal the comprehensive effects of natural and human factors on landslides; on the other hand, machine learning models have been wildly used in recent years with high accuracy, while the modelling process is complex and the selection of negative samples is uncertain, which restricts the accuracy of the results of the evaluation and analysis (Peng et al., 2014; Huang et al., 2017; Ali et al., 2021).
This article utilizes an InforVal model to examine the optimal factor combination of driving factors on landslides, rather than focusing on a single factor (Chen et al., 2013; Lin et al., 2021). The study takes into account the objective effect of environmental factors on landslides spatial distribution and avoids subjective randomness in determining causal relationships. By combining the GeoDetector model, this research aims to identify the contribution value of various driving factors influencing the spatial patterns of landslide distributions and evaluate the explanatory power of driving factors in the distribution of landslides. This technique addresses the limitation of a single model that can only evaluate landslide susceptibility and effectively quantify single-factor and interactive impacts degree on landslide development (Du et al., 2022), thereby providing comprehensive causal relationship analysis and a more scientific basis for analyzing the development and distribution of landslides in a specific region.
The Liaodong Peninsula plays a crucial role in the development of Northeast China’s economy, while it is located in a low mountain and coastal geological environment. In recent decades, landslides occurred frequently, and there are many hidden danger points of landslides, posing a serious threat to the local socio-economic and life and property safety. Therefore, several researchers have conducted landslide risk assessments based on various evaluation models (Liu, 2019; Li, 2021; Yan et al., 2021; Wang, 2022). Compared with previous studies, this study first focuses on conducting a quantitative analysis of the spatial distribution pattern of landslides in the Liaodong Peninsula and then selects 16 environmental factors to construct a landslide driving factors system. By employing the coupling method of InforVal and geographic detectors, the optimal combination of factors and the main driving factors that contribute the most to landslide distribution in the region was explored and identified. Additionally, the study reveals that the interaction and synergy among the selected nature and human factors in the study area have a much greater impact on landslides than any single factor alone.
The southern Liaodong Peninsula is located in a composite zone of primitive geological subsidence and uplift. In the Quaternary period, significant marine invasions and regressions have played a crucial role in shaping the current coastal landscape (Shan et al., 2022). It is located in the rising area of the Liaodong Plateau, with obvious vertical movement of fault blocks. The tilted movement from the Yellow Sea coast to the Bohai Sea coast continues to strengthen the deformation of the coastal zone (Zhang, 2008). As a result, a widespread mountainous and hilly coastal landform has formed, which has become a favorable condition for the creation stage of landslides. Highly active structural faults can lead to frequent small earthquakes, making the dangerous rock mass loose. Under long-term external actions such as waves and storm surges, the coastal bedrock of the Liaodong Peninsula erodes and wears away the bottom of the coastal slope. It results in the formation of high-risk slopes suspended at the bottom, as shown in Figure 6). Additionally, the Liaodong Peninsula is situated in the northern temperate monsoon climate zone, experiencing significant seasonal temperature differences. The long-term freeze-thaw cycle further increases the cracking rate of the slope surface and top.
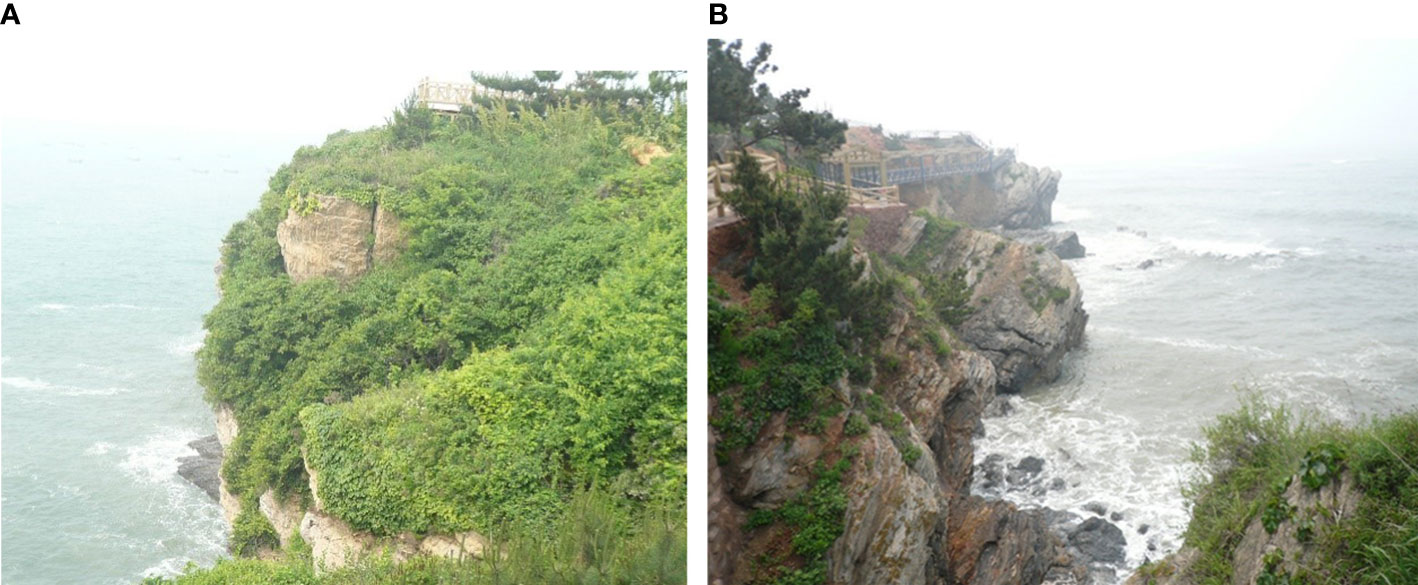
Figure 6 The effect of coast slope failure on infrastructure. (A) Slope cracks under surcharge and waves; (B) Potential effect on the upper bridge from longterm wave scouring.
Over the past two decades, the rapid development of the coastal economic zone has led to slope cutting, loading, blasting vibration, and other activities during the urbanization process. These processes have disrupted the equilibrium state of the original geological stress of the slope, increased the amount of loose solid matter, and expanded the free face of high steep slopes (Wang, 2022). Once the rainy season begins, it causes rainwater to seep into the rock and soil, increasing their weight (Nhu et al., 2020). This process also washes away the cemented minerals inside, leading to crack expansion and softening of the rock and soil, ultimately resulting in a weak surface and widespread landslides, which in turn evolve into chain disaster reactions (Nian et al., 2012). Therefore, it can be concluded that the southern Liaodong Peninsula, under the combined effects of long-term geological internal and external forces, and increasing human activities, constitutes an extreme environmental effect with multiple driving factors. These multiple driving factors have created an extremely vulnerable environment, increasing the risk of geological disasters. The combination of InforVal and the geographical detector model enables the identification of the main driving factors behind landslide development and distribution, as well as the assessment of the interaction between two environmental factors in landslide development and distribution. This approach can be applied to the spatial feature distribution and susceptibility analysis of landslides.
6 Conclusions
(1) Landslides in the southern Liaodong Peninsula exhibit strong clustering characteristics, with a heterogeneous spatial distribution that shows a pattern of small dispersion and large aggregation. Within the 0-63 km range, there is a significant spatial aggregation of landslides, with the degree of aggregation initially increasing and then decreasing. The largest spatial scale of intensity for the gathering of landslides is observed at a distance of 30.13km.
(2) The best combination of factors causing landslides in the study area as follows: geomorphology types of mid-altitude mesorelief mountains, slope being > 25°, aspect of southeast, NDVI of 0.2 ~ 0.4, soft rock, building site, heave hydraulic erosion, PGA of 0.2, lower slope, MFSP > 460mm, relief amplitude of 200 ~ 500m, gully density of 0.56~1.84, distance to residence being 1500 ~ 3000m, distance to rivers of 100 ~ 200m, distance to faults being< 200m, and distance to roads being< 100m.
(3) The coupled InforVal-GeoDetector model was utilized to investigate the impact of driving factors on landslide spatial distribution in the study area. The factor detection reveals that the main driving factors for the landslide spatial distribution were geomorphological types, relief amplitude, slope, land use, and distance to faults. With the q-value 39.10%, 38.41%, 31.52%, 22.10% and 19.81%, respectively.
(4) The interaction detection further revealed that the interplay of all driving pair factors exhibited an enhanced effect on landslide distribution. Bivariate and non-linear enhancements accounted for 57.50% and 42.50%, respectively. Therefore, it can be concluded that the development and distribution of landslides in the southern Liaodong Peninsula region are influenced by both natural conditions and human activities.
Data availability statement
The raw data supporting the conclusions of this article will be made available by the authors, without undue reservation.
Author contributions
YL: Investigation, Methodology, Formal analysis, Data curation, Resources, Visualization, Writing – original draft. DZ: Conceptualization, Investigation, Resources, Funding acquisition, Supervision, Writing – review & editing. CY: Methodology, Data curation, Formal analysis, Resources, Visualization. ZW: Writing – review & editing. TN: Conceptualization, Investigation, Writing – review & editing.
Funding
The author(s) declare financial support was received for the research, authorship, and/or publication of this article. The work presented here was financially supported by the National Natural Science Foundation of China (42077272), LiaoNing Revitalization Talents Program (Project No. XLYC2002036), Liaoning Normal University High-end Research Cultivation Project.
Acknowledgments
Their support is gratefully acknowledged.
Conflict of interest
The authors declare that the research was conducted in the absence of any commercial or financial relationships that could be construed as a potential conflict of interest.
Publisher’s note
All claims expressed in this article are solely those of the authors and do not necessarily represent those of their affiliated organizations, or those of the publisher, the editors and the reviewers. Any product that may be evaluated in this article, or claim that may be made by its manufacturer, is not guaranteed or endorsed by the publisher.
References
Ali S. A., Parvin F., Vojteková J., Costache R., Linh N. T. T., Pham Q. B., et al. (2021). GIS-based landslide susceptibility modeling: a comparison between fuzzy multi-criteria and machine learning algorithms. Geosci. Front. 12, 857–876. doi: 10.1016/j.gsf.2020.09.004
Ayalew L., Yamagishi H. (2005). The application of GIS-based logistic regression for landslide susceptibility mapping in the Kakuda-Yahiko Mountains, Central Japan. Geomorphology. 65, 15–31. doi: 10.1016/j.geomorph.2004.06.010
Bahrami Y., Hassani H., Maghsoudi A. (2021). Landslide susceptibility map** using AHP and fuzzy methods in the Gilan Province, Iran. Acta Geol. Pol. 86, 1797–1816. doi: 10.1007/s10708-020-10162-y
Bai L., Jiang L., Yang D., Liu Y. (2019). Quantifying the spatial heterogeneity influences of natural and socioeconomic factors and their interactions on air pollution using the geographical detector method: a case study of the Yangtze River Economic Belt, China. J. Cleaner Prod. 232, 692–704. doi: 10.1016/j.jclepro.2019.05.342
Bozzolan E., Holcombe E. A., Pianosi F., Marchesini I., Alvioli M., Wagener T. (2023). A mechanistic approach to include climate change and unplanned urban sprawl in landslide susceptibility maps. Sci. Total Environ. 858, 159412. doi: 10.1016/j.scitotenv.2022.159412
Bucci F., Santangelo M., Cardinali M., Fiorucci F., Guzzetti F. (2016). Landslide distribution and size in response to quaternary fault activity: the cardinali m. peloritani range, NE sicily, italy. J. Earth Surf. Process Landf. 41 (5), 711–720.
Budimir M. E. A., Atkinson P. M., Lewis H. G. (2015). A systematic review of landslide probability mapping using logistic regression. Landslides. 12 (3), 419–436. doi: 10.1007/s10346-014-0550-5
Chang Z., Catani F., Huang F., Liu G., Meena S. R., Huang J. (2023). Landslide susceptibility prediction using slope unit-based machine learning models considering the heterogeneity of conditioning factors. J. Rock. Mech. Geotech. 15 (5), 1127–1143. doi: 10.1016/j.jrmge.2022.07.009
Chen W., Zhang S., Li R. W., Shahabi H. (2018). Performance evaluation of the GIS-based data mining techniques of best-first decision tree, random forest, and naïve Bayes tree for landslide susceptibility modeling. Sci. Total Environ. 644, 1006–1018. doi: 10.1016/j.scitotenv.2018.06.389
Chen Y., Guo H. D., Wang Q. J. (2013). Geological disaster susceptibility assessment of the Lushan earthquake based on RS and GIS. Chinese. Sci. Bull. 58 (36), 3859–3866. doi: 10.1360/972013-665
Dahim M., Alqadhi S., Mallick J. (2023). Enhancing landslide management with hyper-tuned machine learning and deep learning models: Predicting susceptibility and analyzing sensitivity and uncertainty. Front. Ecol. Evol. 11, 1108924. doi: 10.3389/fevo.2023.1108924
Das G., Lepcha K. (2019). Application of logistic regression (LR) and frequency ratio (FR) models for landslide susceptibility mapping in Relli Khola river basin of Darjeeling Himalaya, India. SN. Appl. Sci. 1, 1453. doi: 10.1007/s42452-019-1499-8
Deng X., Hu S., Zhan C. (2022). Attribution of vegetation coverage change to climate change and human activities based on the geographic detectors in the yellow river basin, China. Environ. Sci. pollut. Res. Int. 29 (29), 44693–44708. doi: 10.1007/s11356-022-18744-8
Dong J. D., Chen X. L., Cai X. B., Xu Q. Q., Guan Y. Y., Li T., et al (2020). Analysis of the temporal and spatial variation of atmospheric quality from 2015 to 2019 based on China Atmospheric Environment Monitoring Station. J. Geo-inform. Sci. 22 (10), 1983–1995.
Dou J., Yunus A. P., Bui D. T., Merghadi A., Sahana M., Zhu Z., et al. (2019). Improved landslide assessment using support vector machine with bagging, boosting, and stacking ensemble machine learning framework in a mountainous watershed, Japan. Landslides. 17, 641–658. doi: 10.1007/s10346-019-01286-5
Dowling C. A., Santi P. M. (2014). Debris flows and their toll on human life: a global analysis of debris-flow fatalities from 1950 to 2011. Nat. Hazards. 71, 203–227. doi: 10.1007/s11069-013-0907-4
Du Y. C., Ge Y. G., Liang X. Y., Sun Q. M., Chen P. (2022). Research of debris flow susceptibility based on the coupling of certainty factor method and geo detector model in anning river basin. J. Disaster Prev. Mitig. Eng. 42 (4), 664–674. doi: 10.13409/j.cnki.jdpme.20210112002
Froude M. J., Petley D. N. (2018). Global fatal landslide occurrence from 2004 to 2016. Nat. Hazard. Earth. Sys. 18 (8), 2161–2181. doi: 10.5194/nhess-18-2161-2018
Guo Z., Ferrer J. V., Hürlimann M., Medina V., Puig-Polo C., Yin K., et al. (2023). Shallow landslide susceptibility assessment under future climate and land cover changes: a case study from southwest China. Geosci. Front. 14, 101542. doi: 10.1016/j.gsf.2023.101542
Han J., Wang J., Chen L., Xiang J., Ling Z., Li Q., et al. (2021). Driving factors of desertification in Qaidam basin, China: an 18-year analysis using the geographic detector model. Ecol. Ind. 124, 107404. doi: 10.1016/j.ecolind.2021.107404
Hua Y., Wang X., Li Y., Xu P., Xia W. (2021). Dynamic development of landslide susceptibility based on slope unit and deep neural networks. Landslides. 18 (1), 281–302. doi: 10.1007/s10346-020-01444-0
Huang F., Yan J., Fan X., Yao C., Huang J., Chen W., et al. (2022). Uncertainty pattern in landslide susceptibility prediction modelling: Effects of different landslide boundaries and spatial shape expressions. Geosci Front. 13 (2), 101317. doi: 10.1016/j.gsf.2021.101317
Huang F., Yin K., Huang J., Gui L., Wang P. (2017). Landslide susceptibility map** based on self-organizing-map network and extreme learning machine. Eng. Geol. 223, 11–22. doi: 10.1016/j.enggeo.2017.04.013
Jiang R., Wu P., Song Y., Wu C., Wang P., Zhong Y. (2022). Factors influencing the adoption of renewable energy in the U.S. residential sector: An optimal parameters-based geographical detector approach. Renewable. Energy. 201, 450–461. doi: 10.1016/j.renene.2022.09.084
Kavzoglu T., Sahin E. K., Colkesen I. (2014). Landslide susceptibility map** using GIS-based multi-criteria decision analysis, support vector machines, and logistic regression. Landslides. 11, 425–439. doi: 10.1007/s10346-013-0391-7
Kavzoglu T., Sahin E. K., Colkesen I. (2015). Selecting optimal conditioning factors in shallow translational landslide susceptibility map** using genetic algorithm. Eng. Geol. 192, 101–112. doi: 10.1016/j.enggeo.2015.04.004
Li Q. (2021). Risk assessment of geological hazards in zhuanghe based on GIS (Dalian: Liaoning Normal University).
Li M., Jiao Y., Xu B., Zhang C., Xue Y., Ren Y. (2020). Spatial analyses of the influence of autocorrelation on seasonal diet composition of a marine fish species. Fish. Res. 228, 105563. doi: 10.1016/j.fishres.2020.105563
Lin J., Chen W., Qi X., Hou H. (2021). Risk assessment and its influencing factors analysis of geological hazards in typical mountain environment. J. Cleaner Prod. 309, 127077. doi: 10.1016/j.jclepro.2021.127077
Lin L., Lin Q., Wang Y. (2017). Landslide susceptibility map** on a global scale using the method of logistic regression. Nat. Hazard. Earth. Sys. 17 (8), 1411–1424. doi: 10.5194/nhess-17-1411-2017
Liu J. (2019). Risk assessment of debris flow in northern mountainous areas of Dalian (Dalian: Liaoning Normal University).
Liu H., Li X., Meng T., Liu Y. (2020). Susceptibility mapping of damming landslide based on slope unit using frequency ratio model. Arabian J. Geosci. 13, 790. doi: 10.1007/s12517-020-05689-w
Nhu V. H., Shirzadi A., Shahabi H., Singh S. K., Al-Ansari N., Clague J. J., et al. (2020). Shallow landslide susceptibility map**: A comparison between logistic model tree, logistic regression, naïve bayes tree, artificial neural network, and support vector machine algorithms. Int. J. Environ. Res. Public Health 17 (8), 2749. doi: 10.3390/ijerph17082749
Nian T. K., Zheng D. F., Chen G. Q. (2012). Investigation of coastal rock slope geohazard and protection of geological relics. J. Eng. Geol. 2012, 7.
Nohani E., Moharrami M., Sharafi S., Khosravi K., Pradhan B., Pham B. T., et al. (2019). Landslide susceptibility mapping using different GIS-based bivariate models. Water. 11, 1402. doi: 10.3390/w11071402
Pardeshi S. D., Autade S. E., Pardeshi S. S. (2013). Landslide hazard assessment: recent trends and techniques. SpringerPlus. 2, 1–11. doi: 10.1186/2193-1801-2-523
Pawluszek K., Borkowski A. (2017). Impact of DEM-derived factors and analytical hierarchy process on landslide susceptibility map** in the region of Rożnów Lake, Poland. Nat. Hazards. 86 (2), 919–952. doi: 10.1007/s11069-016-2725-y
Peng L., Niu R., Huang B., Wu X., Zhao Y., Ye R. (2014). Landslide susceptibility map** based on rough set theory and support vector machines: a case of the Three Gorges area, China. Geomorphology. 204, 287–301. doi: 10.1016/j.geomorph.2013.08.013
Piacentini D., Troiani F., Daniele G., Pizziolo M. (2018). Historical geospatial database for landslide analysis: the Catalogue of Landslide Occurrences in the Emilia-Romagna Region (CLOCkER). Landslides. 15 (4), 811–822. doi: 10.1007/s10346-018-0962-8
Pourghasemi H. R., Yansari Z. T., Panagos P., Pradhan B. (2018). Analysis and evaluation of landslide susceptibility: a review on articles published during 2005-2016 (periods of 2005-2012 and 2013- 2016). Arab. J. Geosci. 11, 1–12. doi: 10.1007/s12517-018-3531-5
Qiao P., Yang S., Lei M., Chen T., Dong N. (2019). Quantitative analysis of the factors influencing spatial distribution of soil heavy metals based on geographical detector. Sci. Total. Environ. 664, 392–413. doi: 10.1016/j.scitotenv.2019.01.310
Qiu H., Cui Y., Yang D., Pei Y., Hu S., Ma S., et al. (2019). Spatiotemporal distribution of non-seismic landslides during the last 22 years in shaanxi province, china. ISPRS Int. J. Geoinf. 8 (11), 505. doi: 10.3390/ijgi8110505
Reichenbach P., Rossi M., Malamud B. D., Mihir M., Guzzetti F. (2018). A review of statistically-based landslide susceptibility models. Earth-Sci. Rev. 180, 60–91. doi: 10.1016/j.earscirev.2018.03.001
Sepúlveda S. A., Petley D. N. (2015). Regional trends and controlling factors of fatal landslides in Latin America and the Caribbean. Nat. Hazards. Earth. Sys. 15 (8), 1821–1833. doi: 10.5194/nhess-15-1821-2015
Shafabakhsh G. A., Famili A., Bahadori M. S. (2017). GIS-based spatial analysis of urban traffic accidents: Case study in Mashhad, Iran. J. Traffic. Transp. Eng. 4 (3), 290–299. doi: 10.1016/j.jtte.2017.05.005
Shan Z., Wu H., Ni W., Sun M., Wang K., Zhao L., et al. (2022). Recent technological and methodological advances for the investigation of submarine landslides. J. Mar. Sci. Eng. 10 (11), 1728. doi: 10.3390/jmse10111728
Shen D., Guo J., Wang Z., Chen J. (2021). Sensitivity assessment of geological hazards based on hot spot analysis and geographic detectors. Envir. Ecol. 3 (4), 83–89. doi: 10.1016/j.envint.2021.106778
Song Y., Chen B., Ho H. C., Kwan M.-P., Liu D., Wang F., et al. (2021). Observed inequality in urban greenspace exposure in China. Environ. Int. 156, 106778. doi: 10.1016/j.envint.2021.106778
Song Y., Wu P., Gilmore D., Li Q. (2020). A spatial heterogeneity-based segmentation model for analyzing road deterioration network data in multi-scale infrastructure systems, IEEE Trans. Intell. Trans. Sys. 22 (11), 7073–7083. doi: 10.1109/TITS.2020.3001193
Tan Y. M., Guo D., Bai B. X. (2015). Geological disaster susceptibility evaluation of the Fuling area based on information value method. J. Geo-Infor. Sci. 17 (12), 1554–1562. doi: 10.3724/SP.J.1047.2015.01554
Tang R.-X., Yan E. C., Wen T., Yin X.-M., Tang W. (2021). Comparison of logistic regression, information value, and comprehensive evaluating model for landslide susceptibility mapping. Sustainability. 13, 3803. doi: 10.3390/su13073803
Tobler W. R. (1970). A computer movie simulating urban growth in the Detroit region. Econ. Geogr. 46 (sup1), 234–240. doi: 10.2307/143141
Tsangaratos P., Ilia I., Hong H., Chen W., Xu C. (2017). Applying Information Theory and GIS-based quantitative methods to produce landslide susceptibility maps in Nancheng County, China. Landslides. 14, 1091–1111. doi: 10.1007/s10346-016-0769-4
Varnes D. J. (1978). “Slope movement types and processes,” in Landslides, analysis and control, special report 176: Transportation research board. Eds. Schuster R. L., Krizek R. J. (Washington, DC: National Academy of Sciences), 11–33.
Wang J. B. (2022). The susceptibility of slope geo-hazards and three-dimensional dynamic response analysis of typical dangerous slopes in Dalian area (Dalian: Dalian University of Technology).
Wang X. S., Chen J., Nie W., Xie W., Teng D. G. (2020). Spatial distribution characteristics and influencing factors of landslide disasters in mountain cities. J. Chongqing University. 43 (8), 87–96. doi: 10.11835/j.issn.1000-582X.2020.08.010
Wang Y., Guo E., Kang Y., Ma H. (2022). Assessment of land desertification and its drivers on the Mongolian plateau using intensity analysis and the geographical detector technique. Remote. Sens. 14 (24), 6365. doi: 10.3390/rs14246365
Wang J.-F., Hu Y. (2012). Environmental health risk detection with GeogDetector. Environ. Model. Software 33, 114–115. doi: 10.1016/j.envsoft.2012.01.015
Wang J., Li X., Christakos G., Liao Y., Zhang T., Gu X., et al. (2010). Geographical detectors-based health risk assessment and its application in the neural tube defects study of the Heshun region, China. Int. J. Geogr. Inf. Sci. 24 (1), 107–127. doi: 10.1080/13658810802443457
Wu H., Nian T. K., Shan Z. G., Li D. Y., Guo X. S., Jiang X. G. (2023a). Rapid prediction models for 3D geometry of landslide dam considering the damming process. J. Mt. Sci. 20, 928–942. doi: 10.1007/s11629-022-7906-z
Wu H., Nian T. K., Shan Z. G. (2023b). Investigation of landslide dam life span using prediction models based on multiple machine learning algorithms. Geomatics. Geomat. Nat. Haz. Risk. 14, 1. doi: 10.1080/19475705.2023.2273213
Xu J., Liu H., Li B., Gao X., Nie P., Sun C., et al. (2021). Identifying factors that affect environmental air quality using geographical detectors in the NKEFAs of china. Front. Earth Sci. 16 (2). doi: 10.1007/s11707-021-0882-0
Yan C. L., Zheng D. F., Nian T. K., Wang J. B., Jiao H. B., Sun S. H., et al. (2021). Fuzzy Bayesian network model based on ANP and its application to coastal zone geohazard risk assessment.Ital. J. Eng. Geol. Env. 29 (6), 1862–1868. doi: 10.13544 /j. cnki. Jeg. 2021- 0715
Yang Y., Yan X., Wang X. (2021). The characteristics and formation of geological hazards in Yunnan Province. J. Catastrophe. 36, 131–139. doi: 10.3969/j.issn.1000-811X.2021.03.023
Youssef A. M., Al-Kathery M., Pradhan B. (2014). Landslide susceptibility mapping at Al-Hasher area, Jizan (Saudi Arabia) using GIS-based frequency ratio and index of entropy models. Geosci. J. 19, 113–134. doi: 10.1007/s12303-014-0032-8
Yu X., Gao H. (2020). A landslide susceptibility map based on spatial scale segmentation: a case study at Zigui-Badong in the Three Gorges Reservoir Area, China. PloS One 15 (3), 0229818. doi: 10.1371/journal.pone.0229818
Zhang Z. P. (2008). Study on the geomorphological features and impact factors of Liaoning coastal zone [master’s thesis]. (Qingdao: Ocean University of China).
Zhang F., Huang X. (2018). Trend and spatiotemporal distribution of fatal landslides triggered by non-seismic effects in China. Landslides. 15 (8), 1663–1674. doi: 10.1007/s10346-018-1007-z
Zhang J., Ma X., Zhang J., Sun D., Zhou X., Mi C. (2023). Insights into geospatial heterogeneity of landslide susceptibility based on the SHAP-XGBoost model. J. Environ. Manage. 332, 117357. doi: 10.1016/j.jenvman.2023.117357
Zhang Y., Zhang L., Wang J., Dong G., Wei Y. (2023). Quantitative analysis of NDVI driving factors based on the geographical detector model in the Chengdu-Chongqing region, China. Ecol. Indic. 155, 110978. doi: 10.1016/j.ecolind.2023.110978
Zhou C., Chen J., Wang S. (2018). Examining the effects of socioeconomic development on fine particulate matter (PM2.5) in China's cities using spatial regression and the geographical detector technique. Sci. Total Environ. 619, 436–445. doi: 10.1016/j.scitotenv.2017.11.124
Keywords: landslides, spatial distribution, information value model, GeoDetector, southern Liaodong Peninsula
Citation: Li Y, Zheng D, Yan C, Wang Z and Nian T (2024) Spatial distributions and multi-factor driving mechanism of landslide in southern Liaodong Peninsula. Front. Ecol. Evol. 11:1339265. doi: 10.3389/fevo.2023.1339265
Received: 15 November 2023; Accepted: 06 December 2023;
Published: 11 January 2024.
Edited by:
Hao Wu, Nanjing Hydraulic Research Institute, ChinaReviewed by:
Zhihai Li, PowerChina Huadong Engineering Corporation Limited, ChinaYiding Bao, Chinese Academy of Sciences (CAS), China
Copyright © 2024 Li, Zheng, Yan, Wang and Nian. This is an open-access article distributed under the terms of the Creative Commons Attribution License (CC BY). The use, distribution or reproduction in other forums is permitted, provided the original author(s) and the copyright owner(s) are credited and that the original publication in this journal is cited, in accordance with accepted academic practice. No use, distribution or reproduction is permitted which does not comply with these terms.
*Correspondence: Defeng Zheng, defengzheng@lnnu.edu.cn; Tingkai Nian, tknian@dlut.edu.cn