Geography, climate and shifts in host plants distribution explain the genomic variation in the cactus moth
 Daniel Poveda-Martínez1,2*
  Víctor Noguerales3
  Stephen D. Hight4 Guillermo Logarzo1 Brent C. Emerson3 Laura Varone1†
  Esteban Hasson2†
- 1Fundación para el Estudio de Especies Invasivas (FuEDEI), Hurlingham, Argentina
- 2Instituto de Ecología Genética y Evolución de Buenos Aires (IEGEBA-CONICET), Facultad de Ciencias Exactas y Naturales, Universidad de Buenos Aires, Buenos Aires, Argentina
- 3Island Ecology and Evolution Research Group, Instituto de Productos Naturales y Agrobiología (IPNA-CSIC), San Cristóbal de La Laguna, Canary Islands, Spain
- 4The U.S. Department of Agriculture – Agricultural Research Service (USDA-ARS), Insect Behavior and Biocontrol Research Unit (IBBRU), Tallahassee, FL, United States
Landscape heterogeneity and the host plant use are factors suggested to play determinant roles in shaping the evolutionary history of herbivorous insects. However, the role of the reconfiguration of host plants distributions linked to Quaternary climate oscillations as drivers of contemporary population genetic structure is still poorly understood. Here, we formally examine the relative contribution of such factors on intraspecific diversification using the South American cactus moth, Cactoblastis cactorum, an herbivore insect specialized in the use of cacti as host plants. We assessed genomic variation using genome-wide SNPs and mitochondrial data in populations sampled across a broad geographical gradient where moths feed on different cactus species. We integrated demographic simulations and ecological niche modeling into a landscape genomics framework, to test alternative hypotheses of past and current population connectivity for both C. cactorum and its host plants. Regions exhibiting higher genomic diversity were evaluated for congruence with areas where suitable climatic conditions remained stable through time. Our results revealed that past spatial configuration of suitable habitat conditions and shifts of host plants distributions are the factors that better explain the intraspecific diversification. Genomic data also supported the hypothesis that areas of long-term habitat stability served as refugia for C. cactorum, enabling the maintenance of high levels of genetic diversity over time. Overall, our study highlights the importance of integrating inter-specific interactions and their spatio-temporal dynamics to better understand the relative importance of abiotic and biotic factors driving the diversification processes in herbivorous insects with broad geographical and restricted host ranges.
1 Introduction
The spatial distribution of genomic variation in natural populations is influenced by a variety of processes, including the dispersal ability of individuals, gene flow, biotic interactions, and landscape features. Unveiling the relative roles of these processes is necessary to understand how organisms interact with the environment and how the latter shapes their genomic makeup. In this matter, herbivorous insects distributed along environmental gradients feeding on a set of host plants offer the opportunity of disentangling the ecological and geographical processes driving population differentiation and gene flow dynamics in heterogeneous landscapes (Borer et al., 2012; Laukkanen et al., 2014).
Among the ecological factors, the use of alternative host plants is thought to shape patterns of gene flow among populations in herbivorous insects (Funk et al., 2006; Forbes et al., 2017). Moreover, changes in host plant use together with adaptation to different environmental conditions can lead to ecological specialization and diversification (isolation by environment, IBE; Wang and Bradburd, 2014). Geography (isolation by distance, IBD; Slatkin, 1993) and the spatial distribution of suitable habitats (isolation by resistance, IBR; McRae, 2006; McRae and Beier, 2007) may also be determinants of population genetic differentiation across the landscape (Peterman et al., 2014; Vidal et al., 2019).
Insects with narrow diet breadths and environmental requirements are expected to exhibit marked genetic structure as a consequence of gene flow disruption between populations exploiting alternative hosts (Vidal and Murphy, 2018) and/or inhabiting a fragmented landscape of suitable habitats (Ortego et al., 2021). However, in widely distributed insects feeding on a narrow array of host plants across the landscape, contemporary patterns of genomic variation can also be influenced by a range of factors, including dispersal ability, patterns of host plant use and/or components of landscape heterogeneity. Moreover, less studied spatio-ecological factors, such as distributional shifts of host plants driven by climate oscillations throughout the Quaternary period, may have also promoted cycles of geographical isolation and secondary contact, shaping contemporary patterns of genetic variation in herbivorous insects (Noguerales et al., 2018). Yet, the relative contribution of these ecological factors and spatio-temporal landscape dynamics in driving populations differentiation in taxa with broad climatic niches and narrow feeding requirements are still open questions in evolutionary biology. To understand the role of such spatial-ecological processes in species diversification and shaping gene flow in heterogeneous landscapes, an integrative approach is necessary, taking into account historical and contemporary environmental data, combined with a suitable insect model with narrow trophic requirements and distributed along environmental gradients.
Here, we investigate patterns of genomic variation in the cactus moth, Cactoblastis cactorum (Berg) (Lepidoptera: Pyralidae), a southern South American herbivore insect, that inhabits heterogeneous landscapes, faces a variety of climate conditions, and feeds on several species of the genus Opuntia (Cactaceae, Opuntioideae). This moth can be found across wide latitudinal and longitudinal gradients, from the arid and semi-arid lands of northwestern and northeastern Chaco, to the grasslands of the Pampa, and north of the Patagonian steppe (McFadyen, 1985; Morrone, 2014; Varone et al., 2014). Along such broad distribution, C. cactorum feeds on native species, such as O. anacantha Speg., O. bonaerensis Speg., O. elata Link & Otto ex Salm-Dyck, O. megapotamica Arechav., O. penicilligera Speg., O. quimilo K. Schum., and O. rioplatense Font., and also the cultivated O. ficus-indica (L.) Miller, an exotic species in the region (Varone et al., 2012; Varone et al., 2014).
Soon after its introduction the prickly pear O. ficus-indica was quickly adopted as a crop in southern South America (Ervin, 2012). The availability of this new host plant represents a relatively recent expansion of host use for C. cactorum. Currently this moth is a serious threat to the regional industry of prickly pear fruit production (Ochoa et al., 2007). The introduction of the new host led to the suggestion that the spread of O. ficus-indica promoted the dispersion and geographical range expansion of C. cactorum (Varone et al., 2014).
Previous studies revealed that populations of C. cactorum are genetically differentiated in at least four haplogroups correlated with geography and variable levels of genetic diversity among native and non-native moth populations (Marsico et al., 2011), and that patterns of coloration of mature larvae and host plant use vary across regions (Brooks et al., 2012). However, only limited conclusions can be drawn from these studies since (i) only a single mitochondrial genetic marker was used; (ii) sampling did not cover the entire species range; and (iii) the relative abundance of host species was not considered (McFadyen, 1985; Marsico et al., 2011; Brooks et al., 2012). More recently, an extensive survey evaluating host plant preferences across the broad range of C. cactorum concluded that patterns of host use reflect variation in host availability rather than female preference (Varone et al., 2014).
In this study, we use high-throughput nuclear sequence data and Sanger sequence data of mitochondrial DNA to investigate the processes that shaped patterns of diversification in the cactus moth, C. cactorum. Our sampling strategy extended over a broad geographic range taking care of including the diversity of native and non-native hosts. We combine inferences from phylogenomics and demographic modeling to uncover the tempo and mode of diversification, patterns of gene flow and population genetic structure. By integrating ecological niche modeling into a landscape genomic framework, we test a comprehensive suite of competing scenarios of population isolation. Specifically we evaluate the hypotheses that contemporary spatial patterns of population genetic differentiation in C. cactorum are predominantly a consequence of the spatial reconfiguration of suitable areas and shifts in the distribution of host plants caused by Quaternary climatic oscillations whilst the current pattern of host plant use and topoclimatic factors are less influential in its diversification. Since we estimated historical and contemporary habitat suitability, and long-term suitable environments tend to support larger effective population sizes (Carnaval et al., 2009; Soley-Guardia et al., 2019), we also address whether regions where suitable habitat conditions remained stable since the last glacial maximum (LGM, ca. 21 ka) to the present exhibit greater genetic diversity than populations thriving in less stable areas. Finally, we evaluated whether the expansion of O. ficus-indica facilitated contemporary gene flow among geographically distant populations. In this matter, our expectation is to find footprints of genetic admixture among distant regions, especially among areas highly impacted by prickly pear agroindustry.
2 Methods
2.1 Population sampling and DNA extraction
Between 2018 and 2019, we collected 140 individuals of C. cactorum from 28 sampling sites spanning a broad range of its native distribution in southern South America (Figure 1; Table S1). Individuals were collected directly from host plants, including seven native taxa, O. anacantha, O. bonaerensis, O. elata, O. megapotamica, O. penicilligera, O. rioplatense, and O. quimilo, and the exotic O. ficus-indica. To avoid the inclusion of siblings, only a single individual per sampled plant and eggstick was used for genetic analysis. Before DNA extraction, individual larvae were dissected to remove any food residue, and ~30 mg of clean tissue was used for DNA extraction with Qiagen DNeasy Blood & Tissue Kit following manufacturer’s instructions (Qiagen, Inc.).
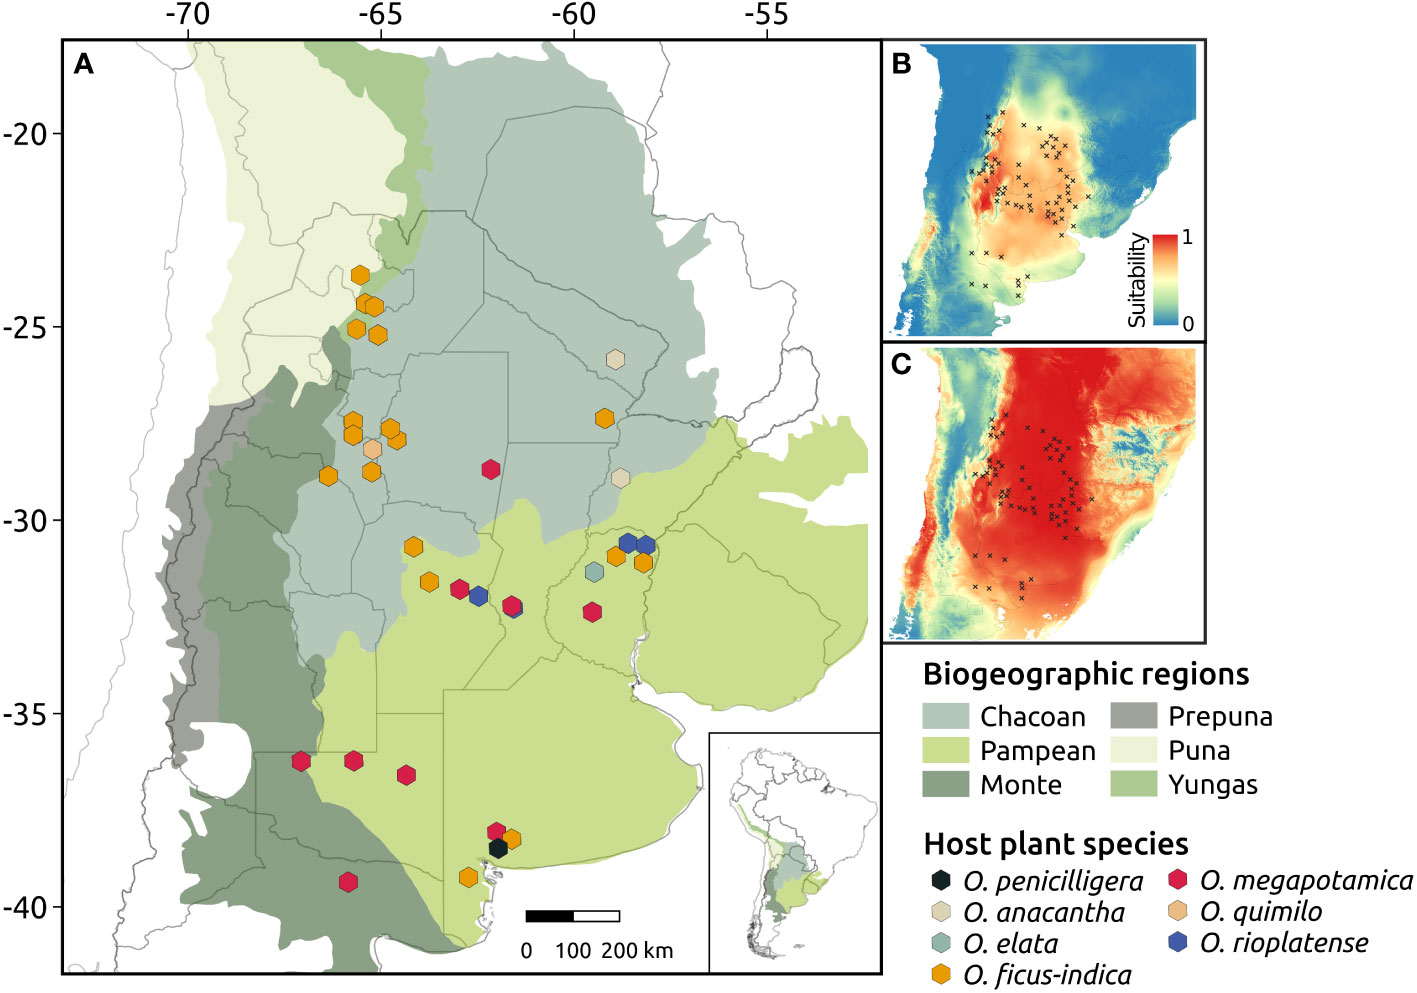
Figure 1 Geographic location and host species of the Cactoblastis cactorum populations sampled in this study (A). Regions represent biogeographic provinces according to Morrone et al. (2014). Panels (B, C) represent the maps of habitat suitability for C. cactorum during the present (B) and during the Last Glacial Maximum (LGM, ca. 21ky) (C) as inferred by the most-supported ENM model in MAXENT.
2.2 Genomic libraries preparation, filtering and assembling
Individuals were processed into two genomic libraries following the double digest restriction-site Associated DNA (ddRAD) procedure described in Peterson et al. (2012). Genomic DNA was fragmented using NspI and MboI restriction enzymes, and then purified and ligated to barcoded adapters. Libraries were sequenced in paired-end 125 bp mode on a HiSeq2500 Illumina instrument.
Demultiplexed raw reads were checked, compiled and summarized on MultiQC v1.10.1 (Ewels et al., 2016). Reads were assembled with IPYRAD v.0.9.59 (Eaton and Overcast, 2020). A reference based assembly method was implemented for mapping the filtered reads against the C. cactorum reference genome. DNA extracted from an adult male (clean DNA, free of food contaminants can be obtained from males, as they do not feed) was used for library preparation and sequenced in an Illumina NovaSeq 6000 platform. The de novo assembly was accomplished with CLC Genomics Workbench v7.1 (see Poveda-Martínez et al., 2022 for details). Thus, the reference genome served also as a filter for exogenous reads derived from larval food.
In subsequent IPYRAD assembly steps, we allowed 20% of SNPs per RAD locus, and shared heterozygous sites occurring across a maximum of 25% of samples. A minimum of 90% was set for the minimum number of samples scored per locus. We used vcftools v1.15 (Danecek et al., 2011) to remove SNPs with minimum allele frequency lower than 3%, missing data per site across individuals exceeding 25%, and to keep SNPs with read depths between 6× and 100×. Individuals with more than 20% missing data were excluded from further analyses. To prune SNPs in linkage disequilibrium, PLINK v1.9 (Purcell et al., 2007) was used with a window size of 50 bp, window shift of 5 and VIF threshold of 2. SNPs under selection were identified using Bayescan v.2.1 (Foll and Gaggiotti, 2008) and excluded from the dataset. A fragment of the mitochondrial gene encoding the Cytochrome oxidase subunit I (COI) (mtDNA) was amplified using primers C1-J-2183 and PatII. Amplifications, PCR-product purification and sequencing were performed as detailed in Poveda-Martínez et al. (2022).
2.3 Assessing genomic population structure
Population genetic structure was inferred using genome-wide SNP data (nDNA hereafter) and the sparse non-negative matrix factorization approach (sNMF) (Frichot et al., 2014), as implemented in R using the LEA package (Frichot and François, 2015). The number of genetic clusters that best described our data was assessed with 100 repetitions for each possible K value (from K = 1 to K = 10) and using the cross-entropy criterion. In addition to sNMF, genetic structure was approximated by using the major axes of genomic variation obtained from a Principal Component Analysis (PCA), as implemented in the hierfstat (Goudet, 2005) R package. We used mtDNA data to construct a haplotype network using the Median Joining algorithm (Bandelt et al., 1999) as implemented in PopArt v.1.7.1 (Leigh and Bryant, 2015).
2.4 Phylogenetic analyses
Phylogenetic relationships were reconstructed among the main genetic groups as inferred in sNMF using nDNA data and the coalescent-based method implemented in SNAPP (Bryant et al., 2012). Due to computational burden, SNAPP analyses were run including only five individuals per genetic cluster, selecting those with an ancestry coefficient higher than 0.85, according to sNMF, and individuals that had the lowest proportion of missing data. One SNP per locus was randomly selected resulting in a new matrix of 2,086 SNPs shared across tips. This allows to ensure independent biallelic markers as well as fairly spaced SNPs as required in SNAPP (Bryant et al., 2012). The default model parameters were used in SNAPP for U and V equal to one, and the analysis was run for 5,000,000 MCMC generations, sampling every 1000 generations in Beast v.2.5.2 (Bouckaert et al., 2014). The complete set of trees was visualized in Densitree v.2.2.5 (Bouckaert, 2010), removing the first 10% of the trees as burn-in. A maximum credibility tree was generated using TreeAnnotator v.1.7.5 (Drummond et al., 2012).
2.5 Demographic history
A coalescent-based simulation approach was implemented in Fastsimcoal2 (Excoffier et al., 2013) based on the site frequency spectrum (SFS) of nDNA data to further investigate the demographic history of the three main lineages identified in clustering analysis and species tree inference (Center, East and South, see results section). Initially, to further evaluate the consistency of phylogenetic relationships among C. cactorum populations inferred in SNAPP, models representing the three possible topologies (A, B and C) were considered in each one of the subsequent models of gene flow (Figure S1). For each topology, divergence times, contemporary and ancient effective population sizes were estimated, as well as alternative scenarios of gene flow. Models 1–3 considered no gene flow among lineages; models 4–6 contemplated scenarios of symmetric gene flow among lineages, while models 7–9 considered scenarios of asymmetric gene flow among lineages. For these analyses, 20 individuals were selected with the highest ancestry coefficient (>0.85) according to sNMF (e.g., Ortego et al., 2021). The folded joint SFS was calculated considering a single SNP per locus using the Python script written by Isaac Overcast and available at GitHub (https://github.com/isaacovercast/easySFS). To remove missing data and minimize errors with allele frequency estimates, each genetic cluster was downsampled to 16 individuals yielding a total of 2,565 variable sites. Assuming that invariable sites were not considered in the SFS calculation, we used the “removeZeroSFS” option in Fastsimcoal2 and fixed the effective population size of one of the demes (South lineage, NESOUTH = 824,626) to enable the estimation of other parameters with Fastsimcoal2. NESOUTH was calculated according to the equation NE = π/4μ (Lynch and Conery, 2003). Nucleotide diversity (π = 0.004) was estimated using variant and invariant sites with DNAsp v6 (Rozas et al., 2017). The mutation rate (μ) was considered to be 2.9 × 10⁻⁹ substitutions per site per generation, as previously estimated for the butterfly Heliconius melpomene (Keightley et al., 2015) (Lepidoptera: Nymphalidae). Each model was run with 50 replicates, considering 100,000–250,000 simulations for the calculation of the composite likelihood, 10–40 expectation–conditional maximization (ECM) cycles, and a stopping criterion of 0.001. Once maximum likelihood was estimated per run, the best demographic model was selected according to Akaike’s information criterion (AIC). AIC values were rescaled in terms of AIC differences (Δi) according to the formula: Δi = AICi − AICmin. A model with a ΔAIC value of 0 and the highest AIC weight (ωi) served as the best model. A parametric bootstrapping approach was used to construct 95% confidence intervals of the estimated parameters running 100 bootstrap replicates using initialized values from the best model (Excoffier et al., 2013).
2.6 Environmental niche modeling
An environmental niche modeling approach was implemented to predict contemporary and historical geographic distributions of suitable areas for the cactus moth in its native range. Environmental niche models (ENMs) were used to determine the impact of historical and contemporary components of landscape heterogeneity on C. cactorum diversification as is detailed below in the landscape genomic analysis section. ENMs were built using MaxEnt v.3.4.1 (Phillips et al., 2006) and the bioclimatic data available in CHELSA v.1.2 database (https://chelsa-climate.org/bioclim/). Model parameters in MaxEnt were selected and optimized using the kuenm (Cobos et al., 2019) R package. For both temporal bioclimatic conditions, present-day and Last Glacial Maximum (LGM, ca. 21 kya), we evaluated 15 environmental variables retrieved at 30 arc-sec (~1 km) of resolution. Four bioclimatic variables (Bio 8, 9, 18 and 19) were discarded for having artificial breaks (Oliveira et al., 2020). Highly correlated variables (R > 0.9) according to variance inflation factor criterion were excluded for downstream analyses resulting in a final dataset of six bioclimatic variables (Bio 2, 3, 5, 13, 14 and 15). Suitability maps during the LGM were obtained by projecting the present-day ENM onto LGM bioclimatic conditions derived from the Community Climate System Model (CCSM4; Braconnot et al., 2007) resulting in two suitability maps based on bioclimatic variables data (Set 1, ClimaticCURR and ClimaticLGM from hereafter).
Additionally, we constructed ENMs for five of the seven native host species of C. cactorum considering the aforementioned approach for variable selection and model building. ENM for O. penicilligera and O. bonaerensis could not be implemented due to limited occurrence data. The resulting ENMs obtained for current and LGM conditions from each host species were used as variables to build an additional ENM for C. cactorum (Set 2, HostCURR and HostLGM from hereafter). A third ENM was constructed for C. cactorum considering the input of both the bioclimatic variables (Set 1) and the host plant ENMs (Set 2) (Set 3; Climatic-HostCURR and Climatic-HostLGM from hereafter).
Occurrence data for the host species and C. cactorum were obtained from field surveys made from 2007 to 2019 and complemented, after detailed curation, with distribution information available at GBIF (www.gbif.org). Redundant occurrences (e.g. points occurring within 1,500 km2) were excluded using spThin (Aiello-Lammens et al., 2015) R package. After thinning occurrence data, 81 records for C. cactorum locations and their associated occurance of 205 host species remained [O. quimilo (50), O. megapotamica (47), O. rioplatense (39), O. elata (38), and O. anacantha (31)] and were used to conduct ENMs. Model performance for each scenario was evaluated independently based on statistical significance (Partial ROC), omission rates (OR), and the Akaike information criterion corrected for small sample sizes (AICc) using the kuenm (Cobos et al., 2019) R package.
2.7 Landscape genomic analyses
A landscape genomic approach was implemented to study potential factors that could explain patterns of genetic differentiation within C. cactorum. As a measure of genetic differentiation, pairwise FST estimates were derived from genome-wide SNP data using the Weir and Cockerham (1984) method with the StAMPP (Pembleton et al., 2013) R package and 9,999 bootstrap replicates. We evaluated several plausible scenarios of population connectivity based on historical and contemporary spatial and ecological data.
Isolation by resistance scenarios (IBR) were tested by calculating resistance surfaces based on the suitability maps obtained from ENMs for present-day and LGM conditions considering different subsets of factors: (i) only climatic variables (ClimaticCURR and ClimaticLGM); (ii) climate-based habitat suitability maps considering the host species distribution (HostCURR and HostLGM); and (iii) combining climatic variables and climate-based habitat suitability maps for host species distribution (Climatic-HostCURR and Climatic-HostLGM). Resistance distances for all pairs of populations were calculated using an eight-neighbor cell connection scheme in Circuitscape v.5 (Hall et al., 2021) through Julia v.1.5.2 (https://julialang.org/). We also calculated resistance distances based on a “flat landscape” where all cells have an equal resistance value (=1) representing a null model of isolation by resistance (IBRNULL).
An isolation by distance scenario was also evaluated using weighted topographic distances (IBDWTD), which incorporate an additional overland distance covered by an organism due to changes in elevation imposed by the topography. The IBDWTD distance matrix was calculated on a digital elevation model (DEM) at ~1 km of resolution retrieved from WorldClim v.2.1 (Fick and Hijmans, 2017) dataset using the TopoWeightedDist function implemented in the topoDistance (Fick and Hijmans, 2017; Wang, 2020) R package. We assumed a linear function to weight aspect changes (hFunction parameter) and an exponential function to weight the slope (vFunction parameter) (e.g. Noguerales et al., 2021).
Climatic dissimilarities were estimated between populations to evaluate an isolation by environment scenario (IBECLI). Environmental data was extracted from the 15 CHELSA bioclimatic variables for each of the 28 sampling sites, as well as from 500 random points covering our study area to avoid potential biases resulting from only considering conditions at focal sites. Due to collinearity among the bioclimatic variables, we ran a PCA using the ade4 R package and summarized the environmental variation in the three first axes accounting for ca. 82% (PC1 = 43.79%; PC2 = 23.96%; PC3 = 14.31%) of total variation. The environmental dissimilarity matrix was obtained by calculating the Euclidean distances for PC scores between pairs of sampling sites (Ortego et al., 2021).
To test the relative role of host use in population genetic structure in C. cactorum, a host plant distance matrix (IBH) was built considering the host species where moths were collected. We constructed a binary matrix coded with each host species per sampling site, and ran a PCA using the ade4 R package to build a distance matrix with total PCs variation. IBH was obtained by calculating the Euclidean distances for PC scores between pairs of sampling sites.
Relationships between explanatory distance matrices based on landscape heterogeneity (IBRs, IBDWTD, IBECLI), and the contemporary patterns of host use (IBH) with the genetic differentiation between C. cactorum populations (FST) were evaluated using univariate and multiple matrix regressions with randomization using the function MMRR (Wang, 2013) as implemented in R. An initial full model was constructed considering all significant explanatory terms identified previously in univariate analysis, and a final best-fit model was selected using a backward-stepwise procedure by progressively removing non significant variables until all retained terms within the model were significant (Wang, 2013; Ortego et al., 2014). The result was the minimal most adequate model for explaining the variability in the response variable, where only the significant explanatory terms were retained.
2.8 Population genetic diversity and climate/habitat stability
Given that suitable environments tend to support larger effective population sizes (Carnaval et al., 2009), we tested whether the regions exhibiting high genetic diversity were those where suitable climatic conditions remained stable through time, from the LGM to the present. To test this hypothesis, environmental stability maps were constructed by averaging current and LGM suitability maps following Soley-Guardia et al. (2019). For each sampling site, values of climate/habitat stability were extracted for each of the three scenarios considering (i) only climatic variables (StabilityENV), (ii) climate-based habitat suitability maps for host species (StabilityHOST), and (iii) combining climatic variables and climate-based habitat suitability maps for host species (StabilityENV-HOST). Raster calculations were conducted using the raster R package.
Nuclear and mitochondrial diversity were characterized for each of the 28 sampling sites. Genetic diversity estimates were normalized to three individuals per sampling location to avoid potential bias resulting from uneven population sample size (range: 3–11 individuals). For nDNA, expected heterozygosities (HE) and nucleotide diversity (π) were calculated using the diveRsity (Keenan et al., 2013) R package, and DNAsp v6 (Rozas et al., 2017), respectively. We also estimated π and haplotype diversity (Hd) for mtDNA data using DNAsp. Correlations between stability values and estimates of nuclear (HE, π) and mtDNA (HD, π) population genetic diversity were tested using linear regressions. Longitude and latitude were also included as explanatory factors to account for potential geographical clines of genetic diversity (Guo, 2012).
3 Results
3.1 Genomic data
We successfully genotyped 138 individuals of C. cactorum using ddRAD sequencing which are representative of populations feeding on both exotic O. ficus-indica (71 individuals), and native host plants O. megapotamica (34), O. rioplatense (11), O. elata (10), O. bonaerensis (4), O. penicilligera (3), O. quimilo (3), and O. anacantha (2) along three biogeographic regions. After filtering steps, the average number of paired-end reads retained per individual was 1,859,116, of which an average of 1,253,277 reads mapped to the C. cactorum reference genome. After discarding loci in linkage disequilibrium and under selection, we recovered a total of 3,506 biallelic SNPs with an average coverage of 30× (Table S2). A total of 143 individuals from the same 28 locations were successfully sequenced for a fragment of 790 bp of the COI gene. The analysis of mtDNA data revealed 66 haplotypes, 171 variable sites, 97 of which were parsimony-informative sample-wide.
3.2 Assessing population genomic structure
Clustering analysis with sNMF indicated K = 6 as the most likely number of genetic clusters. While all genetic groups were spatially structured (North, Central, Western, Southeast, Southwest and East), no genetic structure based on host plants was observed. Population genetic structure analyses also revealed a certain degree of admixture among geographic groups; some Northern and Central individuals exhibited a relatively high degree of admixture with both the Western and Eastern clusters (Figures 2A–C). Interestingly, Northern, Central and Western populations appeared to form a unique cluster (Central lineage from hereafter) when assuming K = 3, whereas both Southern (South lineage from hereafter) and Eastern (East lineage from hereafter) populations remained as separated panmictic groups. With K = 4, the Southern population appeared subdivided into two geographic units; Southeastern and Southwestern. Finally, with K = 5, Northern populations appeared separated from the Central ones (Figure S2). In the PCA the Eastern lineage appears separated from the Central and South lineages along PC1, whereas the South lineage can be distinguished from the Central lineage along PC2 (Figure 2D).
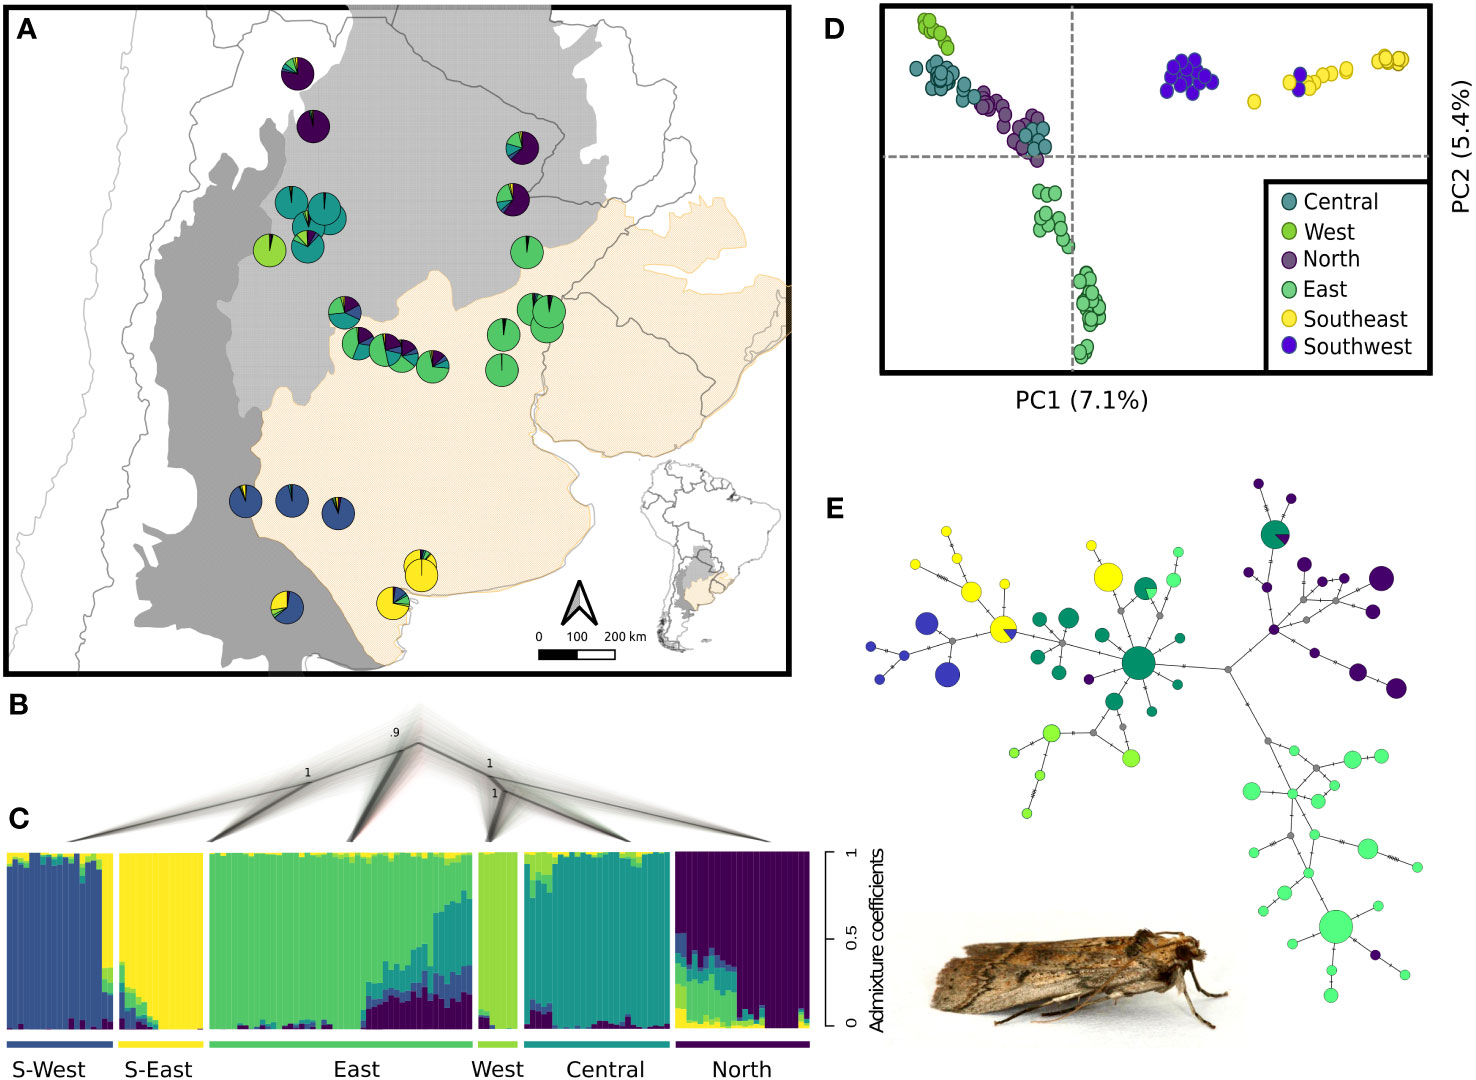
Figure 2 Population genetic structure and phylogenetic relationships of the C. cactorum populations. (A) Pie charts represent the average ancestry coefficient of individuals belonging to each of 28 sampling sites distributed along three biogeographic regions. (B) Species tree reconstructed by SNAPP; numbers in nodes denote posterior probability. (C) Results of individual assignment in genetic clusters using sNMF. Vertical bars represent the ancestry coefficient of each individual to the corresponding genetic cluster. (D) PCA using the two major axes of genomic variation. (E) Median-joining network obtained with mtDNA data. Image shows an adult male of C. cactorum..
The median-joining network obtained with mtDNA sequence data revealed strong spatial genetic structure consistent with the clusters identified with nDNA data (Figure 2E). The Central haplogroup identified with a star-like pattern had one of the most frequent haplotypes and was separated by seven mutational steps from the Eastern haplogroup, whereas at least four mutational steps separated the Central and Northern haplogroups. Western, southeastern and Southwestern haplogroups appeared close to the Central haplogroup separated by few mutational steps (Figure 2E).
3.3 Species tree reconstruction
Phylogenetic relationships inferred with SNAPP were consistent with the hierarchical spatial genetic structure observed with sNMF (Figures 2B, C; Figure S2). The most ancestral split corresponded to the separation of South and East lineages from the Central lineage. Southwestern and Southeastern clusters, as well as West, Central and North clusters diverged subsequently from their respective lineages, as observed in clustering analyses.
3.4 Demographic inference using coalescent-based simulations
The scenario considering full asymmetric interlineage gene flow (model 8) was the most supported among the nine demographic models tested with Fastsimcoal2 (Table S3). Under this model, divergence among the three main lineages of C. cactorum was estimated to have occurred during the Late Pleistocene (Figure 3; Table 1). Specifically, this model involves an initial split (TDIV1) of the Central lineage ~75 kya (considering two generations per year in native host species, as reported by Varone et al., 2014), and a more recent split (TDIV2) separating the South and East lineages occurring ~19 kya. Demographic simulations estimated an effective population size close to 250,000 for the Central lineage (NECENTER), which was six times higher than the value obtained for the East lineage (NEEAST = 41,551). Estimates of gene flow rates varied among lineages with the highest rate of contemporary gene flow estimated to occur from the Central to the East lineage (MCE = 1.50 × 10⁻⁵ migration rate by generation) and the lowest from the Central lineage to the South lineages (MCS = 2.71 × 10⁻⁸ migration rate by generation) (Table 1).
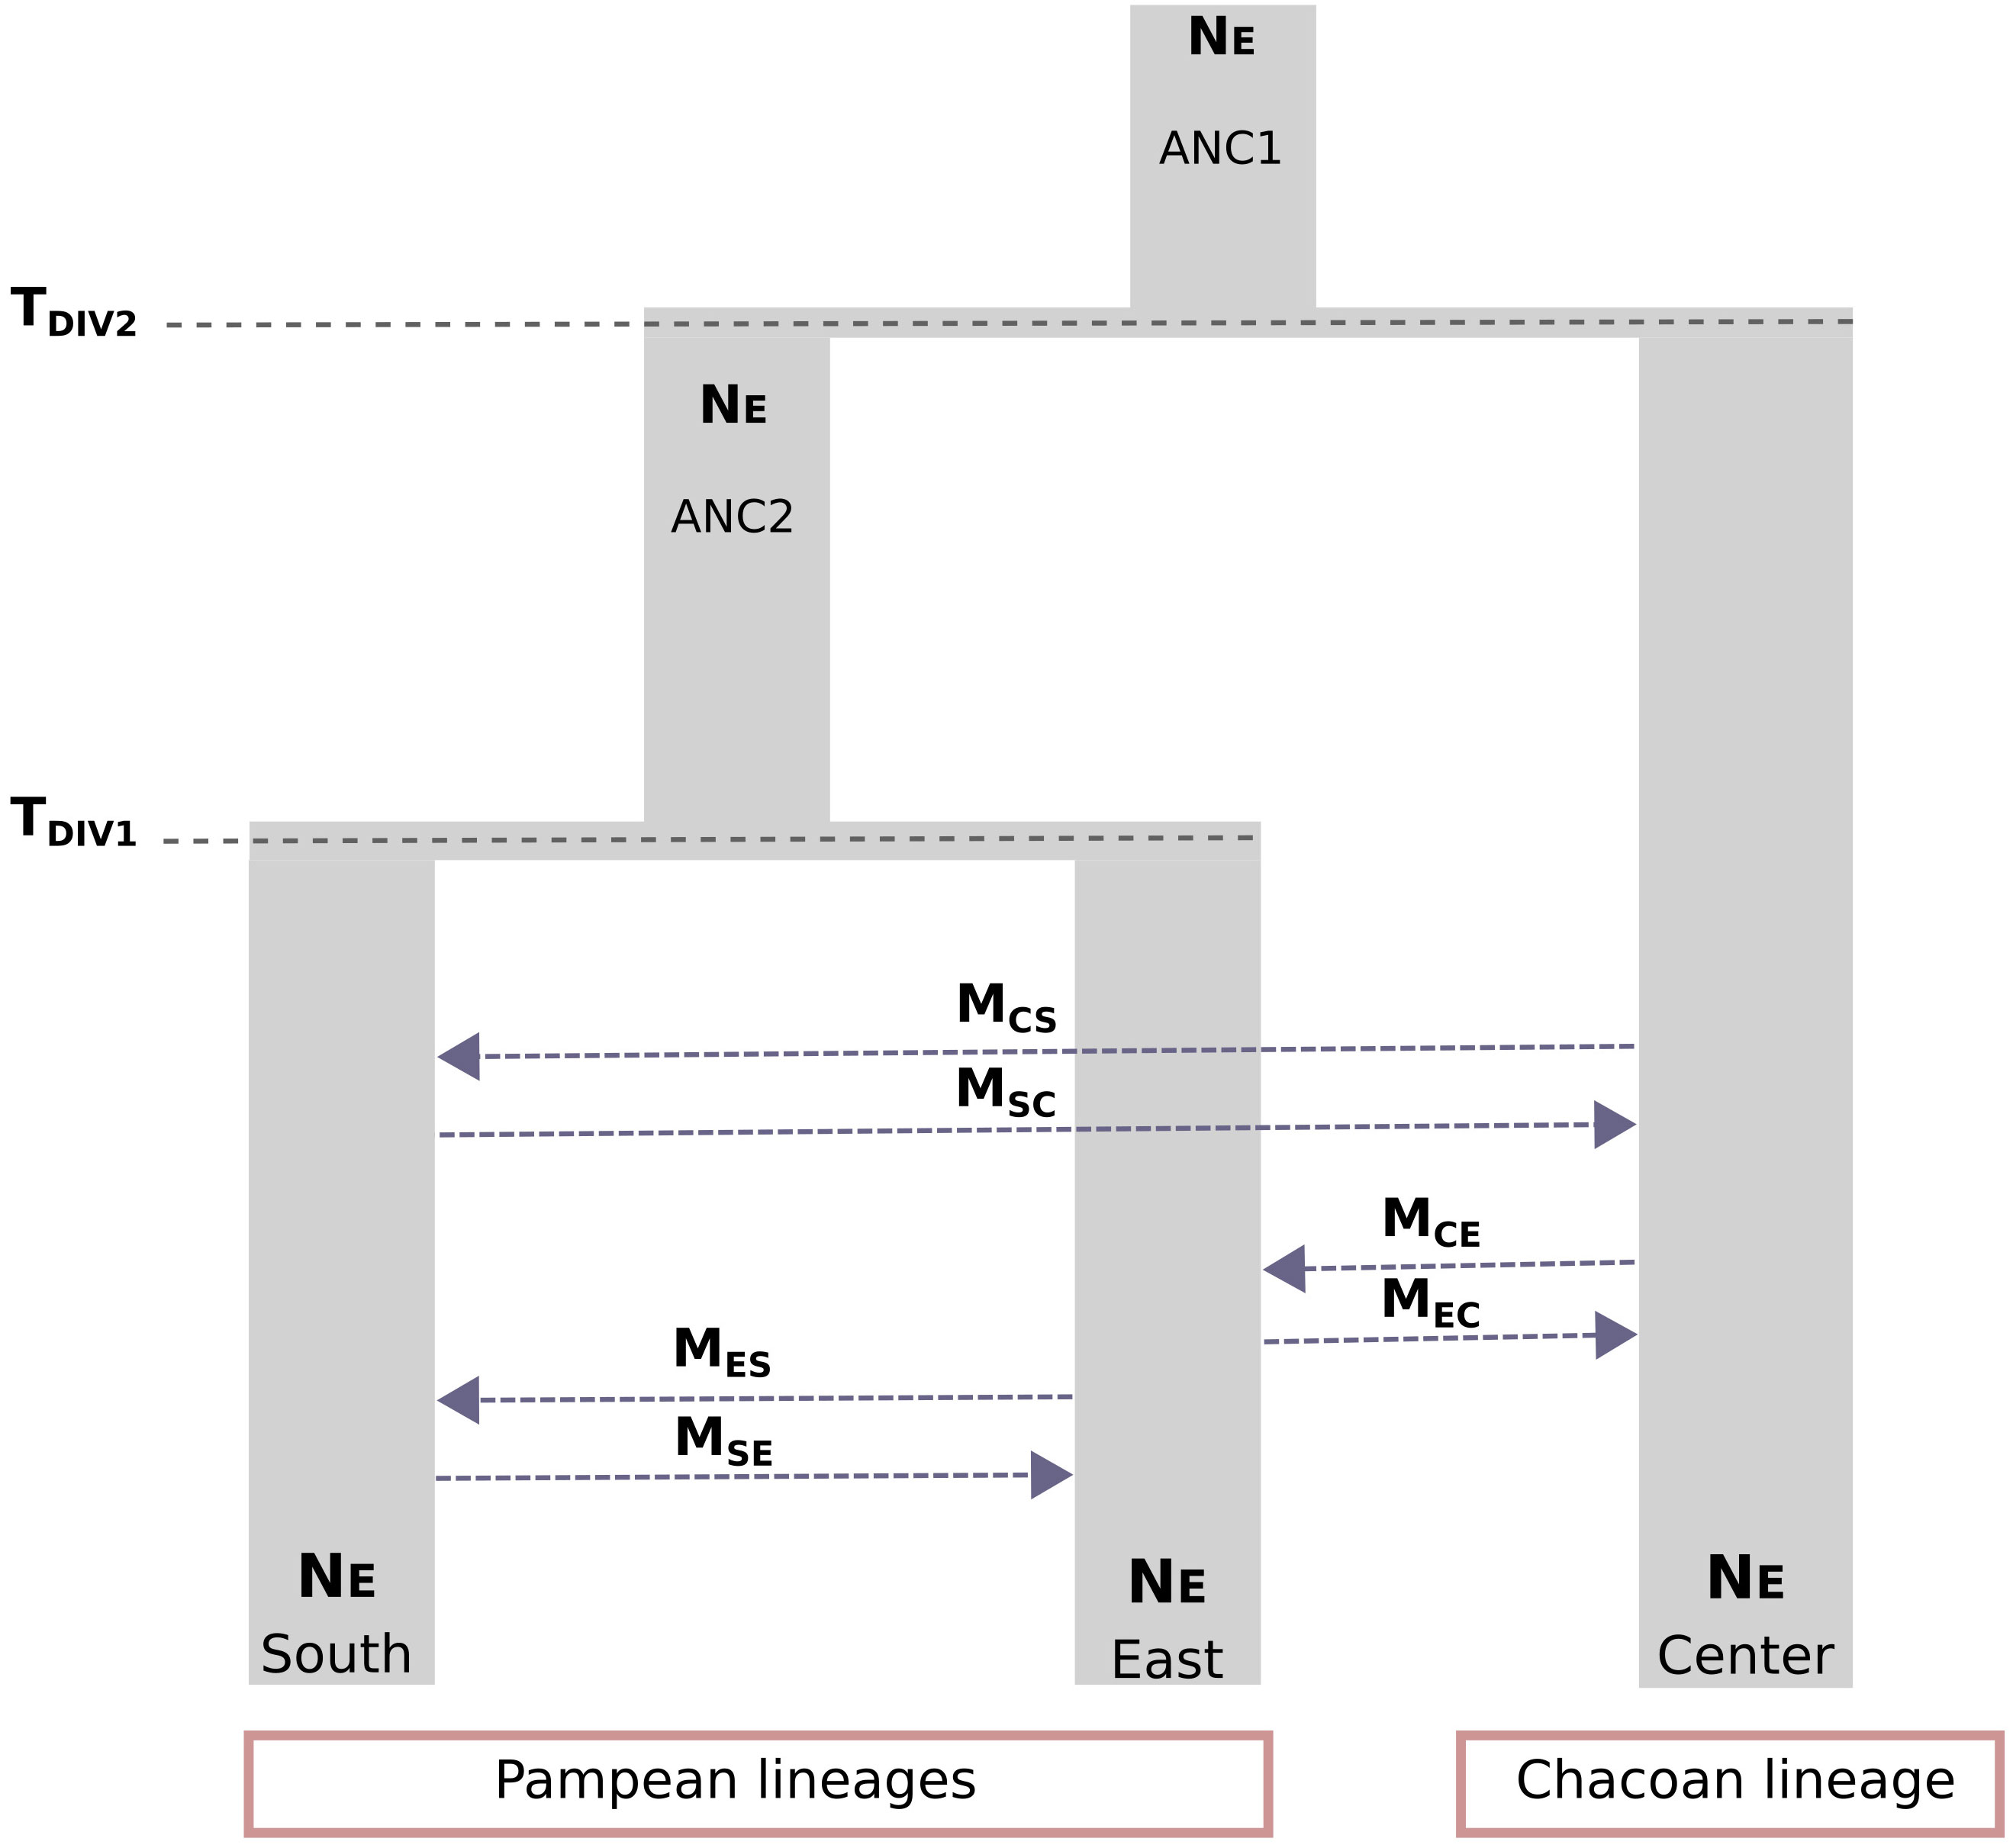
Figure 3 Visual representation of the most supported demographic model (Model 8) estimated using Fastsimcoal2. Parameter estimates included timing of population divergence (TDIV1 and TDIV2), historical and contemporary effective population sizes (NEANC1 and NEANC2), and asymmetric rates of gene flow (MSC, MCS; MES, MSE; MCE, and MEC).
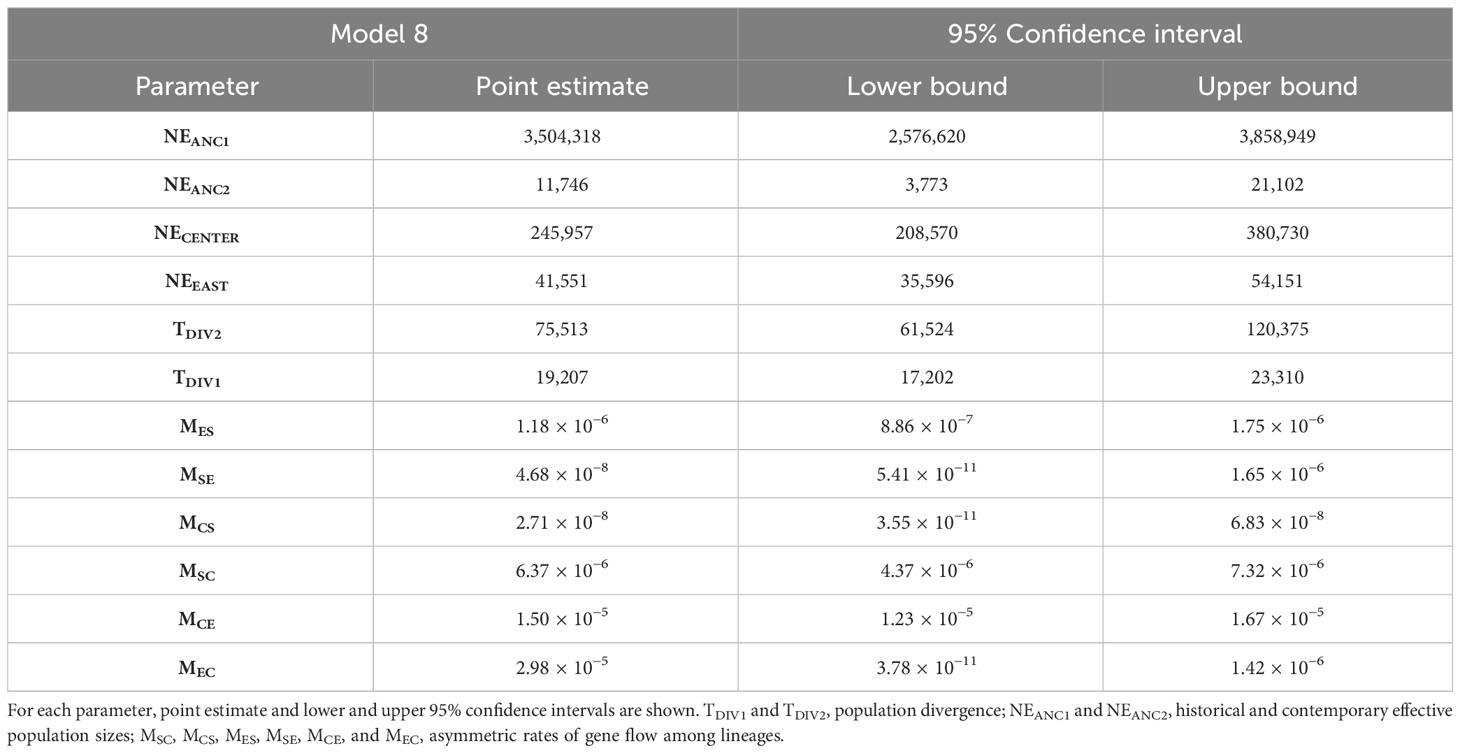
Table 1 Parameters inferred from coalescent simulations with Fastsimcoal2 under the best-supported demographic model (Model 8; Figure 3).
3.5 Ecological niche modeling through time
Ecological niche models (ENMs) for the focal species (C. cactorum) and host species exhibited an overall good performance as suggested by the relatively high AUC scores (Tables S4, S5). Suitability maps for host species were concordant with their respective current distributions (Figure S3). Among host species, the areas of higher suitability for Opuntia megapotamica were predicted in central and southern Argentina; for O. elata in central-eastern, and for O. rioplatense in eastern Argentina (in the area of influence of the Paraná-La Plata river basin). Opuntia anacantha and O. quimilo have more restricted suitability areas in northwestern and central Argentina, respectively. Projections during the LGM indicated changes in host distribution (Figure S3) that suggest an increased habitat suitability for almost all host plants, except for O. anacantha whose suitability areas have been restricted to the central-eastern region during the LGM. Instead, habitat suitability for O. megapotamica and O. elata appears extended into the northern region, whereas the projections indicate an extended distribution in central Argentina for O. quimilo. Finally, suitable habitats for O. rioplatense extended to northern and central Argentina.
Models for C. cactorum (Set 1: ClimaticCURR, Set 2: HostCURR, Set 3: Climatic-HostCURR) indicated similar predicted distributions (Figure S4). However, the most supported model for C. cactorum according to AIC values was one that considered as input variables the predicted distribution of the host plants (HostCURR). Additional information on the results of ENMs for both C. cactorum and host species are detailed in Tables S4, S5. The present-day distribution inferred by the most supported scenario (HostCURR) was in line with the contemporary range of the moth. Under this model, higher suitability areas were predicted in both Chaco and north of Pampa biogeographic regions whereas areas of lower suitability were predicted in the southern portions of the Pampas and the Monte biogeographic regions (Figure 1B). Other biogeographic provinces (Yungas, Puna and Prepuna) had extremely low suitability values for C. cactorum. Projections of ENM to LGM predicted high environmental suitability along the Chaco biogeographic province to the most southern portion of Pampas, with areas of low suitability located in eastern Argentina, a confluence zone of La Plata river basin (Figure 1C).
3.6 Landscape genomic analyses
Estimates of genetic differentiation (FST) among sampling sites ranged from 0.023 to 0.448 for nDNA data (Table S6). Univariate matrix regressions indicated that nuclear genetic differentiation was significantly correlated with all distance matrices except with the current pattern of host plant use (IBH) consistent with clustering analysis, and both explanatory terms of landscape heterogeneity: ClimaticCURR and Climatic-HostCURR (Table S7). Yet, only Climatic-HostLGM was significantly retained in the best-fit model in the backward-stepwise procedure (Table 2).
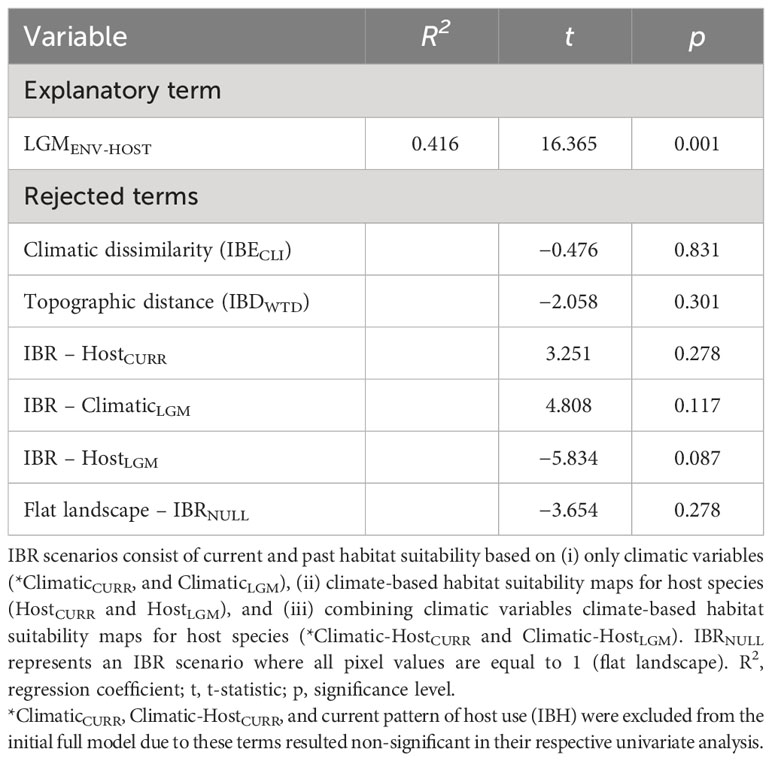
Table 2 Results of multiple matrix regression with randomization (MMRR) testing for the relationships between population genetic differentiation (FST) and explanatory variables representing weighted topographic distance (isolation by distance, IBDWTD), climatic dissimilarity (isolation by environment, IBECLI), host plant distance (*IBH), and alternative isolation by resistance (IBR) scenarios.
3.7 Population genetic diversity and climate/habitat stability
We found higher nuclear and mitochondrial diversity in Northern, Central and Eastern populations, than in Southern populations (Figure 4; Table S8). Linear regression analyses revealed that nuclear genetic diversity was significantly correlated with latitude but not with longitude (Table 3). Likewise, estimates of nuclear genetic diversity for both HE and π were positively correlated with the three environmental stability estimates (StabilityENV, StabilityHOST and StabilityENV-HOST) for the LGM (~21 Kya) to the present. Conversely, mitochondrial genetic diversity estimated with HD and π were not correlated with geographic variables nor environmental stability (Table 3; Figure 4).
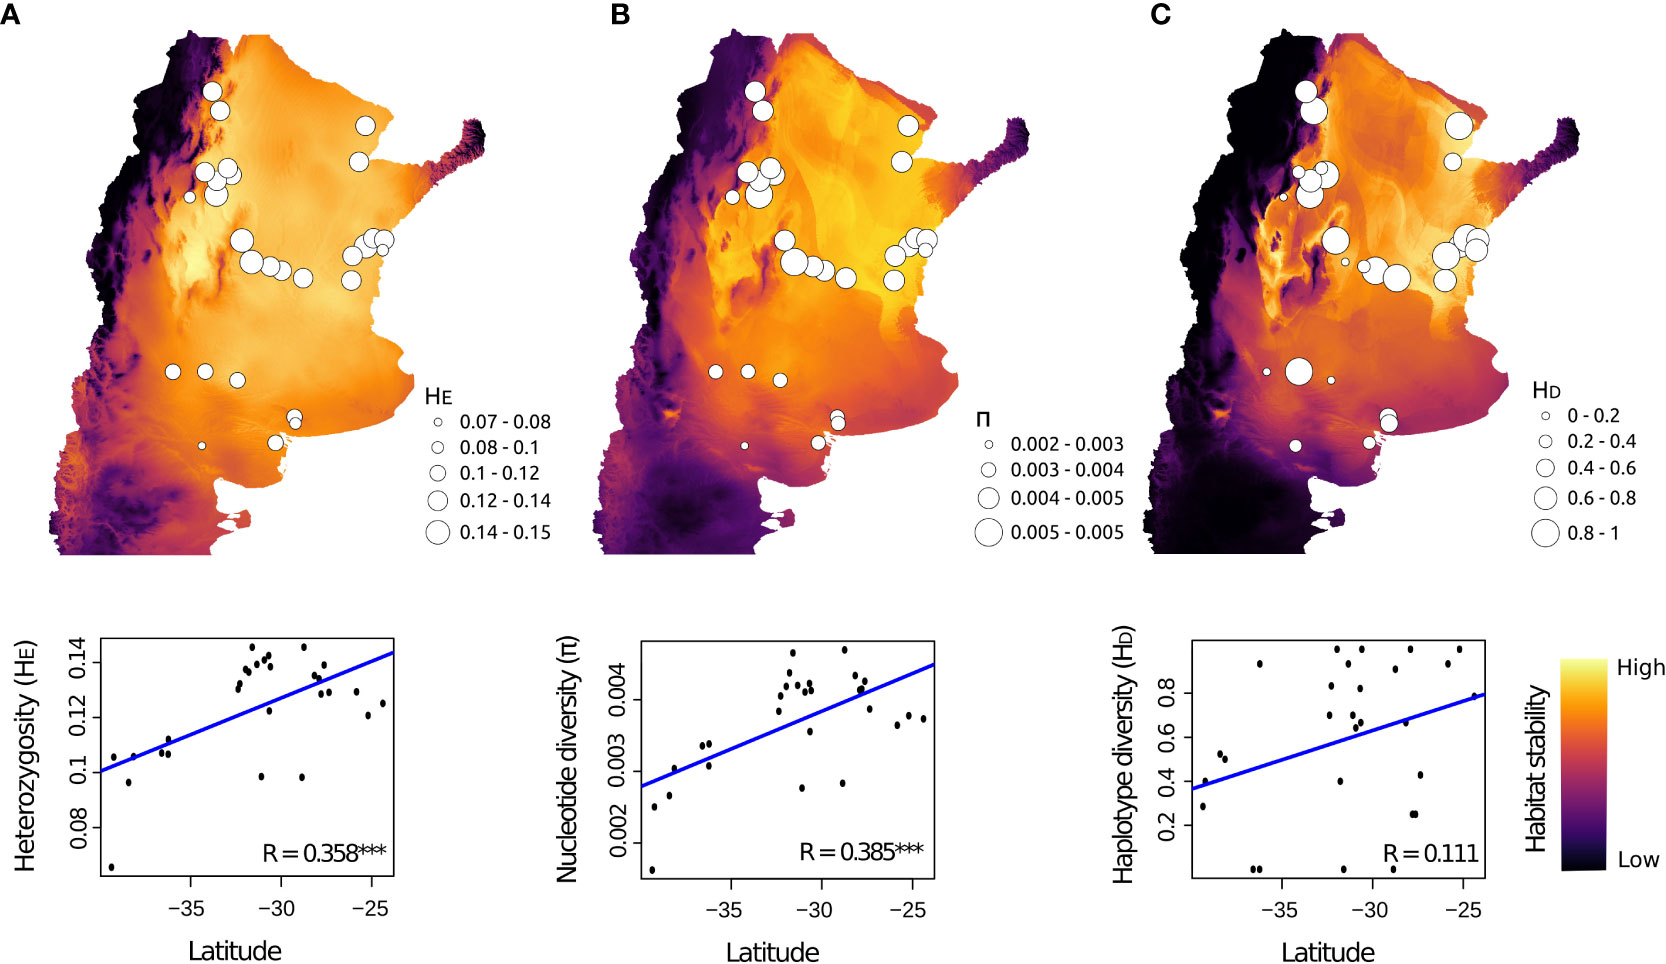
Figure 4 Spatial pattern of population genetic diversity for Cactoblastis cactorum. The map shows the projection of climatic and habitat stability through time, from LGM to the present, for the three ENM models based on (A) only climatic variables (StabilityENV), (B) climate-based habitat suitability maps for host species (StabilityHOST), and (C) combining climatic variables climate-based habitat suitability maps for host species (StabilityENV-HOST). Circle sizes denote varying levels of population genetic diversity as indicated by nuclear (A) HE, expected heterozygosity; (B) π, nucleotide diversity; and mitochondrial (C) HD, haplotype diversity. Bottom panels show the significantly positive relationships between a given genetic diversity index and latitude. *** p-value < 0.001.
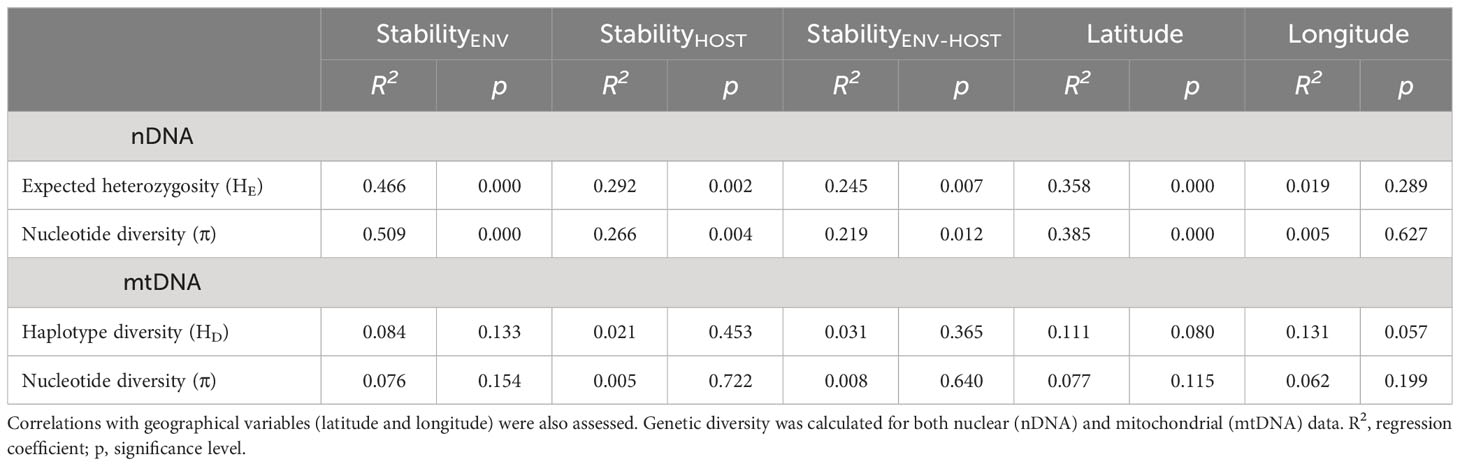
Table 3 Results of linear regressions testing for the relationships between population genetic diversity, and habitat stability models during the last 21,000 years, according to ENMs based on (i) only climatic variables (StabilityENV), (ii) climate-based habitat suitability maps for host species (StabilityHOST), and (iii) combining climatic variables with climate-based habitat suitability maps for host species (StabilityENV-HOST).
4 Discussion
Nuclear SNPs and mtDNA data revealed significant population structure in C. cactorum. Landscape genomic analyses provided support for the hypothesis that habitat connectivity based on a combination of climatic conditions and habitat suitability, influenced by shifts in host species distributions during LGM, was the main factor shaping population genetic structure. Although patterns of host species use appeared to be non influential on C. cactorum diversification, shifts in the distribution of Opuntia hosts, mediated by climatic changes during the Quaternary, had a direct influence on the distribution and genomic variation of the focal species. Such shifts in host distributions may have generated fragmented ranges that led to reductions of gene flow among moth populations, promoting genetic differentiation. Our results also supported the habitat stability hypothesis, whereby populations inhabiting regions of greater habitat suitability during the last 21,000 years harbored more genetic diversity than those that persisted in areas of lower habitat stability. The hypothesis that the geographically widespread cultivation of O. ficus-indica facilitated contemporary gene flow among otherwise geographically distant populations can be rejected, on the basis of the results of population genomic analyses revealing limited genetic admixture and a hierarchical pattern of population differentiation mainly concordant with geography.
4.1 Effects of Quaternary landscape composition on populations differentiation
Genetic clustering analyses revealed three major lineages defined by geography: Central, East and South (Figures 2 and 3). Coalescent-based demographic modeling suggested that these lineages began to diverge during the Late Quaternary, approximately 75 kya. The earliest split involved populations of the Chacoan biogeographic domain (hereafter “Chaco”), including populations from North, West and Central Argentina, from the Pampean biogeographic region (hereafter “Pampa”) that includes the South and East lineages (Figures 1, 2). Prior to this split, the regional contraction of subtropical and tropical biomes made the Chaco and the Pampa biomes more alike (Ortiz-Jaureguizar and Cladera, 2006). Subsequently, during the Quaternary, major climatic shifts took place in the area, leading to the isolation of the Chacoan xeric woodlands from the typical grasslands of the Pampean region. Such climatic changes were promoted by the topographic reconfiguration of Andean and sub-Andean Piedmont and the uplift of the eastern orographic systems (known as the Sierras Pampeanas) associated with the Peripampasic orogenic arc (Ortiz-Jaureguizar and Cladera, 2006; Speranza et al., 2007; Calatayud-Mascarell et al., 2022). These events produced a rain-shadow effect that resulted in the extreme xeric conditions that prevailed in this area. Climate changes during the Quaternary, which included cold, dry glacial cycles alternating with warm, moist interglacial periods, affected these regions causing the expansion and contraction of open woodlands and grasslands (Ortiz-Jaureguizar and Cladera, 2006). This dynamic likely promoted changes in floristic composition of such regions, affecting the distributions of host species and consequent habitat suitability for C. cactorum, promoting the divergence between the Central lineage (Chaco) and East, South lineages (Pampean) (Figures 2, 3).
The split between East and South lineages was estimated to have occurred approximately 19 kya. Regional climate models suggest that this timing is coincident with an increase in precipitation along the eastern foothills of the Andes (Cook and Vizy, 2006; Ortiz-Jaureguizar and Cladera, 2006). These topographical features together with Quaternary climatic dynamics in the region maintained a fragmented distribution of C. cactorum host species from the Pampa (Mourelle and Ezcurra, 1997). This likely limited dispersal of C. cactorum, restricting the East lineage to the more humid environments with deep fertile soils typical of the Pampa, and the South lineage to the drier grasslands of the northern border of the Patagonian steppe, both regions with diverse patterns of host species composition (Varone et al., 2014).
Climatic changes during the Quaternary also promoted complex phylogeographic patterns in others southern South American herbivorous insects, such as the grasshopper Dichroplus vittatus Bruner (Rosetti et al., 2022) and the beetle Naupactus cervinus Boheman (Rodriguero et al., 2016). Such phylogeographic patterns would also be a direct consequence of changes in habitat and host plant distributions during the Quaternary. Moreover, similar phylogeographic consequences of climate change over the last 21,000 years have been recently documented in Opuntia bonaerensis, one of the hosts of C. cactorum (Köhler et al., 2020). Such concordance in the timing of intraspecific diversification within O. bonaerensis and C. cactorum is strongly suggestive of a fundamental role of Quaternary climate on the evolutionary history of the cactus-moth system.
Intraspecific genetic differentiation in C. cactorum and its close relatives C. doddi and C. bucyrus also dates back to the late Quaternary (Poveda-Martínez et al., 2022). Diversification within C. bucyrus, a specialist on the columnar cactus Trichocereus atacamensis, is estimated to have initiated during the Marine Isotopic Stage 3 (~42 kya), an interstadial during the last glacial period. Divergence in C. doddi, which feeds upon Opuntia sulphurea, is estimated to have occurred very close to the end of the Pleistocene (~19 kya), coincident with estimates for the split between East and South lineages of C. cactorum.
Maps of environmental suitability estimated using ecological modeling suggested that the Chaco and northern Pampean regions harbored larger climatically suitable areas than other biogeographic regions such as the Yungas, Monte, Puna and Prepuna (Figure 1). Both C. doddi and C. bucyrus are found in the Prepuna and Monte regions where C. cactorum is absent, supporting the idea that disparate environmental/habitat conditions and disjunct host plant distributions played a role in divergence within C. cactorum and closely related species (Poveda-Martínez et al., 2022). Overall, these findings suggest that intraspecific diversification within this group of closely related herbivorous insects have been strongly influenced by shifts in the distribution of host species in response to Quaternary climate dynamics.
4.2 Landscape genomic analysis
In agreement with inferences of divergence times among the three major lineages inferred using coalescent-based demographic modeling, landscape genomic analyses revealed that the spatial pattern of population genetic differentiation can be mainly explained by a Quaternary landscape scenario that takes into account the distribution of climatically suitable habitats and predicted ranges of host species during the LGM (Figures 1–3). The resistance map defined by habitat connectivity based on historical host distribution provided the best fit to genetic data, with no significant additional effects of topography, current environmental suitability or environmental dissimilarity (Table 2). The influence of historical landscape composition on contemporary patterns of genomic variation is illustrated by the fact that weakly differentiated populations had high habitat connectivity in LGM projections. This is the case of JUJ (northwestern) and FOG (northeastern) populations (FST = 0.088; Table S6), currently separated by 740 km but with high past habitat connectivity according to suitability maps. In contrast, a discontinuous habitat is expected to promote isolation and, thus, genetic differentiation even between geographically close populations. This would be particularly true for C. cactorum, given the limited dispersal ability in a species with a short-lived adult stage (Zimmerman et al., 2000), and illustrated by the southern populations LPS (southwestern) and BAP (southeastern) which exhibit one of the highest FST values (FST = 0.389), despite the relatively shorter geographic distance of approximately 290 km. Projections during LGM suggest that dispersal, and consequently gene flow, between LPS and BAP was likely limited by low environmental suitability during glacial periods. Thus, our results suggest that environmental tolerance along with limited dispersal interacting with landscape features are responsible for current patterns of population genetic structure in the cactus moth (e.g. Broquet and Petit, 2009; Sherpa et al., 2020).
Despite signatures for shifts in host species distributions, which may have influenced contemporary population genetic structure in C. cactorum, patterns of host use did not appear to be a determinant factor. This finding is consistent with the idea that the use of alternative hosts in this specialist herbivorous moth does not promote divergence, likely due to relatively low fitness variation across the narrow array of hosts (Vidal and Murphy, 2018; Vidal et al., 2019). This is in line with field and laboratory studies showing that host use was proportional to the abundance of hosts in locations where more than one potential host coexist (Varone et al., 2014). Moreover, multiple choice experiments revealed that C. cactorum females do not exhibit oviposition preference for any Opuntia species. Altogether these results indicate that host use is not an important selective agent in C. cactorum, consistent with evidence in other herbivorous insects (Vidal and Murphy, 2018; Vidal et al., 2019; Tishechkin, 2020).
4.3 Climatic stability and patterns of genomic diversity
Regression analyses revealed that population genetic diversity was significantly correlated with habitat stability. The Chaco region, representing the northernmost distribution limit of C. cactorum, is an open vegetation biome characterized by high endemicity and diversity for both plants and animal species (Werneck, 2011; Brusquetti et al., 2019; Bonatelli et al., 2022). Analyses of environmental habitat suitability between the present and the LGM revealed relative habitat stability within the Chaco (Figure 4). Consistent with this, nuclear genetic diversity in C. cactorum was higher in the Chaco as compared to southern regions, supporting the hypothesis that areas characterized by a high climate stability over the last glacial and interglacial periods tend to accumulate and harbor more genetic diversity (Carnaval et al., 2009; Hewitt, 2011; Barros et al., 2015; Rocha et al., 2020). The greater effective population size estimated for the Central lineage, as estimated by coalescent demographic modeling, is in line with the existence of Pleistocene refugia in Chaco. This region also contains a larger number of Opuntia species than any other region in the sampled area (Varone et al., 2014). Such host plant availability together with long-term habitat stability has likely benefited the persistence of relatively large C. cactorum populations in this region.
4.4 Effect of the prickly pear on contemporary gene flow of the cactus pest
Overall, our results argue against the idea that the human-driven introduction and intensive cultivation of O. ficus-indica enabled the rapid expansion of C. cactorum, promoting contemporary gene flow among geographically distant populations. Population genetic analyses yielded evidence for gene flow between diverging Chacoan and North Pampean lineages but not for current gene flow among distant populations feeding on O. ficus-indica and/or alternative native hosts. In fact, we detected nuclear admixture and sharing of mtDNA haplotypes across populations located along the contact area between northern Pampa and Chaco (Figure 2). This area is coincident with a transition between Chaco and Pampa regions, referred to as the Espinal (Bucher, 1982). Historical secondary contact among previously isolated Central and East lineages, prompted by post glacial host range expansions, provides a plausible explanation for the observed pattern of genetic admixture. Evidence for admixture was also detected between populations of East and South lineages, both distributed within the Pampean and Monte regions. This area has been reported as a landscape corridor facilitating connectivity between previously separated populations of the grasshopper D. vittatus inhabiting grassland and savanna biomes (Rosetti et al., 2022), and the southern leaf-cutting black ant (Sánchez-Restrepo et al., 2023). In this respect, our results emphasize the extensive habitat connectivity between these regions during the Quaternary, but not as a product of growing prickly pear agroindustry in the study area.
Data availability statement
The original contributions presented in the study are publicly available. This data can be found here: Figshare, https://doi.org/10.6084/m9.figshare.18270866.v1.
Ethics statement
The manuscript presents research on animals that do not require ethical approval for their study.
Author contributions
DP-M: Conceptualization, Data curation, Formal Analysis, Investigation, Methodology, Validation, Writing – original draft, Writing – review & editing. VN: Investigation, Methodology, Writing – original draft, Writing – review & editing, Conceptualization, Supervision. SH: Funding acquisition, Project administration, Resources, Supervision, Writing – review & editing. GL: Conceptualization, Funding acquisition, Project administration, Resources, Supervision, Writing – review & editing. BE: Conceptualization, Supervision, Validation, Writing – review & editing. LV: Conceptualization, Funding acquisition, Investigation, Project administration, Resources, Supervision, Validation, Writing – review & editing, Data curation, Writing – original draft. EH: Conceptualization, Investigation, Methodology, Project administration, Supervision, Validation, Writing – original draft, Writing – review & editing.
Funding
Funding was obtained from FONCyT through grant PICT1447/2016 and USDA APHIS-PPQ, Farm Bill 10201.
Acknowledgments
We are grateful to the Associate Editor and two reviewers for suggestions that helped to improve previous versions of this paper. We would like to thank Mariel Guala and Malena Fuentes Corona for fieldwork support. We are also grateful to the Centro de Cómputo de Alto Rendimiento (CeCAR) and Biocódices S.A. for granting use of computational resources. DP-M is the recipient of a postdoctoral scholarship awarded by CONICET. VN was supported by a Juan de la Cierva-Formación postdoctoral fellowship (grant FJC2018-035611-I) funded by MCIN/AEI/10.13039/501100011033. LV and EH are members of Carrera del Investigador CONICET.
Conflict of interest
The authors declare that the research was conducted in the absence of any commercial or financial relationships that could be construed as a potential conflict of interest.
Publisher’s note
All claims expressed in this article are solely those of the authors and do not necessarily represent those of their affiliated organizations, or those of the publisher, the editors and the reviewers. Any product that may be evaluated in this article, or claim that may be made by its manufacturer, is not guaranteed or endorsed by the publisher.
Supplementary material
The Supplementary Material for this article can be found online at: https://www.frontiersin.org/articles/10.3389/fevo.2023.1260857/full#supplementary-material
References
Aiello-Lammens M. E., Boria R. A., Radosavljevic A., Vilela B., Anderson R. P. (2015). spThin: an R package for spatial thinning of species occurrence records for use in ecological niche models. Ecography 38 (5), 541–545. doi: 10.1111/ecog.01132
Bandelt H. J., Forster P., Röhl A. (1999). Median-joining networks for inferring intraspecific phylogenies. Mol. Biol. Evol. 16 (1), 37–48. doi: 10.1093/oxfordjournals.molbev.a026036
Barros M. J., Silva-Arias G. A., Fregonezi J. N., Turchetto-Zolet A. C., Iganci J. R., Diniz-Filho J. A. F., et al. (2015). Environmental drivers of diversity in Subtropical Highland Grasslands. Perspect. Plant Ecology Evol. Systematics 17 (5), 360–368. doi: 10.1016/j.ppees.2015.08.001
Bonatelli I. A., Gehara M., Carstens B. C., Colli G. R., Moraes E. M. (2022). Comparative and predictive phylogeography in the South American diagonal of open formations: Unravelling the biological and environmental influences on multitaxon demography. Mol. Ecol. 31 (1), 331–342. doi: 10.1111/mec.16210
Borer M., Arrigo N., Buerki S., Naisbit R. E., Alvarez N. (2012). Climate oscillations and species interactions: large-scale congruence but regional differences in the phylogeographic structures of an alpine plant and its monophagous insect. J. Biogeogr. 39 (8), 1487–1498. doi: 10.1111/j.1365-2699.2012.02703.x
Bouckaert R. R. (2010). DensiTree: making sense of sets of phylogenetic trees. Bioinformatics 26 (10), 1372–1373.
Bouckaert R., Heled J., Kühnert D., Vaughan T., Wu C. H., Xie D., et al. (2014). BEAST 2: a software platform for Bayesian evolutionary analysis. PloS Comput. Biol. 10 (4), e1003537. doi: 10.1371/journal.pcbi.1003537
Braconnot P., Otto-Bliesner B., Harrison S., Joussaume S., Peterchmitt J. Y., Abe-Ouchi A., et al. (2007). Results of PMIP2 coupled simulations of the Mid-Holocene and Last Glacial Maximum–Part 1: experiments and large-scale features. Climate Past 3 (2), 261–277. doi: 10.5194/cp-3-261-2007
Brooks C. P., Ervin G. N., Varone L., Logarzo G. A. (2012). Native ecotypic variation and the role of host identity in the spread of an invasive herbivore, Cactoblastis cactorum. Ecology 93 (2), 402–410. doi: 10.1890/11-0541.1
Broquet T., Petit E. J. (2009). Molecular estimation of dispersal for ecology and population genetics. Annu. Rev. Ecology Evolution Systematics 40, 193–216. doi: 10.1146/annurev.ecolsys.110308.120324
Brusquetti F., Netto F., Baldo D., Haddad C. F. (2019). The influence of Pleistocene glaciations on Chacoan fauna: genetic structure and historical demography of an endemic frog of the South American Gran Chaco. Biol. J. Linn. Soc. 126 (3), 404–416. doi: 10.1093/biolinnean/bly203
Bryant D., Bouckaert R., Felsenstein J., Rosenberg N. A., RoyChoudhury A. (2012). Inferring species trees directly from biallelic genetic markers: bypassing gene trees in a full coalescent analysis. Mol. Biol. Evol. 29 (8), 1917–1932. doi: 10.1093/molbev/mss086
Bucher E. H. (1982). “Chaco and Caatinga—South American arid savannas, woodlands and thickets,” in Ecology of tropical savannas (Berlin, Heidelberg: Springer), 48–79).
Calatayud-Mascarell A., Ferretti N., Enguídanos A., Arnedo M. A. (2022). Same place, different stories: Disparate evolutionary trends of mygalomorph spiders from the Peripampasic orogenic arc. J. Biogeogr. 49 (7), 1234–1247. doi: 10.1111/jbi.14374
Carnaval A. C., Hickerson M. J., Haddad C. F., Rodrigues M. T., Moritz C. (2009). Stability predicts genetic diversity in the Brazilian Atlantic forest hotspot. Science 323 (5915), 785–789. doi: 10.1126/science.1166955
Cobos M. E., Peterson A. T., Barve N., Osorio-Olvera L. (2019). kuenm: an R package for detailed development of ecological niche models using Maxent. PeerJ 7, e6281. doi: 10.7717/peerj.6281
Cook K. H., Vizy E. K. (2006). South American climate during the Last Glacial Maximum: delayed onset of the South American monsoon. J. Geophysical Research: Atmospheres 111 (D2), 1–21. doi: 10.1029/2005JD005980
Danecek P., Auton A., Abecasis G., Albers C. A., Banks E., DePristo M. A., et al. (2011). The variant call format and VCFtools. Bioinformatics 27 (15), 2156–2158. doi: 10.1093/bioinformatics/btr330
Drummond A. J., Suchard M. A., Xie D., Rambaut A. (2012). Bayesian phylogenetics with BEAUti and the BEAST 1.7. Mol. Biol. Evol. 29 (8), 1969–1973. doi: 10.1093/molbev/mss075
Eaton D. A., Overcast I. (2020). ipyrad: Interactive assembly and analysis of RADseq datasets. Bioinformatics 36 (8), 2592–2594. doi: 10.1093/bioinformatics/btz966
Ervin G. N. (2012). Indian fig cactus (Opuntia ficus-indica (L.) Miller) in the Americas: an uncertain history. Haseltonia 2012 (17), 70–81. doi: 10.2985/1070-0048-17.1.9
Ewels P., Magnusson M., Lundin S., Käller M. (2016). MultiQC: summarize analysis results for multiple tools and samples in a single report. Bioinformatics 32 (19), 3047–3048. doi: 10.1093/bioinformatics/btw354
Excoffier L., Dupanloup I., Huerta-Sánchez E., Sousa V. C., Foll M. (2013). Robust demographic inference from genomic and SNP data. PloS Genet. 9 (10), e1003905. doi: 10.1371/journal.pgen.1003905
Fick S. E., Hijmans R. J. (2017). WorldClim 2: new 1-km spatial resolution climate surfaces for global land areas. Int. J. Climatology 37 (12), 4302–4315. doi: 10.1002/joc.5086
Foll M., Gaggiotti O. (2008). A genome-scan method to identify selected loci appropriate for both dominant and codominant markers: a Bayesian perspective. Genetics 180 (2), 977–993. doi: 10.1534/genetics.108.092221
Forbes A. A., Devine S. N., Hippee A. C., Tvedte E. S., Ward A. K., Widmayer H. A., et al. (2017). Revisiting the particular role of host shifts in initiating insect speciation. Evolution 71 (5), 1126–1137. doi: 10.1111/evo.13164
Frichot E., François O. (2015). LEA: An R package for landscape and ecological association studies. Methods Ecol. Evol. 6 (8), 925–929. doi: 10.1111/2041
Frichot E., Mathieu F., Trouillon T., Bouchard G., François O. (2014). Fast and efficient estimation of individual ancestry coefficients. Genetics 196 (4), 973–983. doi: 10.1534/genetics.113.160572
Funk D. J., Nosil P., Etges W. J. (2006). Ecological divergence exhibits consistently positive associations with reproductive isolation across disparate taxa. Proc. Natl. Acad. Sci. 103 (9), 3209–3213. doi: 10.1073/pnas.0508653103
Goudet J. (2005). Hierfstat, a package for R to compute and test hierarchical F-statistics. Mol. Ecol. Notes 5 (1), 184–186. doi: 10.1111/j.1471-8286.2004.00828.x
Guo Q. (2012). Incorporating latitudinal and central–marginal trends in assessing genetic variation across species ranges. Mol. Ecol. 21 (22), 5396–5403. doi: 10.1111/mec.12012
Hall K. R., Anantharaman R., Landau V. A., Clark M., Dickson B. G., Jones A., et al. (2021). Circuitscape in Julia: empowering dynamic approaches to connectivity assessment. Land 10 (3), 301. doi: 10.3390/land10030301
Hewitt G. M. (2011). Quaternary phylogeography: the roots of hybrid zones. Genetica 139 (5), 617–638. doi: 10.1007/s10709-011-9547-3
Keenan K., McGinnity P., Cross T. F., Crozier W. W., Prodöhl P. A. (2013). diveRsity: An R package for the estimation and exploration of population genetics parameters and their associated errors. Methods Ecol. Evol. 4 (8), 782–788. doi: 10.1111/2041-210X.12067
Keightley P. D., Pinharanda A., Ness R. W., Simpson F., Dasmahapatra K. K., Mallet J., et al. (2015). Estimation of the spontaneous mutation rate in Heliconius melpomene. Mol. Biol. Evol. 32 (1), 239–243. doi: 10.1093/molbev/msu302
Köhler M., Esser L. F., Font F., Souza-Chies T. T., Majure L. C. (2020). Beyond endemism, expanding conservation efforts: What can new distribution records reveal? Perspect. Plant Ecology Evol. Systematics 45, 125543.
Laukkanen L., Mutikainen P., Muola A., Leimu R. (2014). Plant-species diversity correlates with genetic variation of an oligophagous seed predator. PLoS One 9 (4), e94105. doi: 10.1371/journal.pone.0094105
Leigh J. W., Bryant D. (2015). POPART: full-feature software for haplotype network construction. Methods Ecol. Evol. 6 (9), 1110–1116. doi: 10.1111/2041-210X.12410
Lynch M., Conery J. S. (2003). The origins of genome complexity. Science 302 (5649), 1401–1404. doi: 10.1126/science.1089370
Marsico T. D., Wallace L. E., Ervin G. N., Brooks C. P., McClure J. E., Welch M. E. (2011). Geographic patterns of genetic diversity from the native range of Cactoblastis cactorum (Berg) support the documented history of invasion and multiple introductions for invasive populations. Biol. Invasions 13 (4), 857–868. doi: 10.1007/s10530-010-9874-9
McFadyen R. E. (1985). Larval characteristics of Cactoblastis spp.(Lepidoptera: Pyralidae) and the selection of species for biological control of prickly pears (Opuntia spp.). Bull. Entomological Res. 75 (1), 159–168. doi: 10.1017/S0007485300014231
McRae B. H. (2006). Isolation by resistance. Evolution 60 (8), 1551–1561. doi: 10.1111/j.0014-3820.2006.tb00500.x
McRae B. H., Beier P. (2007). Circuit theory predicts gene flow in plant and animal populations. Proc. Natl. Acad. Sci. 104 (50), 19885–19890. doi: 10.1073/pnas.0706568104
Morrone J. J. (2014). Biogeographical regionalisation of the Neotropical region. Zootaxa 3782 (1), 1–110. doi: 10.11646/zootaxa.3782.1.1
Mourelle C., Ezcurra E. (1997). Differentiation diversity of Argentine cacti and its relationship to environmental factors. J. Vegetation Sci. 8 (4), 547–558. doi: 10.2307/3237206
Noguerales V., Cordero P. J., Ortego J. (2018). Inferring the demographic history of an oligophagous grasshopper: Effects of climatic niche stability and host-plant distribution. Mol. Phylogenet. Evol. 118, 343–356. doi: 10.1016/j.ympev.2017.10.012
Noguerales V., Meramveliotakis E., Castro-Insua A., Andújar C., Arribas P., Creedy T. J., et al. (2021). Community metabarcoding reveals the relative role of environmental filtering and spatial processes in metacommunity dynamics of soil microarthropods across a mosaic of montane forests. Mol. Ecol. 00, 1–19. doi: 10.1111/mec.16275
Ochoa M. J., Targa M. G., Abdala G., Leguizamón G. (2007). Extending fruiting season of cactus pear (Opuntia ficus-índica (l.) miller) in Santiago del estero, Argentina. VI Int. Congress Cactus Pear Cochineal 811, 87–90.
Oliveira E. A. D., Perez M. F., Bertollo L. A. C., Gestich C. C., Ráb P., Ezaz T., et al. (2020). Historical demography and climate driven distributional changes in a widespread Neotropical freshwater species with high economic importance. Ecography 43 (9), 1291–1304. doi: 10.1111/ecog.04874
Ortego J., Céspedes V., Millán A., Green A. J. (2021). Genomic data support multiple introductions and explosive demographic expansions in a highly invasive aquatic insect. Mol. Ecol. 30 (17), 4189–4203. doi: 10.1111/mec.16050
Ortego J., Gugger P. F., Riordan E. C., Sork V. L. (2014). Influence of climatic niche suitability and geographical overlap on hybridization patterns among southern Californian oaks. J. Biogeogr. 41 (10), 1895–1908. doi: 10.1111/jbi.12334
Ortiz-Jaureguizar E., Cladera G. A. (2006). Paleoenvironmental evolution of southern South America during the Cenozoic. J. Arid Environments 66 (3), 498–532. doi: 10.1016/j.jaridenv.2006.01.007
Pembleton L. W., Cogan N. O., Forster J. W. (2013). StAMPP: An R package for calculation of genetic differentiation and structure of mixed-ploidy level populations. Mol. Ecol. Resour. 13 (5), 946–952. doi: 10.1111/1755-0998.12129
Peterman W. E., Connette G. M., Semlitsch R. D., Eggert L. S. (2014). Ecological resistance surfaces predict fine-scale genetic differentiation in a terrestrial woodland salamander. Mol. Ecol. 23 (10), 2402–2413. doi: 10.1111/mec.12747
Peterson B. K., Weber J. N., Kay E. H., Fisher H. S., Hoekstra H. E. (2012). Double digest RADseq: an inexpensive method for de novo SNP discovery and genotyping in model and non-model species. PloS One 7 (5), e37135. doi: 10.1371/journal.pone.0037135
Phillips S. J., Anderson R. P., Schapire R. E. (2006). Maximum entropy modeling of species geographic distributions. Ecol. Model. 190 (3-4), 231–259. doi: 10.1016/j.ecolmodel.2005.03.026
Poveda-Martínez D., Varone L., Fuentes Corona M., Hight S., Logarzo G., Hasson E. (2022). Spatial and host related genomic variation in partially sympatric cactophagous moth species. Mol. Ecol. 31 (1), 356–371. doi: 10.1111/mec.16232
Purcell S., Neale B., Todd-Brown K., Thomas L., Ferreira M. A., Bender D., et al. (2007). PLINK: a tool set for whole-genome association and population-based linkage analyses. Am. J. Hum. Genet. 81 (3), 559–575. doi: 10.1086/519795
Rocha A. V., Cabanne G. S., Aleixo A., Silveira L. F., Tubaro P., Caparroz R. (2020). Pleistocene climatic oscillations associated with landscape heterogeneity of the South American dry diagonal explains the phylogeographic structure of the narrow-billed woodcreeper (Lepidocolaptes angustirostris, Dendrocolaptidae). J. Avian Biol. 51 (9), 1–13. doi: 10.1111/jav.02537
Rodriguero M. S., Lanteri A. A., Guzmán N. V., Carús Guedes J. V., Confalonieri V. A. (2016). Out of the forest: past and present range expansion of a parthenogenetic weevil pest, or how to colonize the world successfully. Ecol. Evol. 6 (15), 5431–5445. doi: 10.1002/ece3.2180
Rosetti N., Krohling D., Remis M. I. (2022). Evolutionary history and colonization patterns of the wing dimorphic grasshopper Dichroplus vittatus in two Argentinean biomes. Sci. Rep. 12 (1), 1–17. doi: 10.1038/s41598-022-05162-6
Rozas J., Ferrer-Mata A., Sánchez-DelBarrio J. C., Guirao-Rico S., Librado P., Ramos-Onsins S. E., et al. (2017). DnaSP 6: DNA sequence polymorphism analysis of large data sets. Mol. Biol. Evol. 34 (12), 3299–3302. doi: 10.1093/molbev/msx248
Sánchez-Restrepo A. F., Confalonieri V. A., Calcaterra L. A. (2023). The origin and spread of the southern black ant, a widely distributed leaf-cutting ant. J. Biogeogr. 50, 1519–1532. doi: 10.1111/jbi.14685
Sherpa S., Renaud J., Guéguen M., Besnard G., Mouyon L., Rey D., et al. (2020). Landscape does matter: Disentangling founder effects from natural and human-aided post-introduction dispersal during an ongoing biological invasion. J. Anim. Ecol. 89 (9), 2027–2042. doi: 10.1111/1365-2656.13284
Slatkin M. (1993). Isolation by distance in equilibrium and non-equilibrium populations. Evolution 47 (1), 264–279. doi: 10.1111/j.1558-5646.1993.tb01215.x
Soley-Guardia M., Carnaval A. C., Anderson R. P. (2019). Sufficient versus optimal climatic stability during the Late Quaternary: using environmental quality to guide phylogeographic inferences in a Neotropical montane system. J. Mammalogy 100 (6), 1783–1807. doi: 10.1093/jmammal/gyz162
Speranza P. R., Seijo J. G., Grela I. A., Solis Neffa V. G. (2007). Chloroplast DNA variation in the Turnera sidoides L. complex (Turneraceae): biogeographical implications. J. Biogeogr. 34 (3), 427–436. doi: 10.1111/j.1365-2699.2006.01622.x
Tishechkin D. Y. (2020). The role of sympatric and allopatric speciation in the origin of biodiversity of herbivorous insects, with palaearctic species of the genus Macropsis Lewis 1836 Taken as an example (Homoptera, auchenorrhyncha, cicadellidae, eurymelinae, macropsini). Entmol. Rev. 100, 1039–1064. doi: 10.1134/S0013873820080011
Varone L., Acosta M. M., Logarzo G. A., Briano J. A., Hight S. D., Carpenter J. E. (2012). Laboratory performance of Cactoblastis cactorum (Lepidoptera: Pyralidae) on South and North American Opuntia species occurring in Argentina. Florida Entomologist 95, 1163–1173. doi: 10.1653/024.095.0447
Varone L., Logarzo G. A., Briano J. A., Hight S. D., Carpenter J. E. (2014). Cactoblastis cactorum (Berg) (Lepidoptera: Pyralidae) use of Opuntia host species in Argentina. Biol. Invasions 16 (11), 2367–2380. doi: 10.1007/s10530-014-0670-9
Vidal M. C., Murphy S. M. (2018). Bottom-up vs. top-down effects on terrestrial insect herbivores: A meta-analysis. Ecol. Lett. 21 (1), 138–150. doi: 10.1111/ele.12874
Vidal M. C., Quinn T. W., Stireman J. O. III, Tinghitella R. M., Murphy S. M. (2019). Geography is more important than host plant use for the population genetic structure of a generalist insect herbivore. Mol. Ecol. 28 (18), 4317–4334. doi: 10.1111/mec.15218
Wang I. J. (2013). Examining the full effects of landscape heterogeneity on spatial genetic variation: a multiple matrix regression approach for quantifying geographic and ecological isolation. Evolution 67 (12), 3403–3411. doi: 10.1111/evo.12134
Wang I. J. (2020). Topographic path analysis for modelling dispersal and functional connectivity: calculating topographic distances using the topoDistance r package. Methods Ecol. Evol. 11 (2), 265–272. doi: 10.1111/2041-210X.13317
Wang I. J., Bradburd G. S. (2014). Isolation by environment. Mol. Ecol. 23 (23), 5649–5662. doi: 10.1111/mec.12938
Weir B. S., Cockerham C. C. (1984). Estimating F-statistics for the analysis of population structure. Evolution 38, 1358–1370. doi: 10.2307/2408641
Werneck F. P. (2011). The diversification of eastern South American open vegetation biomes: historical biogeography and perspectives. Quaternary Sci. Rev. 30 (13-14), 1630–1648. doi: 10.1016/j.quascirev.2011.03.009
Keywords: cactus pest, cactoblastis cactorum, ddRAD, landscape genomics, paleoclimate, opuntia
Citation: Poveda-Martínez D, Noguerales V, Hight SD, Logarzo G, Emerson BC, Varone L and Hasson E (2023) Geography, climate and shifts in host plants distribution explain the genomic variation in the cactus moth. Front. Ecol. Evol. 11:1260857. doi: 10.3389/fevo.2023.1260857
Received: 18 July 2023; Accepted: 29 August 2023;
Published: 19 September 2023.
Edited by:
Zitong Li, Commonwealth Scientific and Industrial Research Organisation (CSIRO), AustraliaReviewed by:
Cui Wang, University of Helsinki, FinlandJordan Golubov, Universidad Autónoma Metropolitana, Mexico
Copyright © 2023 Poveda-Martínez, Noguerales, Hight, Logarzo, Emerson, Varone and Hasson. This is an open-access article distributed under the terms of the Creative Commons Attribution License (CC BY). The use, distribution or reproduction in other forums is permitted, provided the original author(s) and the copyright owner(s) are credited and that the original publication in this journal is cited, in accordance with accepted academic practice. No use, distribution or reproduction is permitted which does not comply with these terms.
*Correspondence: Daniel Poveda-Martínez, danielpovedam@gmail.com
†These authors share last authorship