The impact of industrial structure upgrading and digital economy integration on China’s urban carbon emissions
 Hong Jiang1,2
  Zhenhuan Chen
 Wencheng Zhao
 Di Liu
 Zhenyu Chen
- 1College of Economics and Management, Suqian University, Suqian, China
- 2School of Business Administration, Liaoning Technical University, Huludao, China
- 3College of Economics and Management, Northeast Forestry University, Harbin, China
- 4College of Economics and Management, China Agricultural University, Beijing, China
- 5Institute of Finance and Economics, Shanghai University of Finance and Economics, Shanghai, China
- 6Affairs Service Center of Ecological Environment of Liaoning Province, Shenyang, China
This paper is based on the research hypothesis that the development of the digital economy can enable urban carbon emission reduction. We use the panel data of 275 prefecture-level cities in China from 2011 to 2019, the static panel-data interaction-effect model, and the panel-threshold model to verify the non-linear impact mechanism and heterogeneity of the digital economy in industrial structure upgrading affecting urban carbon emissions. The results demonstrate the following insights. First, due to the heterogeneity of industries, an increase in the proportion of the tertiary industry cannot reduce urban carbon emissions. Second, the digital economy has an inverted U-shaped adjustment effect on the process of industrial structure upgrading, affecting urban carbon emissions. Consequently, the integration and development of the tertiary industry and the digital economy can achieve urban carbon emission reductions. Finally, the digital economy has a double threshold effect on the process of industrial structure upgrading, affecting urban carbon emissions. The carbon-emission-reduction effect of industrial structure upgrading only appears after the scale of the digital economy crosses the first threshold. As the scale of the digital economy continues to increase, the carbon-emission-reduction effect of industrial structures is likely to continue increasing significantly. We recommend that local governments achieve urban carbon reduction by encouraging the development of high-end service industries and strengthening digital infrastructure.
1 Introduction
The global warming caused by carbon emissions is seriously threatening human survival and sustainable development; it is one of the major global challenges facing humanity today. Reducing carbon emissions and responding to increasingly severe climate change have become key issues of common concern to the international community. China’s industry accounts for a relatively large proportion of the national economy, with problems of high energy consumption, high emissions, and low efficiency coexisting. According to data from the National Energy Administration and the Bureau of Statistics of China, China’s energy consumption and carbon emissions in 2020 were 4.98 billion tce and 10.25 billion t CO2e, making China the country with the largest energy consumption and carbon emissions in the world. China’s energy consumption per unit of gross domestic product (GDP) is 3.4tce/10,000 US dollars, and its carbon emissions per unit of GDP are 6.7t/10,000 US dollars, which are 1.5 times and 1.8 times the world average annual level, respectively. As such, China is not only one of the world’s largest emitters (Irfan et al., 2021) of greenhouse gases but also plays a crucial role in global climate governance. It is urgent that green development characterized by energy conservation and emission reduction be promoted. The 2022 report of the 20th National Congress of the Communist Party of China emphasizes that promoting green and low-carbon economic and social development is the key to achieving high-quality development. In this process, it is necessary to speed up the adjustment and optimization of industrial, energy, and transportation structures; improve the market-oriented allocation system of resources and environmental elements; accelerate the research and application of advanced energy-saving and carbon-reducing technologies; advocate green consumption; and promote the formation of green and low-carbon production patterns and lifestyles. The traditional view holds that the most direct path to carbon emission reduction is energy-utilization technology progress and energy-consumption structure adjustment (Lin and Jiang, 2009; Sarkodie and Strezov, 2019; Li and Wang, 2022). However, pure technological progress cannot solve the problem of carbon emissions caused by energy consumption. On the contrary, technological progress may create an “energy rebound effect” (Sorrell et al., 2020). Considering China’s resource endowment status of being rich in coal, poor in oil, and low in gas, it will likely be difficult to change the energy consumption structure dominated by coal for many years (Lin and Li, 2015). Determining how to reduce excessive dependence on energy through industrial upgrading and industrial structure adjustment is the top priority. The research has shown that, based on accelerating the application and innovation of carbon-emission-reduction technologies, industrial restructuring is an effective way for China to achieve carbon emission reduction.
Following the traditional agricultural economy and the modern industrial economy, the digital economy, as a new economic form, has comprehensively reshaped and upgraded social production methods and people’s consumption concepts. In addition, the digital economy has provided a key engine and driving force for China’s economy to achieve high-quality development. Simultaneously, the digital economy is also an important driver and catalyst for industrial structure upgrading (Xuan, 2017; Li et al., 2021). The digital economy and upgrading of industrial structures promote one another, and their integrated development is likely to solve the problems of high pollution and emissions caused by energy dependence and the improper allocation of resources. According to the “White Paper on China’s Digital Economy Development” (CAICT, 2021), China’s digital economy will likely achieve a growth rate of more than three times the GDP from 2020, accounting for 38.6% of the GDP, and its scale has also achieved a historic breakthrough in reaching 39.2 trillion yuan. This demonstrates that the digital economy has become a fundamental driving force behind the steady growth of China’s economy. In addition, the scale of digital industrialization and industrial digitization in 2020 reached 7.5 trillion yuan and 31.7 trillion yuan, respectively, accounting for 19.1% and 80.9% of the digital economy and 7.3% and 31.2% of the GDP. Some literature claims the digital economy can not only integrate and develop with traditional industries but also integrate and innovate with the fields of resources, energy utilization, and environmental protection (Shi, 2022). Whether the digital economy plays an effective role in the realization of China’s “dual carbon” goals and how the role operates are questions worth exploring.
Scholars have conducted considerable research on the impact of changes in industrial structures on carbon emissions. Early scholars mainly focused on the distribution of production factors among different industries and related relationships and their impact on carbon emissions (Zhang and Choi, 2013; Lin and Benjamin, 2017; Hu and Sun, 2022). In this type of research, the measurement of industrial structures generally uses the proportion of the secondary or tertiary industry as a proxy variable. This research has shown that an increase in the proportion of the tertiary industry is conducive to the improvement of regional carbon emissions (Pao et al., 2011; Dong et al., 2018). Following this work, the research perspectives of scholars shifted from the proportion of industrial output to the impact of the evolution and upgrading of industrial structures on carbon emissions (Du et al., 2019). Such studies explored the evolution of primary, secondary, and tertiary industries in addition to changes in carbon-emission intensity during the process of industrial evolution. In other words, they analyzed the impact of advanced industrial structures on carbon emissions (Zhang et al., 2020; Wu et al., 2021; Xu et al., 2021). To explain the impact of industrial restructuring on carbon emissions more comprehensively, some scholars have begun to draw on the ideas of the Theil index and Lorenz curve to construct the industrial structure rationality and industrial structure high-level index (Zhang et al., 2022). This helps such scholars explore industrial restructuring’s impact on carbon emissions from multiple perspectives, such as industry proportion, concentration, and reasonable distribution (Liang et al., 2021; Zhang and Xu, 2022).
In recent years, however, the digital economy has flourished and become a new engine of economic growth, and scholars have now begun to study the impact of the digital economy on carbon emissions. Research on the impact of digital economy development on regional carbon emissions is mainly carried out from three perspectives. The first is to explore the impact of the digital economy on high-quality economic development from a macro perspective and based on qualitative research methods (Li et al., 2022; Zhang et al., 2022; Zhu X et al. 2022). The second relates to perspectives of technological progress (Kuang et al., 2020), urbanization processes (Li et al., 2021), inclusive finance (Dong et al., 2022), imports and exports (Ma et al., 2022; Zhong et al., 2022), and government intervention (Lin and Huang, 2022). These studies explore the impact of the path of digital economy development on regional carbon emissions. Finally, the third perspective mainly revolves around the energy-saving and emission-reduction potential of the digitization of industrial processes (Zhu Z et al., 2022; Wang et al., 2022).
In summary, scholars have conducted considerable and valuable research on the impacts of industrial structures and the digital economy on carbon emissions, which has laid a solid theoretical foundation for the writing of this paper. However, the digital economy does not directly affect carbon emissions. Instead, it indirectly affects carbon emissions through intermediate variables such as industrial structure and technological progress (Wang et al., 2019). As such, the aim of this paper is to investigate the non-linear effects and regional heterogeneity of the digital economy’s impact on industrial upgrading and urban carbon emissions. This study focuses on 275 prefecture-level cities in China, where we initially computed the carbon-emission intensity of each city from 2011 to 2019 and examined its spatiotemporal pattern evolution. Next, we developed a panel-data fixed-effects model, which included interactive terms, to investigate the joint effects of the digital economy and industrial upgrading on changes in urban carbon emissions. Furthermore, we constructed a panel-threshold model to explore the threshold effect of the digital economy on the influence of industrial upgrading on urban carbon emissions and to analyze the heterogeneity of this impact in different threshold ranges. Finally, we proposed targeted policy recommendations, based on our conclusions, to effectively facilitate the transformation of urban economic growth and industrial structure upgrading, thus promoting the attainment of the carbon peaking and carbon neutrality goals. This paper answers the following three questions: First, does the digital economy have a regulating effect on the carbon-emission-reduction effect of industrial structure upgrading? Second, if there is a regulating effect, how do we determine the threshold interval of its effect? Third, within the range of different threshold intervals, what kind of heterogeneity exists in the direction and strength of the effects?
In addition, this study demonstrates innovation in three main areas. First, it verifies, from both theoretical and empirical perspectives, the moderating effect of the digital economy on the relationship between industrial upgrading and urban carbon emissions. This expands the research field of the low-carbon economy by considering the digital economy as a factor influencing carbon emissions. Second, this study uses a panel-threshold model to test the threshold effect of the digital economy on the relationship between industrial upgrading and urban carbon emissions and explore the mechanism and heterogeneity of this relationship in different threshold ranges. Third, this paper challenges how existing research has primarily focused on the impact of industrial upgrading on urban carbon emissions and has only provided theoretical guidance at the industry level for carbon emission reduction. This study instead highlights the joint impact of the digital economy and industrial upgrading on carbon emissions and proposes differentiated policy recommendations to promote urban carbon reduction through industrial upgrading at different levels of digital economic development.
The remaining sections of this article are structured as follows. Section 2 introduces the theoretical mechanism and research hypotheses. Section 3 outlines the methods and data utilized in this study. Section 4 presents and discusses the empirical analysis results. Section 5 discusses the research findings. The final section summarizes the conclusions and presents policy implications.
2 Theoretical analysis and hypothesis development
2.1 Industrial structure upgrading and carbon emissions
Existing research on the upgrading of industrial structures, whether from the perspective of industrial structure rationality or the industrial structure high-level index, is conducted around the proportion of the added value of the three industries. Scholars believe that the core content of industrial structure adjustment and upgrading is the joint transformation of primary and secondary industries into the tertiary industry, which ultimately leads to an increase in the proportion of the tertiary industry. In China, heavy industry means that it is the leading industry that provides the material and technological foundation for all sectors of the national economy. Among the three industries, the secondary industry has the most characteristics of energy dependence and carbon-emission intensity. Therefore, the upgrading of industrial structures helps to reduce the proportion of the secondary industry, especially heavy industry such as steel, energy, chemicals, and materials, and reduce the massive consumption of traditional fossil energy (Lin and Du, 2015). The development of China’s economy in recent years has mainly been driven by investment, and its emphasis on industrial output inevitably increases its dependence on the input of production factors. This eventually leads to the characteristics of “high pollution, high energy consumption and low efficiency” in economic growth (Crompton and Wu, 2005). Encouraging and promoting the development of the tertiary industry can help reduce energy consumption in the production process, break through the rigid demand for energy in the economic system, improve the quality of economic growth, and reduce energy intensity and total carbon emissions. Moreover, the previous development of China’s industry chose a capital-biased path, resulting in the industrial system’s high dependence on chemical energy and hindering the optimization of energy consumption structures and the use of low-carbon clean energy (Wang et al., 2022). Vigorously developing the service industry, especially the producer- and technology-service industries, can promote the service-oriented transformation of industrial enterprises, improve production efficiency, reduce energy consumption per unit of product while producing high-value-added products, and ultimately achieve energy conservation and emission reduction. Based on the above analysis, this paper presents the following hypothesis:
H1: An increase in the proportion of the tertiary industry will help reduce the energy dependence of the economic system and reduce the intensity of carbon emissions.
2.2 Tertiary industry heterogeneity and carbon emissions
Existing studies believe that the carbon-emission-reduction effect of industrial structure upgrading is also related to the nature of subdivided industries within the tertiary industry (Sun et al., 2021). According to the gap in technology intensity and per capita output value of different industries, the tertiary industry is usually divided into high-end, middle-end, and low-end industries. High-end industries generally include the financial industry, the computer service and software industry, technical services, and the geological prospecting industry. Middle- and low-end industries include transportation and postal services, wholesale and retail, leasing, and business services. Furthermore, different types of industries have different service targets. High-end industries generally target technology-intensive and high-end manufacturing industries, while low-end industries generally target labor-intensive and capital-intensive manufacturing industries. The varied proportions of different types of industries in the tertiary industry can directly affect the carbon-emission-reduction effect of the tertiary industry. The technology-intensive and high-end manufacturing industry is at the upstream end of the industrial chain, and the energy consumption and carbon-emission intensity per unit product are both relatively low. Therefore, if such industries account for a large proportion of the tertiary industry, the “economy of scale effect,” “industrial structure upgrading effect,” and “technology spillover effect” of industrial structure upgrading may be effectively introduced (Crompton and Wu, 2005). An increase in the proportion of the tertiary industry, especially the rapid development of the environmental governance industry and the public facilities management industry, is conducive to reducing the cost of environmental governance for enterprises. This makes it possible to centralize carbon-emission control and helps reduce carbon-emission intensity (Liang et al., 2021). In contrast, labor- and capital-intensive industries are at the middle and low ends of the industrial chain, respectively, and their energy consumption and carbon-emission intensity per unit of product are both relatively high. The increasing share of such industries in the tertiary sector is not conducive to carbon reduction and even inhibits the reduction of carbon-emission intensity (Wu et al., 2021). Therefore, this paper proposes the following hypothesis:
H2: The carbon-emission-reduction effect of the tertiary industry is affected by the heterogeneity of its internal industries. A large proportion of high-end industries will help reduce carbon-emission intensity; conversely, a large proportion of low-end industries will inhibit the reduction of carbon-emission intensity.
2.3 Industrial structure upgrading, digital economy, and carbon emissions
In contrast to traditional industries, the digital economy, as an emerging economic form, has an impact on the macroeconomic system through its technical and structural attributes (Chen et al., 2023). In addition to the widespread discovery that the development of the digital economy has accelerated an increase in the proportion of tertiary industries (Xu et al., 2022), within the tertiary industry, integration of the digital economy will likely reduce both the energy consumption per unit of product and the carbon-emission intensity of the industry, regardless of whether it serves low-end or high-end industries (Dong et al., 2022). As an emerging economic element, the digital economy has optimized or reshaped the way value is created after being fully integrated into the tertiary industry. For instance, it accelerates the process of upgrading industrial structures and reduces the carbon emissions of the secondary industry. Moreover, it directly reduces the carbon emissions of the tertiary industry. Therefore, it is expected that a greater level of digital industrialization and industrial digitization will lead to a larger scale of the digital economy and be more conducive to the exploration and carbon reduction effects of industrial structure upgrading.
First, the larger scale of the digital economy makes it more conducive to the energy-saving development of the tertiary industry. From the perspective of technical attributes of the digital economy, the rapid development of information technologies such as big data, cloud computing, and 5G intelligence has improved the speed and accuracy of business connections among enterprises in different industries and significantly reduced transaction and time costs among enterprises (Wen et al., 2022). For example, the rapid development of cloud computing and the Internet of Things has improved the calculation accuracy of transportation nodes and routes in the logistics industry. The rapid connection between the transportation industry and other industries, as well as the optimization of transportation routes, is expected to greatly reduce energy consumption during transportation and carbon-emission intensity (Zhao et al., 2022). Furthermore, the larger scale of the digital economy makes it more conducive to the development of environmentally friendly industries. Due to the structural attributes of the digital economy, the integration of information technology has accelerated the transformation and upgrading of traditional industries from extensive development to an environmentally friendly direction. Within the tertiary industry, industrial structures have changed from being labor and capital intensive to being technology intensive (Wen et al., 2023). Simultaneously, the digital economy has also spawned many emerging industries, most of which are technology-oriented and environmentally friendly while also promoting sustainable development. Emerging industries not only alleviate social employment pressure but also meet the requirements of the era of green development (Wang et al., 2022).
In summary, the development of the digital economy not only reduces the energy consumption of low-end industries at the technical level but also reduces carbon emissions. At the structural level, the development of the digital economy can continuously promote the optimization of the internal industry structure of the tertiary industry. The optimization of industry structures significantly enhance the economic benefits per unit of energy, which then plays a role in promoting and improving carbon-emission intensity. Figure 1 has been drawn to describe the mechanism of the digital economy’s impact on carbon emissions.
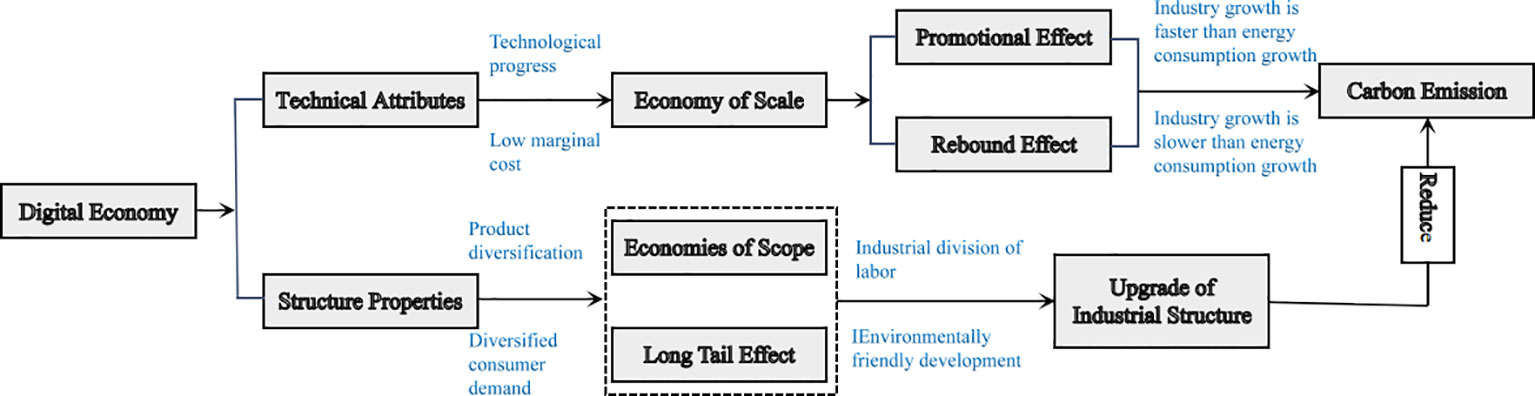
Figure 1 Transmission mechanism of carbon-emission-reduction effects in digital economy.
In view of these insights, this paper posits the following theoretical hypothesis:
H3: The carbon-emission-reduction effect of the tertiary industry is affected by the digital economy, and the carbon-emission-reduction effect of the digital economy can only appear when it reaches a certain scale.
In the following sections, we will use econometric methods to verify the validity of the above research hypothesis. Briefly, we will use the panel-threshold model to examine the nonlinear mechanism by which the digital economy moderates the impact of industrial structure on carbon emissions. Additionally, a series of robustness tests will be performed.
3 Materials and methods
3.1 Baseline regression model
According to the previous theoretical analysis, the scale of the digital economy has an impact on the carbon-emission-reduction effect of the tertiary industry. This section first constructs a static panel-data model to test whether the scale of the digital economy has a moderating effect on the carbon emission reduction of the tertiary industry. To reduce the influence of heteroscedasticity on the model, the following logarithmic processing is performed on all variables:
Among these variables, represents the city, represents the year, represents the random disturbance item, represents the carbon-emission intensity, represents the industrial structure, represents a set of control variables, represents regional fixed effects, and represents a fixed time effect. Formula (1) is a basic econometric model that simply examines the impact of industrial structure on carbon-emission intensity. To verify the regulating effect of the digital economy on the carbon-emission-reduction effect of the industrial structure, formula (1) is extended to include the interaction term between the digital economy and the industrial structure. In formula (2), represents the scale of the digital economy, represents the interaction effect between the scale of the digital economy and the industrial structure, represents regional fixed effects, and represents a fixed time effect.
3.2 Panel-threshold regression model
If the scale of the digital economy has a regulating effect on the carbon-emission-reduction effect of the industrial structure, a reasonable range for the scale of the digital economy must be determined. For this reason, this section continues to build a panel-threshold regression model to examine the threshold value of the different adjustment effects of the scale of the digital economy on the carbon-emission-reduction effect of the industrial structure. The regression equation is as follows:
Compared with formulas (1) and (2), the meaning of the response variable in formula (3) has changed. Among the formula’s variables, is the indicative function, is the threshold variable, and and represent the elastic coefficients of the industrial structure to carbon-emission intensity at and , respectively. If the threshold is chosen reasonably, the estimates or signs of and should be significantly different. Formula (3) only analyzes the single-threshold effect. Given that the analysis process of multiple thresholds is similar to the single-threshold effect, it is not repeated. In the empirical analysis section, this paper conducts multiple-threshold verification and analysis.
3.3 Variable selection and description
(1) Interpreted variable: carbon-emission intensity ()
This paper uses the ratio of urban carbon emissions to GDP to represent carbon-emission intensity. It is worth emphasizing that urban carbon emissions are obtained according to the latest energy-data revisions (2015) of the National Bureau of Statistics of China. These values are then combined with the official websites of local energy bureaus from 2011 to 2018. Due to the use of different methods, the results obtained by using the apparent emissions accounting method and the sectoral method sometimes do not fully align.
(2) Core explanatory variable: industrial structure ()
Given that the explained variable in this paper is carbon-emission intensity, a high level of industrial structure is not selected to ensure the consistency of the data quality. However, the proportion of the added value, in GDP, of the tertiary industry in prefecture-level cities over the years is selected as the proxy variable.
(3) Threshold variable: digital economy ()
Referring to the research results of Guo et al. (2020), based on the data of the inclusive finance index, the number of people in the computer service and software industry of information transmission, the number of internet broadband access users, the number of mobile phone users, and the telecom business income of each prefecture-level city over the years, this paper adopted the coefficient-of-variation method and the principal-component analysis method to calculate the scale of the digital economy as the proxy variable of the digital economy.
(4) Other control variables
An important control variable is energy efficiency under carbon-emission constraints (). The improvement of energy utilization efficiency will likely reduce energy consumption, thereby promoting the reduction of carbon-emission intensity. This paper takes the energy consumption, employees, and capital stock of prefecture-level cities over the years as the input, the GDP as the desired output, and carbon dioxide as the non-consensual output. CEE is calculated using the super-efficiency SBM model. Population density () is measured by dividing the population of prefecture-level cities by the area of the administrative region. This variable indicates the impact of differences in the scale of population activities in each city. The degree of openness () selects the ratio of the total import and export trade of the region to the GDP as a proxy indicator of the degree of openness. Government intervention () uses the proportion of regional fiscal budget expenditures in GDP over the years as a proxy indicator. Enterprise size () uses the ratio of the added value of enterprises above the designated size in prefecture-level cities in every previous year to the GDP as a proxy indicator.
Considering the integrity of the data and the impact of establishing or cancelling some prefecture-level cities on the balance of panel data, this paper excludes data from cities such as Danzhou, Bijie, Tongren, and Pu’er. Finally, this paper selects 275 prefecture-level cities in China from 2011 to 2019 as the research sample. It should be emphasized that we used data before 2020 for two reasons. On the one hand, China’s economic data after 2020 has been deeply affected by COVID-19, resulting in large outliers in macroeconomic data. On the other hand, the urban traffic barring caused by COVID-19 epidemic control has had a significant impact on urban carbon emissions, which is difficult to include in the control variables, and the endogenous problem caused by omitted variables may be very serious. The data in this paper mainly derives from the “China Statistical Yearbook 2012–2020” (National Bureau of Statistics of China, 2012–2020a), “China City Statistical Yearbook 2012–2020” (National Bureau of Statistics of China, 2012–2020b), “China Energy Statistical Yearbook 2012–2020” (National Bureau of Statistics of China, 2012–2020c), “EPS database & WIND database”1 and “China Energy Statistical Yearbook 2012–2020” (National Bureau of Statistics of China, 2012–2020d). Supplementary explanation: Some missing values of urban variables are filled in using the interpolation method. The specific indicators, data descriptions, and statistical descriptions are shown in Table 1.
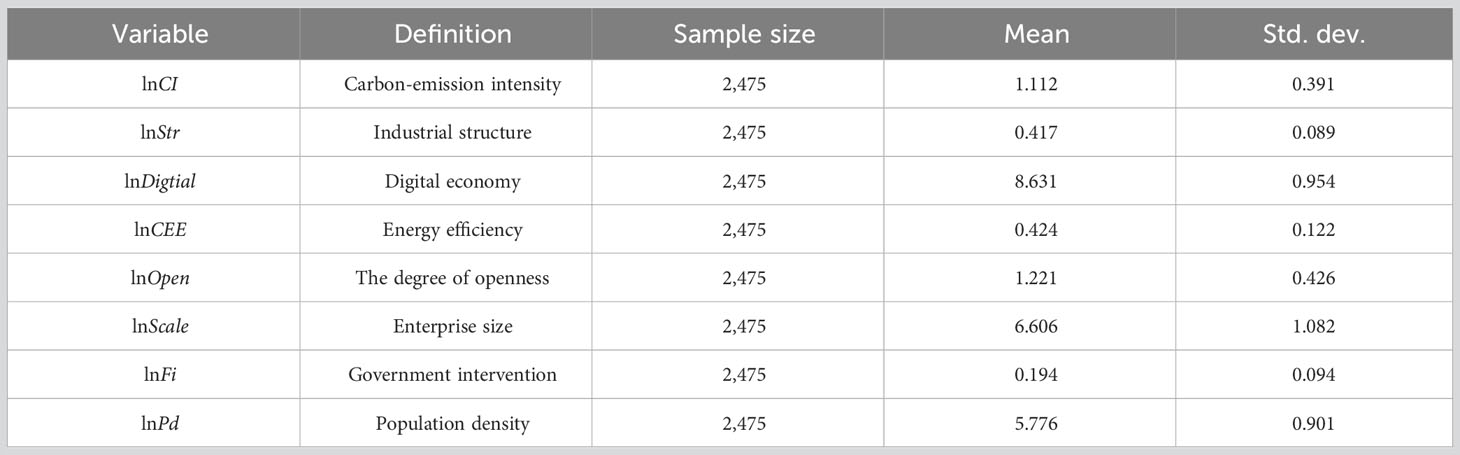
Table 1 Variable definitions and descriptive statistics.
4 Results
4.1 Kernel density estimation
The authors selected the data on carbon-emission intensity, industrial structure, and digital economy in 2011, 2013, 2015, 2017, and 2019, and we drew the kernel density map as shown in Figure 2. The results illustrate that urban carbon-emission intensity presents a unimodal distribution during the sample period. Furthermore, after 2015, the kurtosis gradually decreases, indicating that the regional differences in carbon-emission intensity are gradually shrinking. From the perspective of skewness, the kernel density curve of carbon-emission intensity in the sample period gradually tends to be left-biased and has a long tail to the right, indicating that the city’s carbon-emission intensity is decreasing year by year. However, there are still high-emission areas. The kernel density curves for industrial structure and the digital economy also show a unimodal distribution. In terms of kurtosis, the industrial structure shows a downward trend during the sample period, while the digital economy shows an upward trend. This indicates that the differences in the industrial structure between cities are gradually shrinking, while the differences in the scale of the digital economy are gradually increasing. In terms of skewness, the industrial structure gradually shifts to the right and has a long tail to the left, while the digital economy gradually shifts to the right and has a long tail to the right. This shows that the proportion of the tertiary industry and the scale of the digital economy are increasing each year, but there are still areas with low proportions in the industrial structure. Moreover, areas with high-scale digital economies are also increasing each year.
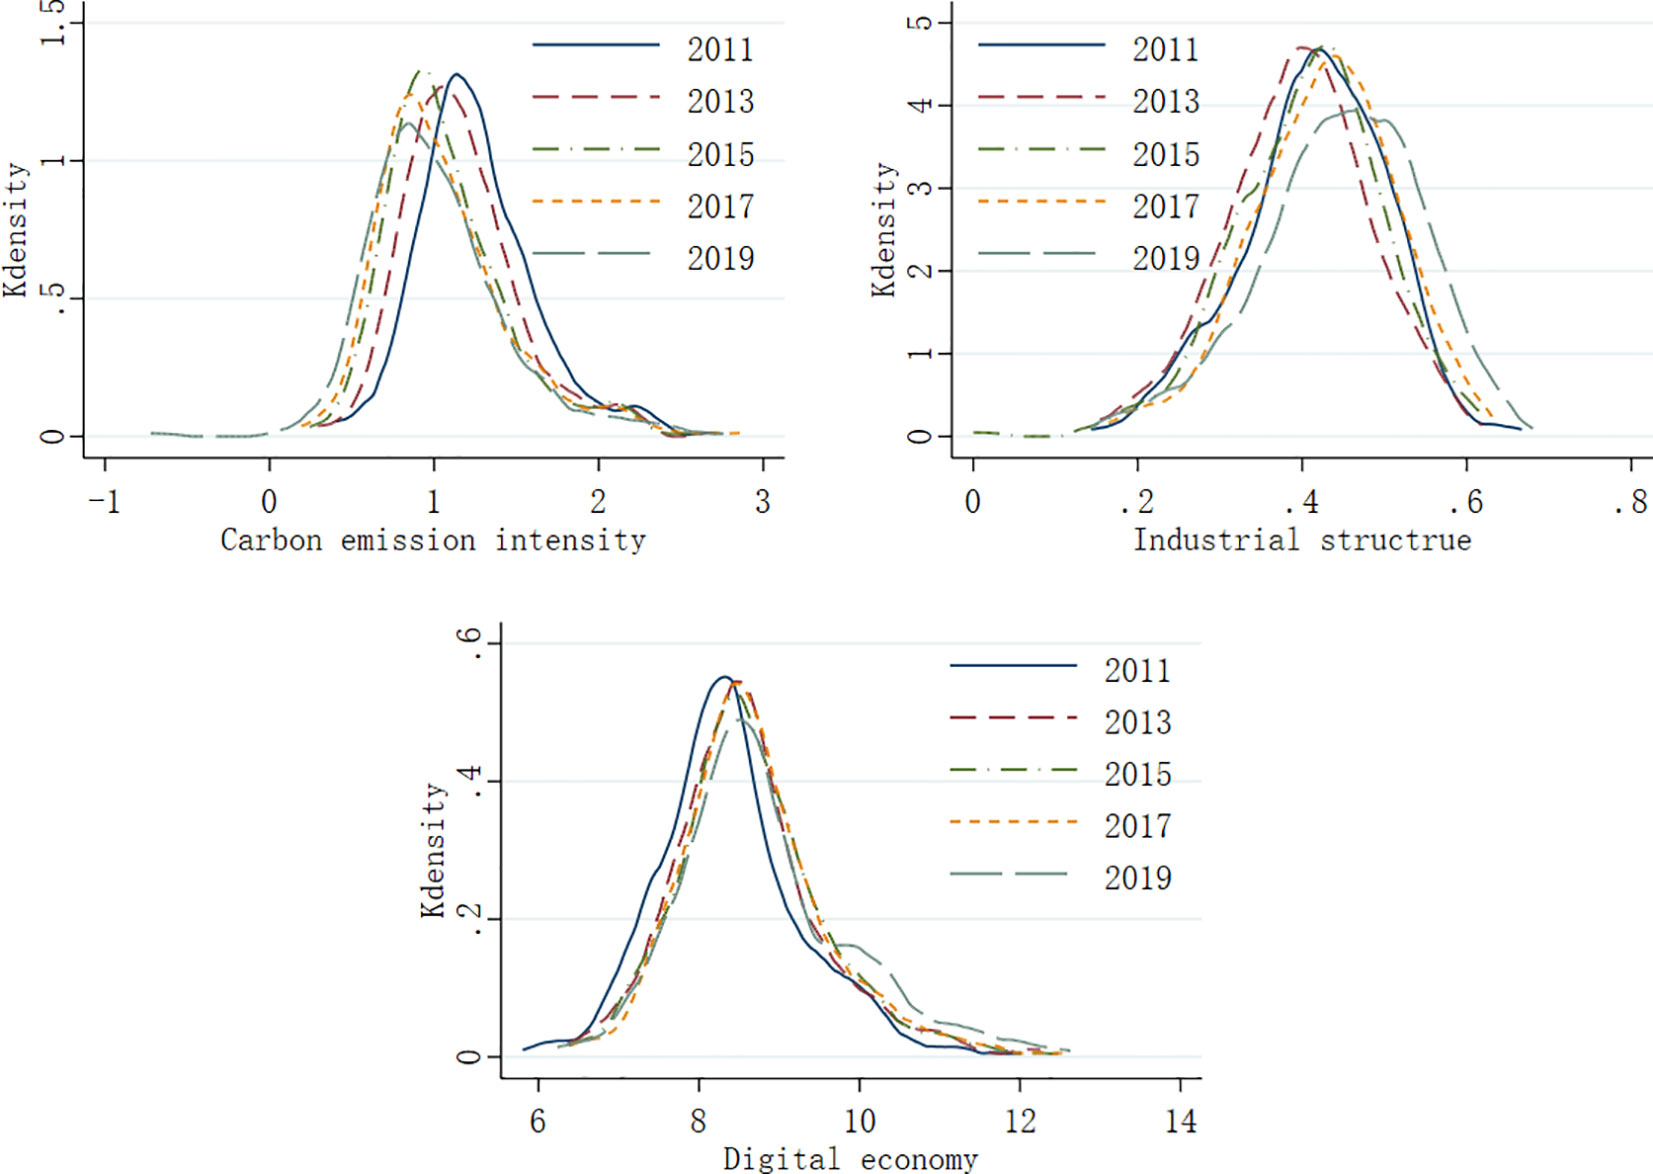
Figure 2 Variables’ kernel density estimation.
4.2 Baseline regression
This paper uses the individual-time two-way fixed-effect model. In addition, it uses the urban carbon-emission intensity as the explained variable and the urban industrial structure as the core explanatory variable for regression analysis. The results are shown in Table 2.
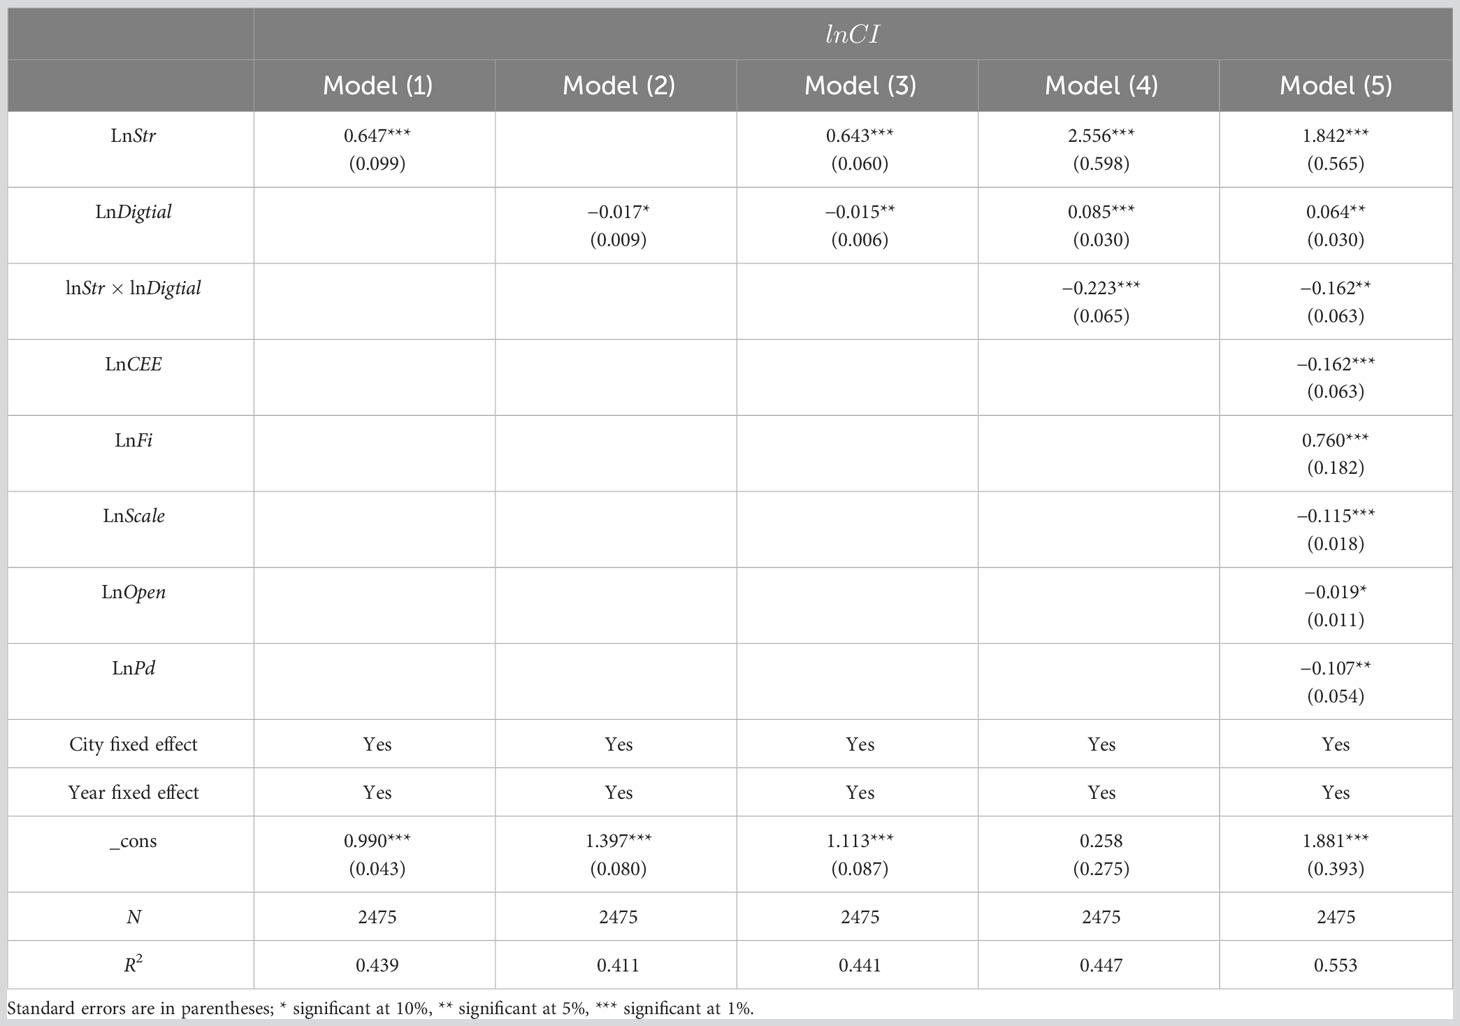
Table 2 Regression results of the impact of industrial structure on carbon emissions.
Columns (1) and (2) in Table 2 are baseline regressions that do not consider other factors. These results indicate that industrial structure adjustment has a significant positive impact on urban carbon emissions. This conclusion is inconsistent with the research results of Jiang and Sun (2023), who found that the increase in the proportion of the tertiary sector of the economy is conducive to reducing urban carbon emissions. The main reason is that Jiang and Sun (2023) may have ignored the impact of tertiary sector industry heterogeneity on carbon emissions. The increase in the proportion of middle- and low-end industries in the tertiary sector of the economy cannot curb carbon emissions, while digital economy development has a significant negative impact on urban carbon emissions. Column (3) reflects the combined impact of industrial structure adjustment and digital economy development on urban carbon emissions, and the magnitude and direction of the two factors’ coefficients show no significant changes. Column (4) builds on column (3) by adding the interaction term of industrial structure and digital economy development. The results indicate that the direction of digital economy development on urban carbon emissions has changed from the original negative impact to a positive impact, and the interaction between industrial structure and the digital economy has a significant negative impact on urban carbon emissions. Column (5), based on (4), adds control variables such as energy efficiency, government intervention, enterprise scale, degree of openness, and population density. The results show that industrial structure and digital economy development have a significant positive impact on urban carbon emissions, with impact coefficients of 1.842 and 0.064, respectively. Furthermore, the interaction term between the two has a significant negative impact on urban carbon emissions, with an impact coefficient of −0.162. This shows that the digital economy has played a mitigating role in the process of increasing carbon emissions due to industrial restructuring. This result is consistent with the research conclusion of Hu (2023), who also found that the development of the digital economy has a positive regulatory effect in the process of exacerbating carbon emissions due to changes in industrial structures.
Among the control variables, government intervention has a significant positive impact on urban carbon emissions, with a coefficient of 0.760. Energy efficiency, enterprise scale, degree of openness, and population density all have significant negative effects on urban carbon emissions, with coefficients of −0.162, −0.115, −0.019, and −0.107, respectively. The results in columns (4) and (5) show that the digital economy has a significant moderating effect on the process of industrial structure affecting carbon emissions, and this effect is explained further in the threshold-effect analysis below.
4.3 Endogeneity discussion
There may be a specific endogenous relationship between industrial structure upgrading and urban carbon emissions. On the one hand, the transformation of the industrial structure from the secondary industry to the tertiary industry has created a reduction in energy dependence and consumption, thereby reducing urban carbon emissions. On the other hand, the constraints of urban carbon-emission targets may lead to government intervention, which in turn will promote the adjustment of industrial structure. Therefore, there may be an endogenous problem of reverse causality between industrial restructuring and carbon emissions. In the following, the instrumental variable method is used to solve the endogeneity problem in the model. We use the logarithm of the number of employees in the tertiary industry and its lag one period as well as the logarithm of the green coverage rate of prefecture-level cities and its lag one period as the instrumental variables of the industrial structure. The regression results for the instrumental variables are shown in Table 3.

Table 3 Regression results of instrumental variable method.
The results show that the Durbin-Wu-Hausman (DWH) test results of all models rejected the null hypothesis at the significance level of 1%, indicating that the selected exogenous instrumental variables were correlated with the endogenous explanatory variables and could be identified. Among them, the Cragg-Donald Wald F statistic values of the weak instrumental variables test were 132.788, 141.104, and 119.233 respectively. All these values were significantly greater than the critical value of 16.85 at the significance level of 5%, rejecting the null hypothesis of weak instrumental variables. Simultaneously, in the regression results, the coefficient size, sign, and significance of the core explanatory variable and each control variable were also consistent with the benchmark regression. Based on the above analysis, it is determined that there is no endogeneity problem in the regression results statistically.
4.4 Robustness check
The robustness of the model is tested by changing the control variable, reducing the control variable, increasing the control variable, and changing the time span. The results are shown in Table 4.
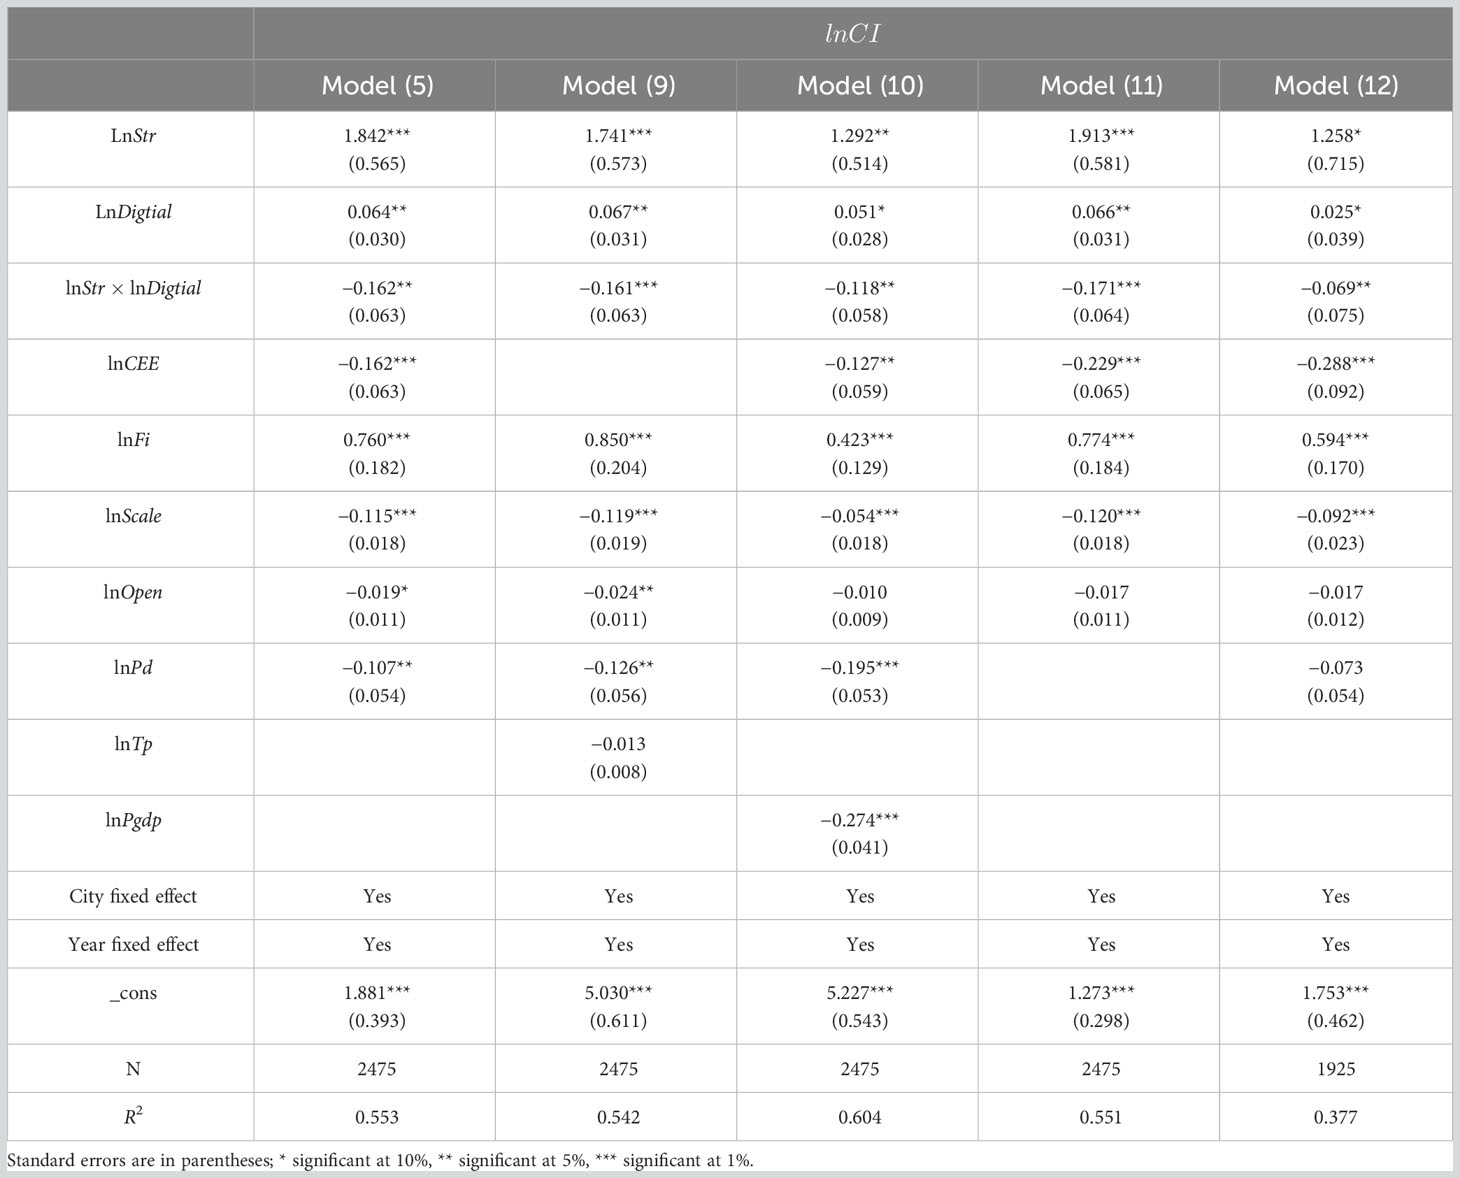
Table 4 Robustness check.
Model (9) uses the number of patent applications (lnTp) in prefecture-level cities as the proxy variable of technological progress to replace lnCEE in the original model. Model (10) adds the control variable of economic development level based on the original model (5) (per capita GDP of prefecture-level cities is used as the proxy variable). Model (11) is based on the original model (5), and the control variable of population density is eliminated. Model (12) is based on the original model (5), and the sample years are shortened to 2013–2019. In the transformed models (9)–(12), the industrial structure, digital economy development, and their interaction terms saw no significant changes in the direction of effect or the magnitude of the coefficients, indicating that the original model is robust.
In addition, this paper draws on the research of Tang and Yang (2023), takes the “Broadband China” demonstration cities as quasi-natural experiment conditions, and assigns values to cities according to the 2016 “Broadband China” demonstration cities list published by the Ministry of Industry and Information Technology of China. We assign a value of 1 to the year and subsequent years when a certain city conducts the construction of the “Broadband China” demonstration city; otherwise, it will be 0. Due to the announcement of the three batches of demonstration city lists in the second half of the year, this article defines the year following the release of the “Broadband China” demonstration city list as the year of policy implementation and estimates the policy effects. The analysis is conducted according to the following model:
In the equation, is the dependent variable, representing the carbon-emission level of city in year . represents a fixed time effect, represents the individual fixed effects of each city, and is a random error term. is a series of variables that may have an impact on the carbon emission levels of a region. is the core explanatory variable, representing the dummy variable of the “Broadband China” demonstration city, and its coefficient is used to measure the impact of the construction of “Broadband China” demonstration cities on carbon emissions. If is negative and significant, it indicates that the construction of “Broadband China” demonstration cities can reduce carbon emissions levels. The specific results are shown in Table 5.

Table 5 Differences-in-Differences regression results.
The results in column (1) of Table 5 show that the estimated coefficient of is −0.041, which is significant at the 1% significance level without adding control variables. This result indicates that, compared to non-pilot cities, the implementation of the “Broadband China” pilot policy has reduced the carbon-emission intensity of pilot cities by 4.1%. The main reasons for this are twofold. On the one hand, the implementation of the “Broadband China” pilot policy has improved the level of internet infrastructure and accelerated the digitization process. On the other hand, the popularization of internet broadband has produced the digital economy. The inclusiveness of the digital economy is conducive to the surrender of funds from enterprises and individual investors to environmentally friendly industries, enabling widespread support for green technology and reducing carbon-emission intensity. In columns (2) and (3) of the table, industrial structure variables and other control variables were added in sequence, and the regression results were still significantly negative, in line with the expected assumptions.
The use of the Differences-in-Differences method for policy-effect evaluation must satisfy the premise that the control group and the experimental group have a common trend. Therefore, this article uses the dynamic Differences-in-Differences method for parallel trend testing, and the results are shown in Figure 3. Meanwhile, although the regression in Table 5 controls for a series of urban characteristic factors that affect carbon-emission intensity, there may still be some unobservable factors that change over time and location, which may affect the estimation results and lead to estimation errors. Therefore, this article uses an indirect placebo test to randomly select pilot cities for “Broadband China.” According to the regression model in Table 5, 500 simulated regressions were repeated, and the results are shown in Figure 4.
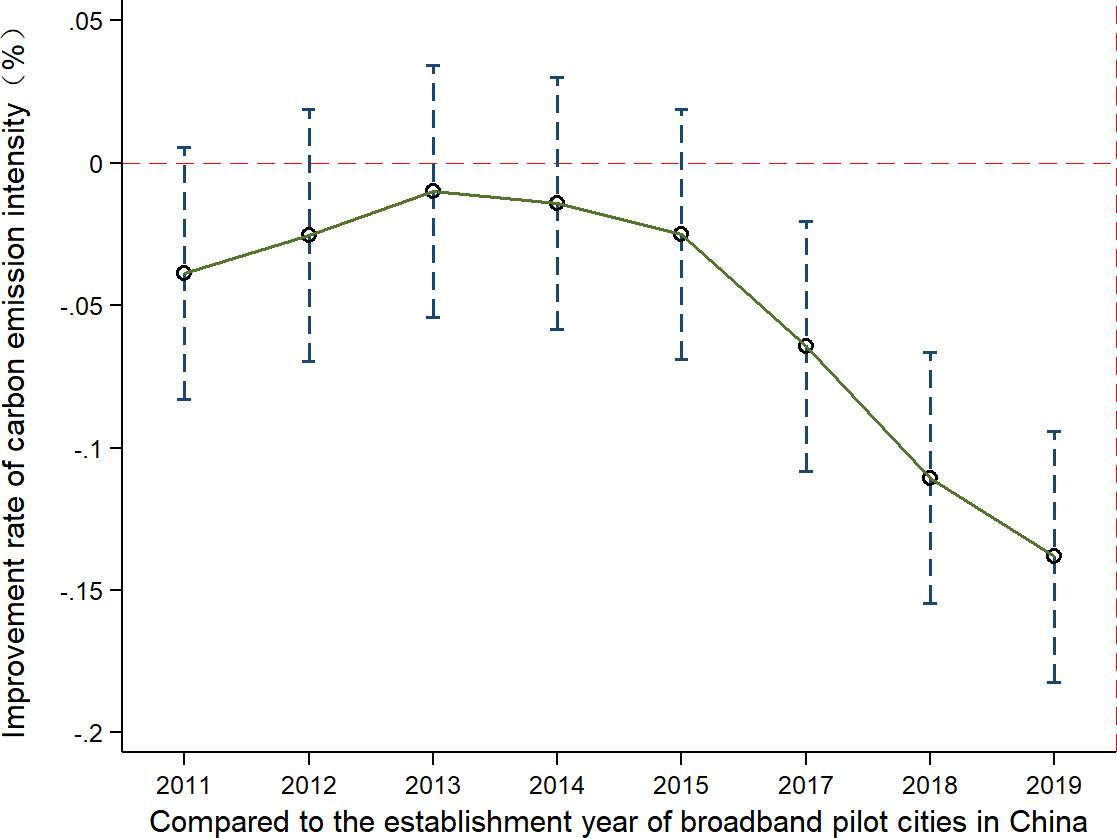
Figure 3 Parallel trend test results.
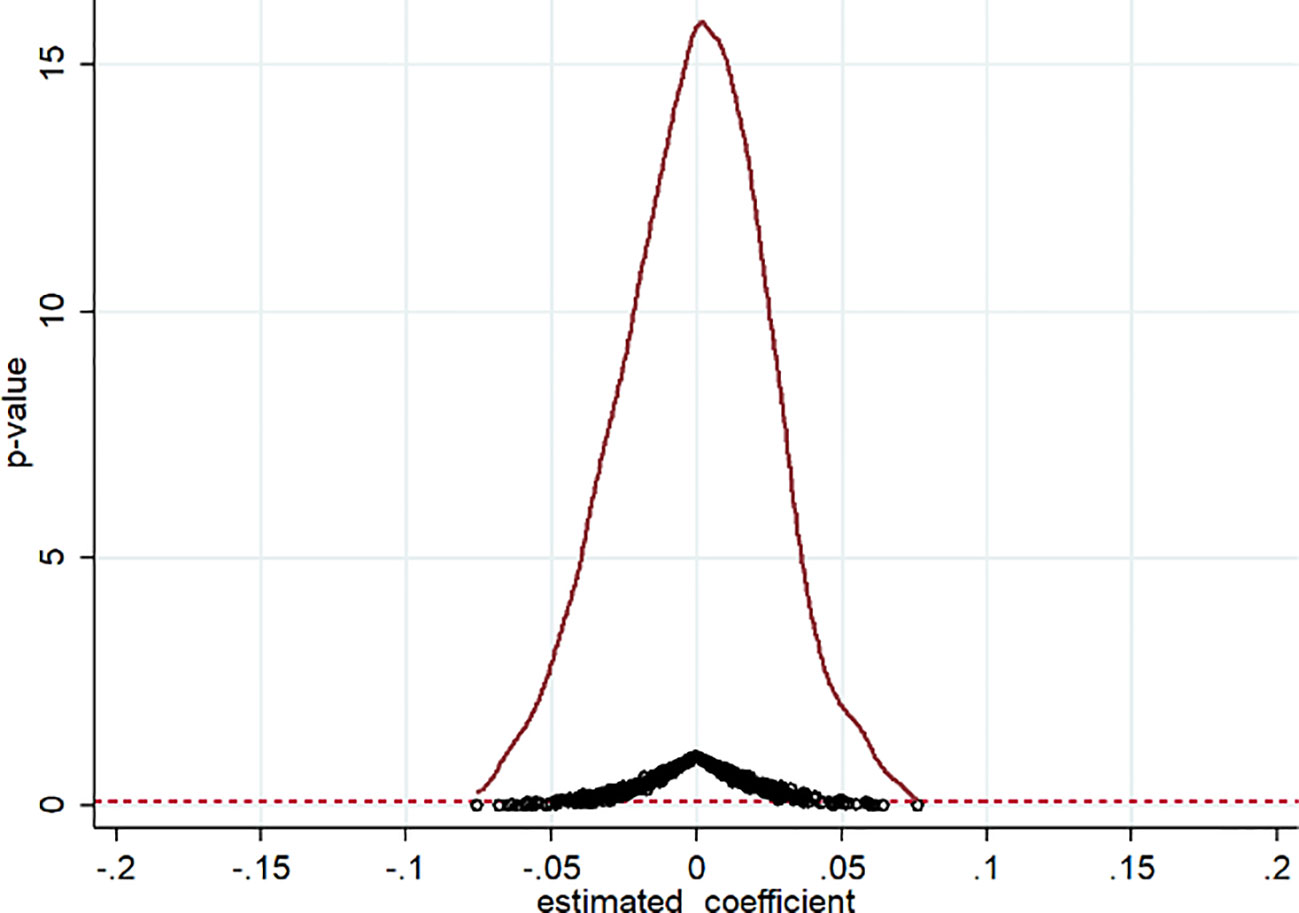
Figure 4 Placebo test results.
The results in Figure 3 show that before the implementation of the “Broadband China” pilot policy, there was no systematic and significant difference in carbon-emission intensity between pilot cities and non-pilot cities. After the implementation of the policy, the differences between the two were significant, meeting the assumption of parallel trends, and the use of Differences-in-Differences is reasonable and effective. Similarly, the results in Figure 4 show that the P value distribution and the regression coefficient kernel density distribution of 500 simulated regressions essentially follow the normal distribution, which also indicates that the regression results are robust.
4.5 Digital economy threshold estimation
Building on the research of Wang and Li (2022), this paper uses the panel-threshold model to test the threshold effect of variables, and the results are shown in Table 6. The results indicate that, with the digital economy () as the threshold variable, the single-threshold test is passed at a significance level of 1%. Furthermore, the double-threshold test is passed at a significance level of 5%, and the triple-threshold test does not pass the significance test.
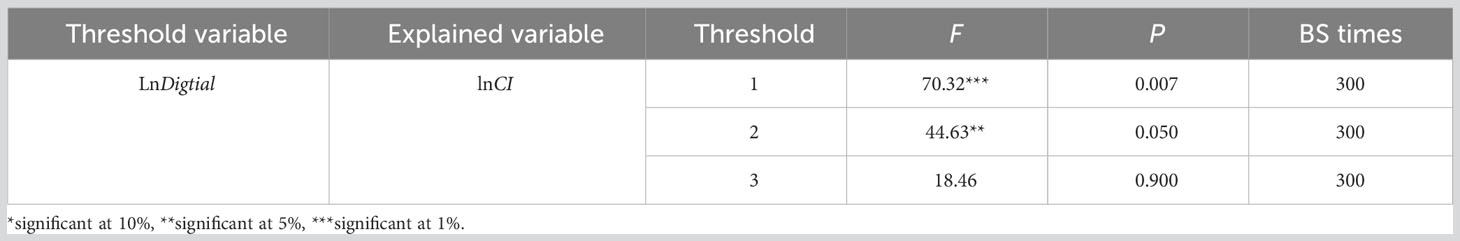
Table 6 Threshold effect self-sampling test.
After the threshold effect self-sampling inspection, the threshold value of the panel threshold model must be estimated and tested, and the results are shown in Table 7 and Figure 5. Table 7 illustrates the estimated values and confidence intervals of the two thresholds of the digital economy. Combined with the likelihood ratio function figure in Figure 5, the construction process of the estimated values and confidence intervals of the two thresholds of the digital economy can be understood more intuitively and clearly. When the likelihood ratio statistic LR takes a value of 0, the estimated values of the double thresholds corresponding to the digital economy are 8.366 and 9.237, respectively. The dotted line in Figure 5 indicates that, under the 95% confidence interval, all LR values of the two threshold estimates of the digital economy are less than the critical value (7.350) at the 5% significance level. Therefore, the digital economy development of China’s 275 prefecture-level cities during the sample period can be divided into three levels: areas with a low level of digital economy development (), areas with a medium level of digital economy development (), and areas with a high level of digital economy development ().

Table 7 Threshold estimation results.
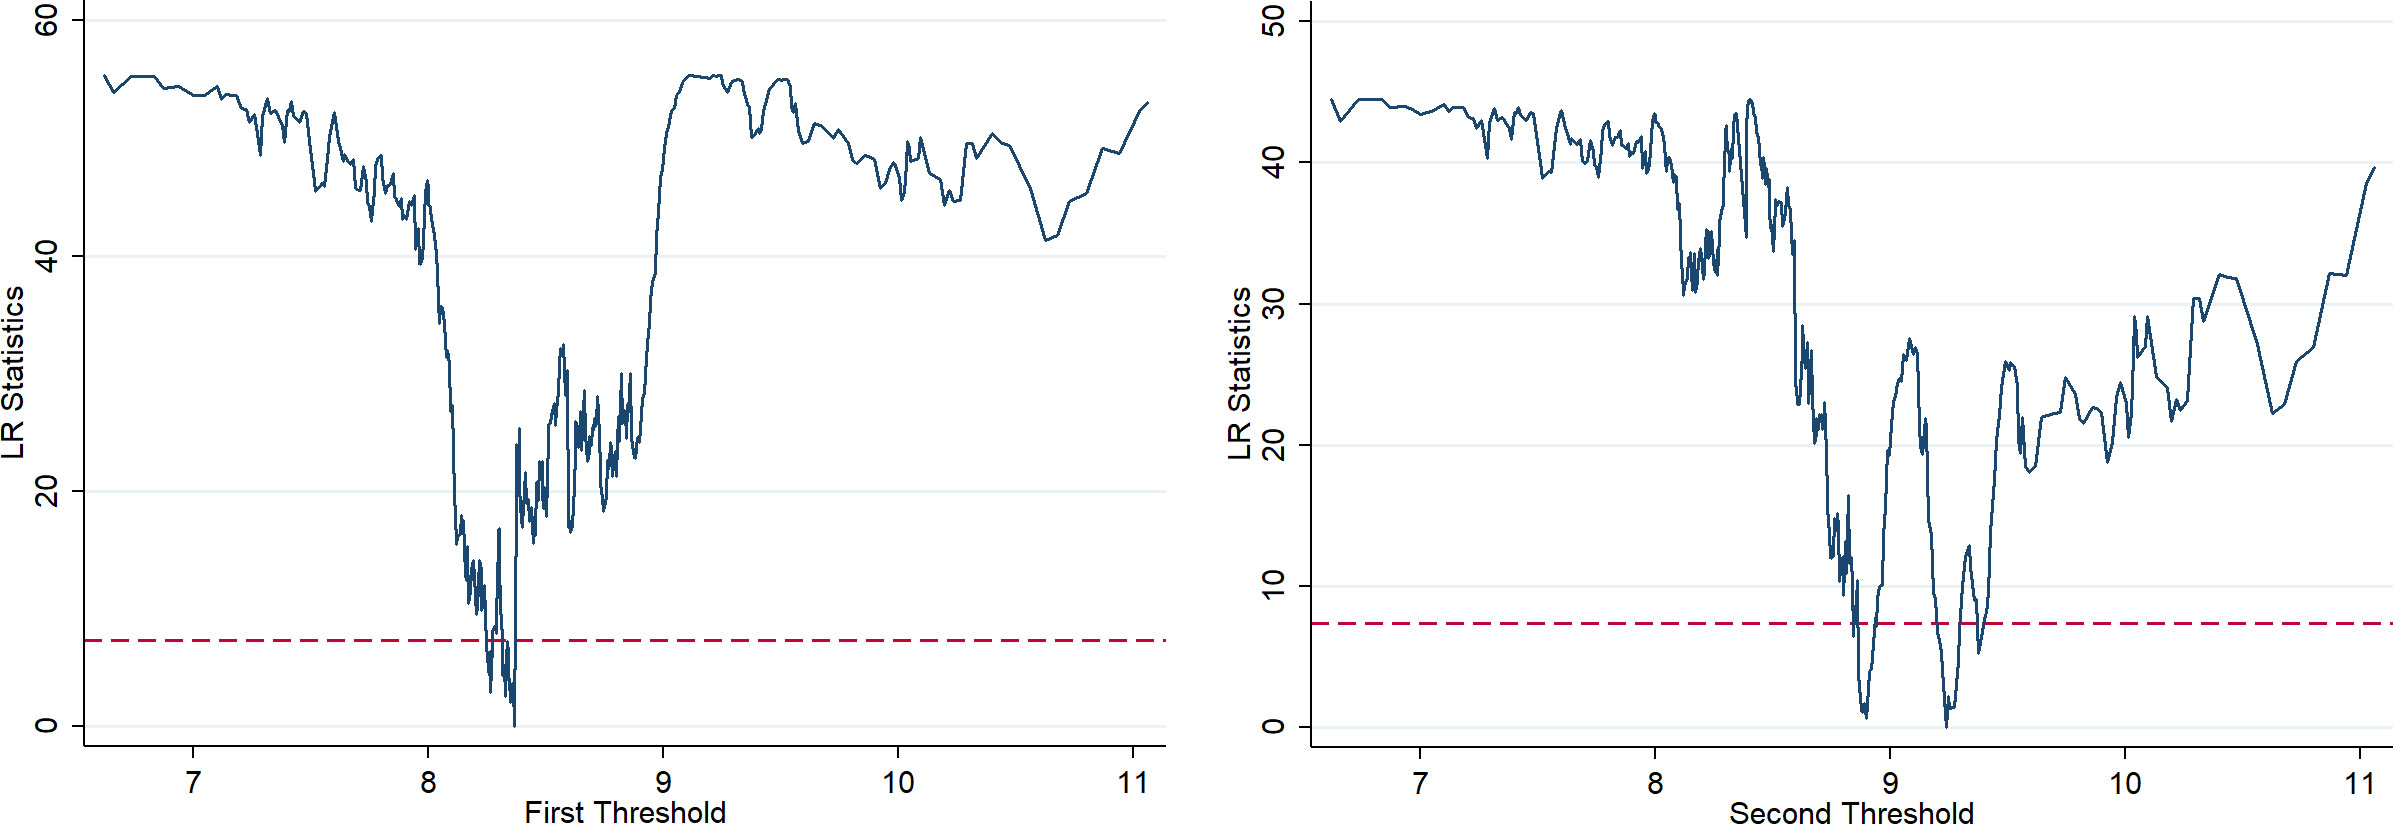
Figure 5 Double threshold estimation results and confidence intervals.
The impact of different types of regional industrial structures on carbon-emission intensity is shown in Table 8. The results demonstrate that the industrial structure of prefecture-level cities in China had different impacts on carbon-emission intensity under different development levels of the digital economy during the sample period. In the low-level digital economy development area, although the significance test is not passed, the industrial structure has a positive impact on carbon-emission intensity, with a coefficient of 0.025. In the middle level of the digital economy development area, the impact of industrial structure on carbon-emission intensity has changed from positive promotion to negative inhibition, with a coefficient of −0.121, and the test is passed at a significance level of 10%. At the high level of digital economy development, the inhibitory effect of industrial structure on carbon-emission intensity is further increased, with a coefficient of −0.307, and the test is passed at a significant level of 1%.
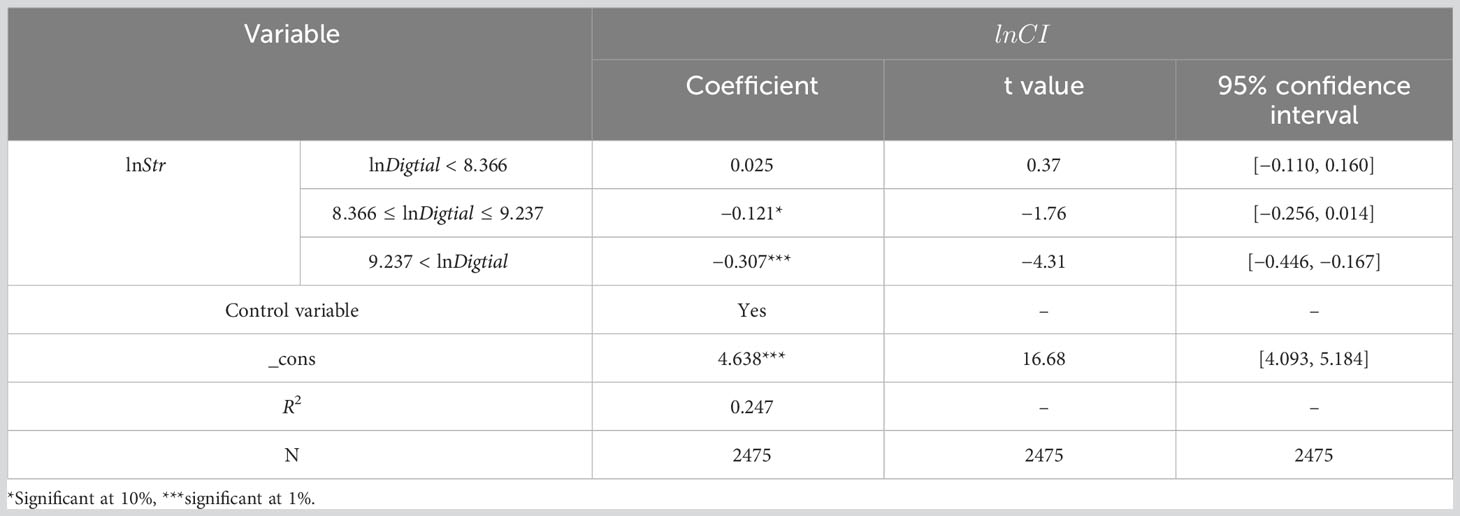
Table 8 Estimation results of the digital economy double-threshold parameters.
The results demonstrate that the impact of industrial structure on carbon-emission intensity, along with the development level of digital economy, presents an inverted U-shaped action path of “first promotion, then inhibition, and then strong inhibition.” This result aligns with the findings of Liu and Zhang (2023), who empirically examine the impact of the digital economy on carbon emissions as well as the mediating and threshold effects of different innovation modes. They found that the effect of the digital economy on carbon emissions has a threshold feature, with an inverted U-shaped relationship between the two, and that an increase in autonomous innovation and imitation innovation can enhance the digital economy’s carbon-reduction effect. This impact path emerges because the increase in the proportion of the tertiary industry may have a restraining effect on carbon-emission intensity, and the quality of the tertiary industry is affected by the development of the digital economy. More specifically, as online sales are favored by consumers, the rapid development of the logistics industry is promoted. Without reaching a certain scale of the digital economy, the rapid development of the logistics industry inevitably leads to a sharp increase in energy consumption and thus carbon emissions. When the development of the digital economy reaches an ideal scale, the technical attributes of the digital economy will likely directly affect low-end industries, reducing their energy dependence and moderately reducing carbon emissions. When the digital economy reaches a larger scale, its structural attributes will likely affect the proportion of industries within the tertiary industry. The service objects of the industry are expected to gradually change from being labor and capital intensive to more advanced-technology intensive. Moreover, the energy dependence of the tertiary industry will likely decrease rapidly, thereby improving carbon-emission intensity significantly.
In summary, we have completed the empirical test of the three hypotheses proposed in Section 2. We found that developing tertiary industries does not reduce urban carbon emissions, and only when the scale of the digital economy reaches a certain level can the tertiary industry effectively reduce urban carbon emissions. In the following discussion section, we will review the main conclusions, research contributions, and limitations of this paper in detail.
In addition, this article defined three intervals for the development level of urban digital economy: is the first interval, is the second interval, and is the third interval. Subsequently, three years of 2011, 2015, and 2019 were selected for cluster analysis of cities in the eastern, central, and western regions of China in different years. The specific results are shown in Figure 6.
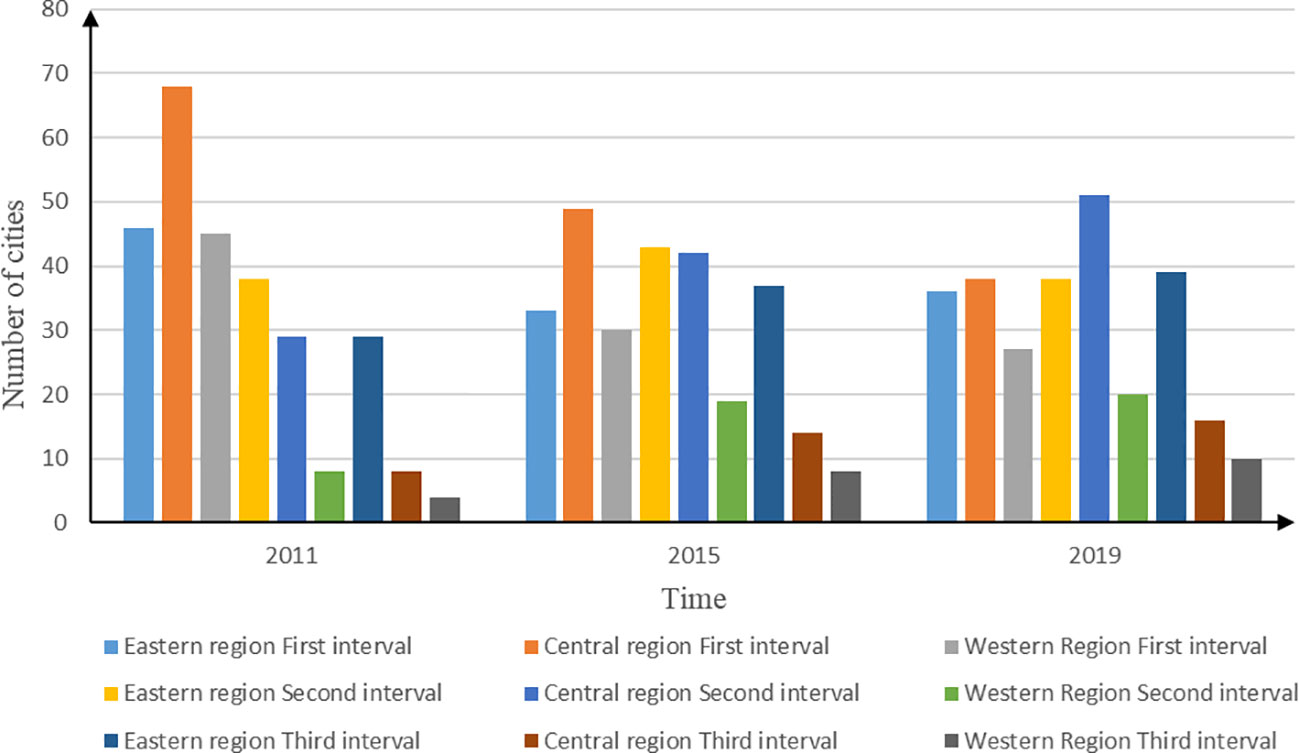
Figure 6 Cluster analysis of cities in different years and intervals.
The results in Figure 6 indicate that the eastern, central, and western regions of China have converged over time in the three levels of digital economy development. The number of cities in the first region gradually decreased, while the number of cities in the second and third regions constantly increased. However, the proportion of cities suggests that the number of cities in the central and western regions increased significantly in the second and third intervals, especially in the third interval, compared to the eastern region. This indicates that the digital economy has had a more significant effect on regulating the carbon reduction effect of industrial upgrading in the central and western regions of China. This also confirms that the digital economy mentioned above is different from the traditional economy and has the characteristics of “inclusive improvement” in carbon-emission reduction.
5 Discussion
This paper examines the current state of the digital economy, industrial upgrading, and carbon emissions across 275 prefecture-level cities in China from 2011 to 2019. It investigates the moderating influence of digital economy development on the effects of industrial upgrading on carbon emissions and employs the digital economy as a threshold variable to analyze the mechanisms and variations in the effects of industrial upgrading on carbon emissions within different threshold ranges. While this study focuses on prefecture-level cities in China, the methodology can be applied to explore the moderating and threshold effects of digital economy development on carbon emissions in other countries worldwide. Furthermore, this study introduces a new research paradigm for investigating energy conservation and carbon-emission reduction in urban areas. The detailed contributions of this paper are as follows.
First, this paper refines the scale of research on the impact of industrial upgrading on urban carbon emissions from the provincial to the prefecture level. Additionally, the spatiotemporal characteristics of the digital economy, industrial upgrading, and urban carbon emissions at the prefecture level are explored using kernel density estimation. The results demonstrate that the levels of digital economy development, industrial upgrading, and carbon-emission intensity in cities all exhibit a unimodal distribution during the sample period. Furthermore, the kurtosis of industrial upgrading and carbon-emission intensity exhibits a decreasing trend each year, indicating that the gap between cities in industrial upgrading and carbon-emission intensity is gradually narrowing. However, the skewness of the level of digital economy development shows an increasing trend each year, suggesting that the gap between cities in the level of digital economy development is widening. In terms of skewness, carbon-emission intensity and the level of digital economy development show a right-skewed trend, while industrial upgrading indicates a left-skewed trend. This suggests that there are still high-emission areas and areas with backward industrial upgrading in prefecture-level cities in China. These findings are consistent with the research conclusions drawn by Zhu Z et al. (2022).
Second, this paper uses a panel-data two-way fixed-effects model, including interaction terms, to analyze the moderating effect of the digital economy on the relationship between industrial upgrading and urban carbon emissions. Endogeneity exploration and robustness tests are conducted to ensure that the analysis results are scientific and accurate. The findings show that both industrial structure and digital economy development have a significant positive impact on urban carbon emissions, with impact coefficients of 1.842 and 0.064, respectively. However, the interaction term between the two has a significant negative impact on urban carbon emissions, with an impact coefficient of −0.162. This indicates that the digital economy can mitigate the negative impact of industrial structural adjustments on carbon emissions. These results align with the findings of Zhang et al. (2022).
Finally, this study constructs a panel threshold model to test the threshold effect of the digital economy on the impact of industrial upgrading on urban carbon emissions. This model aims to explore the mechanisms and heterogeneity of the impact of industrial upgrading on urban carbon emissions at different threshold levels of digital economic development. The findings reveal a double-threshold effect of the digital economy on the impact of industrial upgrading on urban carbon emissions, with threshold values of 8.366 and 9.237. The results also demonstrate significant heterogeneity in the mechanisms of industrial upgrading of urban carbon emissions within different threshold ranges. More specifically, when the level of digital economic development is below the first threshold value, the industrial structure has a positive effect on carbon-emission intensity, with a coefficient of 0.025. After surpassing the first threshold, the effect of the industrial structure changes from a positive promotion to a negative suppression, with a significant coefficient of −0.121 at the statistical level of 10%. When the level of digital economic development surpasses the second threshold, the suppression effect of the industrial structure on carbon-emission intensity further increases, with a significant coefficient of −0.307 at the statistical level of 1%. Therefore, the authors conclude that the impact of the industrial structure on carbon-emission intensity follows a pathway of “first promotion, then suppression, and finally strong suppression” with the increase in the level of digital economic development.
This study has several limitations that should be acknowledged. First, the digital economy is a multifaceted concept, and the evaluation indicators used in this paper, such as the inclusive finance index, the number of people in the information transmission computer service and software industry, the number of internet broadband access users, the number of mobile phone users, and the revenue of the telecommunications industry, may not cover all aspects of the digital economy. Therefore, the indicator system used in this study may require further refinement. Second, the proxy variable used for industrial upgrading – the proportion of the added value of the tertiary industry to GDP – may not fully capture the direction of changes in the industrial structure. To ensure consistency in variable calculation across different cities, this proxy variable was used instead of more direct measures of industrial upgrading. This limitation suggests the need for further research to develop more comprehensive and accurate indicators of industrial upgrading.
6 Conclusions
Building a digital powerhouse and achieving the goals of “carbon peaking and carbon neutrality” are new consensus measures to promote high-quality economic development in the new era. Fully tapping into the energy-saving and emission-reduction “dividends” of the digital economy under the “dual carbon” goal is crucial for breaking the constraints of energy and environment while achieving the modern development of harmonious coexistence between humans and nature. To explore whether the digital economy is a “dividend” or a “negative benefit” for urban energy conservation and emission reduction, this paper used the panel data of 275 prefecture-level cities in China from 2011 to 2019. We adopted the static panel-data interaction-effect model and panel-threshold model to verify the path and heterogeneity of the digital economy to improve urban carbon emissions, which was based on the research hypothesis that the development of the digital economy reduces urban carbon emissions. The main research conclusions are as follows. (1) Affected by the differences in industry characteristics within the tertiary industry, simple industrial restructuring cannot achieve urban carbon emission reduction. On the contrary, an increase in the proportion of tertiary industries will likely further worsen urban carbon emissions. As the object of this study is urban carbon emissions, this conclusion is not completely consistent with the conclusions of existing studies (Pao et al., 2011; Dong et al., 2018). This conclusion indicates that merely increasing the proportion of tertiary industries does not necessarily reduce carbon emissions and achieve green development in urban economies. The key lies in whether the secondary industry with high pollution is reduced and the proportion of high-tech, environmental protection, and high-end tertiary industries is increased (Han and Xie, 2017). (2) The digital economy has a significant inverted U-shaped regulatory effect on the carbon-emission-reduction effect of industrial structure adjustment, and the integrated development of the digital economy and the tertiary industry can achieve urban carbon emission reduction. Existing studies have found that the digital economy and industrial structure upgrading have a synergistic effect on carbon emission reduction (Zhu X et al., 2022; Wang et al., 2022), but the specific effect is still unclear. This conclusion explains why carbon emissions have increased in many places after the development of the digital economy. In addition, this conclusion shows that only when the digital economy develops to a certain extent and fully empowers the upgrading of industrial structures can it play a role in promoting carbon emission reduction. (3) The digital economy has a double-threshold effect in the process of industrial structure adjustment to promote carbon emission reduction, and the thresholds are 8.366 and 9.237, respectively. Based on how existing studies have recognized that industrial digitalization has a positive impact on energy conservation and emission reduction (Li and Huang, 2022; Zhang and Li, 2022), this conclusion further clarifies that industrial digitalization has a threshold effect in achieving carbon-emission reduction. Only when the digital economy reaches a certain scale can the adjustment of industrial structure exert its carbon-emission-reduction effect. With the continuous expansion of the scale of the digital economy, the carbon-emission-reduction effect of industrial structure adjustment will likely continue to increase significantly.
Based on the research conclusions of this paper, the authors offer the following policy recommendations. First, in the process of upgrading industrial structures, all regions should not only increase the proportion of the service industry but also encourage the development of high-end service industries. In other words, under the “dual carbon” goal and in the process of adjusting industrial structures and transforming economic growth modes, all regions should further increase the proportion and development speed of high-end industries in the tertiary industry. These regions should also promote the embedding of high-end industries in the manufacturing value chain and the transformation of the manufacturing industry from high energy dependence and high emissions to low emissions and low energy dependence. This suggestion can also provide a reference for other developing countries. Second, drawing on the experience of developed countries in Europe and America, local governments should pay attention to the coordinated development of digital industrialization and industrial digitalization. In other words, based on strengthening the innovation of digital technology, the integration of big data, AI, cloud computing, block chain, and other digital technologies with medium- and low-end industries in the tertiary industry should be strengthened. This creates opportunities regarding the technical-attribute dividends of the digital economy, further saves energy consumption in medium and low-end industries, and realizes energy conservation and emission reduction. Third, the spillover effect of the digital economy on carbon emissions reduction should be expanded. The digital economy can achieve cross-spatial trade cooperation and knowledge sharing, drive the joint development of upstream and downstream enterprises in the industry, and promote the dissemination and diffusion of green and low-carbon concepts. It not only has a significant impact on local carbon emissions but also significantly reduces the carbon-emission intensity of neighboring countries or regions. Finally, it creates opportunities for the synergistic effect of government and market in the low-carbon development of the industrial economy. On the one hand, efforts should be made to change the unbalanced distribution of digital infrastructure among cities. On the other hand, digital technologies, especially energy-saving and emission-reduction digital technologies, should be shared among cities to break through the “digital economic divide” between cities and realize the “inclusive improvement” of overall carbon emissions in cities.
Data availability statement
The original contributions presented in the study are included in the article/supplementary material. Further inquiries can be directed to the corresponding author.
Author contributions
All authors contributed to the study’s conception and design. Material preparation, data collection, and analysis were performed by HJ, ZHC, and YL. The first draft of the manuscript was written by HJ and ZHC, and by ZYC. WZ, DL, and ZYC commented on previous versions of the manuscript. All authors read and approved the final manuscript.
Funding
This work was supported by “Liaoning Social Science Planning Fund Project (grant no. L20BJY033)” and “Jiangsu Province University Philosophy and Social Science Major Project (grant no. 2023SJZD060)”.
Conflict of interest
The authors declare that the research was conducted in the absence of any commercial or financial relationships that could be construed as a potential conflict of interest.
Publisher’s note
All claims expressed in this article are solely those of the authors and do not necessarily represent those of their affiliated organizations, or those of the publisher, the editors and the reviewers. Any product that may be evaluated in this article, or claim that may be made by its manufacturer, is not guaranteed or endorsed by the publisher.
Footnotes
References
CAICT (2021). White paper on China's digital economy development. Beijing: China Academy of Information and Communications Technology. Available at: http://www.caict.ac.cn/english/research/whitepapers/202104/t20210429_375940.html.
Chen L., Lu Y., Meng Y., Zhao W. (2023). Research on the nexus between the digital economy and carbon emissions – evidence at China's province level. J. Clean Prod. 413, 137484. doi: 10.1016/j.jclepro.2023.137484
Crompton P., Wu Y. (2005). Energy consumption in China: past trends and future directions. Energ. Econ. 27, 195–208. doi: 10.1016/j.eneco.2004.10.006
Dong F., Hu M., Gao Y., Liu Y., Zhu J., Pan Y. (2022). How does digital economy affect carbon emissions? Evidence from global 60 countries. Sci. Total Environ. 852, 158401. doi: 10.1016/j.scitotenv.2022.158401
Dong K., Sun R., Jiang H., Zeng X. (2018). CO2 emissions, economic growth, and the environmental Kuznets curve in China: what roles can nuclear energy and renewable energy play? J. Clean. Prod. 196, 51–63. doi: 10.1016/j.jclepro.2018.05.271
Du Q., Zhou J., Pan T., Sun Q., Wu M. (2019). Relationship of carbon emissions and economic growth in China's construction industry. J. Clean. Prod. 220, 99–109. doi: 10.1016/j.jclepro.2019.02.123
Guo F., Wang J., Wang F., Kong T., Zhang X., Cheng Z. (2020). Measuring China’s digital financial inclusion: index compilation and spatial characteristics. China Q. Econ. 19, 1401–1418. doi: 10.13821/j.cnki.ceq.2020.03.12
Han F., Xie R. (2017). Does the agglomeration of producer services reduce carbon emissions? J. Quant. Technol. Econ. 34, 40–58. doi: 10.13653/j.cnki.jqte.2017.03.003
Hu J. (2023). Synergistic effect of pollution reduction and carbon emission mitigation in the digital economy. J. Environ. Manage. 337, 117755. doi: 10.1016/j.jenvman.2023.117755
Hu A., Sun J. (2022). Industrial and spatial maps, transfer among provinces of carbon emissions, and suggestions on the peak of carbon emissions in China. Econ. Rev. J. 438, 73–82. doi: 10.16528/j.cnki.22-1054/f.202205073
Irfan M., Elavarasan R. M., Hao Y., Feng M., Sailan D. (2021). An assessment of consumers’ willingness to utilize solar energy in China: End-users’ perspective. J. Clean. Prod. 292, 126008. doi: 10.1016/j.jclepro.2019.02.123
Jiang W., Sun Y. (2023). Which is the more important factor of carbon emission, coal consumption or industrial structure? Energy Policy. 176, 113508. doi: 10.1016/j.enpol.2023.113508
Kuang B., Lu X., Zhou M., Chen D. (2020). Provincial cultivated land use efficiency in China: Empirical analysis based on the SBM-DEA model with carbon emissions considered. Technol. Forecast. Soc Change 151, 119874. doi: 10.1016/j.techfore.2019.119874
Li S., Huang Z. (2022). Digital economy and high-quality development: mechanisms and evidence. China Q Econ. 22, 1699–1716. doi: 10.13821/j.cnki.ceq.2022.05.12
Li Z., Wang J. (2022). The dynamic impact of digital economy on carbon emission reduction: evidence city-level empirical data in China. J. Clean Prod. 351, 131570. doi: 10.1016/j.jclepro.2022.131570
Li Y., Yang X. D., Ran Q. Y., Wu H. T., Irfan M., Ahmad M. (2021). Energy structure, digital economy, and carbon emissions: evidence from China. Environ. Sci. pollut. Res. 28, 64606–64629. doi: 10.1007/s11356-021-15304-4
Li Z., Zhu B., Ma X. (2022). Conducted research on the coordinated development of industrial digitization and opening-up in disadvantaged areas under the goals of carbon peaking and neutrality. Intertrade 489, 49–59. doi: 10.14114/j.cnki.itrade.2022.09.007
Liang X., Lin S., Bi X., Lu Y., Li Z. (2021). Chinese construction industry energy efficiency analysis with undesirable carbon emissions and construction waste outputs. Environ. Sci. pollut. Res. 28, 15838–15852. doi: 10.1007/s11356-020-11632-z
Lin B., Benjamin N. I. (2017). Influencing factors on carbon emissions in China transport industry. A new evidence from quantile regression analysis. J. Clean Prod. 150, 175–187. doi: 10.1016/j.jclepro.2017.02.171
Lin B., Du Z. (2015). How China's urbanization impacts transport energy consumption in the face of income disparity. Renew. Sust. Energ. Rev. 52, 1693–1701. doi: 10.1016/j.rser.2015.08.006
Lin B., Huang C. (2022). Analysis of emission reduction effects of carbon trading: Market mechanism or government intervention? Sustain. Prod. Consump. 33, 28–37. doi: 10.1016/j.spc.2022.06.016
Lin B., Jiang Z. (2009). Prediction and influencing factors of the environmental Kuznets curve of carbon dioxide in China. J. Manage. World. 187, 27–36. doi: 10.19744/j.cnki.11-1235/f.2009.04.004
Lin B. Q., Li J. L. (2015). Transformation of China’s energy structure under environmental governance constraints: A peak value analysis of coal and carbon dioxide. Soc Sci. China. 237, 84–107+205.
Liu T., Zhang K. (2023). Effects of the digital economy on carbon emissions in China: an analysis based on different innovation paths. Environ. Sci. pollut. Res., 1–18. doi: 10.1007/s11356-023-27975-2
Ma Q., Khan Z., Tariq M., Isik H., Rjoub H. (2022). Sustainable digital economy and trade adjusted carbon emissions: Evidence from China’s provincial data. Ekon. Istraz. 35, 5469–5485. doi: 10.1080/1331677X.2022.2028179
National Bureau of Statistics of China (2012–2020a). China statistical yearbook. Beijing: National Bureau of Statistics of China. Available at: http://www.stats.gov.cn/english/Statisticaldata/yearbook/.
National Bureau of Statistics of China (2012–2020b). China city statistical yearbook. Beijing: National Bureau of Statistics of China.
National Bureau of Statistics of China (2012–2020c). China energy statistical yearbook. Beijing: National Bureau of Statistics of China.
National Bureau of Statistics of China (2012–2020d). China environmental statistical yearbook. Beijing: National Bureau of Statistics of China.
Pao H., Yu H., Yang Y. (2011). Modeling the CO2 emissions, energy use, and economic growth in Russia. Energy 36(8), 5094–5100. doi: 10.1016/j.energy.2011.06.004
Sarkodie S. A., Strezov V. (2019). Effect of foreign direct investments, economic development and energy consumption on greenhouse gas emissions in developing countries. Sci. Total Environ. 646, 862–871. doi: 10.1016/j.scitotenv.2018.07.365
Shi D. (2022). Evolution of industrial development trend under digital economy. China Ind. Econ. 416, 26–42. doi: 10.19581/j.cnki.ciejournal.2022.11.001
Sorrell S., Gatersleben B., Druckman A. (2020). The limits of energy sufficiency: A review of the evidence for rebound effects and negative spillovers from behavioral change. Energy Res. Soc Sci. 64, 101439. doi: 10.1016/j.erss.2020.101439
Sun Y., Qian L., Liu Z. (2021). The carbon emissions level of China’s service industry: an analysis of characteristics and influencing factors. Environ. Dev. Sustain. 24, 13557–13582. doi: 10.1007/s10668-021-02001-y
Tang K., Yang G. (2023). Does digital infrastructure cut carbon emissions in Chinese cities? Sustain. Prod. Consump. 35, 431–443. doi: 10.1016/j.spc.2022.11.022
Wang J., Dong K., Sha Y., Yan C. (2022). Envisaging the carbon emissions efficiency of digitalization: The case of the internet economy for China. Technol. Forecast. Soc Change 184, 121965. doi: 10.1016/j.techfore.2022.121965
Wang Q., Li H. (2022). Measuring regional efficiency of energy and carbon dioxide emission in China dased on uncertain environmental DEA model. Soft. Sci. 36, 78–83. doi: 10.13956/j.ss.1001-8409.2022.08.11
Wang K., Wu M., Sun Y., Shi X., Sun A., Zhang P. (2019). Resource abundance, industrial structure, and regional carbon emissions efficiency in China. Resour. Policy. 60, 203–214. doi: 10.1016/j.resourpol.2019.01.001
Wen H., Chen W., Zhou F. (2023). Does digital service trade boost technological innovation? International evidence. Socio-Econ. Plan. Sci. 88, 101647. doi: 10.1016/j.seps.2023.101647
Wen H., Jiang M., Zheng S. (2022). Impact of information and communication technologies on corporate energy intensity: Evidence from cross-country micro data. J. Environ. Plan. Manage., 1–22. doi: 10.1080/09640568.2022.2141104
Wu L., Sun L., Qi P., Ren X., Sun X. (2021). Energy endowment, industrial structure upgrading, and CO2 emissions in China: Revisiting resource curse in the context of carbon emissions. Resour. Policy. 74, 102329. doi: 10.1016/j.resourpol.2021.102329
Xu M., Deng C., Liu D. (2022). Digital economy leading high-quality economic development: mechanism and prospect. Contemp Econ Manage. 45, 66–72. doi: 10.13253/j.cnki.ddjjgl.2023.02.009
Xu L., Fan M. T., Yang L. L., Shao S. (2021). Heterogeneous green innovations and carbon emission performance: Evidence at China's city level. Energ. Econ. 99, 105269. doi: 10.1016/j.eneco.2021.105269
Xuan Y. (2017). Hierarchical division of productive service industries and manufacturing efficiency: an empirical study based on 38 cities in the Yangtze River. Delta. region Ind. Econ. Res. 70, 1–10. doi: 10.13269/j.cnki.ier.2014.03.001
Zhang N., Choi Y. (2013). Total-factor carbon emission performance of fossil fuel power plants in China: A metafrontier non-radial Malmquist index analysis. Energ. Econ. 40, 549–559. doi: 10.1016/j.eneco.2013.08.012
Zhang F., Deng X. Z., Phillips F., Fang C. L., Wang C. (2020). Impacts of industrial structure and technical progress on carbon emission intensity: Evidence from 281 cities in China. Technol. Forecast. Soc Change 154, 119949. doi: 10.1016/j.techfore.2020.119949
Zhang Z., Li Y. (2022). Research on the impact of the digital economy on carbon emissions in China theory. Pract. Financ. Econ. 43, 146–154. doi: 10.16339/j.cnki.hdxbcjb.2022.05.019
Zhang W., Liu X., Wang D., Zhou J. (2022). Digital economy and carbon emission performance: Evidence at China's city level. Energy Policy. 165, 112927. doi: 10.1016/j.enpol.2022.112927
Zhang Y., Xu X. (2022). Carbon emission efficiency measurement and influencing factor analysis of nine provinces in the Yellow River basin: Based on SBM-DDF model and Tobit-CCD model. Environ. Sci. pollut. Res. 29, 33263–33280. doi: 10.1007/s11356-022-18566-8
Zhao S., Peng D., Wen H., Wu Y. (2022). Nonlinear and spatial spillover effects of the digital economy on green total factor energy efficiency: Evidence from 281 cities in China. Environ. Sci. pollut. Res., 1–21. doi: 10.1007/s11356-022-22694-6
Zhong Z., Chen Z., He L. (2022). Technological innovation, industrial structural change and carbon emission transferring via trade – An agent-based modeling approach. Technovation 110, 102350. doi: 10.1016/j.technovation.2021.102350
Zhu Z., Liu B., Yu Z., Cao J. (2022). Effects of the digital economy on carbon emissions: Evidence from China. Int. J. Environ. Res. Public. Health 19, 9450. doi: 10.3390/ijerph19159450
Keywords: carbon-emission intensity, industrial structure, digital economy, panel threshold model, nonlinear relation
Citation: Jiang H, Chen Z, Liang Y, Zhao W, Liu D and Chen Z (2023) The impact of industrial structure upgrading and digital economy integration on China’s urban carbon emissions. Front. Ecol. Evol. 11:1231855. doi: 10.3389/fevo.2023.1231855
Received: 31 May 2023; Accepted: 14 August 2023;
Published: 28 August 2023.
Edited by:
Xunpeng Roc Shi, University of Technology Sydney, AustraliaReviewed by:
Huwei Wen, Nanchang University, ChinaChang Xu, Anhui University of Finance and Economics, China
Yantuan Yu, Guangdong University of Foreign Studies, China
Copyright © 2023 Jiang, Chen, Liang, Zhao, Liu and Chen. This is an open-access article distributed under the terms of the Creative Commons Attribution License (CC BY). The use, distribution or reproduction in other forums is permitted, provided the original author(s) and the copyright owner(s) are credited and that the original publication in this journal is cited, in accordance with accepted academic practice. No use, distribution or reproduction is permitted which does not comply with these terms.
*Correspondence: Zhenhuan Chen, czh2017@nefu.edu.cn