Potentially differential impacts on niche overlap between Chinese endangered Zelkova schneideriana and its associated tree species under climate change
 Yanrong Zhou
 Xin Lu
 Guangfu Zhang
- Jiangsu Key Laboratory of Biodiversity and Biotechnology, School of Life Sciences, Nanjing Normal University, Nanjing, China
Climate change has a significant impact on the potential distribution for endangered trees. However, to date, little is known about how the endangered trees and main associated ones in different types of subtropical forests respond to climate change. Here, we first selected the endangered Zelkova schneideriana endemic to China and its associated trees as focus species from two subtropical forest communities (i.e. deciduous broad-leaf forest, bamboo and broad-leaf mixed forest) in China, and divided them into two species pairs: Z. schneideriana vs. Celtis sinensis, and Z. schneideriana vs. Phyllostachys edulis. Then, we simulated the three species’ suitable areas under current and future climate scenarios using Maxent based on the occurrence records and environmental variables, and further measured niche overlap between each species pair over time. Our Maxent showed: (1) Temperature-related factors have greater influence on Z. schneideriana than the other factors. The most important factor influencing its population distribution was Min temperature of coldest month (Bio6), followed by Mean diurnal range (Bio2), with the total contribution of 78.9%. (2) Currently, the suitable area of Z. schneideriana was predicted to be 106.50 × 10⁴ km2, mostly located in the subtropical region of China, especially in Anhui, Hubei, Hunan, Jiangsu, and Zhejiang provinces. (3) Its suitable area would decrease and its average migration distance was 19.72 km under 16 future climate scenarios, with the core distribution migrating northeast. (4) There is an asynchrony of potential niche overlap between species pairs. One species pair with C. sinensis will rise in terms of Schoener’s D and I values whereas the other one with P. edulis will decline in the future. This asynchrony can be ascribed to the different future suitable ranges of these focus species as well as their ecological characteristics. Our study provides a new perspective on the conservation for endangered trees and surrounding neighbors in Chinese subtropical forests.
1 Introduction
Climate change has a profound impact on the growth and distribution for global trees. With global warming, it will change the atmospheric circulation, the global water cycle, and also increase the severity of wet and dry events (Diffenbaugh et al., 2017). The impact of climate change on endangered tree species is likely to be more serious because they tend to have small populations, limited geographical distributions and low genetic diversity (Zhang et al., 2022). Therefore, they are less tolerant to climate change than common tree species. Since the Fourth Industrial Revolution, the growing global warming has caused the loss of the suitable areas for many species and may exacerbate the problem of their habitat fragmentation (Ye et al., 2021). As a result, some of them are even on the verge of extinction and biodiversity is seriously affected (Vincent et al., 2020). In fact, such climate change has a marked impact on endemic and endangered tree species (Abolmaali et al., 2018; Yan and Zhang, 2022). Therefore, it is of great importance to explore the response of these tree species to climate change for formulating corresponding conservation strategies.
A majority of endangered tree species often occur in separate natural forests in the form of population. Previous researches have demonstrated that climate change may disrupt the existing species interactions because different species responds distinctively to climate change in phenological rhythm, physiological ecology, extinction risk, and potential distribution (Bellard et al., 2012; Ovaskainen et al., 2013; Vitasse et al., 2021; McNichol and Russo, 2023; Zurell et al., 2023). Therefore, we speculate that for a certain endangered species in different types of forest communities, the dominant tree species may have different responses to climate change. Accordingly, the ecological relationship between these dominants and their major neighbors in different communities may also take a change in the context of future scenarios. However, to date, there are no available reports on how climate change affects endangered tree species and their associated ones in subtropical forest communities.
Theoretically, it is possible to select several keystone species from a functional group in a forest community and to explore their response to future climate change. This should be useful to advance our broader understanding of evolutionary, ecological or conservation theories. A keystone species is referred to be “a strongly interacting species whose top-down effect on species diversity and competition is large relative to its biomass dominance within a functional group” (Davic, 2003). In general, dominant tree species play a significant role in the structure and function of subtropical forest communities which usually comprise a great number of plant species (Shao and Zhang, 2021). However, dominant species are different from keystone species. For a certain candidate keystone species, only by removing or adding experiments to determine its impact on biodiversity within a functional group (Zhang and Zang, 2007), we can determine whether it is a real key species. This is particularly difficult to achieve it in a subtropical forest community which harbors an endangered tree species. Therefore, the dominant species in the tree layer can be roughly regarded as focus species when addressing the response of forest communities to climate change.
Zelkova schneideriana Hand.-Mazz. is a deciduous tree of the Ulmaceae family. It is one of the main afforestation tree species in Chinese subtropical regions because of its high quality timber and being resistant to decay (Fu et al., 2003). Due to its straight trunk, a large crown, attractive exfoliating bark, and yellowish-red leaves in autumn (Figure 1A), it is also used as an excellent greening species in China (Zhang, 2020). In addition, fiber can be extracted from its bark and thus used to make paper and rope. In recent decades, the population size and distribution area of Z. schneideriana have been shrunk due to habitat destruction and human deforestation (Liu et al., 2016). Therefore, this species was listed as one of the key protected wild plants of China in 1999. It has been ranked as a rare and endangered plant of second-grade protection of China since 2021. Additionally, it is listed vulnerable in China in the IUCN red list (https://www.iucnredlist.org/species/131155456/131155458, access on 5th of June, 2023).
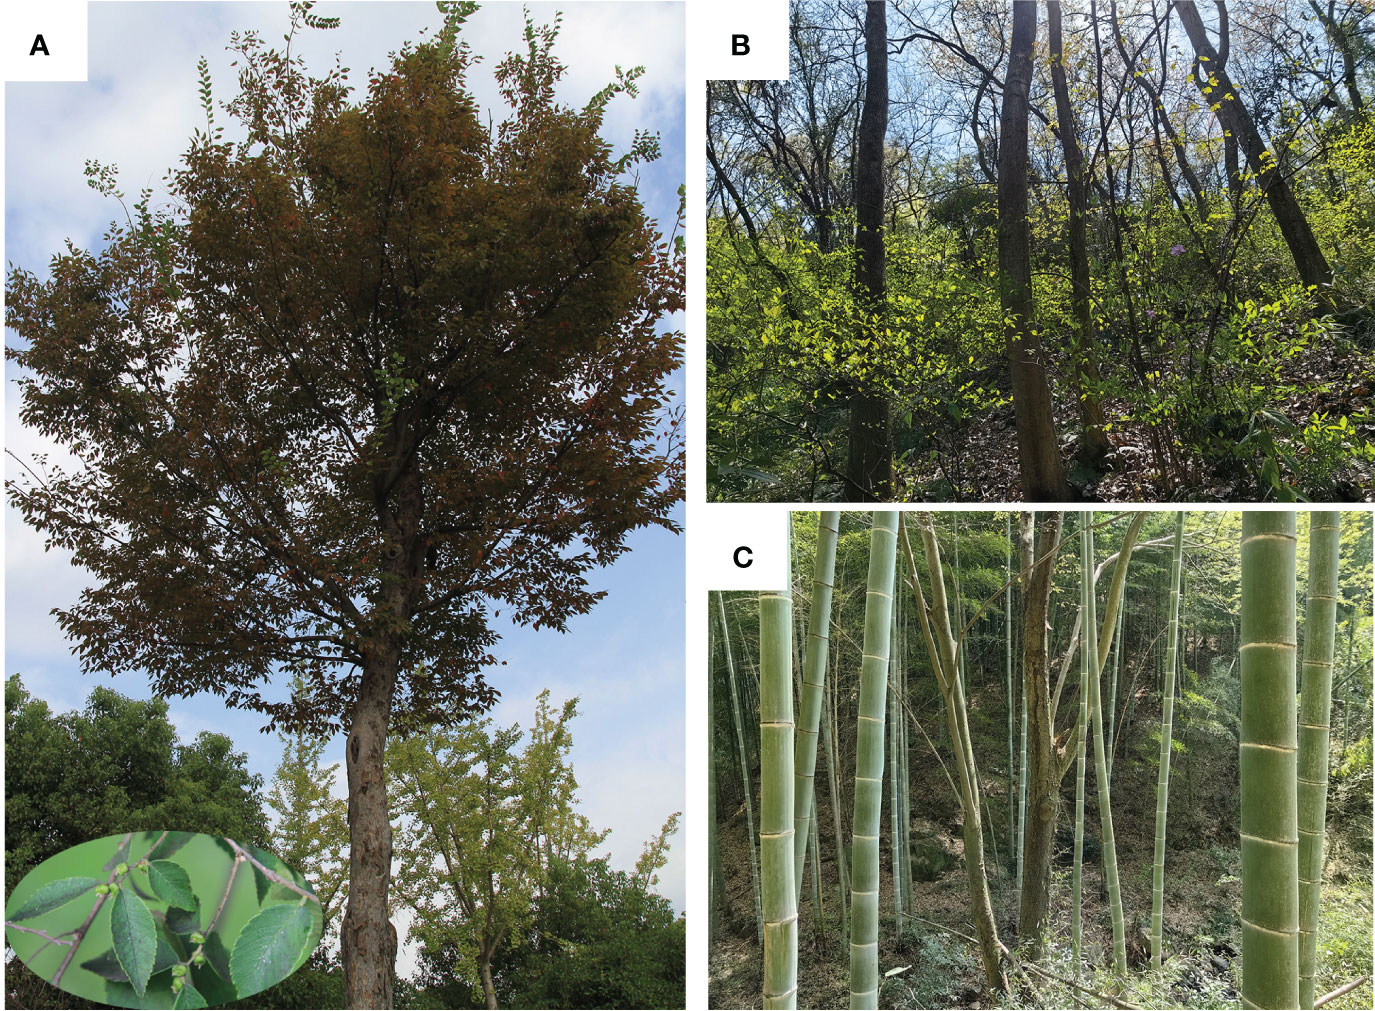
Figure 1 Zelkova schneideriana plants and communities. (A) An individual plant, showing yellowish-red leaves in autumn, gray twigs with green drupes during summer at the bottom left. The lower left corner shows a partial enlargement of the fruit. (B) Deciduous broad-leaf forest. (C) Bamboo and broad-leaf mixed forest. The photographs were taken by Guangfu Zhang.
At present, there are different views on the geographical distribution of Z. schneideriana which is a light-demanding tree endemic to China. According to Flora of China (Vol.5), Z. schneideriana is distributed in 16 provinces of China (Fu et al., 2003). According to first national survey of key protected wild plant resources, this species is mainly distributed in subtropical zones of China (Ma and Zhang, 2009). More recently, it is reported that it occurs in 18 provinces (Yin, 2013). Based on existing data, specimen records and field investigations in recent years, Z. schneideriana is found in 19 provinces including Anhui, Fujian, Gansu, Guangdong, Guangxi, Guizhou, Henan, Hubei, Hunan, Jiangsu, Jiangxi, Liaoning, Shaanxi, Shandong, Sichuan, Taiwan, Xizang, Yunnan, and Zhejiang provinces. Most recently, Sun et al. (2020) point out that future climate change will reduce its distribution range and it will migrate northward in China. However, it should be noted that they do not distinguish wild from cultured occurrence records of Z. schneideriana in their study. A case in point is the occurrence record (i.e. 41.003°N, 117.940°E) in Hebei Province, northern China. The longitude and latitude of this occurrence point is derived from “Appendix A” in the article of Sun et al. (2020). Indeed, there is no wild population of Z. schneideriana in Hebei Province (He, 1986; http://lycy.hebei.gov.cn/zhiwu/index.php; Personal communication from Dr. Liu Quanru). Thus, it is worth further researching on its habitat suitability of this species under current and future climatic scenarios.
Recent studies have shown that Z. schneideriana can be found in a variety of community types, including evergreen broad-leaf forest, deciduous broad-leaf forest, bamboo and broad-leaf mixed forest, and coniferous broad-leaf mixed forest (Ma and Zhang, 2009; Shao and Zhang, 2021). Based on our field survey over the past decade, we have noted that Z. schneideriana mainly occurs in two types of forest communities in subtropics of China, which are deciduous broad-leaf forest, bamboo and broad-leaf mixed forest. In the deciduous broad-leaf forest, the dominant tree species mainly include Z. schneideriana and C. sinensis (Figure 1B). In contrast, P. edulis population predominates the bamboo and broad-leaf mixed forest, followed by Z. schneideriana (Figure 1C). For example, in terms of importance value Z. schneideriana is the largest (37.96%), followed by C. sinensis (15.02%) in the deciduous broad-leaf forest from the mountains of Southern Jiangsu, eastern China (Shao and Zhang, 2021). For this reason, here we selected the three tree species as the study objects in this study. They usually appear as dominant species in the tree layer of subtropical forest communities in China. Furthermore, we then divided them into two species pairs: Z. schneideriana vs. C. sinensis, Z. schneideriana vs. P. edulis.
Species distribution models (SDMs) are important tools which use occurrence record and environmental data to forecast the distribution of a species across space and time with specific algorithms. Currently, among the various SDMs: DOMAIN (domain model), GARP (genetic algorithm model) and Maxent (maximum entropy model) (Midgley and Thuiller, 2005; Phillips and Dudík, 2008), Maxent model shows excellent simulation accuracy, especially good prediction for small sample data. Accordingly, it is one of the most widely used SDMs (Merow et al., 2014; Lu et al., 2022). Nowadays, Maxent model has been extensively applied to predict endangered plants’ distribution and thereby contributes to achieve efficient conservation (Abolmaali et al., 2018; Chen et al., 2020).
In this study, we evaluate the suitability of potential distribution for the endangered tree species and associated ones in different types of subtropical forests at spatial and temporal scales by using the Maxent model. And we assess the future impacts of global climate change on such threatened species and associated ones concurrently in subtropical forests for the first time. More specifically, we address the following questions: (1) To identify the key environmental factors influencing the distribution of Z. schneideriana, C. sinensis and P. edulis. (2) To predict their suitable areas under current and future climate scenarios, and quantify their migration trend by calculating the core distribution for each species. (3) To calculate and compare niche overlap between each species pair over time. (4) To provide some suggestions for protection of the endangered trees in the context of future climate change. The objective of this study is to explore how the endangered trees and associated ones in different types of subtropical forests respond to climate change.
2 Materials and methods
The overall Maxent modeling framework for the three species is summarized in Figure 2.
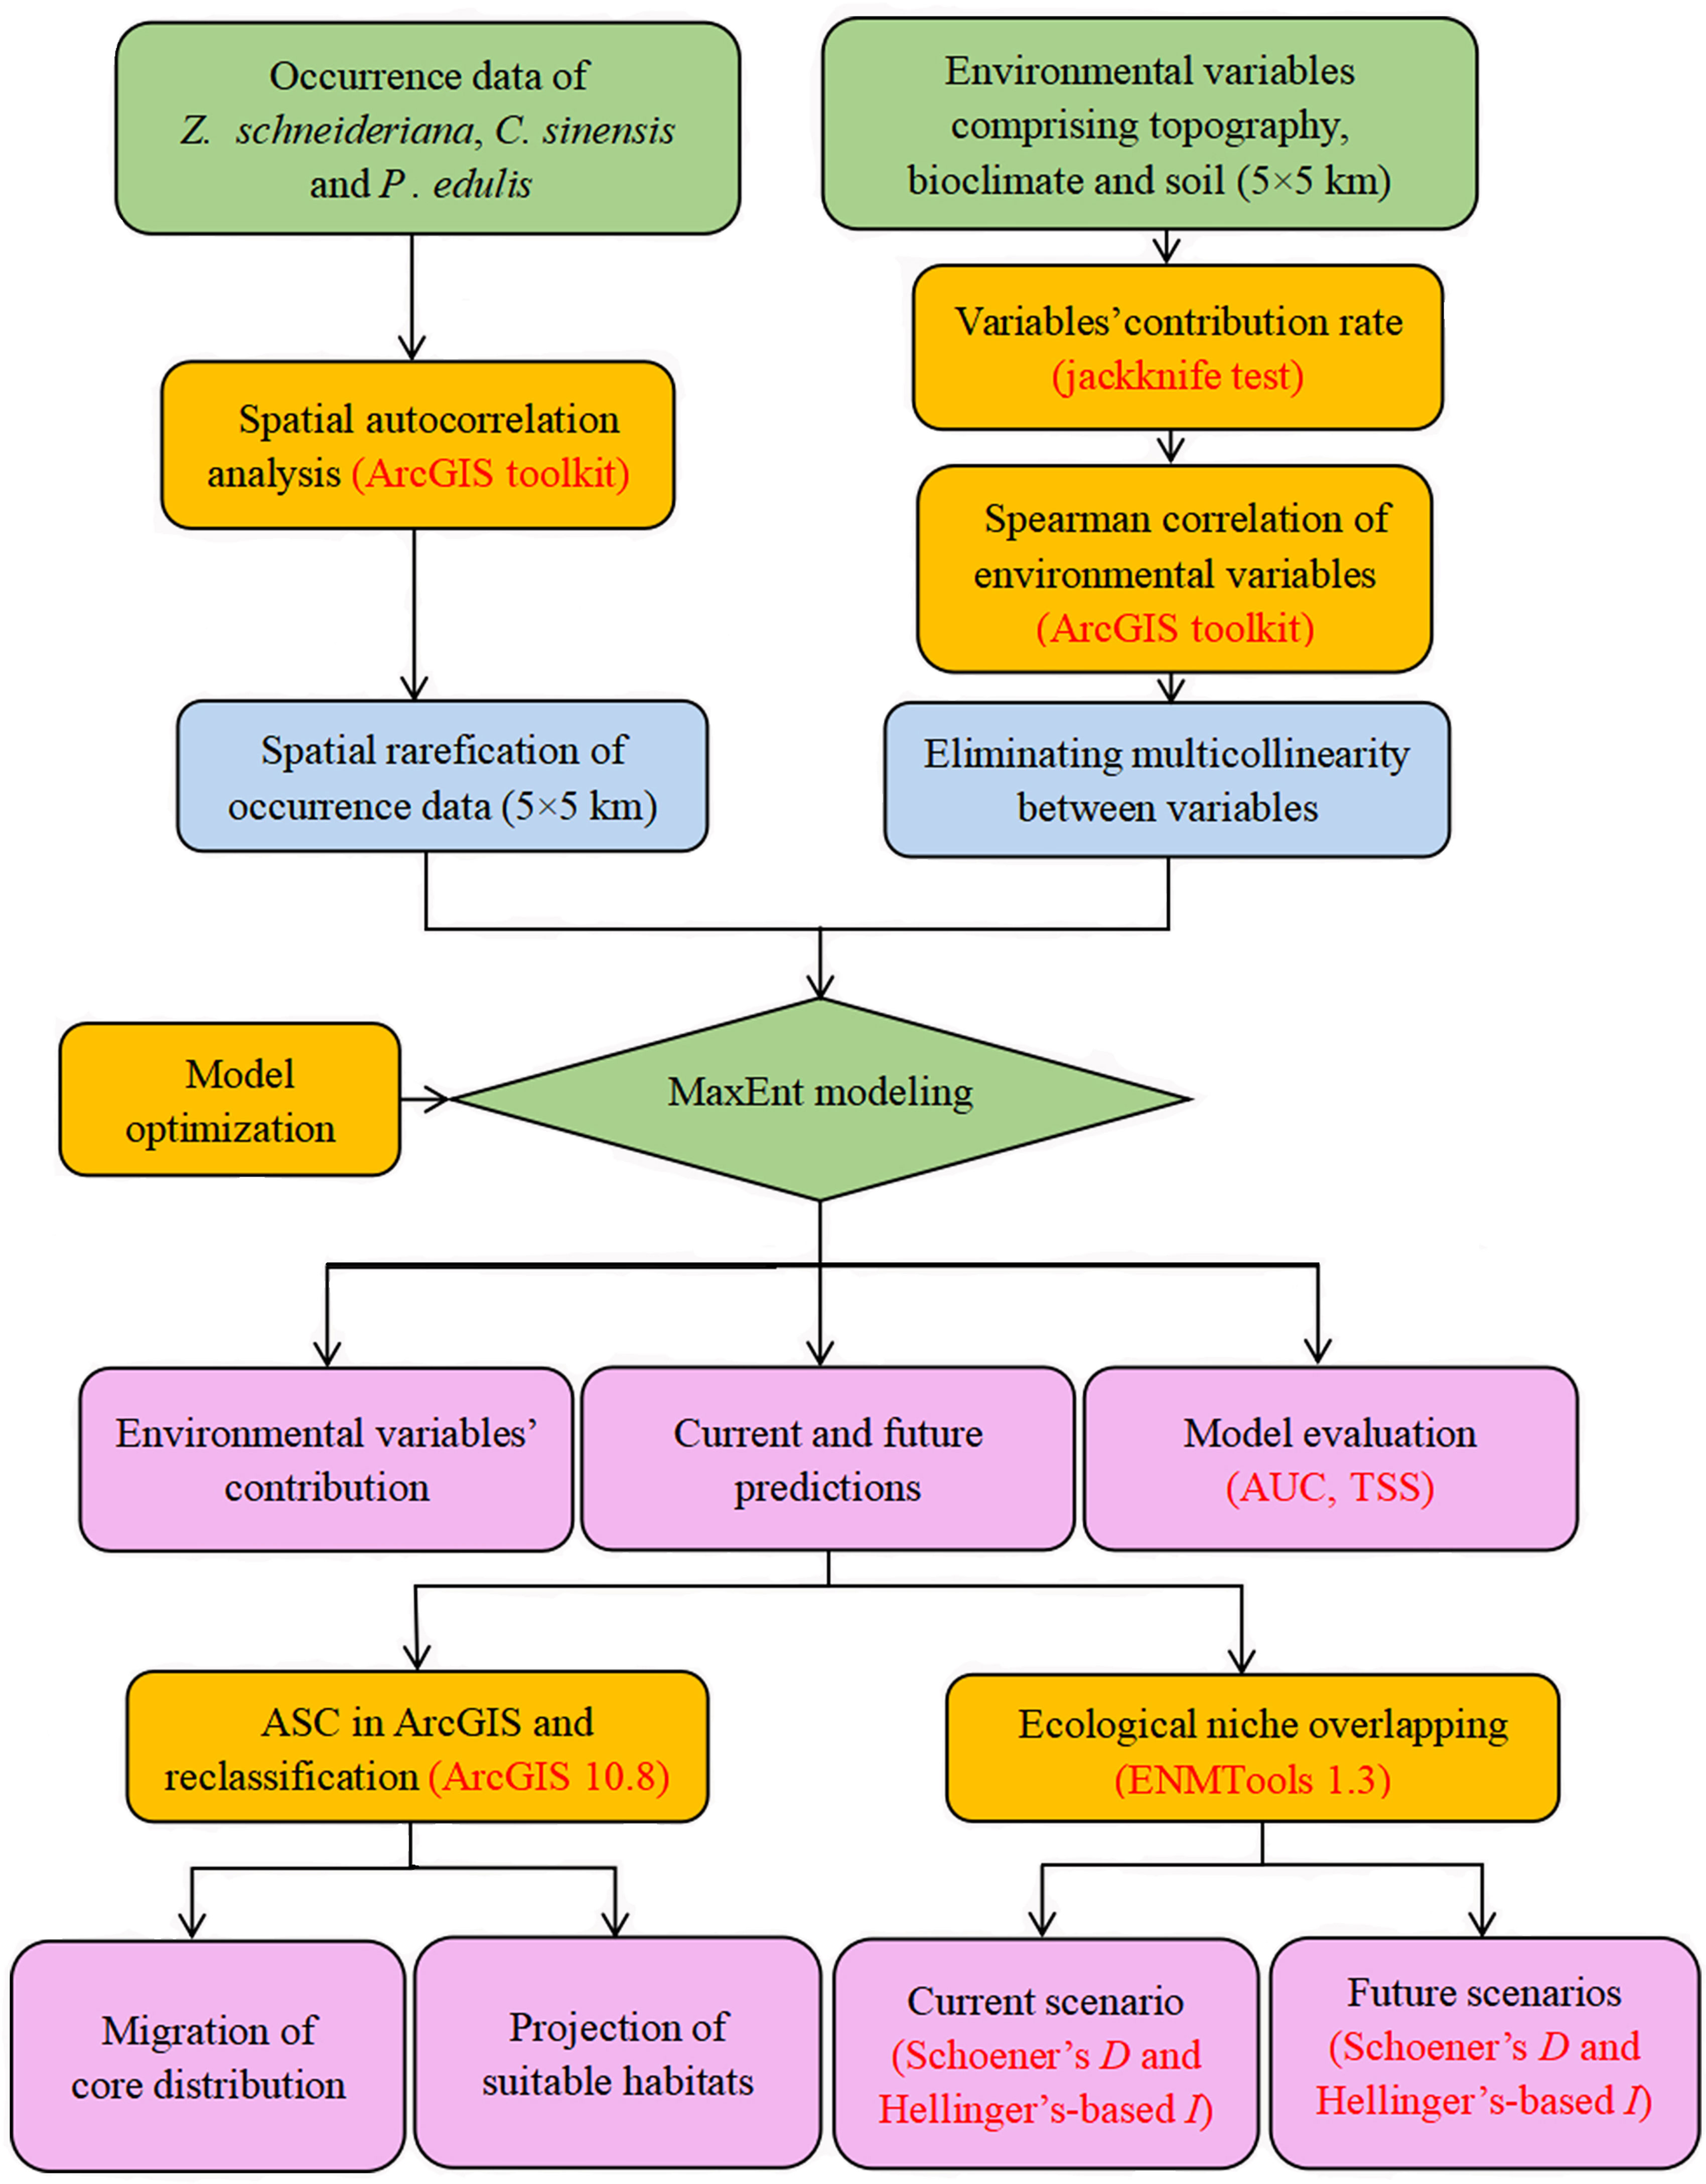
Figure 2 Workflow of the modeling framework used in our study.
2.1 Occurrence records
In our study, we obtained presence points of Z. schneideriana, C. sinensis and P. edulis mainly based on extensive field surveys. Meanwhile, we also collected their occurrence data from the published literature and related websites: (1) Herbarium: We obtained the specimen data containing latitude and longitude or detailed place names through two ways: the Chinese Virtual Herbarium (CVH, http://www.cvh.ac.cn), the National Specimen Information Infrastructure (NSII, http://www.nsii.org.cn). (2) Image library: We searched the species name or Latin name in the Plant Photo Bank of China (PPBC, http://ppbc.iplant.cn), obtained detailed place names below the picture, and then converted the latitude and longitude. (3) The Global Biodiversity Information Facility (GBIF, https://www.gbif.org/). (4) Literature search: We used the species names and Latin names of the three species as keywords for literature search. In addition, the data of 27 occurrence records of Z. schneideriana in Jiangsu Province were added according to the recent field survey.
For a small number of data with specific locations, but without corresponding coordinates, we used Google Earth to determine the latitude and longitude data which were accurate to two decimal places. After that, the duplication, cultivation (such as botanical gardens, schools and parks) and the sample records without latitude and longitude information or the font could not be identified were removed. Then, according to the Flora of China, local flora and related literature, provinces with no natural distribution were deleted, such as Shanxi Province (e.g., specimen record number is BJFC00042020), Hebei Province (e.g., NAS00573770) and Jilin Province (PPBC: The North Slope Scenic Spot of Changbai Mountain in Yanbian Korean Autonomous Prefecture, Jilin Province) and Shanghai (such as ccau0006638).
After that, 495 distribution points of Z. schneideriana were obtained (187 in herbarium, 28 in image database, 253 in literature and 27 in field survey), 686 of C. sinensis (563 in herbarium, 93 in image database and 30 in literature), and 401 of P. edulis (68 in herbarium, 89 in library, 244 in literature). The Resolution to Rarefy Data was set to 5 km using the Spatially Rarefy Occurrence Data for SDMs tool of SDMtoolbox 2.0 to reduce sampling deviation and spatial autocorrelation (Brown, 2014; Kong et al., 2019). Finally, 312 distribution points of Z. schneideriana, 513 of C. sinensis and 323 of P. edulis were obtained. The collected longitude and latitude of the three species are shown in Appendix Table 1, and the distribution of the three species on the map is shown in Figure 3.
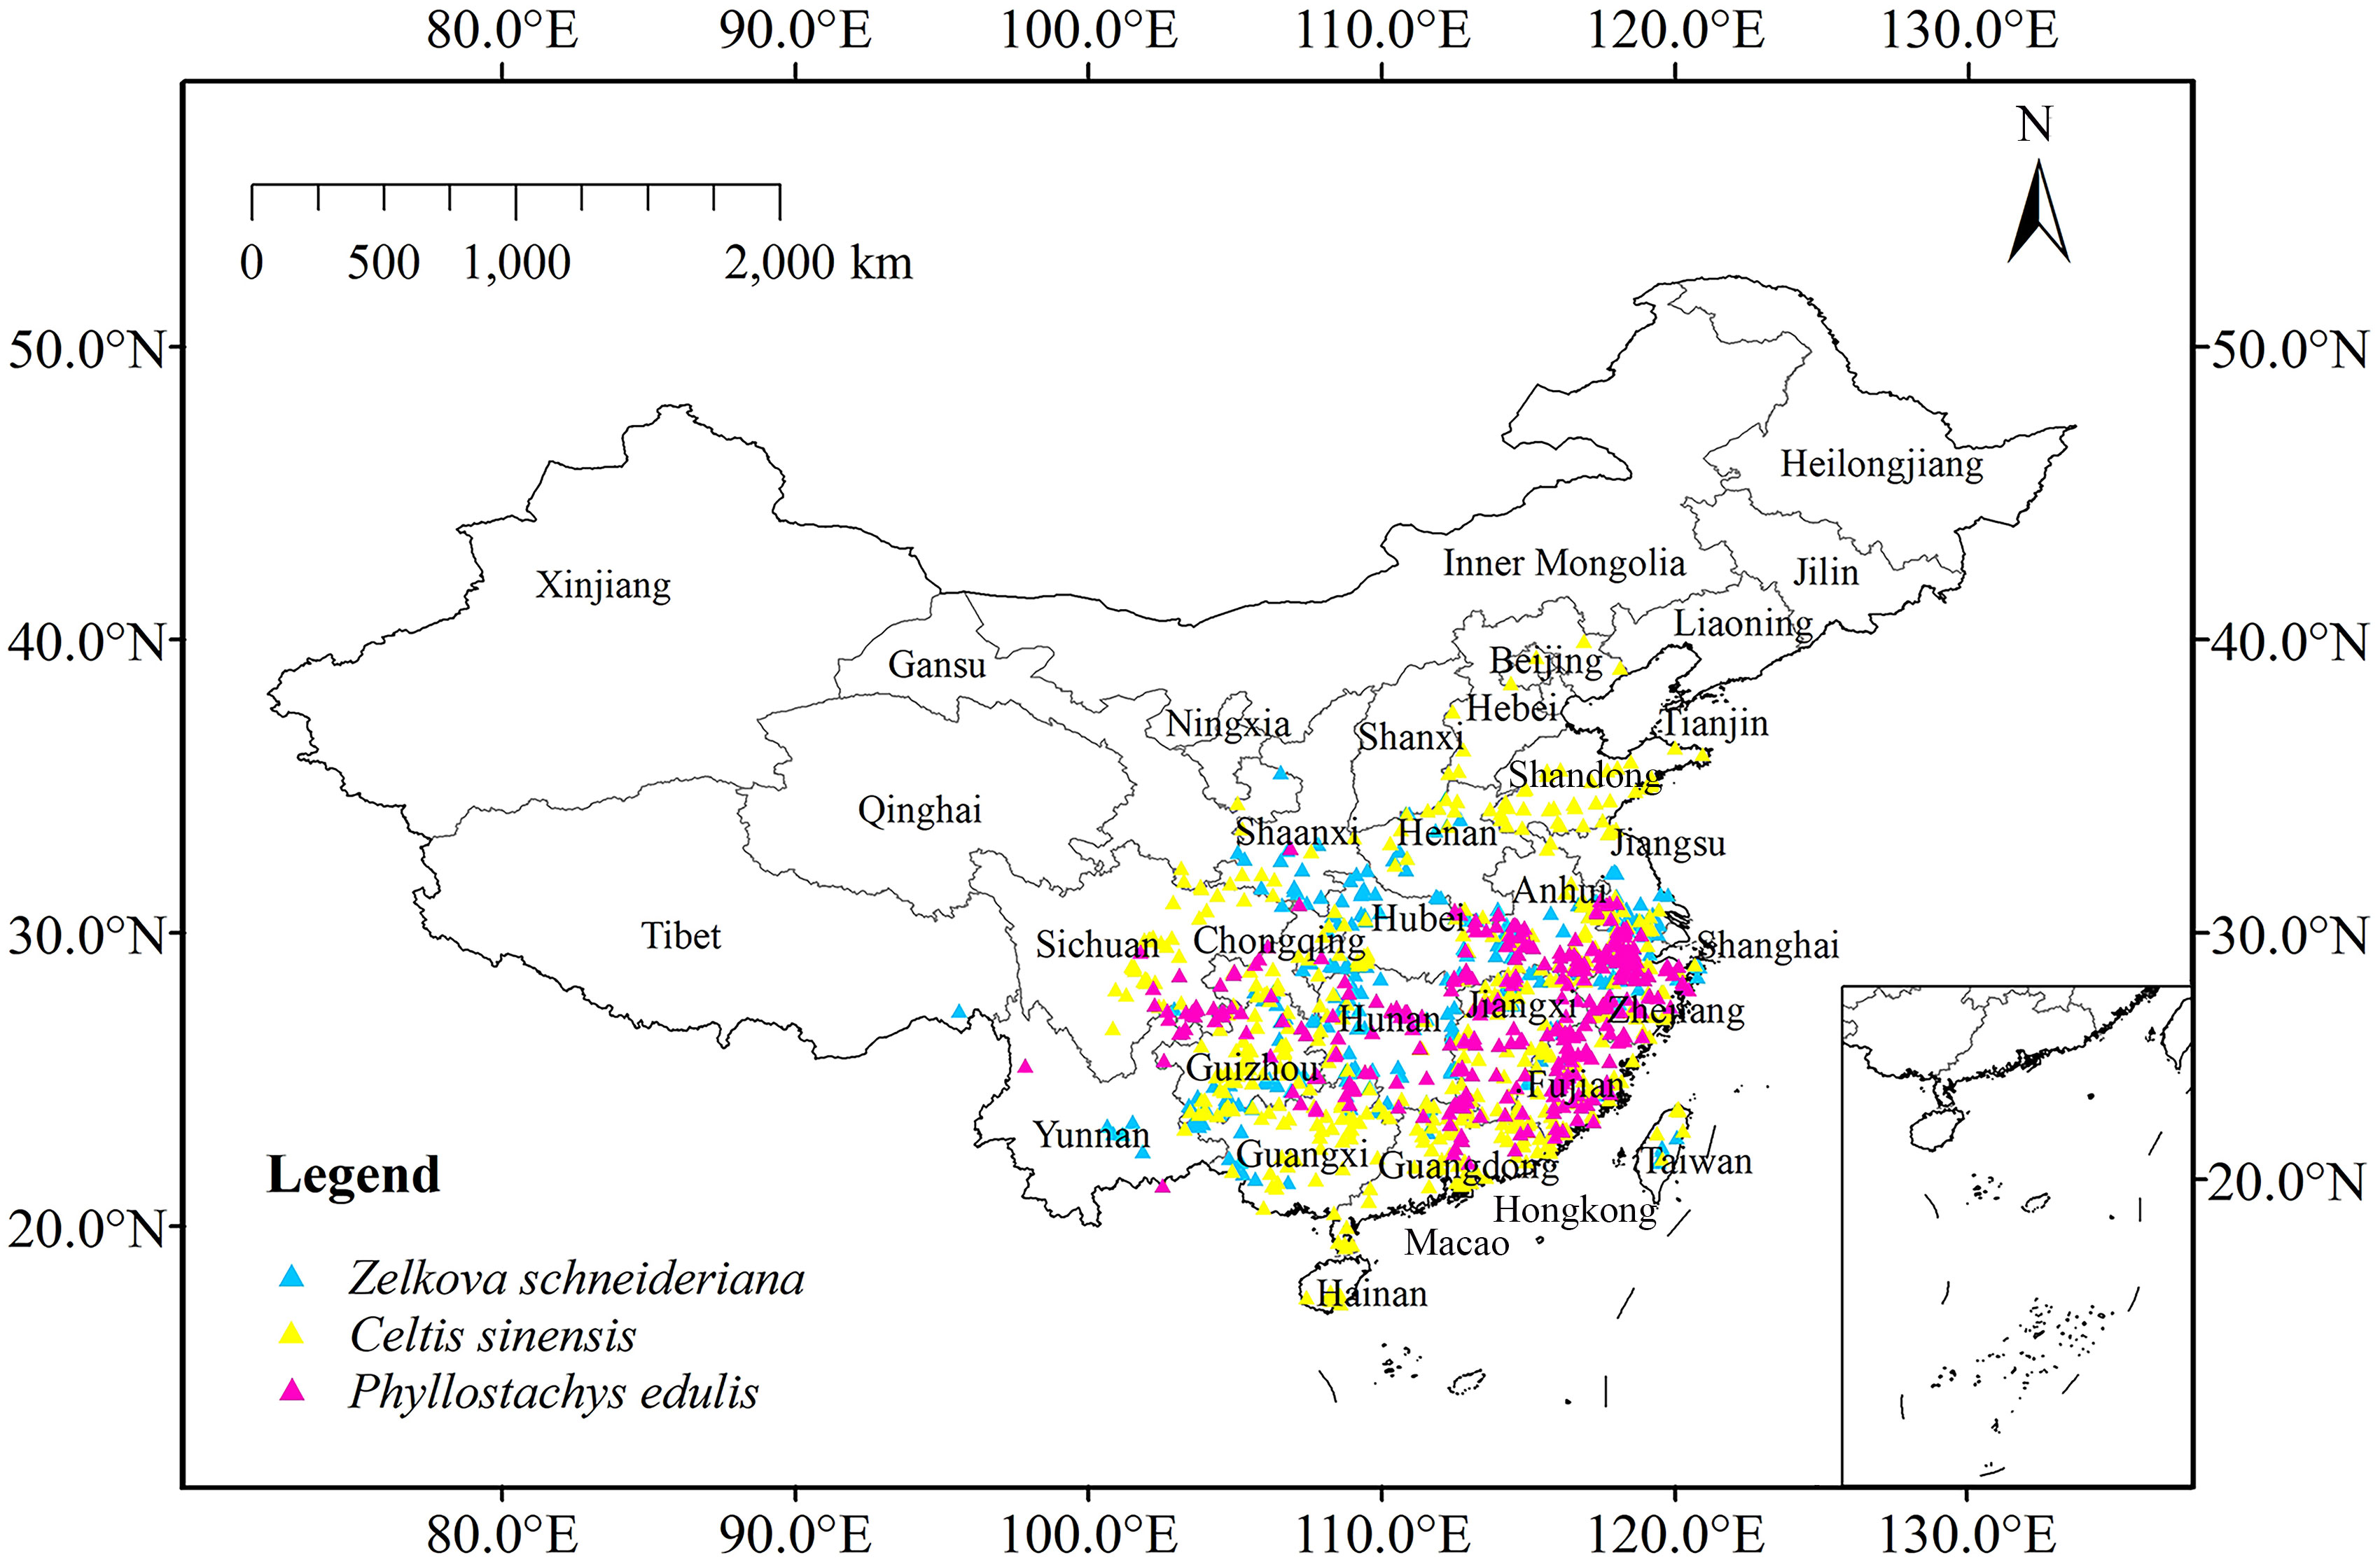
Figure 3 Current occurrence of Zelkova schneideriana, Celtis sinensis, and Phyllostachys edulis in China.
2.2 Environmental variables
This research involved the environmental data: (1) Terrain data: Download the elevation of meteorological database (WorldClim V2.1, https://www.worldclim.org/), the slope data from DEM database (http://www.tuxingis.com). (2) Climate Data: Download 19 climate factors from the World Meteorological Database, including current and future climate data. Current climate data are based on climatic conditions in the period 1970–2000 (WorldClim V2.1). Future climate data were based on the data of BCC-CSM2-MR in the Coupled Model Intercomparison Project Phase 6 (CMIP6). Some studies show that the BCC-CSM2-MR model is more suitable for Asia, especially China (Yang et al., 2016; Shi et al., 2020). The climate data include four Shared Socioeconomic Pathway (SSP1-2.6, SSP2-4.5, SSP3-7.0 and SSP5-8.5) in four periods (2021–2040, 2041–2060, 2061–2080 and 2081–2100). The spatial resolution of the climate data used in this paper was 2.5 min (~5 km). Some studies have shown that the prediction results of 2.5 min data and 30s data are similar in accuracy, and the calculation speed of 2.5 min data is faster (Guisan et al., 2007; Wan et al., 2021; Xu et al., 2022). (3) Soil data: The soil dataset based on the Harmonized World Soil Database (HWSD) (V1.2) (http://www.tpdc.ac.cn/zh-hans/) was downloaded from the National Tibetan Plateau Data Center, and the data of 16 topsoil types (0–30 cm) were selected.
Firstly, ArcMap V10.9 was used to process all environmental factors into a unified coordinate system, pixel size and space range, and converted from“.tif” format to“.asc” format (Gao et al., 2021; Ma et al., 2021). Secondly, the Maxent model was used to conduct preliminary simulation of the climate data, soil data and topographic data of the three tree species respectively, so as to obtain the percent contribution of environmental factors. Finally, the Remove Highly Correlated Variables tool of SDMtoolbox 2.0 was used to sort by contribution rate and set the Maximum Correlation Allowed to 0.8. That is, when the absolute value of Pearson correlation coefficient of two environmental factors is greater than 0.8, a variable with a greater contribution to modeling is reserved for subsequent analysis (Brown et al., 2017; Feng et al., 2019; Jiang et al., 2022). The final environmental variables used by Z. schneideriana, C. sinensis and P. edulis and their explanations are shown in Appendix Table 2.
2.3 Model simulation, optimization and evaluation
We used Maxent 3.4.1 to predict 17 climate concentration scenarios: the current period and four Shared Socioeconomic Pathways (SSP1-2.6, SSP2-4.5, SSP3-7.0 and SSP5-8.5) in four future periods (2021–2040, 2041–2060, 2061–2080 and 2081–2100). Maxent is a general machine learning method and based on maximum entropy theory, which is a mathematical method for inferring unknown probability distributions based on limited known information (Phillips et al., 2006). The complexity of the model has a great influence on the forecast results. Three main factors influencing the complexity of the Maxent model include the number of environment variables, FC value (feature class) and RM value (regularization multiplier) (Kong et al., 2019). It is necessary to select the best FC and RM value for the model. The operation of Maxent model includes six different FC combinations (L, LQ, H, LQH, LQHP, LQHPT, where L = linear, Q = quadratic, H = hinge, P = product, and T = threshold). Meanwhile, Maxent sets RM value, which ranges from 0.5 to 4 (interval 0.5) and has eight values (Muscarella et al., 2014). We used the ENMeval 2.0.4 installation package in R 4.2.0 to calculate and select the best combination of operating parameters for the Maxent model (Phillips et al., 2006). The best operating parameters of RM and FC are selected when delta. AICc value is 0 (Warren and Seifert, 2011; Chen et al., 2020).
The parameters set by Maxent model were “Create response curves”, “Do jackknife to measure variable importance”, “Random seed”, “Write plot data”, “Write background predictions”, “Replicated run type crossvalidate”, “Replicates 10”, and “Output format logistic”. In addition, 75% of the distribution data were set as training data, and the remaining 25% were testing data.
We used the area under curve (AUC) and the true skill statistics (TSS) value to evaluate the model performance. The AUC value was the area enclosed by the ROC curve and the horizontal coordinate, which was calculated by Maxent software and well evaluate the accuracy of the model prediction (Swets, 1988). The value of AUC ranges from 0 to 1, and the larger the value is, the higher the simulation reliability is. The AUC value is divided into five levels: (1) Excellent: 0.90–1.00. (2) Good: 0.80–0.90. (3) General: 0.70–0.80. (4) Difference: 0.60–0.70. (5) Failure: 0.50–0.60 (Phillips and Dudík, 2008; Jalaeian et al., 2018). The data predicted by Maxent model and the validation data set were used to calculate TSS (Wang et al., 2019). The TSS value is based on the maximum specificity and sensitivity thresholds, and the TSS index is calculated as: TSS= sensitivity + specificity − 1, with TSS values ranging from −1 to 1 (Allouche et al., 2006), where 1 represents the ability to perfectly distinguish between suitable and unsuitable areas. When TSS values are greater than 0.75, the model performs very well (Lu et al., 2022). A value of 0 or less indicates that the prediction performance is no better than random prediction (Franco-Estrada et al., 2022). The combination of AUC value and TSS value can better evaluate the performance of the model (Liu et al., 2013; Wang et al., 2019).
Aside from statistical validation, we also performed ground truthing for each species from July to October in 2022. First, we identified the potential distribution range by superimposing the projected potential area map on Google Earth (GE) images (Majumdar et al., 2019). Then, we used the GE overlays to carry out field survey, and performed ground verification of the identified potential area for each species. Within the highly suitable area predicted by Maxent, we chose half of the provinces which had relatively concentrated distribution for ground verification. Subsequently, we selected four locations for each of these provinces. After that, we scouted for the presence of each species location using precise coordinates (i.e. latitude and longitude) in the GPS receiver device (Namitha et al., 2022).
2.4 Assessment of current and future distribution areas
In this study, the distribution areas of Z. schneideriana, C. sinensis and P. edulis were divided into four levels, which were highly suitable area, moderately suitable area, low suitable area and not suitable area. Distribution area are divided based on the “sum of maximum specificity and sensitivity”, a threshold that is a good choice for models predicting the distribution of endangered species (Liu et al., 2013). At the same time, in order to facilitate the interpretation of the prediction results, we divided the distribution areas into: not suitable area (0–0.2), low suitable area (0.2–0.4), moderately suitable area (0.4–0.6) and highly suitable (0.6–1) (He et al., 2021; Mahatara et al., 2021).
Core distribution migration can effectively reflect changes in species distribution region (Liu et al., 2019), in order to more intuitively describe changes in the distribution of species’ suitable areas, we used the SDMtoolbox 2.0 (Brown et al., 2017) to obtain core distribution migration of three species under current and future concentration scenarios. Concretely, “.asc” files generated under different concentration situations predicted by Maxent model were imported into ArcGIS V10.9, and core distribution migration results were obtained using SDMtoolbox 2.0. Then the direction and distance of core distribution migration were further analyzed.
2.5 Niche overlap metrics
Niche overlap refers to the overlap of two species using the same or similar resources which indicates the degree of similarity of niche between two species (Lu et al., 2022). Niche overlap between each two species was calculated using niche overlap (ASCII files) of ENMTools V1.3.1. The operation of ENMTools V1.3.1 is based on the operation result of Maxent, in which all parameters are set as default values (Franco-Estrada et al., 2022). In this study, Schoener’s D statistic and Warren et al.’s revised Hellinger statistic I value were used to measure niche overlap (Schoener, 1970). The calculation formula of D index is (Warren et al., 2008):
Where represents the habitat suitability index of species X and Y in cell i. Schoener’s D values range from 0 (dissimilar) to 1 (same distribution), and the similarity of distributions is described by comparing the corresponding values for each cell in the two grids (Broennimann et al., 2012). To facilitate the interpretation of the results, Schoener’s D is generally divided into five categories: (1) Extremely high overlap: 0.80–1.00. (2) High overlap: 0.60–0.80. (3) Moderate overlap: 0.40–0.60. (4) Low overlap: 0.20–0.40. (5) No or very limited overlap: 0.00–0.20 (Rödder and Engler, 2011; Hyseni et al., 2019). The formula to calculate the I index is:
I ranges from 0 to 1, with a value of 0 indicating that the species’ needs for environmental factors do not overlap at all, and a value of 1 indicating that all environmental factors in the study area grid are equally suitable for both species (Schoener, 1970; Warren et al., 2008; Rödder and Engler, 2011).
In addition, one-sample t-test was used to identify significant differences of niche overlap in terms of Schoener’s D and Hellinger statistic I for two species pairs under different climate scenarios. The statistics analysis was conducted using SPSS 20 for Windows (SPSS, Inc., Chicago, IL, United States) (Wu, 2019).
3 Results
3.1 Model performance and variables’ contribution
For Z. schneideriana, the optimum FC and RM were LQHPT and 1.5, respectively; for C. sinensis, they were H and 1.0, respectively; for P. edulis, they were LQH and 2.0, respectively. These optimized parameters were subsequently used for Maxent modeling. The Maxent prediction results showed that the AUC values of Z. schneideriana, and P. edulis were > 0.92, and the AUC of C. sinensis approached 0.9 under the current and 16 future climate scenarios (Table 1). Similarly, the TSS values of Z. schneideriana and P. edulis were > 0.78, and the TSS of C. sinensis approached 0.75. Additionally, the three species’ occurrence records are all located in the current distribution areas simulated by Maxent model (Figure 3), that is to say, the predicted current suitability is consistent with their actual distributions. Therefore, combined with the predicted suitability, AUC and TSS value indicate that Maxent has a high accuracy and credibility under current and future climates. Besides, the results of ground verification showed that for each species over 90% locations were consistent with the species’ ground reality, indicating that the Maxent in our study had high accuracy.
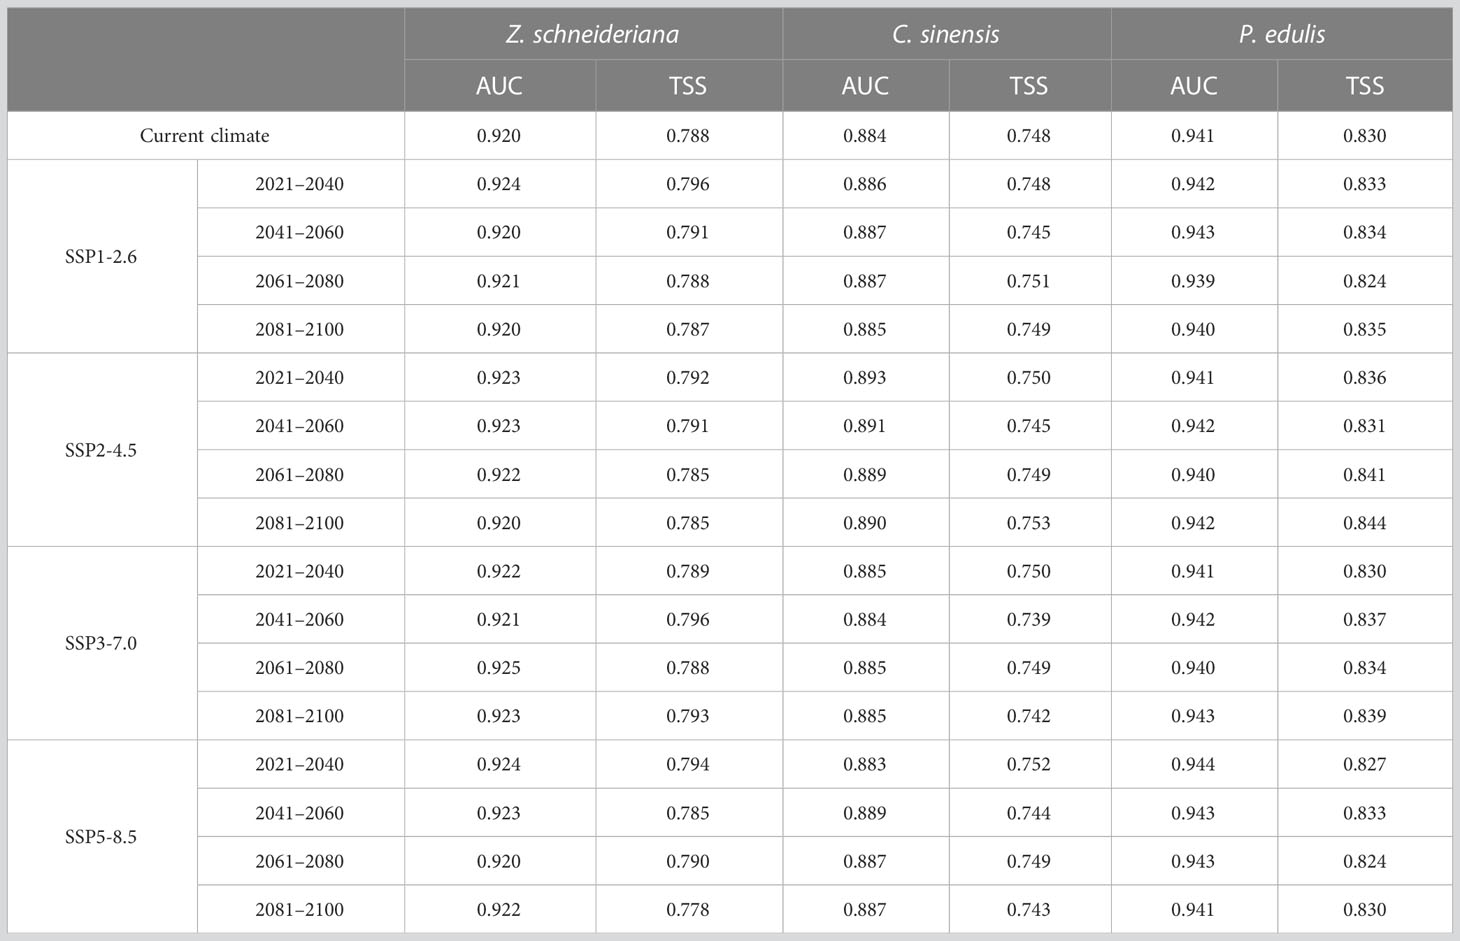
Table 1 AUC and TSS values of Zelkova schneideriana, Celtis sinensis and Phyllostachys edulis under different climate scenarios in China.
The contribution rate of environmental variables was obtained through the iterative algorithm and normalization processing (Appendix Table 2) (Yan and Zhang, 2022). For each species, the top four of them were selected as the key environmental factors. Under the current climate, the four leading factors for Z. schneideriana were Min temperature of coldest month (Bio6, 43.6%), Mean diurnal range (Bio2, 35.3%), Precipitation seasonality (Bio15, 7.2%) and Temperature seasonality (Bio4, 6.5%), with the total contribution rate up to 92.6%. The four leading factors for C. sinensis were Precipitation of driest month (Bio14, 54.6%), Precipitation of wettest month (Bio13, 17.7%), Min temperature of coldest month (Bio6, 17.0%) and Isothermality (Bio3, 6.4%), with the total contribution rate up to 95.7%. The four leading factors for P. edulis were Precipitation of driest month (Bio14, 87.9%), Annual mean temperature (Bio1, 4.1%), Elevation (Elev, 2.4%), Temperature seasonality (Bio4, 1.8%), with the total contribution rate up to 96.2%. The common key factor for Z. schneideriana and C. sinensis was Min temperature of coldest month (Bio6), and the common key factor for Z. schneideriana and P. edulis was Temperature seasonality (Bio4).
When the species existence probability is greater than 0.4, it indicates that the range of environmental variables is suitable for plant growth (Ren et al., 2020; Zhang et al., 2021). For Z. schneideriana, the optimal ranges of Bio6, Bio2, Bio15 and Bio4 were −4.9–4.9°C, <9.2°C, 42.0–71.0 mm, and 705.0–950.0, respectively (Figure 4A). Its survival probability reached the maximum as high as 0.65 when Bio6 was −1.0°C, 0.56 when Bio2 was 7.3°C, 0.69 when Bio15 was −52.0 mm, 0.58 when Bio4 was 875.0. For C. sinensis, the optimal ranges of Bio14, Bio13, Bio6 and Bio3 were >16.0mm, >190.0mm, −7.0–15.0°C, 23.0–32.5, respectively (Figure 4B). For P. edulis, the optimal ranges of Bio14, Bio1, Elev and Bio4 were >25.0 mm, 13.5–20.0°C, 2.0–31.0 m and 600.0–890.0, respectively (Figure 4C). In addition, the range of these factors’ maximum probability of C. sinensis and P. edulis are shown in Table 2.
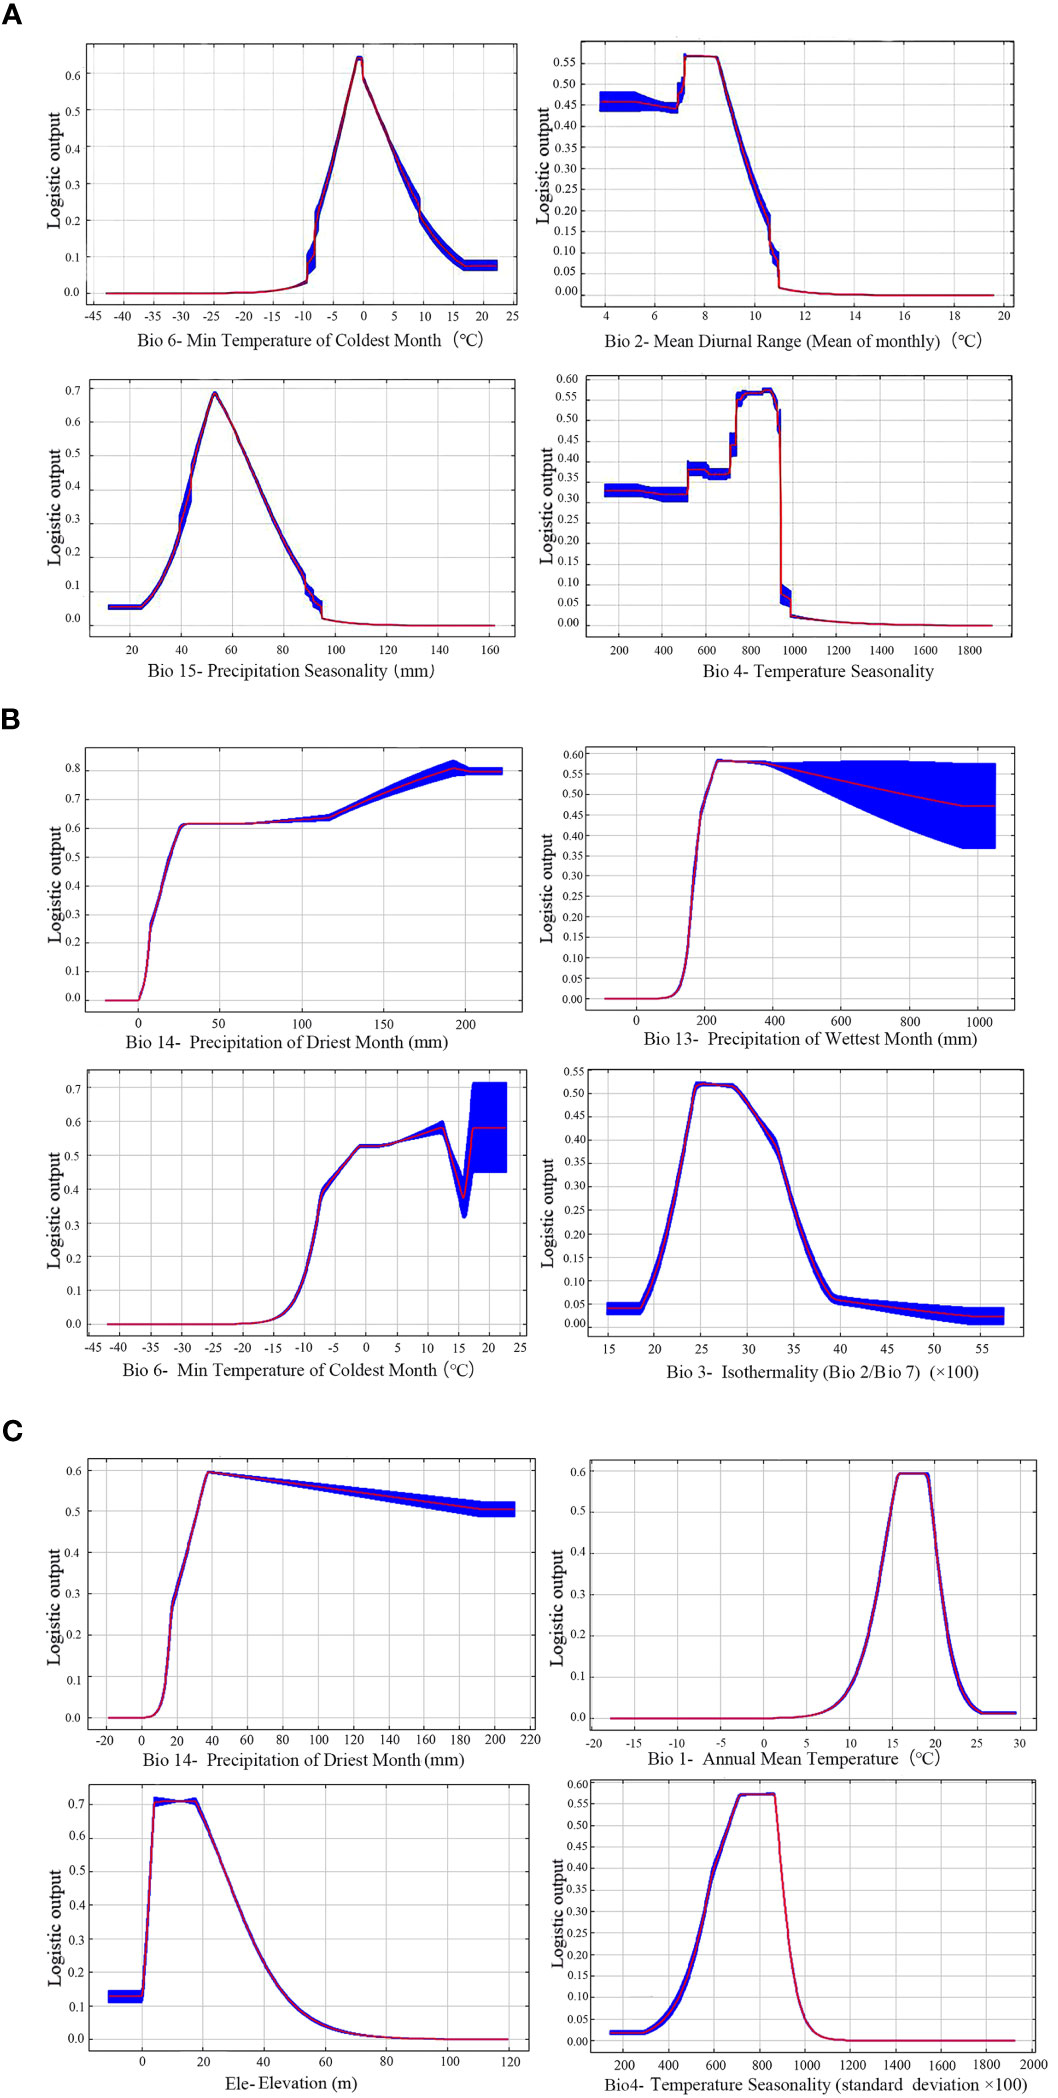
Figure 4 Response curves of three species to key bioclimatic variables. (A) Zelkova schneideriana; (B) Celtis sinensis; (C) Phyllostachys edulis.
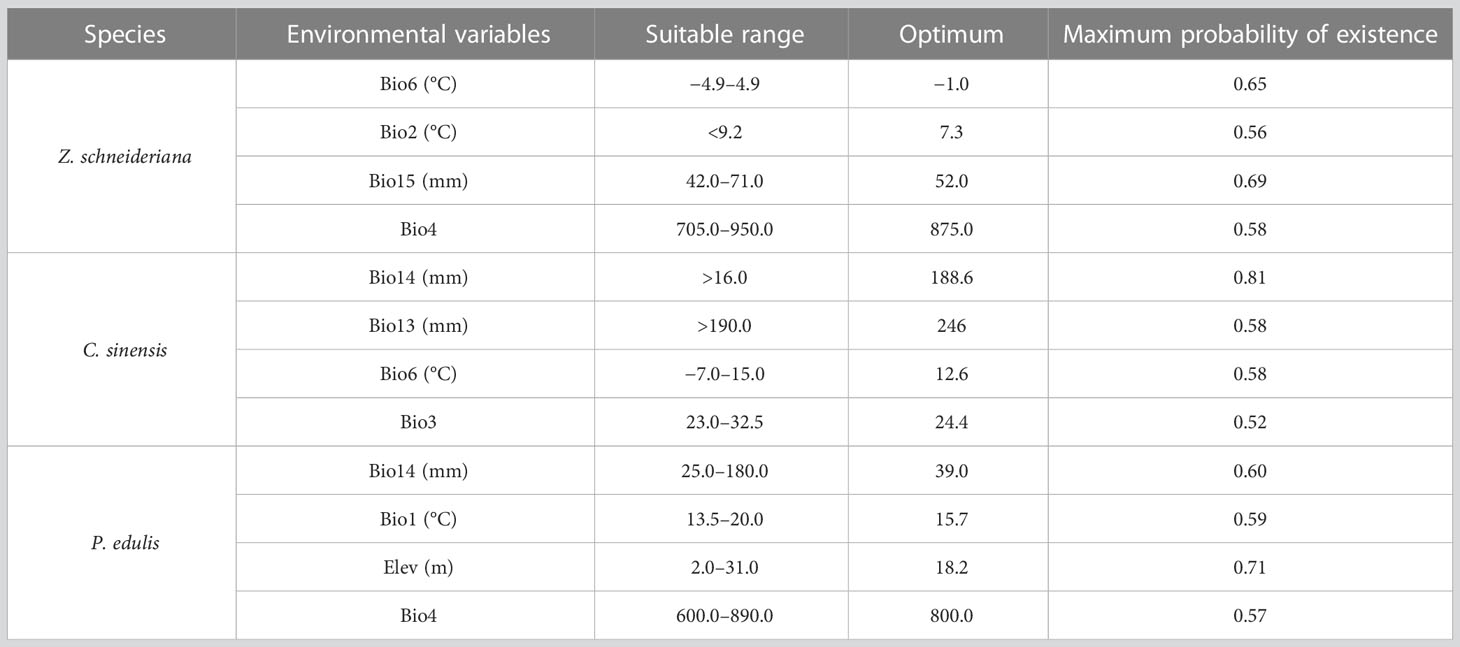
Table 2 Key climatic factors influencing habitat distribution of three species.
3.2 Current distribution areas of three dominant species
At present, the highly suitable areas of Z. schneideriana were mostly located in southwest Jiangsu, northern Zhejiang, central and southern Anhui, southeast and west Hubei, and some were scattered in Hunan. Moderately suitable areas mainly occurred in the marginal areas of highly suitable areas, including southeastern Jiangsu, south-central Zhejiang, central Anhui, north-central Jiangxi, northwestern and central Hubei, north-central Hunan, Guizhou, and Taiwan. The low suitable areas mainly occurred outside the moderately suitable areas, including southern Shaanxi, central Henan, Fujian, northern Anhui, south-central Jiangxi, south-central Hunan, northern Guangdong, north-central Guangxi, Sichuan (Figure 5A). We combined the highly and moderately suitable area into the suitable area (Lu et al., 2022). Currently, it was predicted that the suitable area (moderately and highly suitable areas) of Z. schneideriana was 106.50×10⁴ km2.
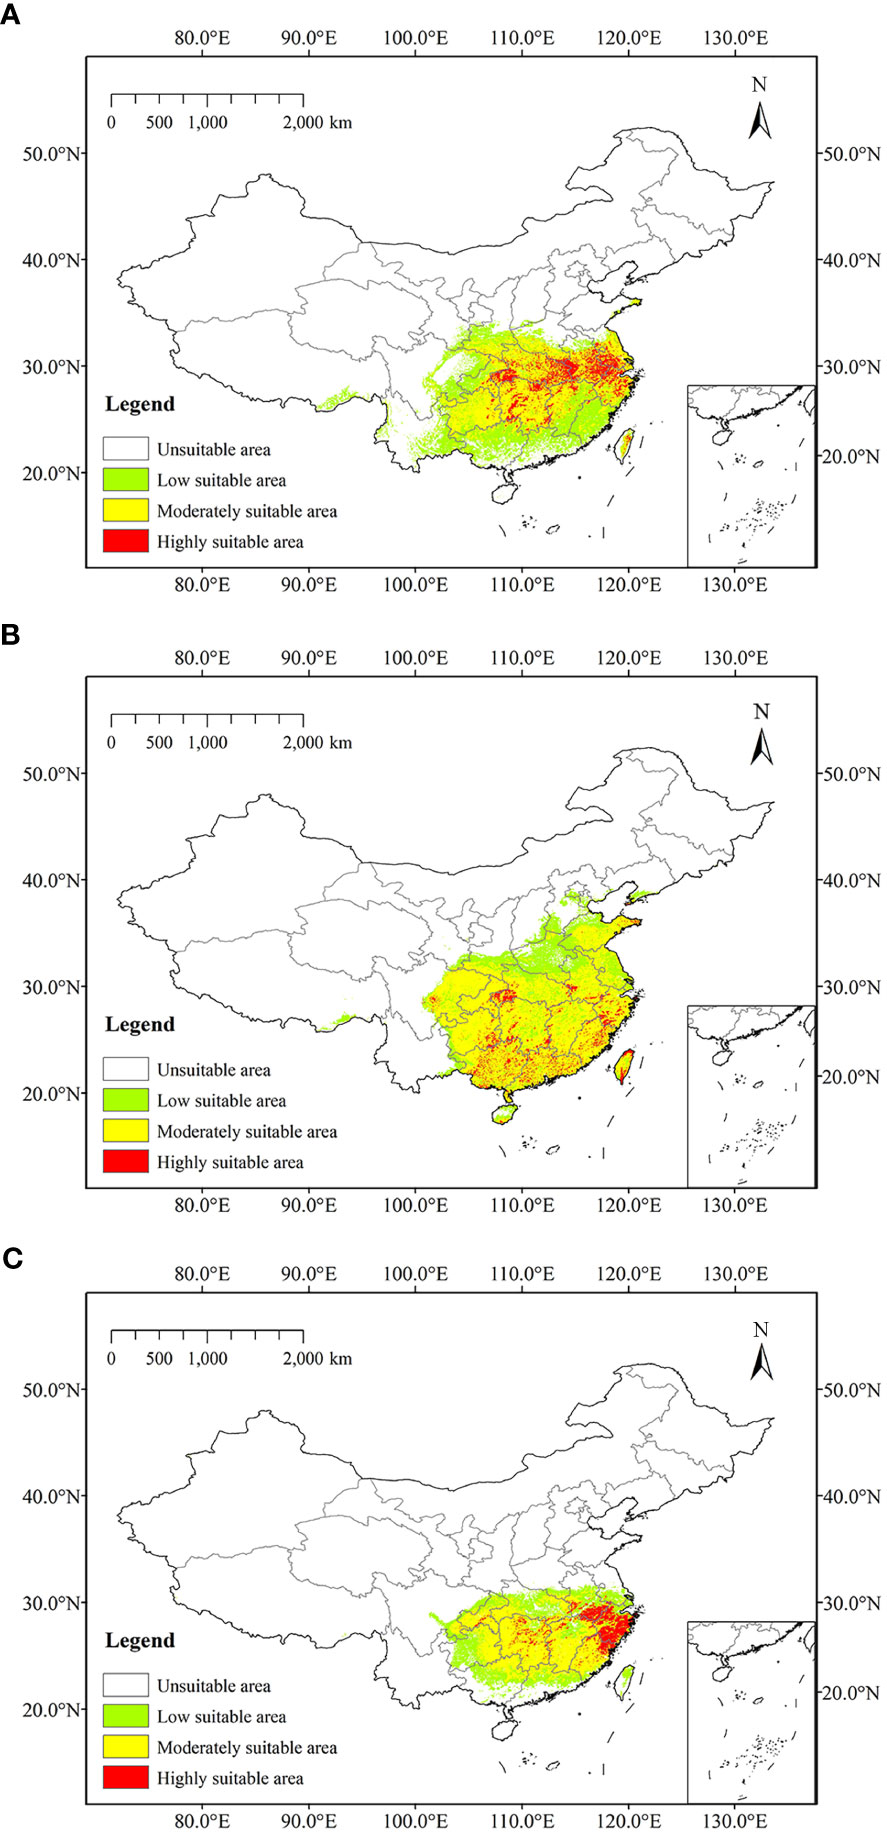
Figure 5 Predicted current distribution of three trees. (A) Zelkova schneideriana; (B) Celtis sinensis; (C) Phyllostachys edulis.
The highly suitable areas of C. sinensis at present were located in western Hubei, northern and southern Taiwan, southern Hainan, and it scattered in Shandong, Jiangsu, Zhejiang, Jiangxi, Hunan, Guangdong, Guangxi, Guizhou and Sichuan. Moderately suitable areas were widely distributed in subtropical region of China, including Zhejiang, Fujian, Guangdong, Guangxi, Guizhou, Hunan, Jiangxi, etc. Low suitable areas were mainly located in the north of moderately suitable areas, including western Shandong, northern Jiangsu, northern Anhui, Henan, southwestern Hebei, central Hubei, and eastern Sichuan (Figure 5B). At present, it was predicted that the suitable area of C. sinensis was 165.90×10⁴ km2. The highly suitable areas of P. edulis at present were mainly located in Zhejiang, southern Anhui, northern Fujian, and it scattered in Hunan and Chongqing. Moderately suitable areas were mainly occurred in Fujian, south-central Jiangxi, Hunan, southwestern and eastern Hubei, and western Anhui. Low suitable areas were mainly located outside moderately suitable areas, including southern Jiangsu, central Anhui, Hubei, Chongqing, central Guizhou, northern Guangxi, northern Guangdong, and central Taiwan (Figure 5C). The current predicted suitable area of P. edulis was 78.24×10⁴ km2.
3.3 Future distribution shift of three dominant species
For Z. schneideriana, the proportion of its suitable area had the highest value of 11.75% with the area of 112.81×10⁴ km2 in the scenario under future climate scenario (SSP3-7.0 2041–2060), while the proportion of its suitable area under (SSP5-8.5 2081–2100) had the lowest value of 10.08% with the area of 96.74×10⁴ km2. Among the 16 future climate scenarios, the suitable areas under climate scenarios (SSP1-2.6 2021–2040, SSP3-7.0 2041–2060, SSP5-8.5 2041–2060, SSP1-2.6 2081–2100 and SSP3-7.0 2081–2100) would increase compared with the current suitable area. Each suitable area of the remaining 11 climate scenarios was less than that of current situation. Especially in the condition under SSP2-4.5 scenario, the suitable area of Z. schneideriana decreased in all periods. The mean percentage of suitable areas of Z. schneideriana in the four periods (2021–2040, 2041–2060, 2061–2080 and 2081–2100) was 10.68%, 10.95%, 10.84% and 10.92%, respectively, all of which decreased compared with the current percentage of 11.09%. In the 16 future climate scenarios, the average suitable areas (10.87%) would decrease compared with the current period (11.09%) (Table 3). Overall, the suitable area of Z. schneideriana would decrease in the future.
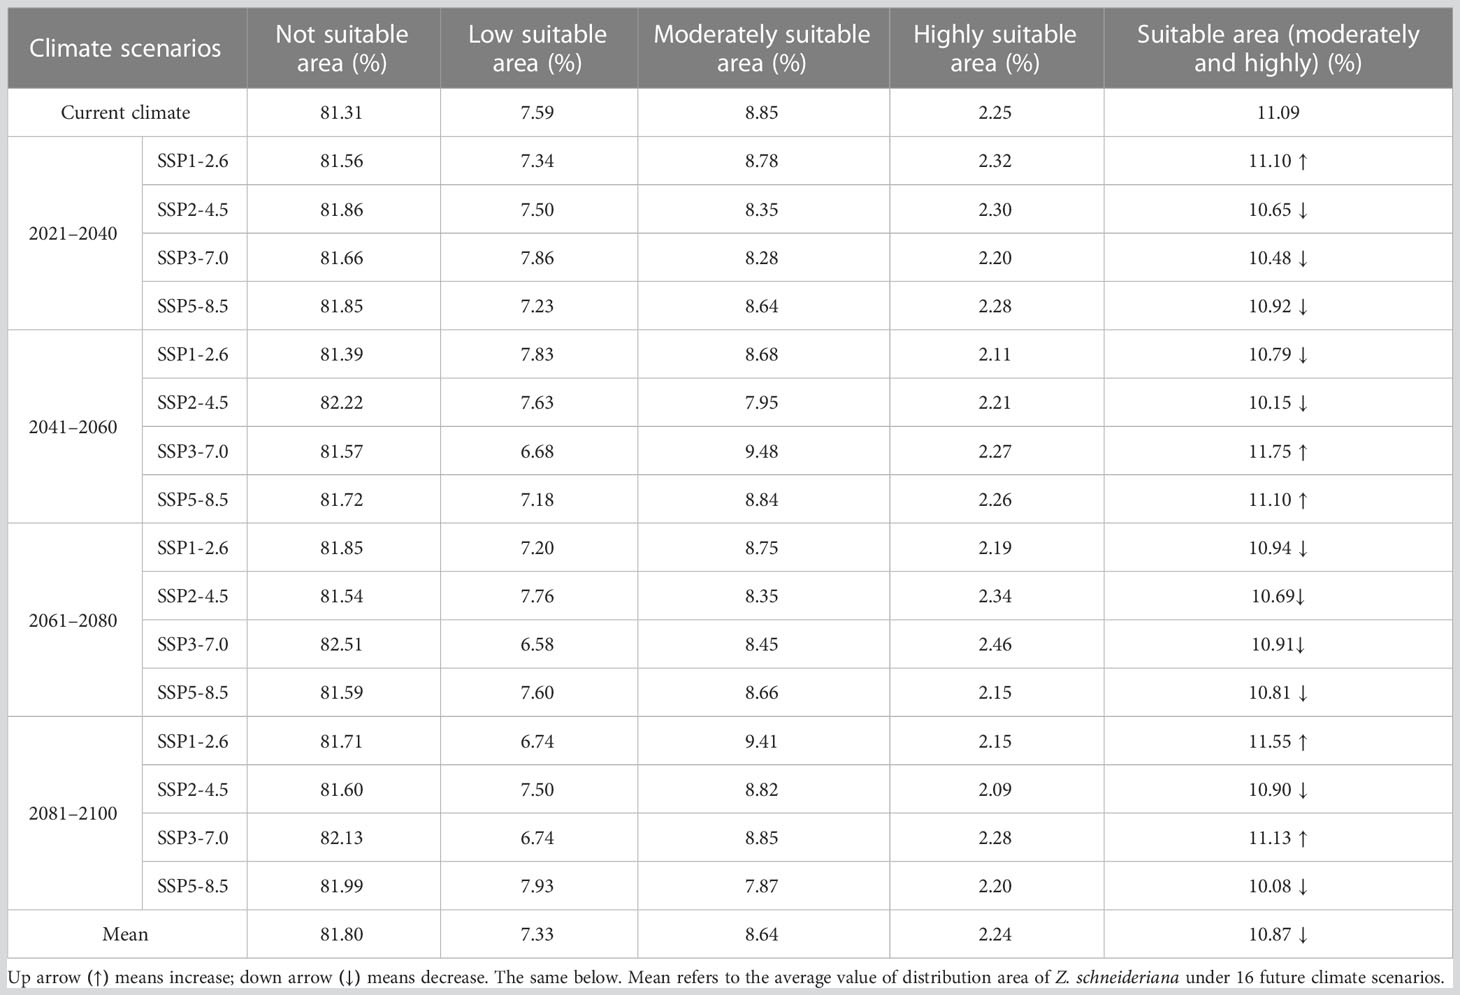
Table 3 Dynamics of changes in distribution area of Z. schneideriana under different climate scenarios.
For C. sinensis, the proportion of its suitable area had the highest value of 17.5% with the area of 168.04×10⁴ km2 in the scenario under future climate scenario (SSP3-7.0 2081–2100), while the proportion of its suitable area under (SSP2-4.5 2041–2060) had the lowest value of 15.4% with the area of 147.82×10⁴ km2. Among the 16 future climate scenarios, only the suitable areas under climate scenario (SSP3-7.0 2081–2100) increased compared with the current, while the suitable area all decreased in the other 15 climate scenarios. Especially, the proportions of suitable area at present and in the future four periods (under SSP1-2.6) were 17.28%, 17.17%, 16.96%, 16.93% and 16.76%, respectively. Accordingly, this took on a decreasing trend. The mean percentage of suitable areas of C. sinensis in the four periods (2021–2040, 2041–2060, 2061–2080 and 2081–2100) was 16.76%, 16.57%, 16.61%, 16.86%, respectively, all of which decreased compared with the current percentage of 17.28%. In the 16 future climate scenarios, the average suitable areas (16.7%) would decrease compared with the current (Table 4). Most strikingly, in the period of 2041–2060 C. sinensis had the lowest value in suitable area (under SSP2-4.5) while Z. schneideriana had the highest value (under SSP3-7.0). Conversely, in the period of 2081–2100 C. sinensis had the highest value in suitable area while Z. schneideriana had the lowest value (under SSP5-8.5). Accordingly, it seems that the Z. schneideriana reached the maximum value in suitable area when C. sinensis appeared the minimum value within the same period.
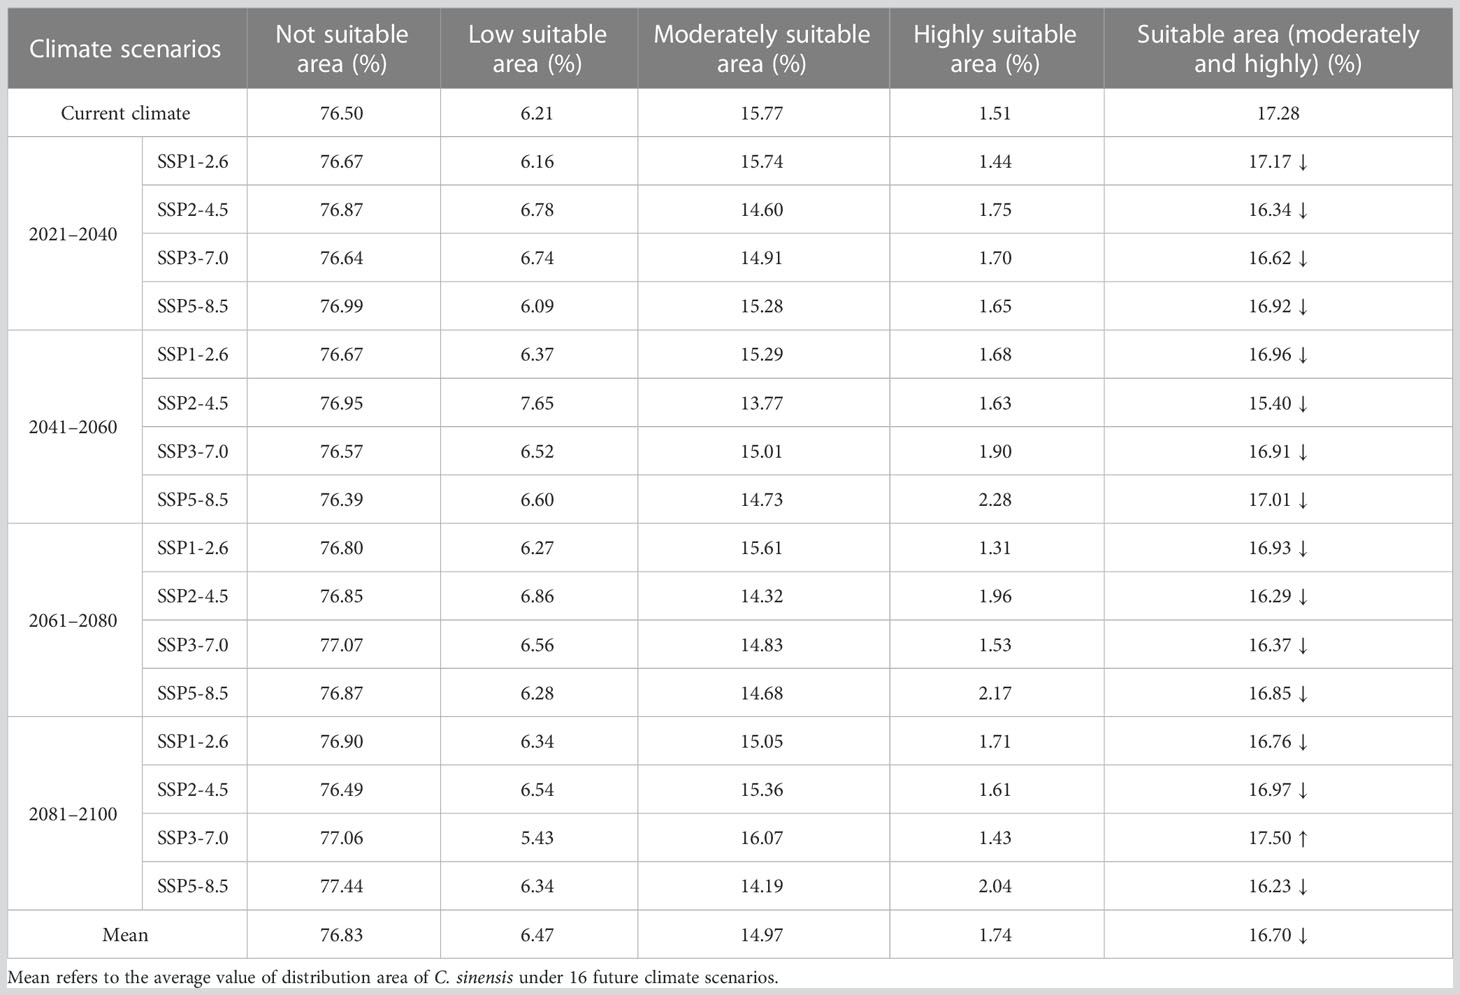
Table 4 Dynamics of changes in distribution area of Celtis sinensis under different climate scenarios.
For P. edulis, the proportion of its suitable area had the highest value of 8.66% with the area of 83.14×10⁴ km2 in the scenario under future climate scenario (SSP2-4.5 2021–2040), while the proportion of its suitable area under (SSP3-7.0 2021–2040) had the lowest value of 7.73% with the area of 74.24×10⁴ km2. Among the 16 future climate scenarios, the suitable areas under climate scenarios (SSP1-2.6 2021–2040, SSP3-7.0 2021–2040, SSP1-2.6 2041–2060, SSP2-4.5 2041–2060 and SSP2-4.5 2061–2080) would decrease compared with the current suitable area. Each suitable area of the remaining 11 climate scenarios was more than that of current situation. Especially in the condition under SSP3-7.0 scenario, the proportion of suitable area in the future four periods was 7.73%, 8.30%, 8.31%, and 8.47%, respectively. Accordingly, this took on an increasing trend in the future. The mean percentage of suitable areas of P. edulis in the four periods (2021–2040, 2041–2060, 2061–2080 and 2081–2100) was 8.22%, 8.15%, 8.32%, and 8.43%, respectively, all of which increased compared with the current percentage of 8.15%. In the 16 future climate scenarios, the average suitable areas (8.28%) would increase compared with the current (8.15%) (Table 5). Most strikingly, the climate scenario under SSP3-7.0 P. edulis had the lowest value in suitable area while Z. schneideriana had the highest value.
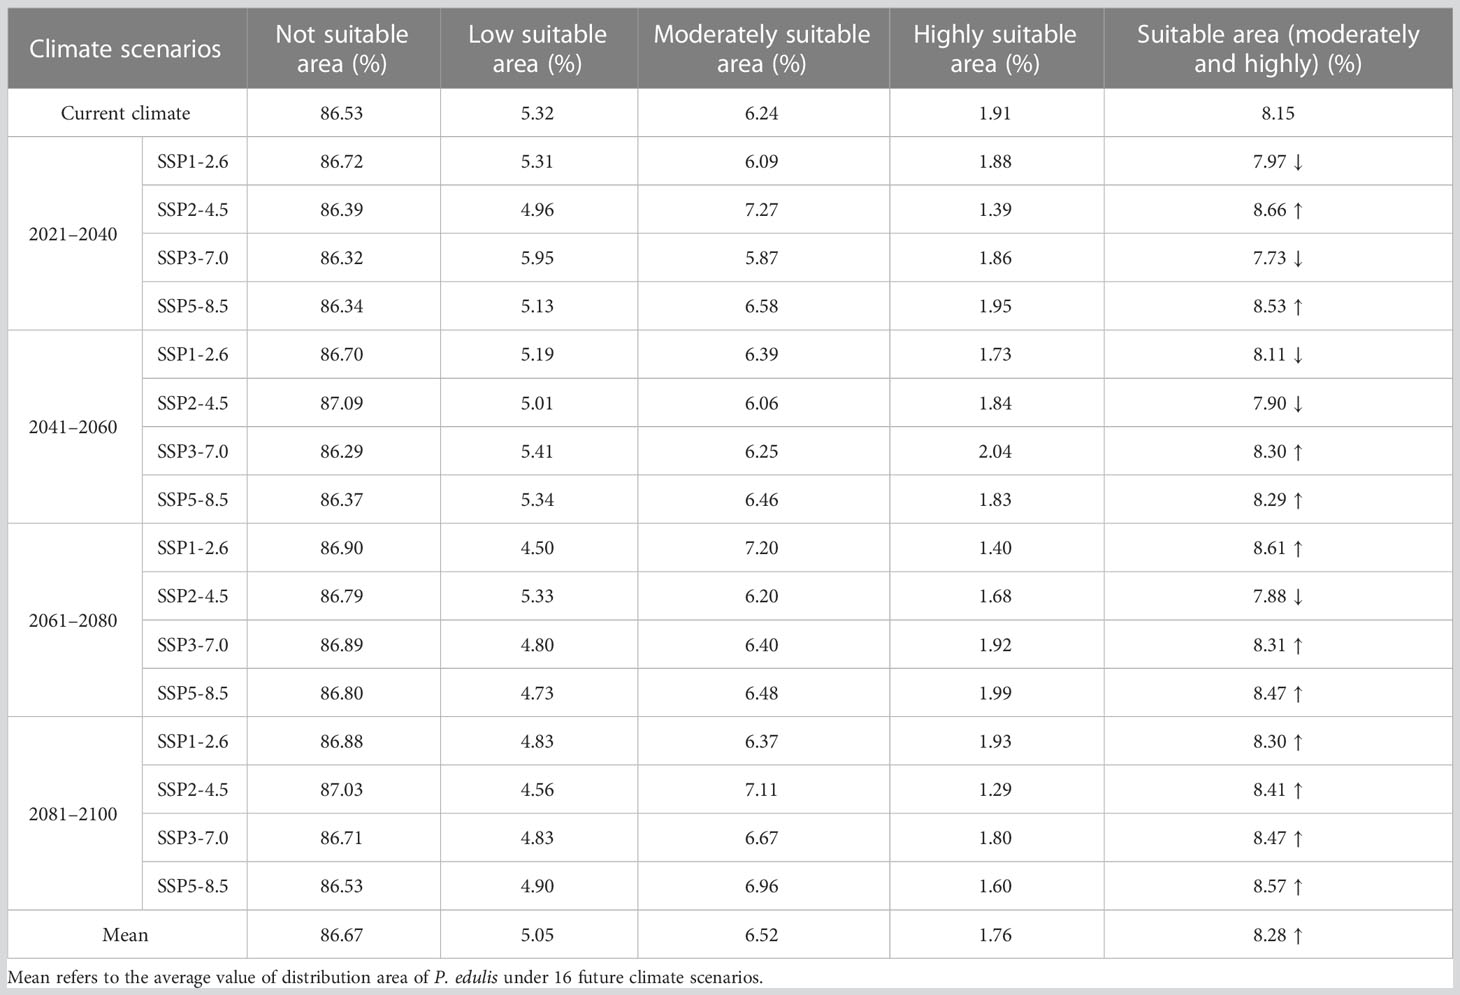
Table 5 Dynamics of changes in distribution area of P. edulis under different climate scenarios.
For Z. schneideriana, its average migration distance was 19.72 km under 16 future climate scenarios, with most migratory directions towards northeast. The furthest migration distance was 33.75 km which occurred in 2021–2040 under the SSP3-7.0 climate scenario (Figure 6A1). The maximum migration distance was in 2021–2040 under SSP3-7.0 climate scenario, and the maximum was in 2081–2100 under the other three climate scenarios (SSP1-2.6, SSP2-4.5, SSP5-8.5) (Figures 6B1–E1). For C. sinensis, the average migration distance was 36.88 km under 16 future climate scenarios, with all migratory directions towards southwest. The furthest distance was 51.15 km which occurred in 2081–2100 under the SSP5-8.5 climate scenario (Figure 6A2). The maximum migration distance was in 2061–2080 under SSP1-2.6 and SSP2-4.5 climate scenario, and the maximum was in 2081–2100 under the other two climate scenarios (SSP3-7.0, SSP5-8.5) (Figures 6B2–E2). For P. edulis, its average migration distance was 13.07 km under 16 future climate scenarios, with most migratory directions towards west. The furthest migration distance was 28.53 km which occurred in 2081–2100 under the SSP5-8.5 climate scenario (Figure 6A3). The maximum migration distance presented in 2041–2060 under SSP1-2.6 climate scenario, and the maximum presented in 2081–2100 under the other three climate scenarios (SSP2-4.5, SSP3-7.0, SSP5-8.5) (Figures 6B3–E3).
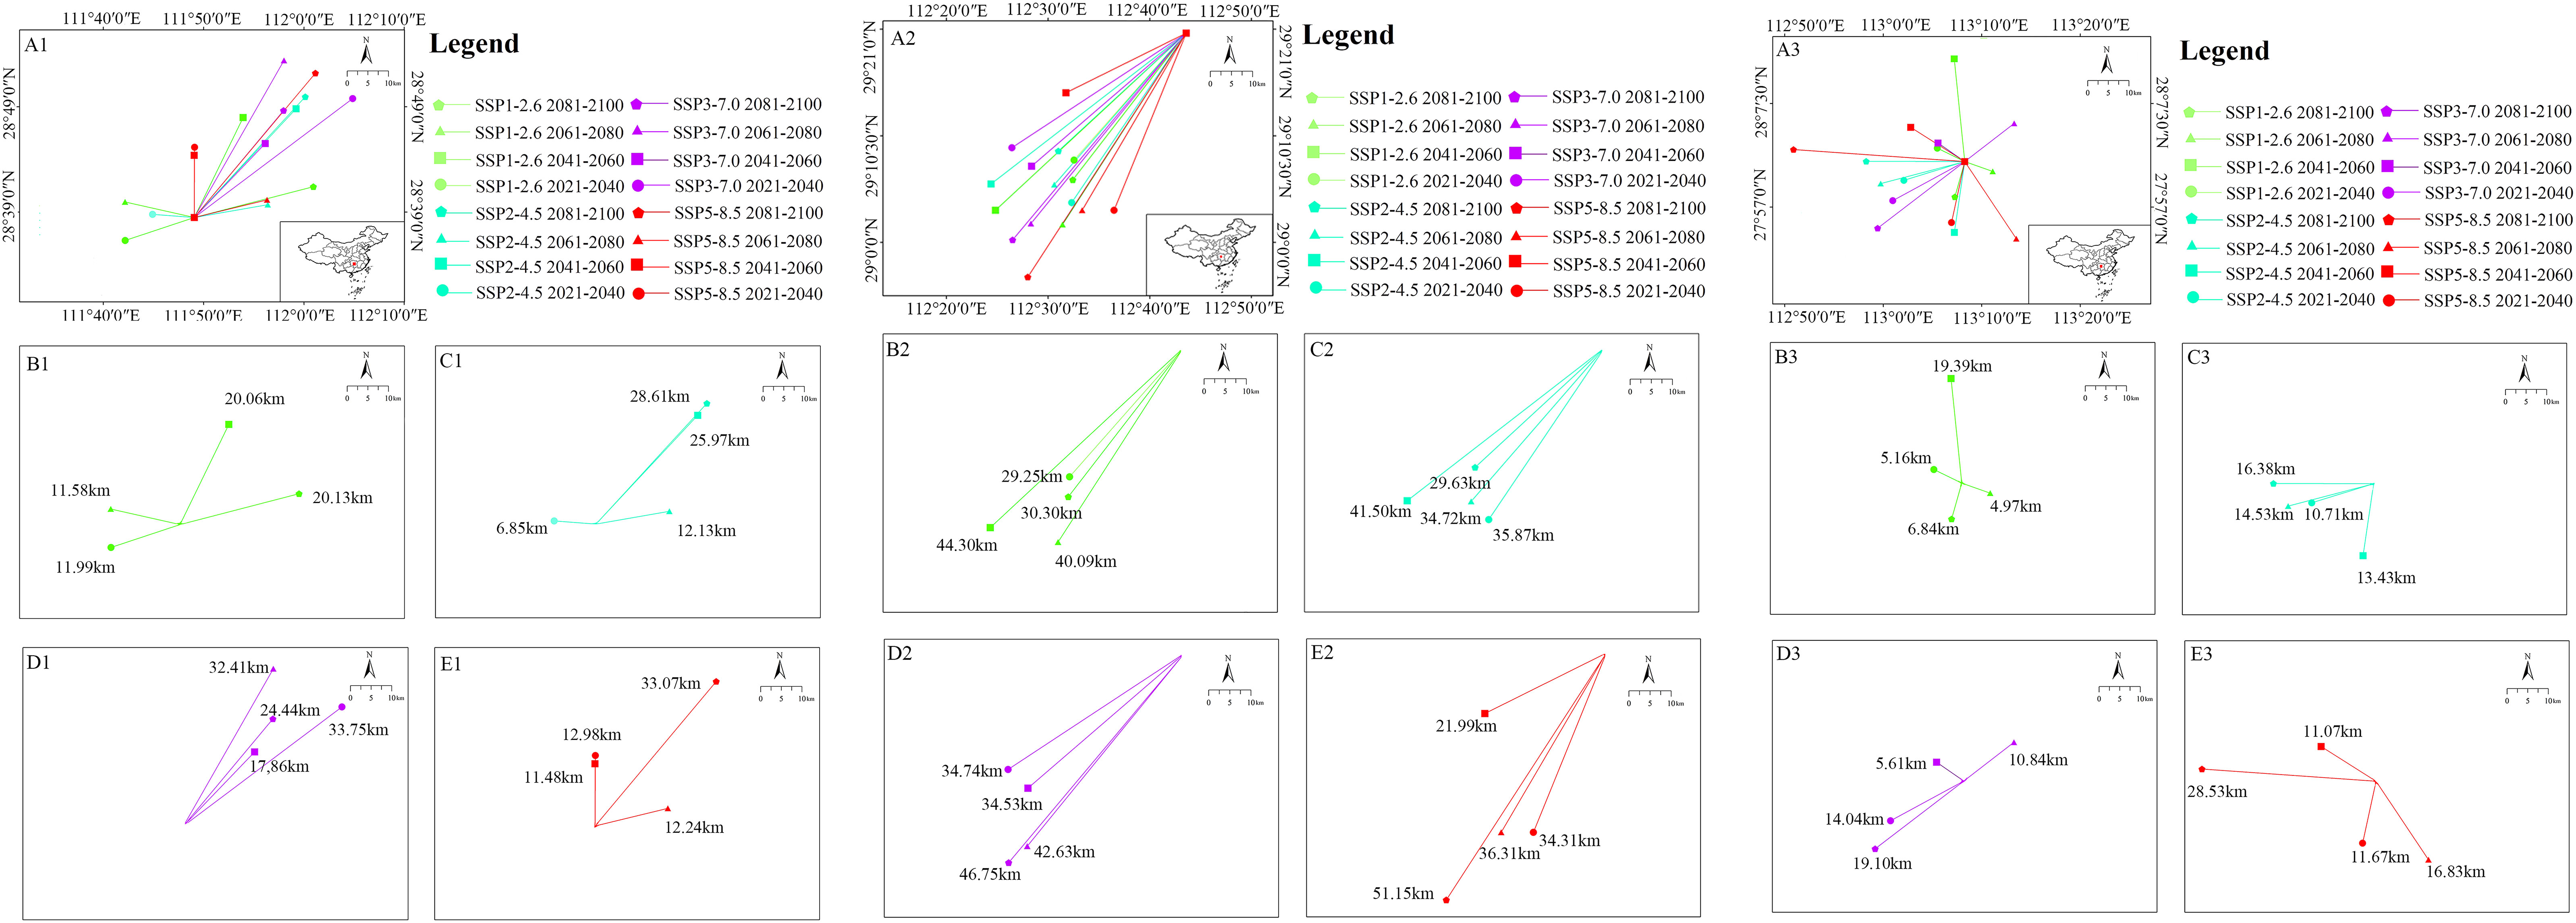
Figure 6 Migration of the core distribution in suitable areas of three species. (A1) Shift of the core distribution in the suitable area of Zelkova schneideriana under all climate scenarios; (B1) Under SSP1-2.6; (C1) Under SSP2-4.5; (D1) Under SSP3-7.0; and (E1) Under SSP5-8.5 climate change scenarios. (A2–E2) The core distribution of Celtis sinensis; (A3–E3) The core distribution of Phyllostachys edulis.
The current distance of core distribution between Z. schneideriana and C. sinensis was 117.85 km, and the distance between Z. schneideriana and P. edulis was 148.92 km. In addition, the core distribution of the three species occurred in Hunan Province in the future.
3.4 Niche overlap of two species pairs
Currently, the index D and I between Z. schneideriana and C. sinensis were 0.754 and 0.935, respectively. The index D and I between Z. schneideriana and P. edulis were 0.730 and 0.929, respectively (Table 6). This indicated that Z. schneideriana and its two associated species had a high niche overlap in the current scenario, which was consistent with the collected distribution points (Figure 3). In addition, the niche overlap of the former species pair was higher than that of the latter in terms of the index D and I.
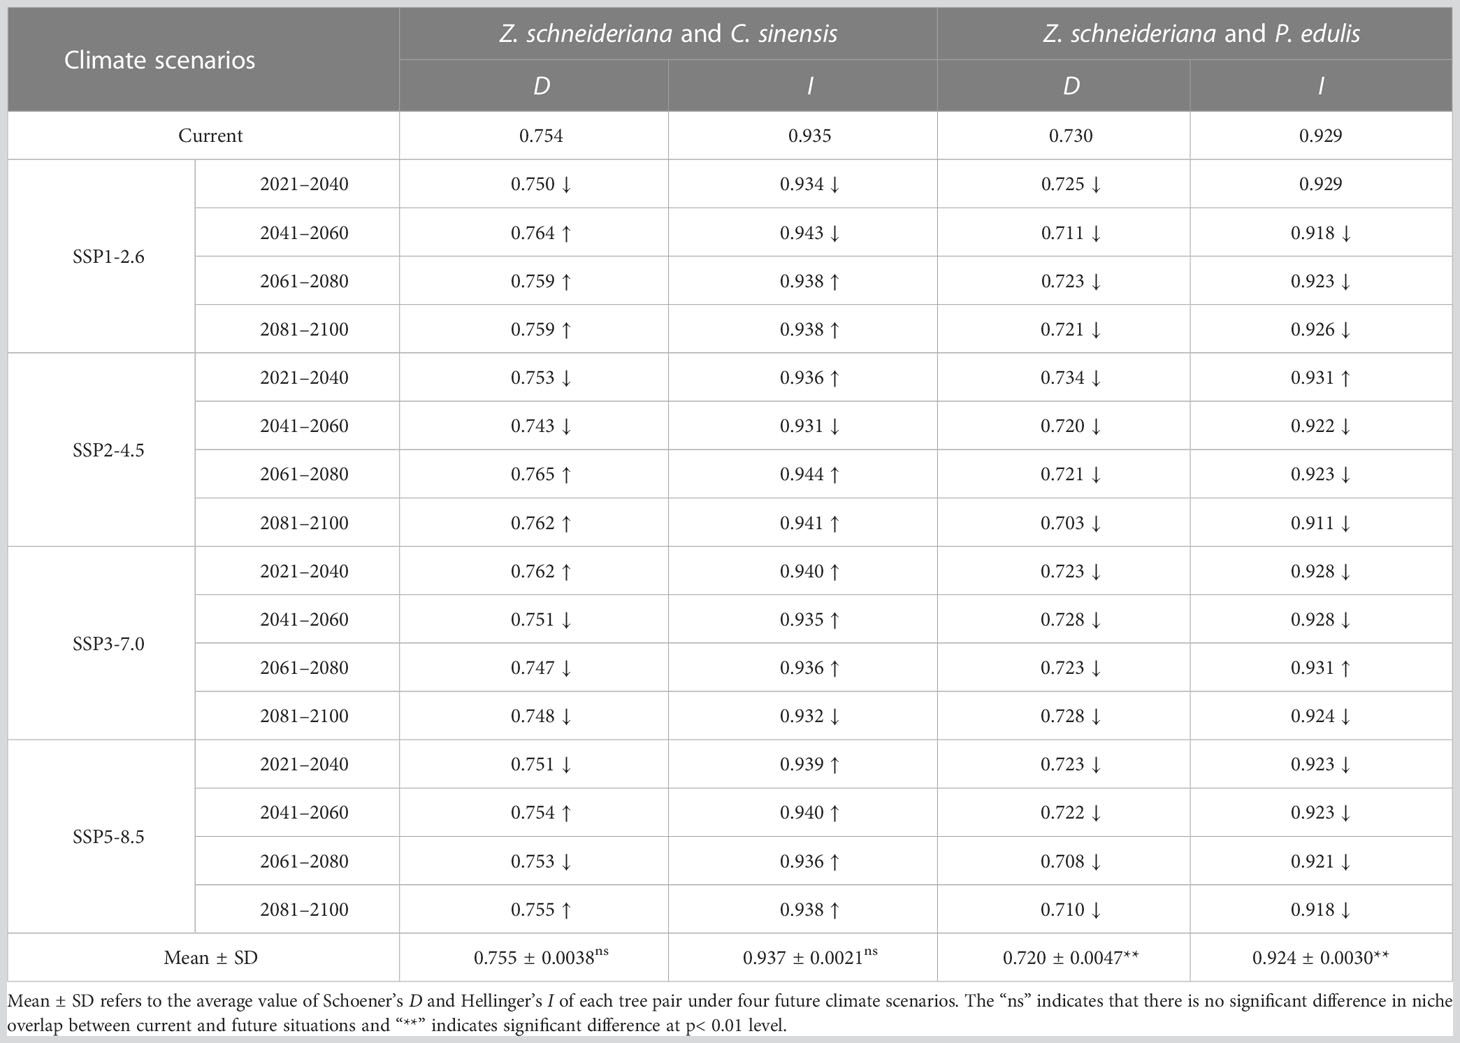
Table 6 Niche overlap in terms of Schoener’s Parameter (D) and Hellinger’s-Based Parameter (I) between Zelkova schneideriana and its two dominant species in the community under different climate scenarios.
The mean values of D and I indexes (D=0.755 ± 0.0038, I=0.938 ± 0.0021) of Z. schneideriana and C. sinensis under 16 future climate scenarios were greater than those in the current scenario (D=0.754, I=0.935), indicating that niche overlap of such species pair would increase in the future. Its niche overlap index reached the highest value (D=0.765, I=0.944) under SSP2-4.5 2061–2080. The mean values of D and I indexes (D=0.720 ± 0.0047, I=0.924 ± 0.0030) of Z. schneideriana and P. edulis under 16 future climate scenarios were less than those in the current scenario (D=0.730, I=0.929), indicating that niche overlap of such species pair would decrease in the future. Its niche overlap index appeared the minimum (D=0.703, I=0.911) under SSP2-4.5 2081–2100. In addition, the results of t-test showed that there was a highly significant difference (p< 0.01) in niche overlap of D and I values for the species pair Z. schneideriana and P. edulis, respectively. There was no significant difference (p > 0.05) in niche overlap of D or I values for the species pair Z. schneideriana and C. sinensis, respectively.
Collectively, the D values of the two species pairs were > 0.7, indicating they had high niche overlap. Likewise, their I values were all > 0.9 (Table 6), which was in close proximity to 1.0. Therefore, the D and I values show that both species pairs have a high niche overlap under current and future climates.
4 Discussion
4.1 The key influencing factors of endangered Zelkova schneideriana and its associated trees
Our Maxent models showed that bioclimatic factors had the greatest influence on Z. schneideriana among the bioclimatic, topographic and soil factors (Appendix Table 2). Among the seven bioclimatic variables, the first four were Bio6, Bio2, Bio15, and Bio4, respectively, with the total contribution up to 92.6%. This is in agreement with the report (Sun et al., 2020), in which bioclimatic factors also play a significant role in influencing Z. schneideriana distribution among the three categories of environmental variables including bioclimate, topography, and human activity intensity. Our results and previous research have demonstrated that bioclimates seem to affect the distribution of Z. schneideriana more greatly than the other factors.
Amongst the four key variables, the bioclimatic variables which most affected the distribution of Z. schneideriana were Min temperature of coldest month (Bio6), followed by Mean diurnal range (Bio2), with the total contribution of 78.9%. It is found that the two factors are related to temperature, suggesting that for Z. schneideriana temperature is more important than precipitation among these bioclimatic factors. This could result from the climatic range of Z. schneideriana and its seed germination mode. Z. schneideriana is widely distributed in the subtropical zone of China, which enjoys abundant precipitation all year round and large temperature difference from south to north (Che et al., 2020). Thus, it seems unlikely that water herein may be a limiting factor for its growth. Meanwhile, Z. schneideriana has the characteristic of dormancy, and requires appropriate temperature to break its dormancy when germinating (Li et al., 2020). Thus, temperature tends to be the limiting factor for Z. schneideriana relative to precipitation. However, Sun et al. (2020) contended that the precipitation had greater impact than temperature on Z. schneideriana distribution since the contribution rate of Driest quarter and Annual precipitation reached 79.6% in their study.
We assumed that such difference may be ascribed to four reasons. Firstly, for Z. schneideriana all of the occurrence points (i.e. 312) were wild in our study while not all points (i.e. 225) were wild in their study (Sun et al., 2020). Generally, for a tree species its cultivated distribution points only reflect the environmental conditions in a short term during which such tree is introduced and has survived. In contrast, its wild distribution points can better reveal the environmental conditions where it grows (Zhang, 2001). Secondly, Maxent model has multiple advantages, but it is difficult to avoid the sample selection bias (Yackulic et al., 2013). We applied the SDMtoolbox in ArcGIS to spatially rarefy the occurrence data for each species to eliminate spatial autocorrelation. Thirdly, screening environmental factors can reduce the complexity of the model simulation (Zurell et al., 2020). We conducted correlation analysis to reduce multicollinearity among the environmental variables for these species. Fourthly, to prevent overfitting for the Maxent model, we have set FC and RM to improve the model accuracy (Zhang et al., 2023). Moreover, the assessment results indicated that the simulation of the model is reliable for each species currently and in the future. Additionally, we used the latest Shared Socio-economic Pathways (SSP) released in 2020, instead of the Representative Concentration Pathways (RCP) in 2013. Compared with RCPs, SSPs can better reflect the correlation between socio-economic development and climate scenarios, thus making the prediction close to the real situation (Gao et al., 2021).
Currently, there is no consensus as to the grid size (resolution) in predictive species distribution modeling. Theoretically, the grid size is closely related to both studied taxa and region. Given that each of the three species has a large number of occurrence records and a wide distribution range, we adopted the climate data with the grid size of 2.5 arc min. Such a practice is also employed for other plant species, such as Pteris vittata (Xu et al., 2022), Tetrastigma hemsleyanum (Wang et al., 2022), Fritillaria spp. (Jiang et al., 2022), etc. Accordingly, we think that if a species has many occurrence records and a wide range, it seems reasonable to use 2.5 arc min predict its potential distribution. Conversely, if a species has a few occurrence records and a narrow range, it seems reasonable to use 30 arc seconds. A case in point is the relict tree Cathaya argyrophylla, endemic to China. Xiao et al. (2022) forecasted its potentially suitable habitats with 136 distribution points in Hunan, central China. For another example, Gafna et al. (2023) predicted the potential distribution of anti-malarial plants with several dozen occurrence points in Kenya.
For the associated C. sinensis, the first leading variable was Precipitation of driest month (Bio14), accounting for 54.6%. Likewise, for the associated P. edulis, the first was Precipitation of driest month (Bio14), accounting for 87.9%. As far as the associated trees are concerned, the variable Bio14, a water-related factor, has more than half of the whole contribution. Moreover, each species pair has a common influencing environmental factor. i.e. it is Bio6 for Z. schneideriana vs. C. sinensis; Bio4 for Z. schneideriana vs. P. edulis (Table 2).
The common key factor affecting the distribution of Z. schneideriana and C. sinensis was: the Coldest temperature in coldest month (Bio6). The common key factor affecting the distribution of Z. schneideriana and P. edulis was: Temperature seasonality (Bio4). The common key factor of C. sinensis and P. edulis was Precipitation of driest month (Bio14). Therefore, the endangered Z. schneideriana and its two associated tree species may well share similar requirements for environmental conditions. Song (2013) characterized the ecological behavior of 3,401 seed plants in subtropical forests of China. They selected five ecological indication values including light, temperature, water, soil reaction and soil fertility, and each of them is divided into nine levels. Following the classification, the three dominant species of Zelkova communities in our study have the same ecological indication values: temperature (i.e. 7), water (5), and soil fertility (6), only having slight differences in light and soil reaction. Therefore, the analyses of influencing factors and ecological characteristics indicate that Z. schneideriana, C. sinensis and P. edulis have high similarity in environmental requirements.
4.2 Asynchrony of potential niche overlap between species pairs
According to our results, both species pairs of Z. schneideriana vs. C. sinensis, Z. schneideriana vs. P. edulis have D values > 0.7 and I values > 0.9, indicating that Z. schneideriana and its two associated species have high niche overlap in current scenario (Table 6). At the same time, the contribution of environmental factors of three species (Table 2) indicates that they have similar environmental requirements. Therefore, our results show that there is an intense competition between endangered Z. schneideriana and its two associated tree species. This is consistent with the result from community ecology (Shao and Zhang, 2021) that C. sinensis and P. edulis are the main competing tree species of Z. schneideriana in subtropical forest communities, eastern China.
This competition relationship will take a change in the future climate scenarios. We think that, as time goes on, the response of three species to climate change may not be always the same as that of the ecological relationship of two species pairs. Namely, our findings confirm that the two species pairs respond differently to future global warming in light of niche overlap shift. Compared with current scenario (D=0.754), the D mean values of Z. schneideriana vs. C. sinensis (D=0.755 ± 0.0038) increased in the 16 future climate concentration scenarios, reaching the highest value in SSP1-2.6 2041–2060 (D=0.764). The I mean values of this species pair in the future (I=0.938 ± 0.0021) also increased compared with current scenario (I=0.929), reaching the highest value in the SSP2-4.5 2061–2080 (I=0.944) (Table 6). As a result, the species pair presented a similar future trend in terms of D values and I values, indicating that Z. schneideriana and C. sinensis may compete more strongly in the future than currently. In contrast, the D mean values of Z. schneideriana vs. P. edulis (D=0.720 ± 0.0047) decreased in the 16 future climate concentration scenarios relative to the current (D=0.730), reaching the lowest value in SSP5-8.5 2061–2080 (D=0.708). The I mean values of this species pair in the future (I=0.924 ± 0.0030) also decreased compared with current scenario (I=0.929), reaching the lowest value in the SSP2-4.5 2081–2100 (I=0.911) (Table 6). As a result, the species pair presented a similar future trend in terms of D values and I values, indicating that Z. schneideriana and P. edulis may reduce competition in the future. Therefore, there is obvious asynchrony between the two species pairs in response to future climate warming although the endangered Z. schneideriana and its neighbors C. sinensi, P. edulis have similar environmental requirements.
This asynchrony is related to the different future change in potential suitable ranges of the three species. Firstly, for the species pair Z. schneideriana vs. C. sinensis, the niche overlap will rise in the future. This is due to the fact that both species present a similar tendency in potential suitable areas (Tables 3, 4). For the other species pair Z. schneideriana vs. P. edulis, the niche overlap will decline in the future (Table 6). This is due to the fact that both species present a different tendency in potential suitable areas (Tables 3, 5). Secondly, core distribution migration can usually indicate the change of suitable area (Yan et al., 2021). Z. schneideriana’s core distribution (28.641°N, 111.818°E) is located to the southwest of C. sinensis’s (29.3438°N, 112.726°E) in current period. Its suitable area moves northeast in the future while C. sinensis moves southwest in the future (Figure 6), thus rendering the distance between them short in the future. Therefore, this results in their increased niche overlap. Z. schneideriana’s core distribution is located to the northwest of P. edulis’s (28.056°N, 113.188°E) in current period. P. edulis moves southwest in the future (Figure 6), thus rendering the distance between them farther away in the future. Therefore, this results in their decreased niche overlap.
In brief, for Z. schneideriana vs. C. sinensis, their core distributions may become much closer in the future than at present, and accordingly their distribution ranges also become closer to each other, thereby leading to the increase in niche overlap. Conversely, for Z. schneideriana vs. P. edulis, their core distributions may become much farther away in the future than at present, and accordingly their distribution ranges also become farther away from each other, thereby leading to the decrease in niche overlap. Therefore, the results of core distribution migration indicate that the two species pairs have appeared distinctive niche overlap shift in response to climate warming.
Moreover, such asynchrony is also related to ecological characteristics of the tree species. Compared with P. edulis, the endangered Z. schneideriana and its associated species C. sinensis are more similar in tree traits. Firstly, both Z. schneideriana and C. sinensis are light-demanding deciduous trees, with deep root system, in the same family of Ulmaceae (Shen, 2020; Shao and Zhang, 2021). P. edulis is a large evergreen monopodial bamboo with shallow root systems (Wang and Stapleton, 2006). Secondly, Z. schneideriana and C. sinensis pay little emphasis on soil, and they can grow in a variety of soil types including slightly acid, alkalescent, neutral, ad calcareous soils (Ling et al., 2011; Shen, 2020). Compared with common tree species, P. edulis has high requirements for soil conditions, and thereby grows well in moist, fertile, well-drained acid sandy loam soils (Jin et al., 2013). Thirdly, Z. schneideriana and C. sinensis are similar in reproductive mode. Both can produce a large number of drupes each year, and depend largely on sexual reproduction from seeds (Fang et al., 2007; Ling et al., 2011). P. edulis can regenerate its population by means of asexual and sexual reproduction. However, the most common mode for P. edulis is asexual reproduction, and it relies on underground rhizomes that quickly spread nearby (Wang et al., 2016).
In addition, Z. schneideriana is the Tertiary relic tree endemic to China among the three subtropical forest tree species (Shao and Zhang, 2021). It is difficult for this plant to change its tree trait in the next few decades because such trait has developed during its long-term evolution. This may also be one of the major reasons for the distinctive response of niche overlap of the two species pairs to future climate change.
4.3 Implications for protection and management of Zelkova schneideriana
Our results indicate that the key factors influencing the distribution of the endangered Z. schneideriana are temperature-related bioclimatic factors, which may play a more significant role than precipitation-related ones. Among them, the most important factor is Bio6, whose optimum range is −4.9–4.9°C. Our prediction results also show that its current area is 106.50 ×10⁴ km2, which is larger than previous prediction (Sun et al., 2020). The high suitable area of this species is mostly located in Anhui, Hubei, Hunan, Jiangsu, and Zhejiang provinces; at the same time, there is severe habitat fragmentation in these regions (Figure 5A). Z. schneideriana, endemic to China, is widely distributed in more than ten provinces in the country. However, due to its excellent timber quality and high commodity utilization value, it has been excessively logged and deforested over the past decades (Shao and Zhang, 2021), resulting in its population declining and range shrinking. For example, according to the first national survey of key protected wild plant, there were only eight individuals of this species in Guangdong Province (Ma and Zhang, 2009). Simultaneously, its seed dormancy, low seed germination rate, and limited seed dispersal jointly contribute to the difficulties in population regeneration, thus making it endangered in the wild. In fact, this species has been once again ranked second class on the list of ‘The important wild plants for conservation in China’ since 2021.
Therefore, our study informs that more attention should be paid to these areas when protecting Z. schneideriana populations in subtropical regions of China. Particularly, Hunan is worth for special concern because the current and future core distributions are located in this province. In the future, the suitable area of Z. schneideriana will decrease and it may migrate northeastward, which is broadly in line with previous study (Sun et al., 2020). This non-synchronicity is likely to further shape the interspecific competition between Zelkova schneideriana (or its associated species) versus the resident species in its newly acquired habitat through spatial mismatches, thus affecting the composition, structure and dynamics of the future plant community. Therefore, our study may provide an important insight into future conservation and effective management of Z. schneideriana in China.
More importantly, our study provides a new perspective on the conservation of endangered tree species in Chinese subtropical forests. We selected the endangered Z. schneideriana and its two associated tree species (C. sinensis and P. edulis) from different subtropical forest communities (deciduous broad-leaf forest, bamboo and broad-leaf mixed forest), and divided them into two species pairs: Z. schneideriana vs. C. sinensis, and Z. schneideriana vs. P. edulis. Then we explored how the ecological relationship between the endangered species and associated ones in different types of subtropical forests responded to climate change. Our findings indicate that there is a considerable difference in niche overlap of the two species pairs in response to climate warming. Namely, the habitat competition between Z. schneideriana and C. sinensis is likely to be much greater while the habitat competition between Z. schneideriana and P. edulis is likely to be less in the future. Therefore, our findings highlight that the effect of climate change on the distribution of endangered trees in subtropical region should be taken into account, as well as the effect on ecological relationship between endangered trees and the surrounding associated trees in the forest communities.
5 Conclusion
The impact of future climate on the distribution of endangered Z. schneideriana is of vital importance for conservation. We selected this species and its two associated trees (C. sinensis and P. edulis) as focus species from two subtropical forest communities (i.e. deciduous broad-leaf forest, bamboo and broad-leaf mixed forest) in China, divided them into two species pairs: Z. schneideriana vs. C. sinensis, and Z. schneideriana vs. P. edulis. Our Maxent models indicate that temperature-related factors have the greatest influence on Z. schneideriana. Its current suitable area is mostly located in the subtropical region of China, especially in Anhui, Hubei, Hunan, Jiangsu, and Zhejiang provinces; its suitable area will decrease in the future scenarios, with the core distribution migrating northeastward. More importantly, our findings confirm that there is a notable asynchrony of potential niche overlap between species pairs in terms of Schoener’s D and I values. Our study provides a new perspective on the conservation of endangered tree species in subtropical forests of China, and highlights the effect of climate change on ecological relationship between endangered trees and the surrounding associated trees in the future. In addition, we identify the key natural factors (i.e. bioclimatic, topographic, edaphic) influencing the potential distribution of these focus species, and the impact of spatiotemporal changes of land use and land cover may deserve further study in the future.
Data availability statement
The original contributions presented in the study are included in the article/Supplementary Material. Further inquiries can be directed to the corresponding author.
Author contributions
YZ: Software, Formal analysis, Data curation, Writing–original draft. XL: Methodology, Resources, Investigation. GZ: Supervision, Conceptualization, Investigation, and Revision. All authors contributed to the article and approved the submitted version.
Funding
This work was financially supported by investigation and monitoring of rare and endangered plants in Jiangsu (No. JS2022064).
Acknowledgments
We are very grateful to Liyuan Shao, Ge Yan, Hanwei Cai, and Kaidi Li for their assistance in field work and helpful discussion. We also thank Yanfu Qu for his assistance in optimizing the MaxEnt model.
Conflict of interest
The authors declare that the research was conducted in the absence of any commercial or financial relationships that could be construed as a potential conflict of interest.
Publisher’s note
All claims expressed in this article are solely those of the authors and do not necessarily represent those of their affiliated organizations, or those of the publisher, the editors and the reviewers. Any product that may be evaluated in this article, or claim that may be made by its manufacturer, is not guaranteed or endorsed by the publisher.
Supplementary material
The Supplementary Material for this article can be found online at: https://www.frontiersin.org/articles/10.3389/fevo.2023.1218149/full#supplementary-material
References
Abolmaali S. M.-R., Tarkesh M., Bashari H. (2018). Maxent modeling for predicting suitable habitats and identifying the effects of climate change on a threatened species, Daphne mucronata, in central Iran. Ecol. Inform. 43, 116–123. doi: 10.1016/j.ecoinf.2017.10.002
Allouche O., Tsoar A., Kadmon R. (2006). Assessing the accuracy of species distribution models: prevalence, kappa and the true skill statistic (TSS). J. Appl. Ecol. 43, 1223–1232. doi: 10.1111/j.1365-2664.2006.01214.x
Bellard C., Bertelsmeier C., Leadley P., Thuiller W., Courchamp F. (2012). Impacts of climate change on the future of biodiversity. Ecol. Lett. 15, 365–377. doi: 10.1111/j.1461-0248.2011.01736.x
Broennimann O., Fitzpatrick M. C., Pearman P. B., Petitpierre B., Pellissier L., Yoccoz N. G., et al. (2012). Measuring ecological niche overlap from occurrence and spatial environmental data. Global Ecol. Biogeogr. 21, 481–497. doi: 10.1111/j.1466-8238.2011.00698.x
Brown J. L. (2014). SDMtoolbox: a python-based GIS toolkit for landscape genetic, biogeographic and species distribution model analyses. Methods Eco. Evol. 5, 694–700. doi: 10.1111/2041-210X.12200
Brown J. L., Bennett J. R., French C. M. (2017). SDMtoolbox 2.0: the next generation Python-based GIS toolkit for landscape genetic, biogeographic and species distribution model analyses. PeerJ 5, e4095. doi: 10.7717/peerj.4095
Che J., Zheng J., Jiang Y., Jin Y., Yi Y. (2020). Separation of phylogeny and ecological behaviors between evergreen and deciduous woody angiosperms in the subtropical forest dynamics plots of China. Chin. J. Plant Ecol. 44 (10), 1007–1014. doi: 10.17521/cjpe.2020.0174
Chen Q., Yin Y., Zhao R., Yang Y., Jaime A., Yu X. (2020). Incorporating local adaptation into species distribution modeling of Paeonia mairei, an endemic plant to China. Front. Plant Sci. 10. doi: 10.3389/fpls.2019.01717
Davic R. D. (2003). Linking keystone species and functional groups: a new operational definition of the keystone species concept. Conserv. Ecol. 7 (1), r11. doi: 10.5751/ES-00502-0701r11
Diffenbaugh N. S., Singh D., Mankin J. S., Horton D. E., Swain D. L., Touma D., et al. (2017). Quantifying the influence of global warming on unprecedented extreme climate events. PNAS 114 (19), 4881–4886. doi: 10.1073/pnas.1618082114
Fang Y. P., Liu S. X., Xiang J., Ge J. W. (2007). Study on the natural population distribution of Zelkova schneideriana in Hubei. Resour. Environ. Yangtze Basin. 16 (6), 744–747.
Feng X., Park D. S., Liang Y., Pandey R., Papeş M. (2019). Collinearity in ecological niche modeling: confusions and challenges. Ecol. Evol. 9, 10365–10376. doi: 10.1002/ece3.5555
Franco-Estrada D., Ortiz E., Villaseñor J. L., Arias S. (2022). Species distribution modelling and predictor variables for species distribution and niche preferences of Pilosocereus leucocephalus group s.s. (Cactaceae). Syst. Biodivers. 20 (1), 1–17. doi: 10.1080/14772000.2022.2128928
Fu L. G., Xin Y. Q., Whittemore A. (2003). “Ulmaceae,” in Flora of China, Vol. 5 . Eds. Wu Z. Y., Raven P. H. (Beijing: Science Press), 1–19.
Gafna D. J., Obando J. A., Kalwij J. M., Dolos K., Schmidtlein S. (2023). Climate change impacts on the availability of anti-malarial plants in Kenya. Clim. Change Ecol. 5, 100070. doi: 10.1016/j.ecochg.2023.100070
Gao T., Xu Q., Liu Y., Zhao J. Q., Shi J. (2021). Predicting the potential geographic distribution of Sirex nitobei in China under climate change using maximum entropy model. Forests 12 (2), 151. doi: 10.3390/F12020151
Guisan A., Graham C. H., Elith J., Huettmann F. (2007). Sensitivity of predictive species distribution models to change in grain size. Divers. Distrib. 13, 332–340. doi: 10.1111/j.1472-4642.2007.00342.x
He P., Li J. Y., Li Y. F., Xu N., Gao Y., Guo L. F., et al. (2021). Habitat protection and planning for three Ephedra using the MaxEnt and marxan models. Ecol. Indic. 133, 1470–160X. doi: 10.1016/j.ecolind.2021.108399
Hyseni C., Garrick R. C., Garrick R. C. (2019). Ecological drivers of species distributions and niche overlap for three subterranean termite species in the southern Appalachian mountains, USA. Insects 3, 148. doi: 10.3390/insects11030148
Jalaeian M., Golizadeh A., Sarafrazi A., Naimi B. (2018). Inferring climatic controls of rice stem borers’ spatial distributions using maximum entropy modelling. J. Appl. Entomol. 142, 388–396. doi: 10.1111/jen.12493
Jiang R., Zou M., Qin Y., Tan G. D., Huang S. P., Quan H. G. (2022). Modeling of the potential geographical distribution of three Fritillaria species under climate change. Front. Plant Sci. 12. doi: 10.3389/fpls.2021.749838
Jin J. X., Jiang H., Peng W., Zhang L. J., Lu X. H., Xu J. H., et al. (2013). Evaluation of soil factors on potential distribution of Chinese bamboo based on species distribution model. J. Plant Ecol. 37 (7), 631–640. doi: 10.3724/SP.J.1258.2013.00065
Kong W., Li X., Zou H. (2019). Optimization of maximum entropy model in species distribution prediction. Chin. J. Appl. Ecol. 30 (6), 2116–2128. doi: 10.13287/j.1001-9332.201906.029
Li G. X., Sun L. P., Zhang K. L. (2020). Seed dormancy and germination of Zelkova schneideriana. J. Jiangsu Forestry Sci. Technol. 47 (6), 23–27. doi: 10.3969/j.issn.1001-7380.2020.06.005
Ling Y., Zhang G. F., Wang R. (2011). Dynamics of Celtis sinensis population in Laoshan national forest park of Nanjing. J. Ecol. Rural Environ. 27 (2), 28–34.
Liu C., White M., Newell G. (2013). Selecting thresholds for the prediction of species occurrence with presence-only data. J. Biogeogr. 40, 778–789. doi: 10.1111/jbi.12058
Liu Q., Yang Z., Wang C., Han F. (2019). Temporal-spatial variations and influencing factor of land use change in Xinjiang, central Asia, from 1995 to 2015. Sustainability 11 (3), 1–14. doi: 10.3390/su11030696
Liu H. L., Zhang R. Q., Geng M. L., Zhu J. Y., An J. C., Ma J. L. (2016). Chloroplast analysis of Zelkova schneideriana (Ulmaceae): genetic diversity, population structure, and conservation implications. Genet. Mol. Resour. 15, 1–9. doi: 10.4238/gmr.15017739
Lu X., Jiang R. Y., Zhang G. F. (2022). Predicting the potential distribution of four endangered holoparasites and their primary hosts in China under climate change. Front. Plant Sci. 13. doi: 10.3389/FPLS.2022.942448
Ma Y., Lu X., Li K., Wang C., Guna A., Zhang J. (2021). Prediction of potential geographical distribution patterns of Actinidia arguta under different climate scenarios. Sustainability 13 (6), 3526. doi: 10.3390/SU13063526
Ma F., Zhang J. L. (2009). Investigation on key protected wild plant resources in China (Beijing: China Forestry Publishing House), 177–178.
Mahatara D., Acharya A. K., Dhakal B. P., Sharma D. K., Ulak S., Paudel P. (2021). Maxent modelling for habitat suitability of vulnerable tree Dalbergia latifolia in Nepal. Silva Fennica 55, 10441. doi: 10.14214/SF.10441
Majumdar K., Adhikari D., Datta B. K., Barik S. K. (2019). Identifying corridors for landscape connectivity using species distribution modeling of Hydnocarpus kurzii (King) Warb., a threatened species of the indo-Burma biodiversity hotspot. Landsc. Ecol. Eng. 15, 13–23. doi: 10.1007/s11355-018-0353-2
McNichol B. H., Russo S. E. (2023). Plant species’ capacity for range shifts at the habitat and geographic scales: a trade-off-based framework. Plants 12, 1248. doi: 10.3390/plants12061248
Merow C., Silander J. A., Warton D. (2014). A comparison of maxlike and maxent for modelling species distributions. Methods Ecol. Evol. 5, 215–225. doi: 10.1111/2041-210X.12152
Midgley G. F., Thuiller W. (2005). Global environmental change and the uncertain fate of biodiversity. New Phytol. 167, 638–641. doi: 10.1111/j.1469-8137.2005.01522.x
Muscarella R., Galante P. J., Soley-Guardia M., Boria R. A., Kass G. M., Uriarte M., et al. (2014). ENMeval: an r package for conducting spatially independent evaluations and estimating optimal model complexity for maxent ecological niche models. Methods Eco. Evol. 5 (11), 1198–1205. doi: 10.1111/2041-210x.12261
Namitha L. H., Achu A. L., Sudhakar-Reddy C., Suhara-Beevy S. (2022). Ecological modelling for the conservation of Gluta travancorica Bedd. - an endemic tree species of southern Western Ghats, India. Ecol. Inform. 71, 1574–9541. doi: 10.1016/j.ecoinf.2022.101823
Ovaskainen O., Skorokhodova S., Yakovleva M., Sukhov A., Kutenkov A., Kutenkova N., et al. (2013). Community level phenological response to climate change. PNAS 110 (33), 13434–13439. doi: 10.1073/pnas.1305533110
Phillips S. J., Anderson R. P., Schapire R. E. (2006). Maximum entropy modeling of species geographic distributions. Ecol. Model. 190 (3), 231–259. doi: 10.1016/j.ecolmodel.2005.03.026
Phillips S. J., Dudík M. (2008). Modeling of species distributions with maxent: new extensions and a comprehensive evaluation. Ecography 31, 161–175. doi: 10.1111/j.0906-7590.2008.5203.x
Ren Z., Zagortchev L., Ma J., Yan M., Li J. (2020). Predicting the potential distribution of the parasitic Cuscuta chinensis under global warming. BMC Ecol. 20, 28. doi: 10.1186/s12898-020-00295-6
Rödder D., Engler J. O. (2011). Quantitative metrics of overlaps in grinnellian niches: advances and possible drawbacks. Glob. Ecol. Biogeogr. 20, 915–927. doi: 10.1111/j.1466-8238.2011.00659.x
Schoener T. W. (1970). Nonsynchronous spatial overlap of lizards in patchy habitats. Ecology 51, 408–418. doi: 10.2307/1935376
Shao L. Y., Zhang G. F. (2021). Niche and interspecific association of dominant tree populations of Zelkova schneideriana communities in eastern China. Bot. Sci. 99 (4), 823–833. doi: 10.17129/botsci.2809
Shen G. F. (2020). Afforestation technology of main tree species in China Vol. 1151 (Beijing: China Forestry Publishing House), 1163.
Shi X. L., Chen X. L., Dai Y. W., Hu G. (2020). Climate sensitivity and feedbacks of BCC-CSM to idealized CO forcing from CMIP5 to CMIP6. J. Meteorol. Res. 34, 865–878. doi: 10.1007/s13351-020-9204-9
Song Y. C. (2013). Classification, ecology and conservation of evergreen broad-leaved forests (Beijing: Science Press), 369–492.
Sun J. J., Qiu H. J., Guo J. H., Xu X., Wu D. T., Zhong L., et al. (2020). Modeling the potential distribution of Zelkova schneideriana under different human activity intensities and climate change patterns in China. Glob. Ecol. Conserv. 21, e00840. doi: 10.1016/j.gecco.2019.e00840
Swets J. A. (1988). Measuring the accuracy of diagnostic systems. Science 240 (4857), 1285–1293. doi: 10.1126/science.3287615
Vincent H., Bornand C. N., Kempel A., Fischer M. (2020). Rare species perform worse than widespread species under changed climate. Biol. Conserv. 246, 108586. doi: 10.1016/j.biocon.2020.108586
Vitasse Y., Ursenbacher S., Klein G., Bohnenstengel T., Chittaro Y., Delestrade A., et al. (2021). Phenological and elevational shifts of plants, animals and fungi under climate change in the European Alps. Biol. Rev. 96 (5), 1816–1835. doi: 10.1111/brv.12727
Wan J. N., Mbari N. J., Wang S. W., Liu B., Mwangi B. N., Rasoarahona J. R., et al. (2021). Modeling impacts of climate change on the potential distribution of six endemic baobab species in Madagascar. Plant Diver. 43, 117–124. doi: 10.1016/j.pld.2020.07.001
Wang Y. X., Bai S. B., Binkley D., Zhou G., Fang F. (2016). The independence of clonal shoot’s growth from light availability supports moso bamboo invasion of closed-canopy forest. For. Ecol. Manage. 368, 105–110. doi: 10.1016/j.foreco.2016.02.037
Wang D., Cui B., Duan S., Chen J., Fan H., Lu B., et al. (2019). Moving north in China: the habitat of Pedicularis kansuensis in the context of climate change. Sci. Total Environ. 697, 133979. doi: 10.1016/j.scitotenv.2019.133979
Wang J., Qian Q., Zhang F., Jia X. J., He J. Q. (2022). The possible future changes in potential suitable habitats of Tetrastigma hemsleyanum (Vitaceae) in China predicted by an ensemble model. Glob. Ecol. Conserv. 35, 2351–9894. doi: 10.1016/j.gecco.2022.e02083
Wang Z. P., Stapleton C. (2006). “Poaceae,” in Flora of China, Vol. 22 . Eds. Wu Z. Y., Raven P. H. (Beijing: Science Press), 172–173
Warren D. L., Glor R. E., Turelli M. (2008). Environmental niche equivalency versus conservatism: quantitative approaches to niche evolution. Evolution 62, 2868–2883. doi: 10.1111/j.1558-5646.2008.00482.x
Warren D. L., Seifert S. N. (2011). Ecological niche modeling in maxent: the importance of model complexity and the performance of model selection criteria. Ecol. Appl. 21 (2), 335–342. doi: 10.1890/10-1171.1
Xiao F., She Y., She J., Zhang J., Zhang X., Luo C. (2022). Assessing habitat suitability and selecting optimal habitats for relict tree Cathaya argyrophylla in Hunan, China: integrating pollen size, environmental factors, and niche modeling for conservation. Ecol. Indic. 145, 1470–160X. doi: 10.1016/j.ecolind.2022.109669
Xu W., Du Q., Yan S., Cao Y., Liu X., Guan D. X., et al. (2022). Geographical distribution of As-hyperaccumulator Pteris vittata in China: environmental factors and climate changes. Sci. Total Environ. 803, 149864. doi: 10.1016/j.scitotenv.2021.149864
Yackulic C. B., Chandler R., Zipkin E. F., Royle J. A., Nichols J. D., Campbell Grant E. H., et al. (2013). Presence-only modelling using MAXENT: when can we trust the inferences? Methods Ecol. Evol. 4, 236–243. doi: 10.1111/2041-210x.12004
Yan X., Wang S., Duan Y., Han J., Huang D., Zhou J. (2021). Current and future distribution of the deciduous shrub Hydrangea macrophylla in China estimated by MaxEnt. Ecol. Evol. 11, 16099–16112. doi: 10.1002/ece3.8288
Yan G., Zhang G. F. (2022). Predicting the potential distribution of endangered Parrotia subaequalis in China. Forests 13, 1595. doi: 10.3390/F13101595
Yang H., Jiang Z. H., Li L. (2016). Biases and improvements in three dynamical downscaling climate simulations over China. Clim. Dyn. 47, 3235–3251. doi: 10.1007/s00382-016-3023-9
Ye X. Z., Zhang M. M., Lai W. F., Yang M. M., Fan H. H., Zhang G. F., et al. (2021). Prediction of potential suitable distribution of Minnan based on MaxEnt optimization model. Acta Ecol. Sin. 41 (20), 8135–8144. doi: 10.5846/stxb202007131822
Zhang G. F. (2020). Illustrations of the common plants in Tianmu Mountain (Beijing: Higher Education Press), 65.
Zhang Q., Shen X., Jiang X., Fan T., Liang X., Yan W. (2023). MaxEnt modeling for predicting suitable habitat for endangered tree Keteleeria davidiana (Pinaceae) in China. Forests 14, 394. doi: 10.3390/f14020394
Zhang H., Song J., Zhao H., Li M., Han W. (2021). Predicting the distribution of the invasive species Leptocybe invasa: combining MaxEnt and geodetector models. Insects 12 (2), 92. doi: 10.3390/insects12020092
Zhang G. F., Xiong T. S., Sun T., Li K. D., Shao L. Y. (2022). Diversity, distribution, and conservation of rare and endangered plant species in Jiangsu province. Biodivers. Sci. 30, 21335. doi: 10.17520/biods.2021335
Zhang Z. D., Zang R. G. (2007). Predicting potential distributions of dominant woody plant key-stone species in a natural tropical forest landscape of Bawangling, Hainan Island, south China. Chin. J. Plant Ecol. 31 (6), 1079–1091
Zurell D., Fritz S. A., Rönnfeldt A., Steinbauer M. J. (2023). Predicting extinctions with species distribution models. Cambridge Prisms: Extinction 1 (e8), 1–10. doi: 10.1017/ext.2023.5
Keywords: niche overlap, Maxent, Zelkova schneideriana, population centroid, suitable range
Citation: Zhou Y, Lu X and Zhang G (2023) Potentially differential impacts on niche overlap between Chinese endangered Zelkova schneideriana and its associated tree species under climate change. Front. Ecol. Evol. 11:1218149. doi: 10.3389/fevo.2023.1218149
Received: 06 May 2023; Accepted: 03 July 2023;
Published: 28 July 2023.
Edited by:
Jinliang Liu, Wenzhou University, ChinaReviewed by:
Aseesh Pandey, Govind Ballabh Pant National Institute of Himalayan Environment and Sustainable Development, IndiaArmando Sunny, Universidad Autónoma del Estado de México, Mexico
Copyright © 2023 Zhou, Lu and Zhang. This is an open-access article distributed under the terms of the Creative Commons Attribution License (CC BY). The use, distribution or reproduction in other forums is permitted, provided the original author(s) and the copyright owner(s) are credited and that the original publication in this journal is cited, in accordance with accepted academic practice. No use, distribution or reproduction is permitted which does not comply with these terms.
*Correspondence: Guangfu Zhang, zhangguangfu@njnu.edu.cn; 825300973@qq.com
†ORCID: Guangfu Zhang, orcid.org/0000-0001-8120-4838