Quantitative assessment of hydrological response to vegetation change in the upper reaches of Luanhe River with the modified Budyko framework
 Huishan Gao
 Qingsong Li1
 - 1College of Resources and Environmental Sciences, Henan Agricultural University, Zhengzhou, China
- 2Henan Provincial Institute of Natural Resources Monitoring and Land Consolidation, Zhengzhou, Henan, China
For assessing the influence of vegetation variation in upper reaches of Luanhe River (URLR) on streamflow, we first computed the equation between underlying surface parameter (ω) and the Normalized Difference Vegetation Index (NDVI). Then we introduced the vegetation information into the Budyko equation and established a modified Budyko equation. Finally, the impact of vegetation change on streamflow in URLR were estimated using the modified Budyko equation. Results showed that: (1) The NDVI in the URLR presented an increasing trend from 1982 to 2016, which is opposite to the runoff depth. The sudden change of NDVI occurred in 1998, and a simple linear model between ω and NDVI was obtained (p < 0.01). (2) The contribution rate of precipitation, potential evapotranspiration, NDVI, and anthropogenic factor on streamflow change during the changing period (1999–2016) are 44.99, 11.26, 29.45, and 17.30%, respectively. Although precipitation is still the main driver of runoff impact in the ULRB, with the increasing vegetation in the ULRB, vegetation has become the second driver of runoff impact followed by human activities and potential evapotranspiration. The mechanism of the effect of vegetation change on the water cycle needs to be further investigated. The results of this study can provide a theoretical basis for water use and conservation in the URLR.
1. Introduction
Since 1999, China actively implemented many ecological restoration projects (Zhang et al., 2000), for example, the construction of key protection forest systems in the Yangtze River and the conversion of farmland to forests across China. Under the influence of ecological restoration projects, China’s vegetation coverage has increased substantially, and caused large increases in the total amount of forest resources (Wei et al., 2008; Lü et al., 2015). In recent years, with the continuous growth of vegetation, the influence of vegetation growth on streamflow change has attracted extensive attention of scholars (Zastrow, 2019; Wang and Hu, 2020; Ji et al., 2021a,b). Many scholars believe that the increase of vegetation will reduce runoff (Whitehead and Calder, 1993; Ji et al., 2022), while a few scholars believe that the increase of vegetation will increase runoff (Li and Guo, 1986). There are some disputes (Chen and Li, 2001). Thus, Quantitative analysis of the influence of vegetation variation on streamflow variation needs to be further studied.
Water loss, soil loss and water environment deterioration are serious problems in Luanhe River Basin (LRB). Due to implementation of the vegetation restoration project, the vegetation coverage of LRB has increased significantly. Vegetation restoration can affect hydrological process and sustainable utilization of water resources. LRB is one of the important headstream region of water-diversion engineering in Tianjin. The runoff changes in the LRB is likely to have a certain impact on water security and socio-economic development of Tianjin. Therefore, many scholars have conducted numerous studies to further explore the effects of vegetation changes on the water cycle in the LRB.
Liu et al. (2021) explored the changing trend of vegetation net primary productivity data of LRB from 2000 to 2015, the vegetation net primary productivity fluctuated and increased. Wu et al. (2020) used Multi-Statistical Methods to analyze the vegetation changes in the Luan River basin and found that temperature and precipitation were the main causes of NDVI growth. But they did not address the effect of vegetation on runoff. Dong et al. (2013) used the SWAT model to simulate runoff in the LRB from 1985 to 2000 and found that changes in forest land, cropland and grassland contributed to a 2.91% increase in runoff. Wang et al. (2011) used Mann–Kendall trend test, power spectrum analysis and other mathematical and statistical methods to find a significant decrease in runoff in the LRB after 1998, mainly because of the important influence of surface cover changes on runoff. Liu et al. (2013) quantitatively analyzed LRB from 1960 to 2007 and found that the decrease in runoff from 1960 to 1979 was due to the impact of climate change, while the impact of human activities on runoff from 1980 to 2007 was increasing. Yan et al. (2018) analyzed the runoff in the LRB and found that runoff was not influenced by humans from 1954 to 1970, but was influenced from 1971 to 2000, and that climate change and human activities on runoff changes decreased by about 49 and 51%, respectively, and the influence of human activities on runoff has increased to be the dominant factor. Zhou et al. (2020) used Budyko’s elasticity coefficient method to analyze the effects of climate change and subsurface on the runoff of the upper Luan River (ULRB), and found that the main cause of the decline in runoff from 1998 to 2015 was the change in subsurface, with a contribution of 88.12%. Li and Zhou (2016) analyzed the runoff in the LRB from 1956 to 2011 in a decreasing trend based on Budyko’s theory and geometric methods, and found that the main contributor to runoff after calculating the changes in both methods was human activity. Through previous summaries, we found that scholars have studied vegetation and runoff change factors from a single study of the LRB, and have further explored the effects of climate change and human changes on runoff, but have not analyzed the contribution of vegetation change to runoff in detail.
Hence, as one of the key areas for the implementation of the ecological restoration project in the ULRB, the ULRB were selected as the target of this study. The response of runoff to vegetation was calculated using 35 years of hydrometeorological data (1982–2016) and NDVI data. The main steps are as follows: (1) Analyzing temporal variation pattern of NDVI and hydrometeorological data from 1982 to 2016 in the URLR; (2) Determination of the year of mutation of NDVI by The M-K trend test; (3) A linear regression method was used to quantify its relationship with NDVI and ω in Budyko’s formula to construct the modified Budyko formula; (4) The contribution of the modified Budyko formula volume assessment and vegetation change to runoff was analyzed. This study can provide an effective reference for objective calculation of the effect of vegetation change on water flow, and provide a theoretical basis for water resource utilization and conservation in URLR.
2. Overview of the study region and data
Luanhe River Basin is located in the northeast of North China Plain and is ecological barrier of Beijing-Tianjin-Hebei metropolitan area. The upstream part of the URLR is from the foothills of Bayangurtu Mountain to Zhangbaiwan Town of the Luanping county. The drainage area of the URLR is 25,367 km2, accounting for 46.63% of the URLR. Its annual average precipitation is about 325.4 m and its annual average temperature is about 2.2°C (Wang et al., 2012). Summer is warm and rainy, precipitation is mainly occurred in summer, and the winter is cold and dry. The region has two national nature reserves (Luanhe River upstream National Nature Reserve and Saihanba National Nature Reserve), which have an important ecological strategic position (Figure 1).
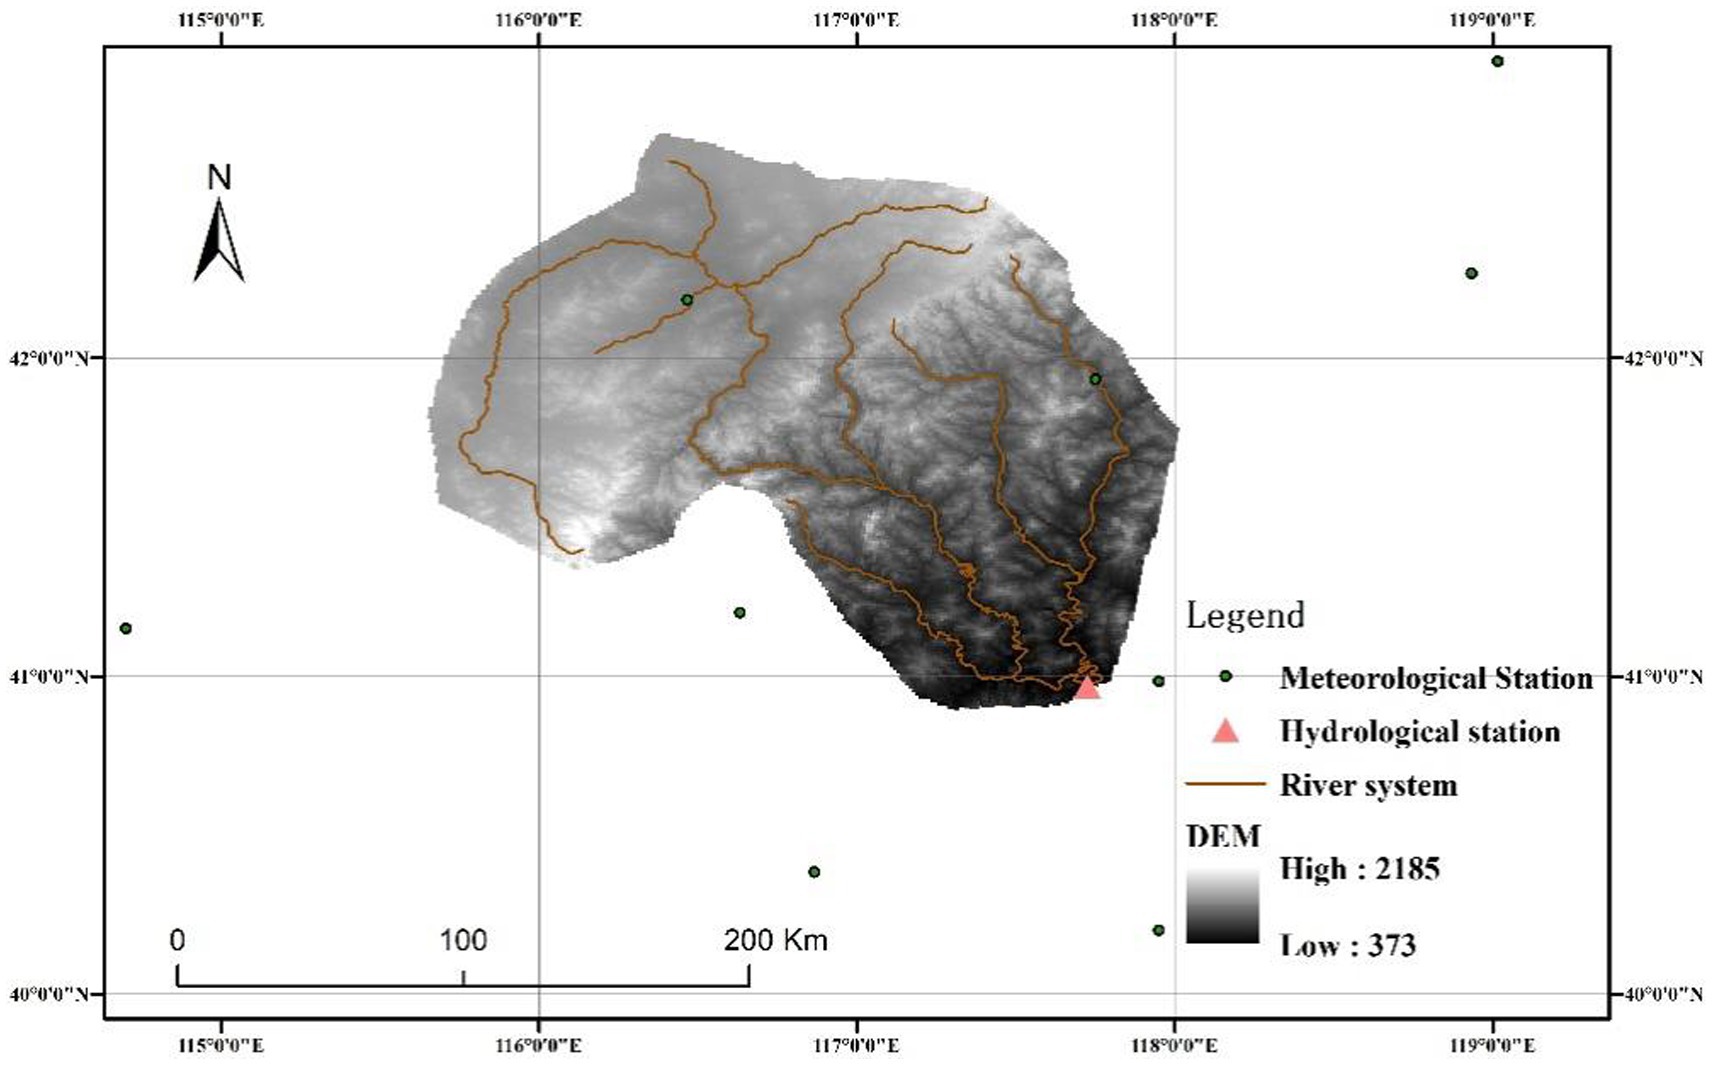
Figure 1. Location of study region.
Runoff data of Sandaohezi hydrological station from 1982 to 2016 in the URLR were collected from China Hydrological Yearbook and Hebei Hydrological Bureau. The data of 8 meteorological stations in and around study region were collected from China Meteorological Administration, and these potential evapotranspiration were computed using Penman–Monteith formula. Next, Kriging method was utilized for interpolating monthly precipitation and potential evapotranspiration. Finally, the raster maps of the annual precipitation and potential evapotranspiration in the URLR from 1982–2016 are obtained. The NDVI data from 1982 to 2016 used in this study are extracted by the average combination method and obtained from the NOAA CDR AVHRR NDVI v51. The NDVI daily output data at a spatial resolution of 0.05°× 0.05° are produced based on surface reflectance of red and near-infrared spectral bands captured by the Advanced Resolution Radiometer.
3. Research methods
3.1. Non-parametric Mann–Kendall test algorithm
Mann–Kendall test algorithm is utilized in this study for identifying mutation year. The algorithm can ignore interference of individual outliers, does not need detection data to follow a specific distribution, and its calculation process is simple, therefore has strong practicability (Jian and Xie, 2011; Du et al., 2015).
3.2. Budyko framework
Li et al. (2013) ω, proved that ω has a significant correlation with NDVI in a basin.
According to non-parametric MK test algorithm result, the study period was separated into the T1 and T2. Precipitation, potential evapotranspiration, ω and NDVI in T1 period are denoted as P1, ET01, ω1 and NDVI1. The annual average precipitation, potential evapotranspiration, ω and NDVI in T2 period are denoted as P2, ET02, ω2 and NDVI2. Thus, the change value of precipitation ( ), potential evapotranspiration ( ), underlying surface characteristic parameter ( ) and NDVI ( ) from T1 to T2 can be calculated as follow:
In the formulas, , , , and respectively represent streamflow change values caused by change values of precipitation, potential evapotranspiration, ω and NDVI from T1 to T2.
, , , and respectively denote the contribution rate of P, potential evapotranspiration, NDVI, and anthropogenic factor on streamflow.
4. Results and analysis
4.1. Hydro-meteorological and NDVI trend analysis
Figure 2 illustrates the changing trend of annual mean runoff depth and NDVI in URLR from 1982 to 2016. In total, the slope of annual average runoff depth from 1982 to 2016 is −0.3963 mm/a, indicating a downward trend (p < 0.05) of annual average runoff depth. The fluctuation range of average annual runoff depth in the URLR is 8.23–49.91 mm, and the maximum and minimum values occur in 1994 and 2000, respectively. Figure 2B demonstrates that the NDVI in the URLR is fluctuating and increasing, with a fluctuation range of 0.3190–0.4104. The maximum and minimum values appeared in 2004 and 1989, and the slope of NDVI from 1982 to 2016 is 0.0018/a (p < 0.01), declaring that vegetation cover of the URLR has been significantly restored.
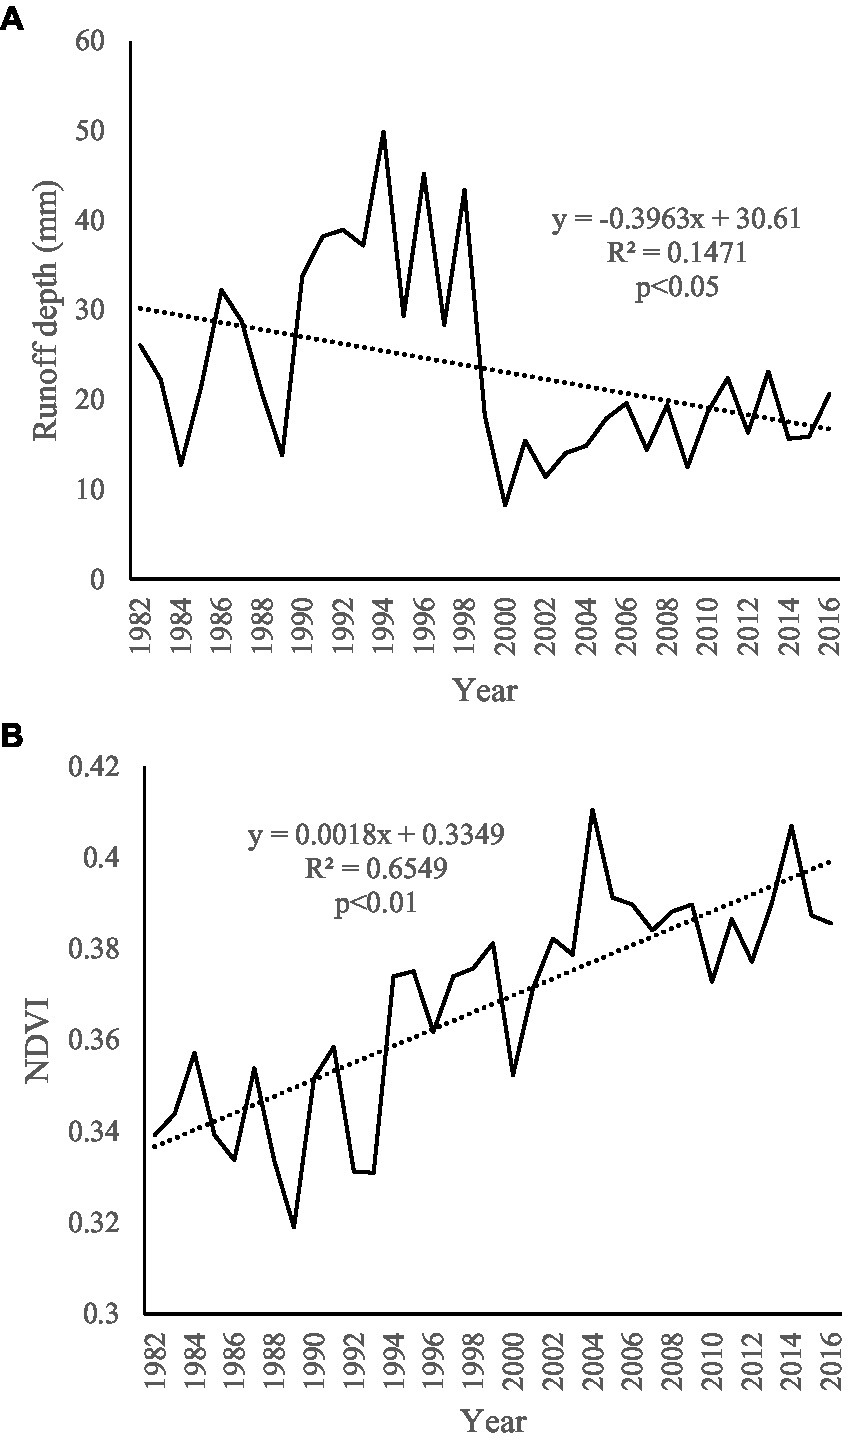
Figure 2. Changing trend of runoff depth (A) and NDVI (B) in the URLR.
Figure 3 illustrates variation trend of precipitation and potential evapotranspiration in the URLR from 1982 to 2016. As shown in Figure 3A, precipitation of URLR from 1982–2016 slightly increased (p > 0.1). The maximum precipitation occurred in 1998 and was 567.35 mm, the minimum precipitation occurred in 2000 and was 331.40 mm, respectively. Figure 3B showed that the annual average potential evapotranspiration has a significantly increasing trend (p < 0.05), with an annual average increase of 1.0453 mm. The maximum and minimum values occurred in 2009 and 2003, with 976.78 and 848.00 mm, respectively.
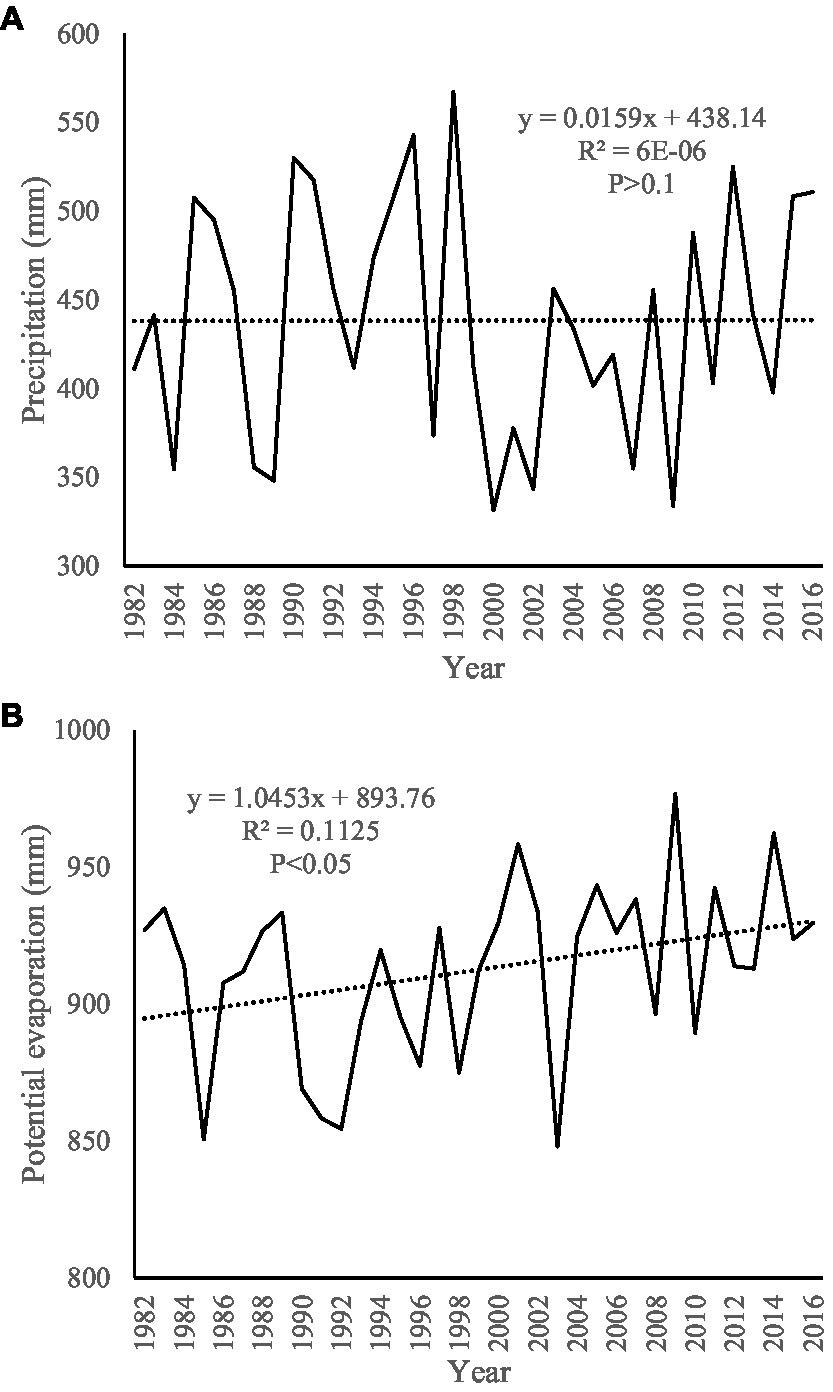
Figure 3. Changing trend of precipitation (A) and potential evapotranspiration (B) of URLR.
4.2. Mutation analysis
The M-K trend test was applied to identify mutation points of NDVI, and the detection results are shown in Figure 4. From the Figure 4, we can find that mutation year occurred in 1998. This is basically consistent with the notification of the State Council on the issuance of the national ecological environment construction plan in 1998 to transform the implementation of afforestation and ecological restoration projects in northern China, and the notification of the Master Plan of Major Projects for the Protection and Restoration of Nationally Important Ecosystems (2021–2035) also corroborates the rapid recovery of NDVI in URLR after 1998.
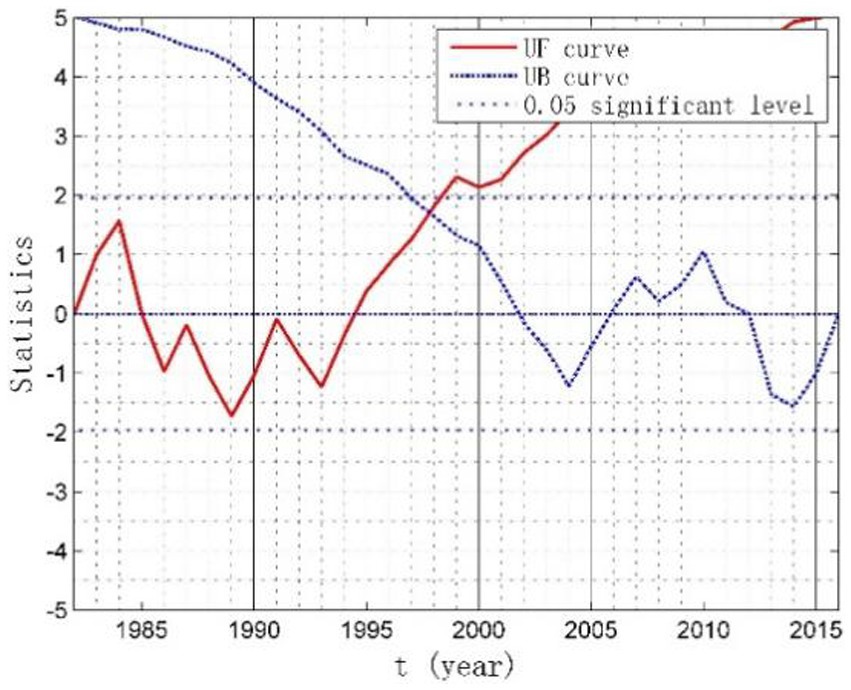
Figure 4. Detection result of NDVI data in URLR from 1982 and 2016.
4.3. The relationship between NDVI and ω
Figure 5 shows the linear regression relationship between annual precipitation and runoff depth in different periods (T1 and T2) in the URLR. The scattered points in the changing period are below the scattered points in the base period, indicating that runoff production capacity in changing period is greatly reduced compared with that in the base period. In addition, the determination coefficient of the linear regression equation between precipitation and runoff depth of T1 period is 0.4549 and drops down to 0.2823 in the T2 period. This may be caused by vegetation growth and human activities.
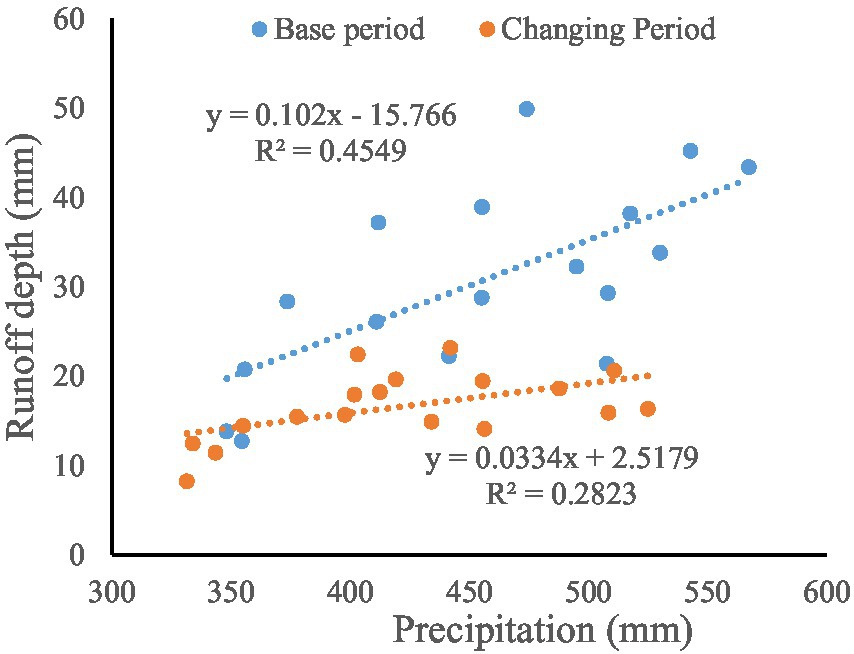
Figure 5. The relationship between precipitation and runoff depth of different periods in the URLR.
For computing the equation of NDVI and ω, ω of URLR was computed through equation 9 first of all. Next, the pointwise distribution of the 10-year moving average of ω and NDVI was plotted and fitted to obtain the equation of NDVI and ω, as shown in Figure 6. The coefficient of determination is 0.5424 and the fitting effect is relatively significant (p < 0.05). The regression coefficient (a) is 5.1075 and the intercept (b) is 0.7469.
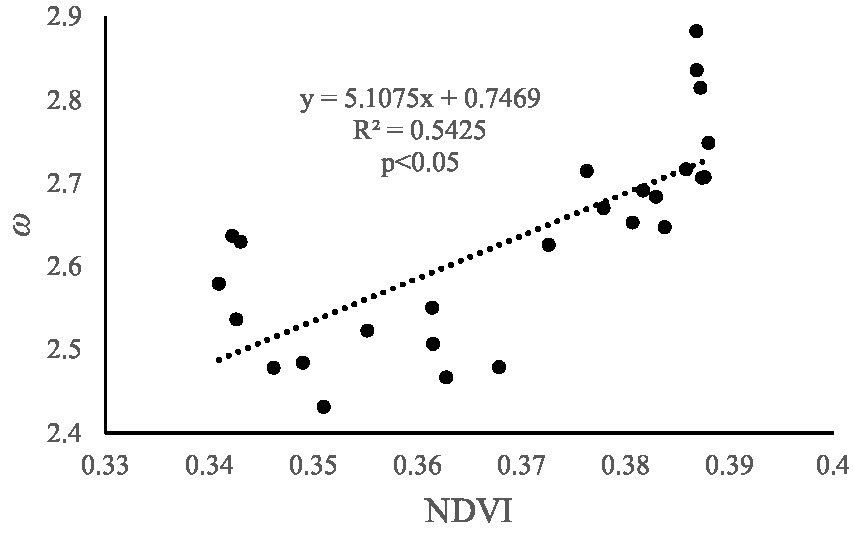
Figure 6. Equation of 10-year moving average ω and 10-year moving average NDVI.
4.4. Quantitative assessment of hydrological response to vegetation change
According to non-parametric MK test algorithm result, 1982–2016 was separated into the T1 (1982–1998) and T2 (1999–2016) period, and the eigenvalues of the hydro-meteorological elements and NDVI of the URLR in different periods were obtained (Table 1). Table 1 showed that potential evapotranspiration in the URLR increased from 898.68 mm (T1) to 925.69 mm (T2), precipitation and runoff depth reduced by 33.86 and 14.12 mm. NDVI increased from 0.350 (T1) to 0.385 (T2), with an increase of 0.035. ω increased from 2.46 (T1) to 2.74 (T2), with an increase of 0.28.
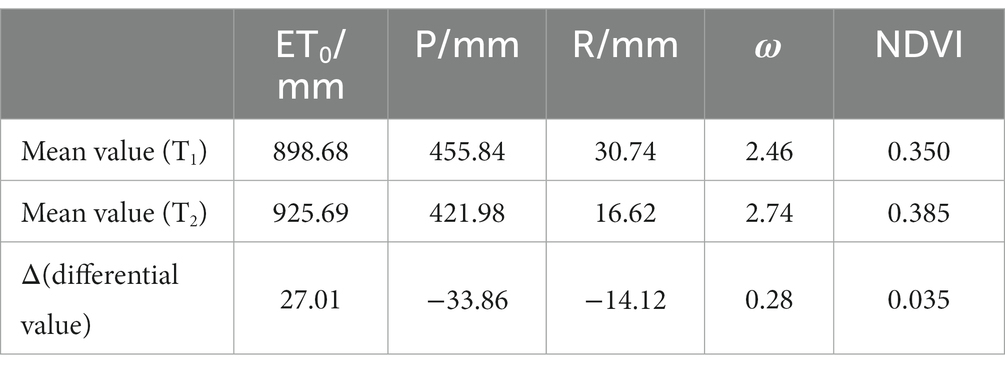
Table 1. The eigenvalues of the hydro-meteorological elements and NDVI in URLR.
According to formulas (7)~(10), the elastic coefficients of runoff on P, ET0, ω, and NDVI are obtained. Then, the variation and contribution rate of runoff depth affected by various driving factors are calculated by formulas (15)~(19). The results are shown in Table 2. For every 1% increase (decrease) in annual precipitation, the runoff depth would increase (decrease) by 3.33% in the URLR. A 1% increase (decrease) of annual potential evapotranspiration, ω and NDVI would result in a decrease (increase) of 2.33, 2.68, and 1.92% in runoff depth.
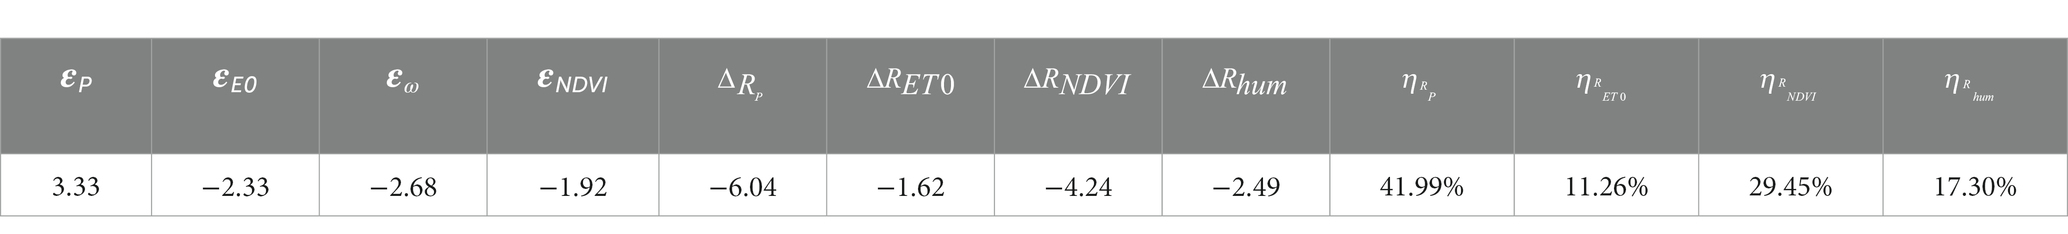
Table 2. Attribution analysis of discharge variation of URLR.
Compared with T1, the change of precipitation in T2 results in a decrease of 6.04 mm in runoff depth, with a contribution of 41.99%; The change of potential evapotranspiration in T2 period results in a decrease of 1.62 mm in runoff depth, with a contribution of 11.26%; The NDVI and human activities in the T2 period lead to the reduction of 4.24 mm and 2.49 mm in runoff depth, with a contribution of 29.45 and 17.30%, respectively. Overall, the decrease in precipitation during the T2 period was main reason for runoff depth decline in URLR, followed by vegetation changes, human activities, and potential evapotranspiration.
To sum up, vegetation growth has become a major driving factor ranked second on runoff reduction. With the growing of NDVI, interception effect of vegetation on precipitation also increases, resulting in runoff decrease. In addition, the expansion of vegetation stem and leaf area would increase the evapotranspiration of plants. The increase of vegetation evapotranspiration would lead to continuous loss of soil water, which is not conducive to the exchange, resulting in reduction of streamflow (Chen et al., 2015; Jia et al., 2017). Local governments should attach great importance to the influence of swift vegetation growth on runoff decrease.
5. Discussion and conclusion
For calculating the influence of vegetation growth on streamflow in URLR, the change trend of the hydrometeorology data and NDVI is analyzed and abrupt year of NDVI was identified through non-parametric Mann-Kendall test algorithm. Next, the relationship between ω and NDVI is quantitatively analyzed. Finally, the modified Budyko equation was built for computing the influence of vegetation growth on streamflow in URLR.
The NDVI mutation point in the ULRB appeared in 1998.There was a significant linear functional relationship between NDVI and underlying surface parameters (p < 0.01). Precipitation was dominant factor causing decrease in runoff depth over the URLR, with a contribution rate of 44.99%. Vegetation growth was second contributing factor in the decline of runoff depth, accounting for 29.45%. The contribution of anthropogenic factor and potential evapotranspiration on streamflow decline were 17.30 and 11.26%.
In recent decades, the runoff in the LRB has shown a decreasing trend year by year (Shi et al., 2018). It is argued that the impact of climate change on runoff in the LRB is decreasing, while the impact of human activities on runoff is increasing (Liu et al., 2013; Zhou et al., 2020). The results of this study show that there is no significant change in climatic factors and that the subsurface drivers are the main drivers of runoff changes in the ULRB, but the study only classifies human activities as subsurface drivers and cannot quantify the causes of each factor separately. It has been shown that the main factor affecting the annual runoff in the LRB in terms of interannual fluctuations is precipitation (Fu et al., 2014), while the impact of human activities on runoff has also been emphasized. It can be seen that the previous studies need to be further explored in terms of the drivers affecting runoff variability.
Since 1998, the overall vegetation cover of the ULRB has been increasing since the implementation of the project to return farmland to forest and grass. Fewer studies have been conducted to examine how vegetation change affects runoff evolution. In this paper, the Budyko framework is used to bring NDVI into the equation to further explore the factors affecting runoff, Response to precipitation, latent evapotranspiration emission, NDVI, and other parameters causing subsurface changes based on runoff changes. By quantifying the various drivers affecting runoff changes, precipitation was found to be the main factor contributing to the decrease in runoff depth in the ULRB, while the NDVI also plays a very important role in the depth of runoff in the ULRB.
There are several uncertainties in this study. Firstly, meteorological data of individual dates at some stations are missing. Next, the study ignores the interaction and connection between climate, vegetation and human activities (Yan et al., 2018; Wang et al., 2022; Liu et al., 2023), so future studies should systematically quantify the influence of climatic conditions and anthropic factor interactions on eco-hydrological systems.
Data availability statement
The original contributions presented in the study are included in the article/supplementary material, further inquiries can be directed to the corresponding author/s.
Author contributions
HG and QM: conceptualization. QL, GX, BL and JZ: data. HG and QM: funding acquisition. HG, QM and GX: methodology. HG and QM: project administration. HG, QL and QM: writing – original draft. HG and QM: writing – review and editing. All authors contributed to the article and approved the submitted version.
Funding
This work was supported by the National Natural Science Foundation of China (grant number 41901259); the Research Project of Humanities and Social Sciences in Colleges and Universities of Henan Province (grant number 2021-ZZJH-157); the Philosophy and Social Science Program of Henan Province (grant number 2019CJJ078); the Research Project of Henan Federation of Social Sciences in 2021 (grant number SKL-2021-3196); the National Key R&D Program of China (2021YFD1700900); and the special fund for top talents in Henan Agricultural University (30501031).
Conflict of interest
The authors declare that the research was conducted in the absence of any commercial or financial relationships that could be construed as a potential conflict of interest.
Publisher’s note
All claims expressed in this article are solely those of the authors and do not necessarily represent those of their affiliated organizations, or those of the publisher, the editors and the reviewers. Any product that may be evaluated in this article, or claim that may be made by its manufacturer, is not guaranteed or endorsed by the publisher.
Footnotes
References
Chen, J., and Li, X. (2001). The impact of change on watershed hydrology-discussing some controversies on forest hydrology. J. Nat. Resour. 05, 474–480. doi: 10.3321/j.issn:1000-3037.2001.05.014
Chen, Y., Wang, K., Lin, Y., Shi, W., Song, Y., and He, X. (2015). Balancing green and grain trade. Nat. Geosci. 8, 739–741. doi: 10.1038/ngeo2544
Choudhury, B. (1999). Evaluation of an empirical equation for annual evaporation using field observations and results from a biophysical model. J. Hydrol. 216, 99–110. doi: 10.1016/S0022-1694(98)00293-5
Dong, G., Yang, Z., Shi, X., and Yu, Y. (2013). Runoff simulation of Luan River basin based on SWAT model. Yellow River 35, 46–49. doi: 10.3969/j.issn.1000-1379.2013.06.018
Du, H., Yan, J., Yang, D., and Yang, R. (2015). The distribution of precipitation and multi-temporal scales drought -floods analysis in the Jialing River basin. J. Nat. Resour 30, 836–845. (in Chinese). doi: 10.11849/zrzyxb.2015.05.011
Fu, X., Dong, Z., Liu, C., Shan, C., Fang, Q., and Liu, Q. (2014). Runoff changes and related driving forces in the Luan River basin. Water Resour. Power 11, 6–10.
Ji, G., Huang, J., Guo, Y., and Yan, D. (2022). Quantitatively calculating the contribution of vegetation variation to runoff in the middle reaches of Yellow River using an adjusted Budyko formula. Land 11:535. doi: 10.3390/land11040535
Ji, G., Song, H., Wei, H., and Wu, L. (2021a). Attribution analysis of climate and anthropic factors on runoff and vegetation changes in the source area of the Yangtze River from 1982 to 2016. Land 10:612. doi: 10.3390/land10060612
Ji, G., Wu, L., Wang, L., Yan, D., and Lai, Z. (2021b). Attribution analysis of seasonal runoff in the source region of the Yellow River using seasonal Budyko hypothesis. Land 10:542. doi: 10.3390/land10050542
Jia, X., Shao, M., Zhu, Y., and Luo, Y. (2017). Soil moisture decline due to afforestation across the loess plateau, China. J. Hydrol. 546, 113–122. doi: 10.1016/j.jhydrol.2017.01.011
Jian, H., Luo, Y., and Xie, D. (2011). Precipitation variation feature research based on the Mann-Kendall and wavelet analysis—taking the Shapingba in Chongqing as an example. J. Southwest China Norm. Univ. 36, 217–222.
Li, D., Pan, M., Cong, Z., Zhang, L., and Wood, E. (2013). Vegetation control on water and energy balance within the Budyko framework. Water Resour. Res. 49, 969–976. doi: 10.1002/wrcr.20107
Li, J., and Zhou, S. (2016). Quantifying the contribution of climate- and human-induced runoff decrease in the Luanhe river basin, China. J Water Climate Change 7, 430–442. doi: 10.2166/wcc.2015.041
Liu, Y., Chen, W., Li, L., Huang, J., Wang, X., Guo, Y., et al. (2023). Assessing the contribution of vegetation variation to streamflow variation in the Lancang River basin. China. Front. Ecol. Evol. 10:1058055. doi: 10.3389/fevo.2022.1058055
Liu, J., Tang, F., Zhang, G., and Zhang, P. (2021). Spatio-temporal distribution of net primary productivity and its driving factors in the Luanhe River basin from 2000 to 2015. Chin. J. Eco-Agric. 29:659–671 doi: 10.13930/j.cnki.cjea.200701
Liu, X., Xiang, L., and Zhai, J. (2013). Quantitative study of impacts for environmental change on runoff in Luan River basin. J. Nat. Resour 28, 244–252. doi: 10.11849/zrzyxb.2013.02.006
Lü, Y., Zhang, L., Feng, X., Zeng, Y., Fu, B., Yao, X., et al. (2015). Recent ecological transitions in China: greening, browning, and influential factors. Sci. Rep. 5:8372. doi: 10.1038/srep08732
Shi, C, Yuan, S, and Zhao, Shi C T (2018) Effects of climate change and human activities on runoff in the Luan River basin. J. Soil Water Conserv. 32:264–269 (in Chinese) doi: 10.13870/j.cnki.stbcxb.2018.02.039
Wang, H., and Hu, P. (2020). Key issues of ecological conservation in the Yellow River basin from a water cycle perspective. J. Hydraul. Eng. 51, 1009–1014. doi: 10.13243/j.cnki.slxb.20200675
Wang, Y., Liu, Z., Qian, B., He, Z., and Ji, G. (2022). Quantitatively computing the influence of vegetation changes on surface discharge in the middle-upper reaches of the Huaihe River. China. Forests 13:2000. doi: 10.3390/F13122000
Wang, G., Yan, D., Huang, Z., Jin, X., and Pu, S. (2011). Analysis on the long-term evolution of runoff volume and its driving factors in the Luan River basin. Arid Zone Res. 28, 998–1004. doi: 10.13866/j.azr.2011.06.025
Wang, L., Zhu, Z., Liu, X., and He, Q. (2012). Influence of change on runoff in upper reach of Luanhe River in recent 50 years. Plateau Meteorol. 6, 288–293. doi: 10.1007/s11783-011-0280-z
Wei, X., Sun, G., Liu, S., Jiang, H., Zhou, G., and Dai, L. (2008). The forest-streamflow relationship in China: a 40-year retrospect. J. Am. Water Resour. Assoc. 44, 1076–1085. doi: 10.1111/j.1752-1688.2008.00237.x
Whitehead, P., and Calder, I. (1993). The balquhidder experimental catchments. J. Hydrol. 145, 215–480. doi: 10.1016/0022-1694(93)90054-D
Wu, Y., Zhang, X., Fu, Y., Hao, F., and Yin, G. (2020). Response of vegetation to changes in temperature and precipitation at a semi-arid area of northern China based on multi-statistical methods. Forests 11:340. doi: 10.3390/f11030340
Yan, X., Bao, Z., Zhang, J., Wang, G., He, R., and Liu, C. (2018). Quantifying contributions of climate change and local human activities to runoff decline in the upper reaches of the Luanhe River basin. J. Hydro Environ. Res. 28, 67–74. doi: 10.1016/j.jher.2018.11.002
Yang, H., Yang, D., Lei, Z., and Sun, F. (2008). New analytical derivation of the mean annual water- energy balance equation. Water Resour. Res. 44:W03410. doi: 10.1029/2007wr006135
Zastrow, M. (2019). China's tree-planting drive could falter in a warming world. Nature 573, 474–475. doi: 10.1038/d41586-019-02789-w
Zhang, P., Shao, G., Zhao, G., Le Master, D. C., Parker, G. R., Dunning, J. B. Jr., et al. (2000). China’s forest policy for the 21st century. Science 288, 2135–2136. doi: 10.1126/science.288.5474.2135
Keywords: runoff change, vegetation change, Budyko hypothesis, the upper reaches of Luanhe River, quantitative analysis
Citation: Gao H, Li Q, Xiong G, Li B, Zhang J and Meng Q (2023) Quantitative assessment of hydrological response to vegetation change in the upper reaches of Luanhe River with the modified Budyko framework. Front. Ecol. Evol. 11:1178231. doi: 10.3389/fevo.2023.1178231
Edited by:
Ning Niu, Henan University of Economics and Law, ChinaReviewed by:
Xiaohu Dang, Xi’an University of Science and Technology, ChinaShufang Wu, Northwest A&F University, China
Copyright © 2023 Gao, Li, Xiong, Li, Zhang and Meng. This is an open-access article distributed under the terms of the Creative Commons Attribution License (CC BY). The use, distribution or reproduction in other forums is permitted, provided the original author(s) and the copyright owner(s) are credited and that the original publication in this journal is cited, in accordance with accepted academic practice. No use, distribution or reproduction is permitted which does not comply with these terms.
*Correspondence: Qingxiang Meng, qxmeng@henau.edu.cn