Exploring spatio-temporal patterns of palynological changes in Asia during the Holocene
 Kuber P. Bhatta1*†
  Ondřej Mottl1,2†
  Vivian A. Felde1,2† Suzette G. A. Flantua1,2†
  Hilary H. Birks1,2†
  Xianyong Cao3†
  Fahu Chen3†
  John-Arvid Grytnes1† Alistair W. R. Seddon1,2† Harry John B. Birks1,2,4†
- 1Department of Biological Sciences, University of Bergen, Bergen, Norway
- 2Bjerknes Centre for Climate Research, Bergen, Norway
- 3Alpine Paleoecology and Human Adaptation Group (ALPHA), State Key Laboratory of Tibetan Plateau Earth System, Environment and Resources (TPESER), Institute of Tibetan Plateau Research, Chinese Academy of Sciences, Beijing, China
- 4Environmental Change Research Centre, University College London, London, United Kingdom
Historical legacies influence present-day ecosystem composition and dynamics. It is therefore important to understand the long-term dynamics of ecosystems and their properties. Analysis of ecosystem properties during the Holocene using fossil pollen assemblages provides valuable insights into past ecosystem dynamics by summarising so-called pollen-assemblage properties (PAPs). Using 205 fossil pollen data-sets (records), we quantify eight PAPs [pollen-taxonomic richness, diversity, evenness, pollen-compositional turnover, pollen-compositional change, and rate of pollen-compositional change (RoC)] for the Asian continent at different spatial scales (in individual records, within and across climate-zones, and within the continent) and time (temporal patterns over the past 12,000 years). Regression tree (RT) partitioning of the PAP-estimates using sample-age as a sole predictor revealed the “change-point(s)” (time or sample-age of major change in a PAP). We estimated the density of RT and multivariate regression tree (MRT) change-points in 1,000-year time bins during the Holocene. Pollen-compositional turnover (range of sample scores along the first DCCA axis) and change (number of MRT partitions) in each record reveal gradual spatial variation across latitude and a decline with longitude eastward. Temporally, compositional turnover declines linearly throughout the Holocene at all spatial scales. Other PAPs are heterogeneous across and within spatial scales, being more detectable at coarser scales. RT and MRT change-point density is broadly consistent in climate-zones and the continent, increasing from the early- to mid-Holocene, and mostly decrease from the mid-Holocene to the present for all PAPs. The heterogenous patterns in PAPs across the scales of study most likely reflect responses to variations in regional environmental conditions, anthropogenic land-use, and their interactions over space and time. Patterns at the climate-zone and continental scales indicate a gradual but congruent decline in major PAPs such as compositional turnover, rate of compositional change, and major temporal compositional changes (MRT) during the Holocene, especially during recent millennia, suggesting that vegetation in Asia has become progressively more homogenous. Data properties (e.g., spatial distribution of the records, distribution of samples within the records, and data-standardisation and analytical approaches) may also have partly influenced the results. It is critically important to evaluate the data properties and the approaches to data standardisation and summarisation.
Introduction
The Holocene (ca. the last 11,700 years) was previously thought to be an environmentally stable period compared to the last glacial period. However, a growing amount of evidence, from both terrestrial and marine sediments, suggests that there have been marked environmental variations throughout the Holocene. Most transformations of natural ecosystems throughout the globe started with human activities during the early- to mid- Holocene (e.g., Fuller et al., 2011; Fyfe et al., 2015; Pennisi, 2015; Nolan et al., 2018; Kuneš et al., 2019; Stephens et al., 2019; Ellis et al., 2021). A broad-scale study (Lyons et al., 2016) suggests that basic species-assemblage patterns remained relatively consistent for many millions of years, but then changed significantly in the mid-Holocene as a result of a dramatic increase in anthropogenic impacts. To test the ideas of changes in species-assemblage properties and to understand the long-term dynamics of ecosystems, ecosystem properties must be defined and studied through the entire Holocene. Major ecosystem properties such as taxonomic diversity, composition, and rate of change should be explored across space as well as time as the patterns may vary depending on the scale of the study. Such studies are important in the management of natural ecosystems and landscapes in the context of ever-increasing anthropogenic pressure because historical ecological legacies, such as land-use changes and disturbances, can play a significant role in influencing present-day ecosystem composition and dynamics (e.g., Jackson and Hobbs, 2009; Jackson and Blois, 2015; Birks, 2019; Divíšek et al., 2020; Fordham et al., 2020).
To look back in time we use palaeoecological records as informative archives of past ecosystem composition, biodiversity, climate, anthropogenic land-use, and human history (e.g., Birks and Birks, 1980; Birks, 2019; Fordham et al., 2020). Pollen assemblages preserved in stratigraphic records are the most commonly used terrestrial fossil group for the Holocene to elucidate past vegetation patterns at the landscape or regional scale (e.g., Birks and Gordon, 1985; Birks, 2007; Birks et al., 2016b; Felde et al., 2016, 2020). However, pollen-based compositional data generated from stratigraphic records are multivariate, containing many samples and taxa, are closed (pollen counts for each taxon in a sample of a record are expressed relative to the pollen sum of that sample), and may reflect a complexity of patterns (Birks, 1994, 2007). Therefore, such data for multiple records covering a wide geographical area and different temporal scales can be difficult to summarise and interpret using traditional pollen diagrams and qualitative analyses alone.
With the development of quantitative palaeoecology over recent decades (e.g., Birks et al., 2012 and references therein), it is possible to quantify more precisely the past ecological properties of pollen-assemblages, so-called pollen-assemblage properties (PAPs). These include compositional turnover, changes in composition (zonation or partitioning), taxonomic richness, diversity, and evenness, and rates of compositional change over time. They can be used by careful inference to reconstruct past vegetation dynamics (Birks, 2019). Although there is no direct 1:1 relationship between pollen-assemblage richness and floristic richness, several studies have documented that differences in pollen-assemblage richness may reflect differences in floristic richness, if the data have a consistent and detailed taxonomy and the data are analysed appropriately using consistent methodology (see Birks et al., 2016a and references therein; Väli et al., 2022). Therefore, diversity estimates such as Hill numbers (Hill, 1973), which provide conceptually simple but robust estimates of taxonomic diversity, can also be applied to carefully processed pollen-assemblage data for estimating pollen richness, evenness, and diversity (Birks et al., 2016a). Such estimates can be useful to summarise pollen-assemblage patterns across time and space, depending upon the purpose of the study and the nature of the data. However, because of the scale-dependence of biodiversity patterns and diversity-environment relationships, patterns revealed at one spatial or temporal scale or for one vegetation type may not necessarily reflect those at other scales or for other vegetation types (McGill et al., 2015). Therefore, it is important to define the spatial and temporal scales when assessing PAPs.
Cross-scale studies are hampered by two limitations in palaeoecology. First, well-preserved and well-sampled palaeoecological records covering a range of habitats and landscapes are geographically scarce. Open-access palaeoecological databases, especially the European Pollen Database (EPD),1 Neotoma (Williams et al., 2018),2 and Pangaea (PANGAEA® -- Data Publisher for Earth and Environmental Science),3 and data repositories for open access publications (for example, DRYAD), are playing a major part in reducing this limitation in recent decades. However, these data repositories often still lack sufficient high-quality palaeoecological records from large regions of the globe, for example parts of Asia (Cao et al., 2020). Second, there are inconsistencies in palaeoecological data from different parts of the world. These are mostly due to methodological differences used in different palaeoecological studies, for example in field sampling, laboratory sampling (taking sediment samples from a core for pollen counting, radiocarbon dating, etc.), pollen/spore identifications and nomenclature, chronological techniques, etc. Palynological, palaeoecological, and taxonomic expertise are required to standardise pollen records compiled from large geographical areas (e.g., Giesecke et al., 2014; Birks et al., 2016b; Mottl et al., 2021a). These major limitations are most striking in palaeoecological data from the huge area of Asia which covers highly heterogeneous pollen data in quality and quantity from a wide range of climate and vegetation types.
Consequently, there are relatively few synthetic studies at regional or continental scales that attempt to explore comprehensively Asian vegetation patterns during the Holocene (but see Yu et al., 1998, 2000; Ren, 2000; Ren and Beug, 2002; Yang et al., 2011; Cao et al., 2013, 2019a,b; Sun and Feng, 2021). The Asian continent encompasses a vast territory with enormous variation in climatic and vegetation in space and time. Moreover, parts of south-west, south, and south-east Asia are thought to have experienced significant anthropogenic impacts during the Holocene as these were the centres for the origin of modern human civilization, and where agricultural practices, and domestication as well as the spread of horticultural trees such as olive might have started (Wright, 1976; Van Zeist, 1992; Willcox, 2005; Fuller and Qin, 2010; Fuller et al., 2011; Zohary et al., 2012; Huang et al., 2017; Cheng et al., 2018; Langgut et al., 2019; Leipe et al., 2019; Palmisano et al., 2019; Ruddiman et al., 2020; Ellis et al., 2021). A systematic but exploratory synthesis of the cross-scale spatio-temporal patterns in PAPs of Asian pollen data during the Holocene is attempted here.
We compile fossil pollen data from Asia and analyse the patterns of eight PAPs, namely pollen-compositional turnover, changes in pollen composition, Hill’s (1973) richness, diversity, and evenness estimates (N0, N1, N2, N2/N1, and N1/N0), and rate of pollen-compositional change (RoC) across space and time. We apply conservative data-standardisation procedures before analysing the data with robust analytical methods. We ask: (1) What are the major spatial and temporal patterns of PAPs in Asia during the Holocene and how do the temporal patterns vary in space? (2) Do the major pollen-compositional changes occur at the same time across Asia and across different climate-zones within the continent?
To answer these basic questions, our study is, by necessity explorative (pattern detection) rather than causational (hypothesis testing). Proctor (2010) emphasizes that both approaches can be valuable as science proceeds not only by hypothesis testing but also by assembling and exploring systematic bodies of data that often initiate further, more detailed study. Here we explore the patterns of the PAPs at different spatial scales (individual record, latitude, longitude, climate-zones, and continent) through time (patterns of PAP estimates during the past 12,000 years). These patterns may be useful in subsequent causational studies for elucidating potential drivers of vegetation change in Asia during the Holocene. To the best of our knowledge, no quantitative palaeoecological synthesis from Asia has been published at the scales of this paper, possibly because of the problems involved in gathering records, developing consistent and robust age-depth models, and establishing a harmonised continental-scale pollen taxonomy for the vast and diverse Asian region.
We first summarise the methods and records used and then present the results as a series of figures of PAPs through time and space. To provide the background for the discussion and interpretation of the results we first summarise current knowledge of Holocene climate and vegetation history of Asia. We conclude by considering some of the problems in analysing and interpreting PAP estimates over broad spatial and temporal scales.
Methods
Geography and modern climate
Based on current and historical phytogeography, climate, and geo-political and ecological distinctiveness, here we consider the “Asia continent” as the geographical territory between approximately longitude 29° E (western part of Russia) and 180° E (including eastern Siberia and Japan) and latitude 10° N (including the Gulf countries, southern India, and south-east Asia-Malaysia) and 80° N (including northern Siberia). We compiled fossil pollen records from this area (Figures 1–3). We describe the climate and vegetation in Asia through space and time with reference to geographic regions as described in the existing literature: Siberia (ca. 29° E–180° E and ca. 50° N–75° N; eastern Siberia ca. 120° E eastward, central Siberia ca. 55° E–120° E, and western Siberia ca. 55° E westward), eastern Asia (between ca. 95° E–150° E and ca. 20° N–50° N), central Asia (between ca. 70° E–95° E and ca. 30° N–50° N), and south-western Asia (between ca. 29° E–70° E and ca. 20° N–ca. 45° N) (Figure 1A).
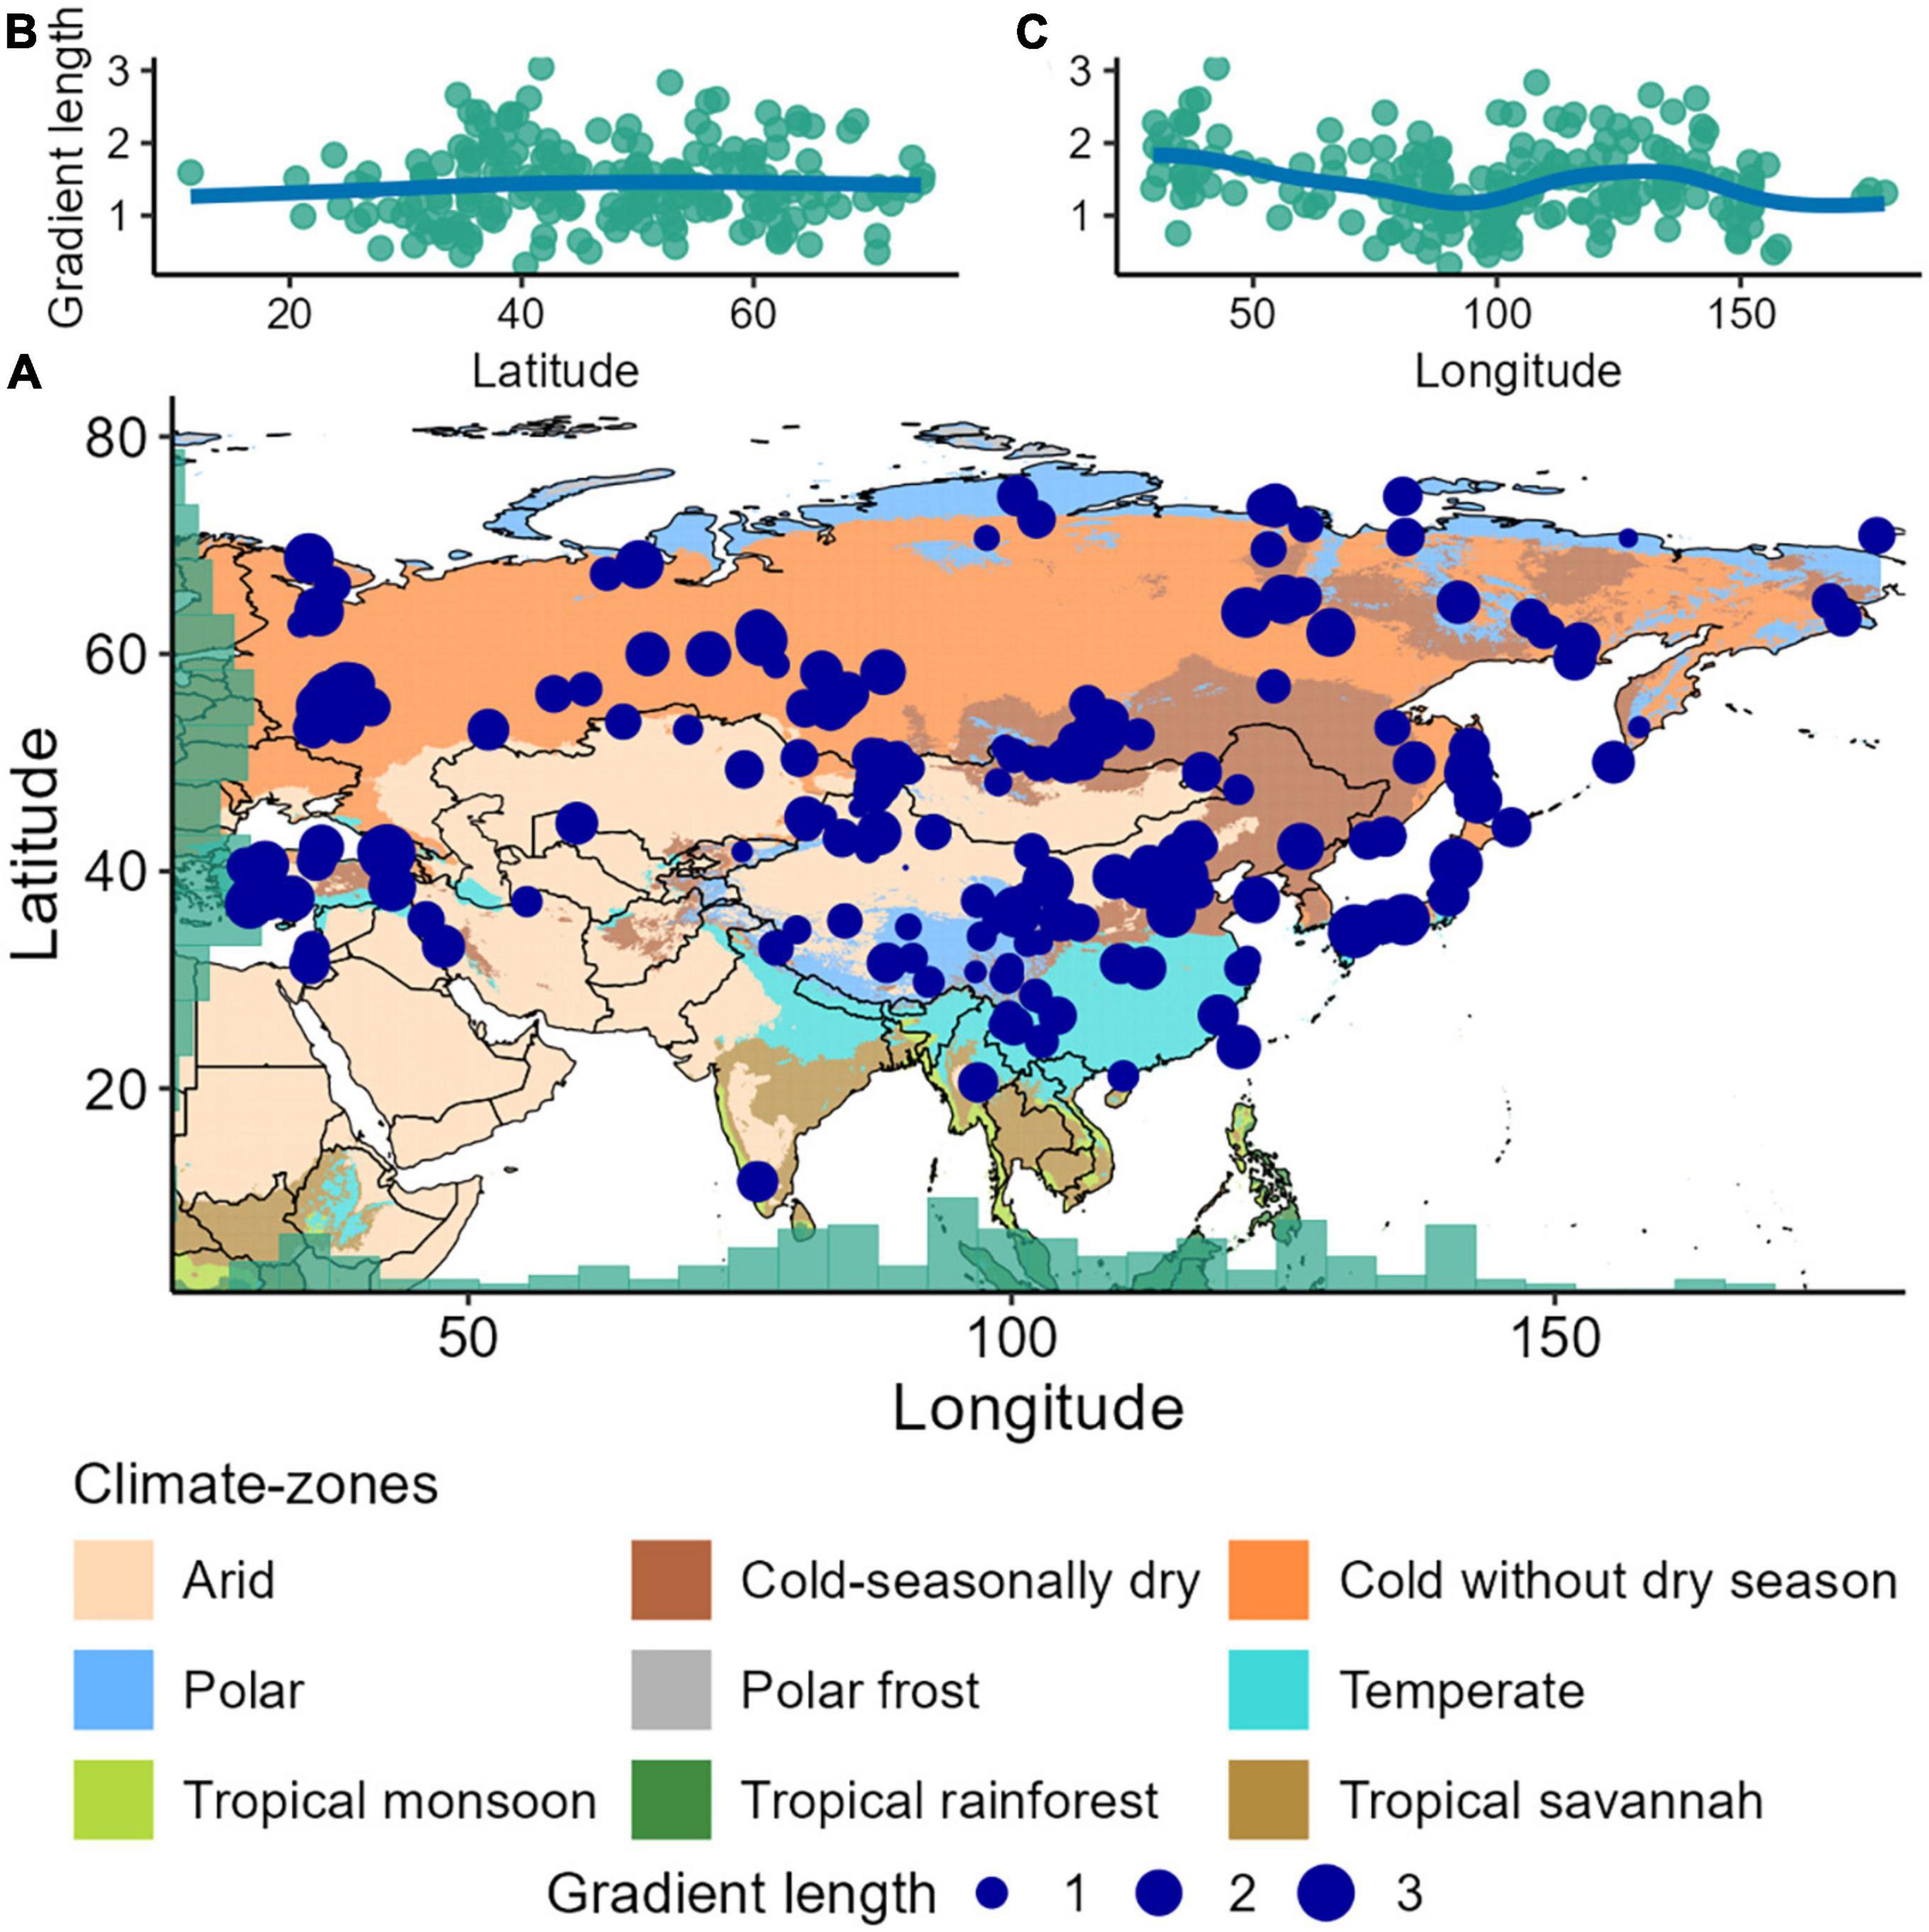
Figure 1. (A) Map of the study area (Asia), with the locations of the 205 processed records (blue dots). The records are only distributed in six (out of total nine) modified Köppen–Geiger climate-zones in Asia (cf. Beck et al., 2018): “Arid”, “Cold-seasonally dry”, “Cold without dry season”, “Polar”, “Temperate”, and “Tropical monsoon”. The “Tropical monsoon” climate-zone has one record, and therefore was excluded from the data, giving a total of 205 records from the five modified climate-zones for our analyses. We used a raster from the geo-tiff file in Beck et al. (2018) for the climate zonation and adopted their 13 climate-zone (general zones cluster) scheme, which provides a realistic classification of climate at the continental scale. For simplicity of climatic zonation over space, we amalgamated the closely related climate-zones based on the five climate-zone scheme of Beck et al. (2018). Size of the blue-dots in the map represents the total compositional turnover of the fossil pollen records across Asia. (B,C) Patterns of the total compositional turnover or gradient length [range of CaseR scores of the first axis of a detrended canonical correspondence analysis (DCCA1)] along the latitudinal and longitudinal gradients, where the blue trend-lines are plotted as the fitted values for a generalised additive model regression. The DCCA1 values are in standard deviation units of turnover (ter Braak and Šmilauer, 2012).
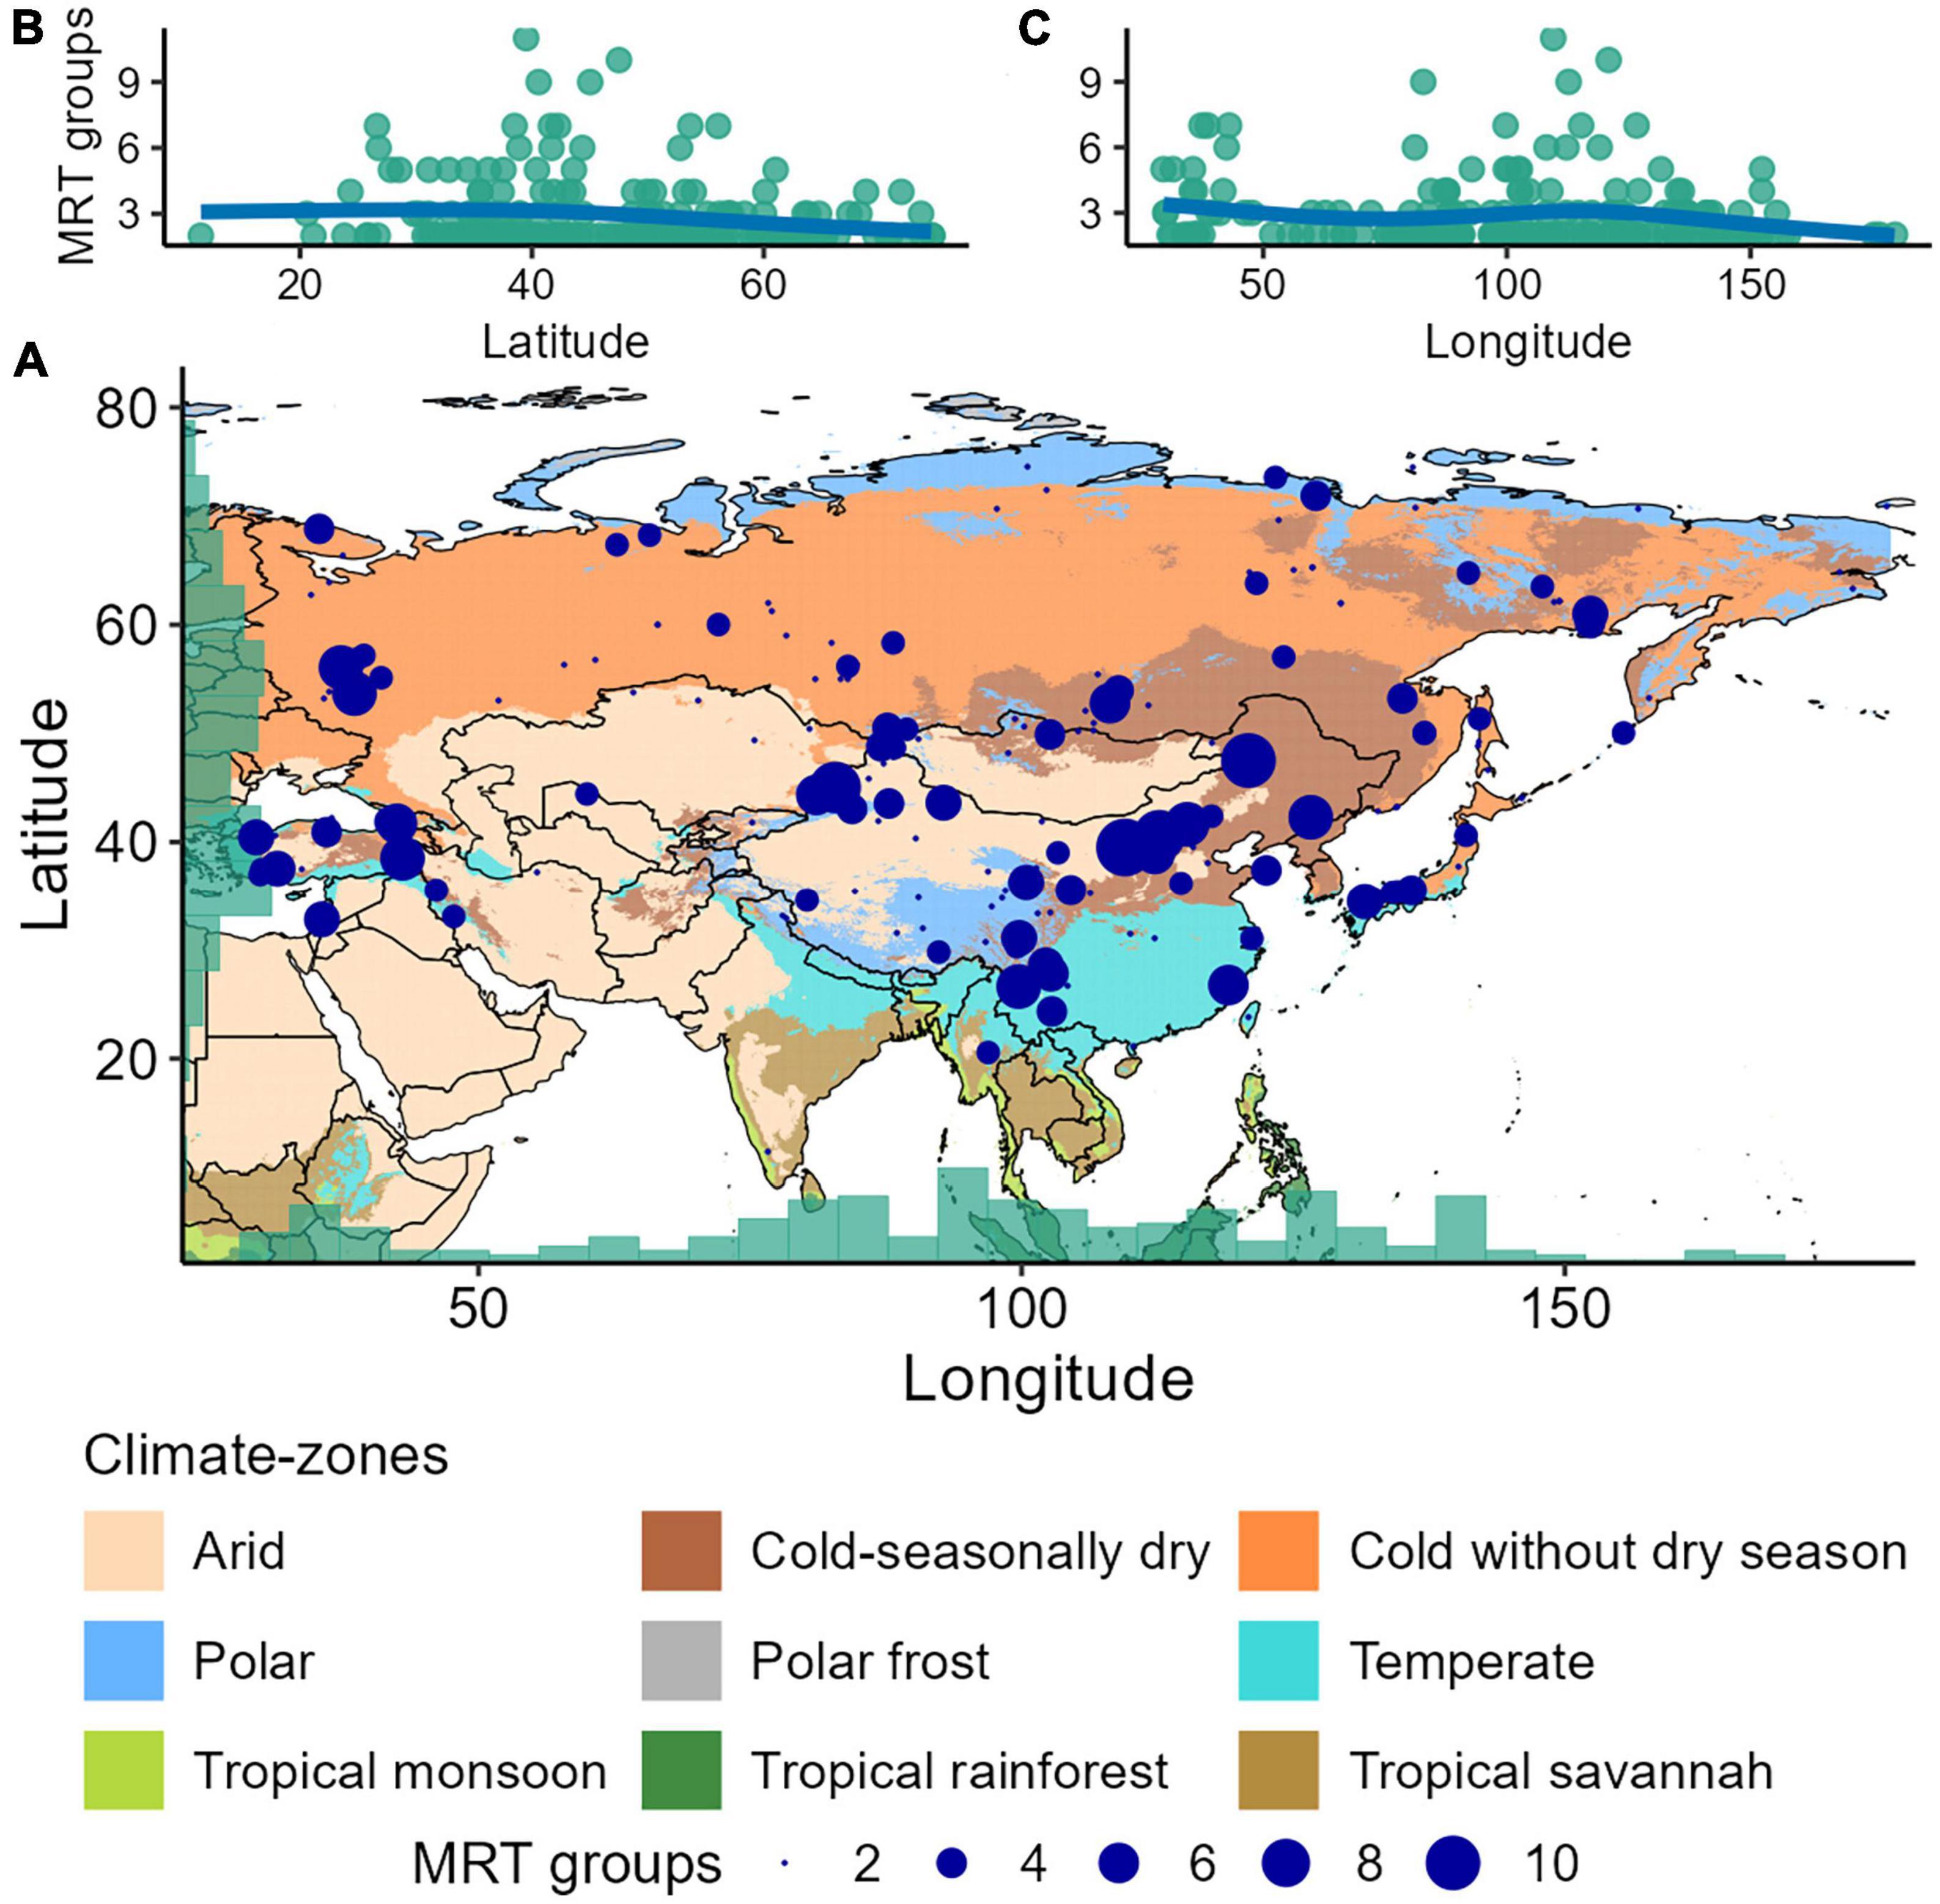
Figure 2. (A) Compositional change (number of unique partitions or “zones” revealed by multivariate regression tree, MRT) in the pollen assemblages along the temporal gradient of each fossil pollen record across Asia. (B,C) Patterns in the number of MRT groups along the latitudinal and longitudinal gradient (blue lines) are plotted as the fitted values for a generalised additive model regression.
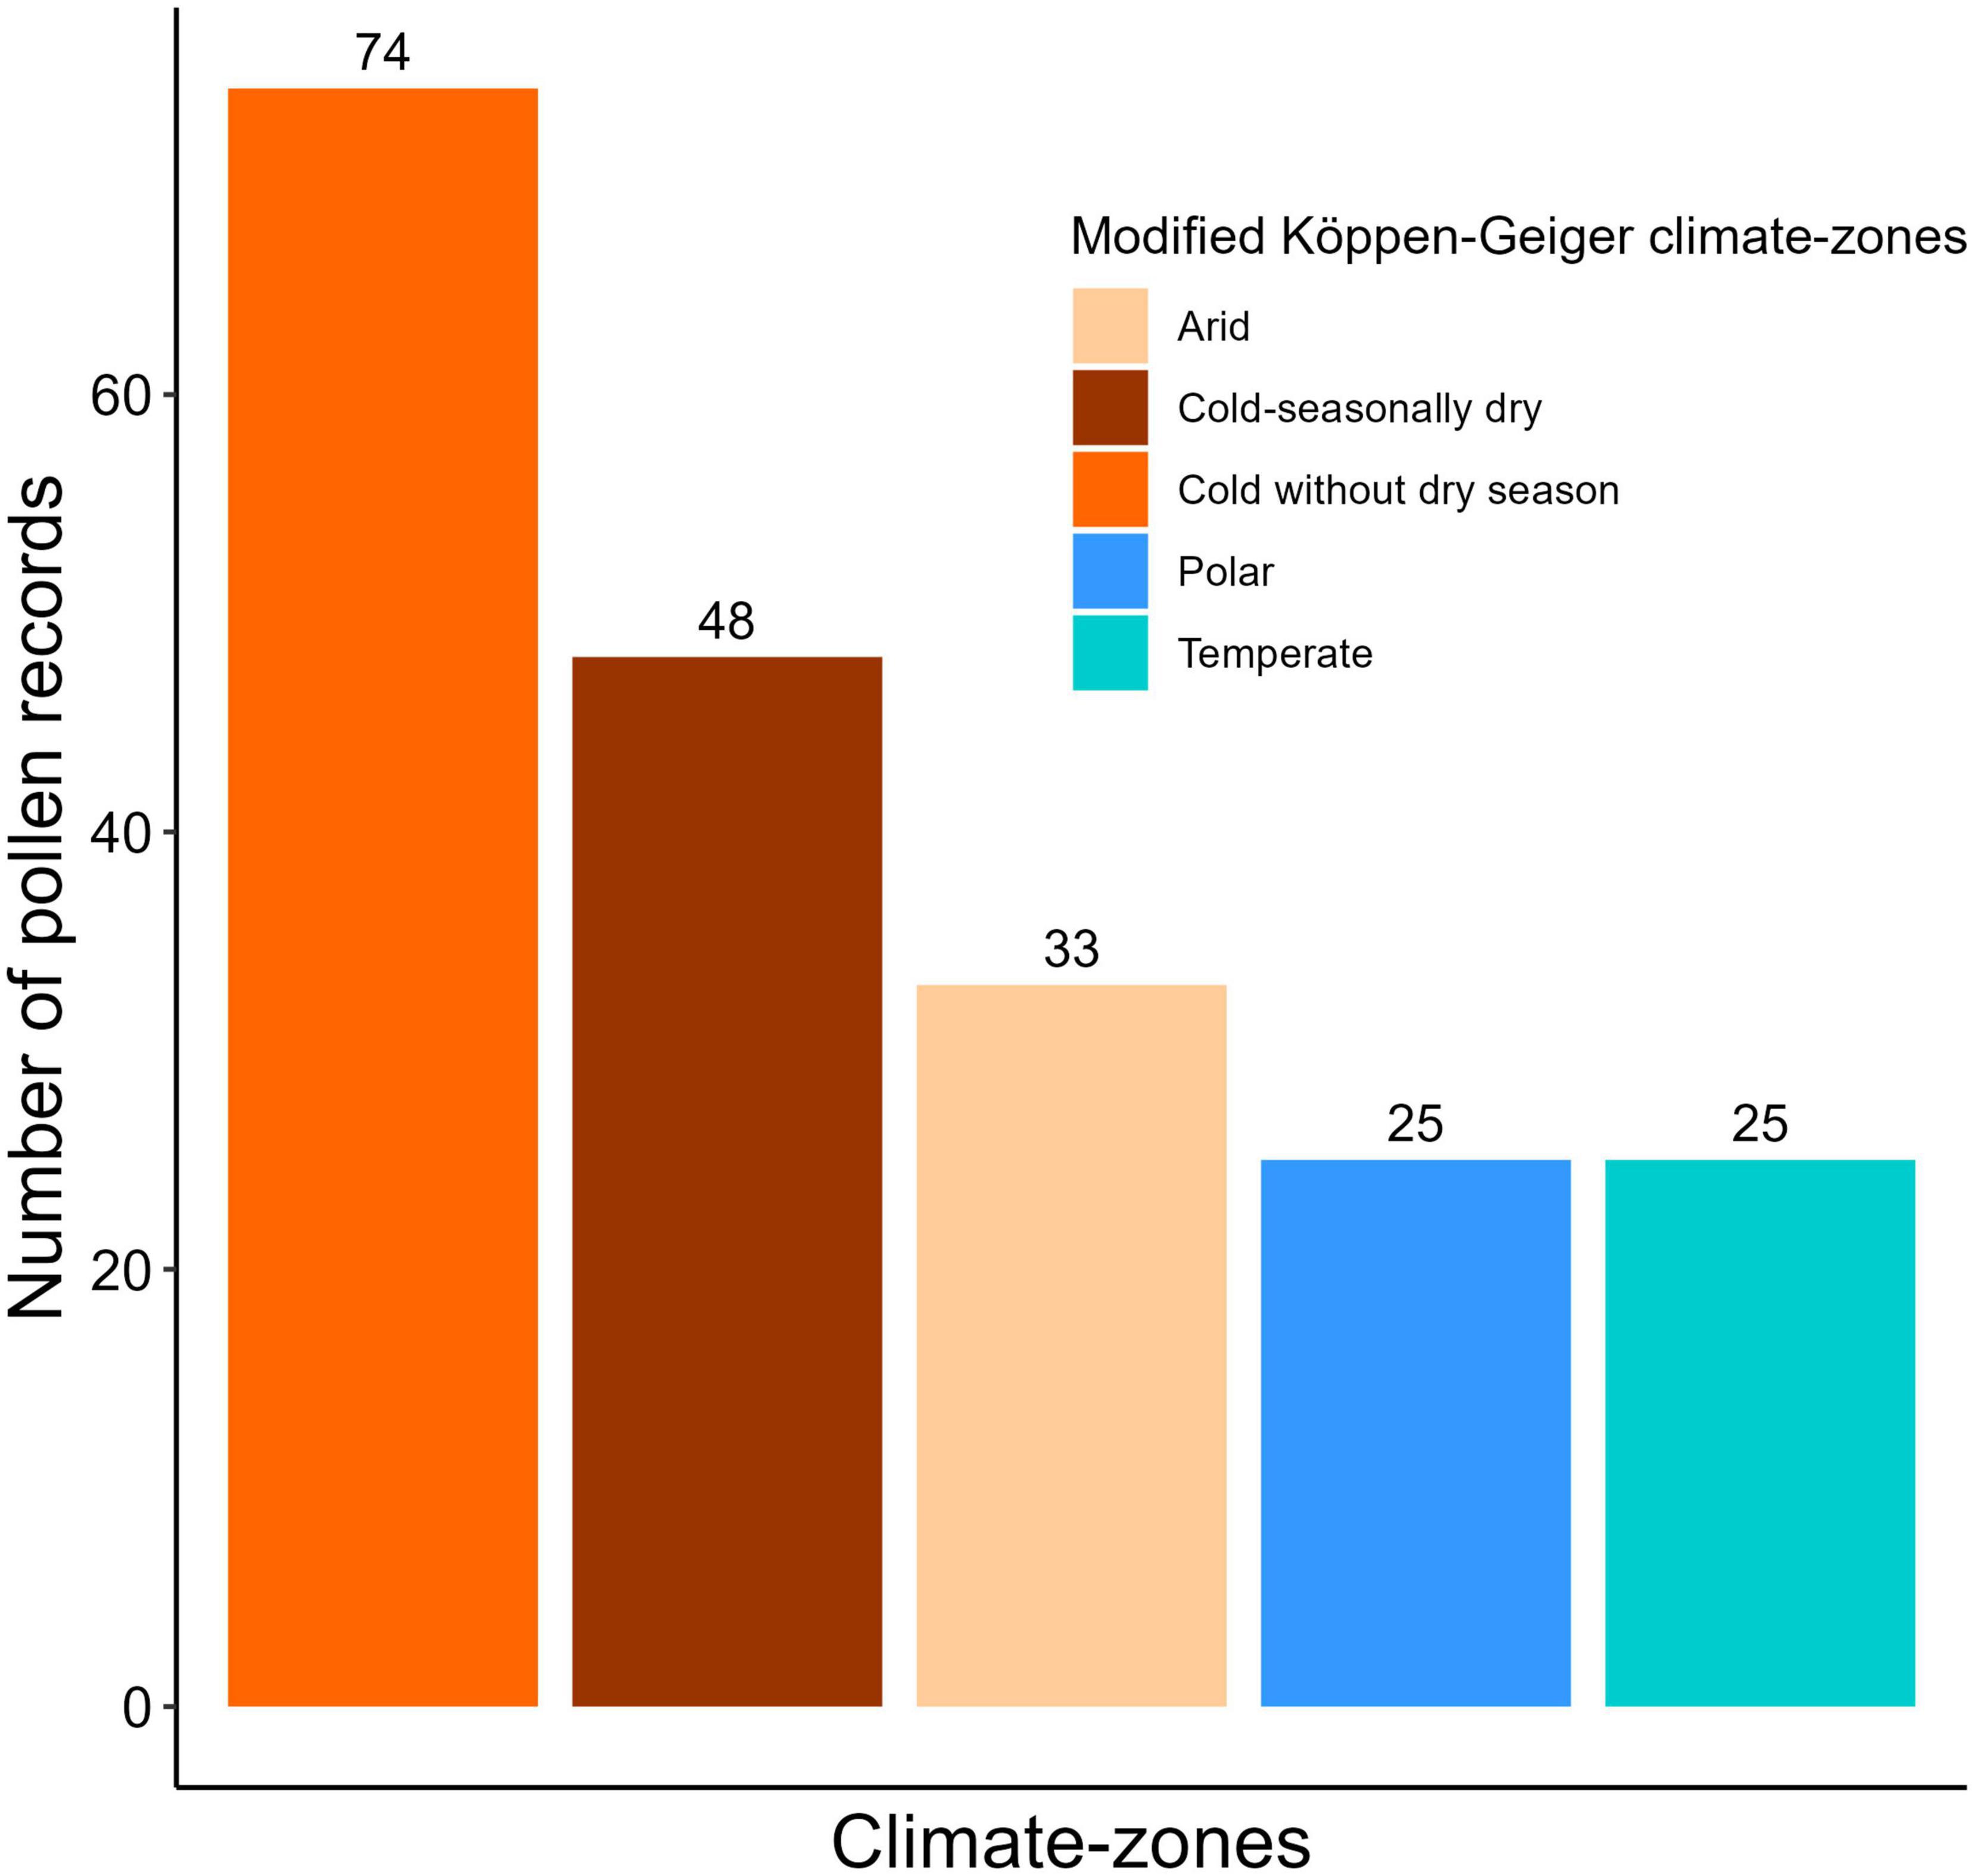
Figure 3. Number of fossil pollen records analysed from the five climate-zones in Asia.
The vast area and physiographic variation within Asia result in considerable climatic variation. Based on temperature and precipitation regimes, climatic conditions across Asia can be broadly grouped into nine Köppen–Geiger climate-zones or “General zone cluster” (cf. Beck et al., 2018; see Figure 1A). They are “Arid” (Middle East or the Levant region, north-western parts of the Indian Subcontinent, parts of Mongolia including the Gobi desert, north-west China); “Cold-seasonally dry” (parts of north-east China and Mongolia and south-east Siberia); “Cold without dry season” (regions between 50° N and 70° N latitudes, i.e., most of Siberia); “Temperate” (northern and north-eastern parts of southern Asia and some parts of Levant); “Tropical monsoon” (south-western parts of Indian subcontinent and parts of south-eastern Asia); “Tropical savannah” (Southern part of Indian subcontinent, and south-eastern Asia), “Tropical rainforest” (parts of south-eastern Asia-Malaysia), “Polar” (northern parts of Siberia and high altitude locations in central and southern Asia), and “Polar frost” (northern extreme of Siberia under permafrost) (Beck et al., 2018). However, our compiled records cover only six of the climate-zones, namely, “Arid,” “Cold-seasonally dry,” “Cold without dry season,” “Polar,” “Temperate,” and “Tropical monsoon” (Figure 1A). South-western Asia and central Asia experience an arid climate with influence from the Mediterranean climate system, whereas the monsoon climate system dominates across the southern and eastern regions (Figure 1A, “Arid”) (Chen F. et al., 2019). The Siberian region is influenced by the polar climate system and the “Siberian High” (Gong and Ho, 2002). Therefore, southern Asia is mild to hot, the far northern and north-eastern areas are very cold and dry, and mid-latitude areas of eastern Asia experience a temperate climate.
There is considerable variation in precipitation across the continent. The eastern and central parts are affected by the Indian summer monsoon, the East Asian summer monsoon, and the westerly circulation (Cao et al., 2013), resulting in a marked precipitation gradient from monsoon-dominated south-eastern Asia (Figure 1A, “Temperate”) to the desert areas of central Asia influenced by the westerlies (Figure 1A, “Arid”) (Cao et al., 2013). The Indian subcontinent and surrounding regions are affected by the Indian summer monsoon, and the south-western summer monsoon, creating an east-west and south-west – north precipitation gradient in southern Asia with tropical rainforest, savannah, and temperate zones (Figure 1A). In western and south-western Asia, most precipitation falls during winter and summers are generally dry and hot, leading to a north-south precipitation gradient, with a semi-arid to humid climate in the north and an arid climate in the south (Figure 1A, “Cold without dry season”) (Rohling et al., 2009; Cheng et al., 2015).
Data compilation and screening
We compiled a total of 552 raw fossil pollen records from Asia. Of these, 438 records were downloaded from the Pangaea database (PANGAEA® – Data Publisher for Earth and Environmental Science) (see text footnote 3, accessed on 13.01.2020), the Neotoma palaeoecology database (Williams et al., 2018) (see text footnote 2, accessed on 28.02.2021), and publications (datasets published with research papers, reports, etc.). In addition, we obtained 114 records from individual researchers. We processed all records applying a robust and consistent data-screening procedure based on their metadata, chronological and pollen data, and taxonomic harmonisation. The full metadata information of all records used in study (including the source of data) can be found in Supplementary Table 1.
Metadata
For each record we compiled information about latitude, longitude, site name or location, country, sample depth, number of samples, depositional environment, current climate based on the climatic classification of Beck et al. (2018) (see above and Figure 1), and relevant publications.
Chronological data
We used chronology-control points for the construction of an age-depth model for each record. We selected only the chronology control-point types appropriate for estimating robust age-depth models (see Supplementary Table 2). We only used records with more than two chronology-control points of the selected chronology-control types including core-top age.
Fossil pollen records
We preferred fossil pollen records with raw counts for further data processing and analysis. However, 48 records with pollen percentages originating from data-sparse regions were also considered. We only included records collected from selected sediment depositional environments (Supplementary Table 3), and pollen counts or percentages for terrestrial trees, shrubs, herbs, palms, succulents, and mangrove taxa. We subjected the records to taxonomic harmonisation (see below). We then processed the taxonomically harmonised pollen records based on age criteria. For this, we set the calibrated age of 12,000 cal year BP (calibrated years before present, where 0 year BP = 1950 common era CE) as the oldest age-limit (lower age-limit) for each record and discarded samples older than the lower age-limit. We also discarded records in which the calibrated age of the youngest sample (upper age-limit) was >1,600 cal year BP or the age of the oldest sample was <5,800 cal year BP. Thus, the lower age-limit of the selected records varies from 5,800 to 12,000 cal year BP, whereas the upper age-limit varies from 0 to 1,600 cal year BP. We then processed the record based on the number of taxa and samples. We only selected records with five or more samples and with five of more harmonised taxa. We then filtered the records based on the number of pollen grains in each sample of a record, where we discarded samples containing <25 grains. We also discarded samples with 25–150 grains if 50% of the samples in a record have more than 150 grains. This was done to avoid losing too many pollen records with only a few samples that consistently have a low pollen count. For a statistical summary of the pollen data, see Supplementary Table 4.
Taxonomic harmonisation
For standardisation of the pollen taxonomy in the records, we followed a hierarchical nomenclature system of the pollen morpho-types, in which closely related morpho-types are merged into a higher accepted pollen taxon or morpho-type. Based on the present flora and hence the pollen taxonomy, and the traditions of identifying, naming, and classifying pollen morpho-types by different analysts, we harmonised pollen taxonomy and nomenclature for the three regions, the Levant, continental Asia, and Siberia, separately. We harmonised the pollen morpho-types in each region to the taxonomically highest-precision level of pollen morpho-types potentially identified by most palynologists. As a result, the harmonised pollen taxa in all three regions are robust enough to compare pollen composition across these regions. Altogether, we harmonised 2115 “raw” pollen morpho-types into 508 harmonised taxa for Asia. The harmonisation tables used in this study can be found at https://github.com/HOPE-UIB-BIO/Asian_palynological_synthesis/blob/main/Data/Input/Hamonisation_tables/Asia_Main-2021-07-07.csv, https://github.com/HOPE-UIB-BIO/Asian_palynological_synthesis/blob/main/Data/Input/Hamonisation_tables/Asia_Siberia-2021-06-16.csv, and https://github.com/HOPE-UIB-BIO/Asian_palynological_synthesis/blob/main/Data/Input/Hamonisation_tables/Asia_Levant-2021-06-16.csv.
Age-depth models
We estimated an age-chronology of each record using the Bchron (Haslett and Parnell, 2008) age-depth modelling approach. To develop age-depth models, we calibrated the dates of the selected chronology-control point types using IntCal20 (Reimer et al., 2020) or mixed or post-bomb calibration curves based on the geographical location of the records and the boundaries recommended by Hogg et al. (2020). For each record, we constructed an age-depth model using the “bchron” R package (Haslett and Parnell, 2008) using 50,000 iterations, while discarding the first 10,000 (“burn”) and keeping each 40th (“thin”). This results in 1,000 draws to build posterior estimates of age uncertainty. We calculated the median age estimate for each sample depth to obtain the age used in these analyses. All ages are expressed in calibrated years before present (cal year BP). We selected the records based on our age-limit criteria (see section “Fossil pollen records”) and used only the median age of the samples for analysing the temporal patterns in the PAPs.
Screening of the records based on the above criteria resulted in 232 records. We then examined the pollen diagram and the age-depth model for each record. Of these, 25 records were found to be of poor quality and therefore unsuitable for numerical analysis. This resulted in 207 fully processed records for further analyses. However, we removed the single record from the “Tropical monsoon” climate-zone, and a record from far-east Siberia that is beyond the international dateline (−179.75° W longitude) before numerical analysis to avoid a large discrepancy in the number of records per climate-zone and the geographical distribution of records.
Numerical analyses
Analyses are based on the 205 fully processed fossil pollen records covering the past 12,000 years (Figures 1–3). We used R version 4.1.1 (R Core Team, 2022) for data acquisition, processing, age-depth modelling, and analysis.
Estimating pollen-assemblage properties
In each record we analysed the spatial patterns of the total pollen-compositional variation and temporal pattern of each PAP (except MRT partitions) along the temporal gradient of 12,000 years.
Hill’s taxonomic richness, diversity, and evenness measures
We estimated pollen richness (the number of pollen types present in a pollen record) by Hill’s (1973) N0 measure, pollen diversity by Hill’s (1973) N1 and N2 measures, and pollen evenness by their ratios (N2/N1 and N1/N0). There are several advantages of using Hill numbers over other diversity indices (Chao et al., 2014; Birks et al., 2016a), and these indices are increasingly used as quantitative diversity metrics in ecology. The most important feature of Hill numbers is that they obey the intuitive replication principle or doubling property and are all expressed in units of effective number of taxa, i.e., the number of equally abundant taxa (species) in an assemblage (Chao et al., 2014). N0 is the number of taxa in an assemblage regardless of their abundances. N1 estimates the number of abundant taxa in an assemblage, where each taxon is weighted by its relative frequency and is the exponential of the commonly used Shannon diversity index. N2 estimates the number of very abundant taxa in an assemblage by giving most weight to the common and more abundant taxa with rare taxa making almost no contribution to the sum and is the inverse of Simpson’s diversity or concentration measure (Chao et al., 2014; Birks et al., 2016a). Evenness is a measure of the variability in taxon abundances in a sample or assemblage, and can be estimated by a ratio of Hill numbers (Eα,β = Nα/Nβ, where E is evenness, N is a Hill number, and α and β are the orders of N, and α ≠ β) (Birks et al., 2016a). Hill (1973) proposed N2/N1 as an appropriate evenness measure as evenness should be independent of taxon richness. However, several alternative measures of evenness (Hill ratios) have also been proposed, each of which has its own strengths and weaknesses (see Birks et al., 2016a). Here, we used the two most widely used evenness measures based on Hill numbers: N2/N1 and N1/N0. Prior to estimating Hill indices, we used rarefaction (cf. Chao et al., 2014) to standardize the count size. Using ‘‘diversity_estimate’’ function in ‘‘R-Ecopol’’ package (v0.0.1) in R,4 we estimated Hill’s richness, diversity, and evenness indices.
Pollen-compositional turnover
We performed detrended canonical correspondence analysis (DCCA) (ter Braak, 1986; ter Braak and Šmilauer, 2012) with Hill’s detrending, non-linear rescaling, and no down-weighting of rare taxa (Hill and Gauch, 1980) to estimate the compositional turnover in each pollen record, where time (sample age) was used as the sole explanatory variable. Pollen records provide a basis for estimating biotic turnover along long temporal gradients (Birks, 2007; Felde et al., 2020). In DCCA, weighted average (WA) sample scores, i.e., “CaseR,” along ordination axes are scaled in ecologically interpretable standard deviation units of compositional turnover (ter Braak and Šmilauer, 2012). In pollen records, samples are arranged in a known temporal order, and the DCCA is constrained by sample age. Hence, the total gradient length, i.e., range of the sample scores (CaseR), of the first DCCA axis gives an estimate of the total amount of compositional turnover along the temporal gradient, whereas the individual CaseR scores elucidate sample-to-sample compositional turnover based on all pollen taxa within the record (Birks, 2007; Felde et al., 2020). We performed DCCA analysis using CANOCO version 4.5 (ter Braak and Šmilauer, 2002) via “fit_ordination” function in “R-Ecopol” package (v0.0.1) using a second-order polynomial predictor of age.
Pollen-compositional change: multivariate regression tree
Multivariate regression tree (MRT) is a statistical technique that can be used to explore, describe, and predict relationships between multivariate response data and environmental predictor variables (De’ath, 2002). It forms clusters of samples by repeated splitting of the data, with each split defined by a simple rule based on external predictor values. The splits are chosen to minimise the dissimilarity of samples within clusters, where each cluster represents an assemblage of samples and response variables. It is a robust technique well suited for analysing complex data that may include imbalance, missing values, non-linear relationships between variables, and high-order interactions (De’ath, 2002; Legendre and Birks, 2012; Simpson and Birks, 2012). We performed MRT partitioning based on the 1-SE rule [from a series of trees, the smallest tree within one standard error (SE) of the best is often selected, see De’ath, 2002], using the Chi-squared metric (Prentice, 1980) and sample age as the sole predictor variable to extract statistically significant partitions (pollen-assemblage zones) for each record. These are the points of significant compositional change along the temporal gradient (Simpson and Birks, 2012). We used the “mvpart” package in R (De’ath, 2014) for performing MRT analysis in each record.
Rate of pollen-compositional change
Estimating the magnitude of the rate of compositional change through a pollen record per unit time (RoC) is a useful tool for quantifying temporal patterns of compositional change in pollen-stratigraphic data per unit time (Birks, 2012; Mottl et al., 2021b). There are several methods for estimating RoC (see Mottl et al., 2021b), but earlier studies have shown that many methods do not circumvent the artefactual variations arising from irregular temporal sampling resolution (Mottl et al., 2021b). To avoid such issues in RoC, Mottl et al. (2021b) present an innovative approach that is a variant of a moving window. Here we estimated the rate of compositional change for each record using the authors’ “R-Ratepol” package (Mottl et al., 2021b). We used an age bin size of 500 years and 5 window shifts and estimated RoC using the Chi-squared metric (Prentice, 1980) between consecutive time intervals. We transformed pollen counts to proportions and applied the “Age-weighted average” smoothing method with maximal age range for 500 years for each pollen type. For RoC estimation, we selected the random sample in each bin as a representative of that bin and standardised each “Working Unit” to 150 individuals (otherwise, to the smallest number of pollen grains in record) using random resampling without replacement. We set the number of iterations to 1,000. A detailed procedure for RoC estimation, and reasons for estimating RoC over 500-year bins are described in Mottl et al. (2021b).
Spatial patterns of compositional turnover and change
We fitted a generalised additive model (GAM) regression using “mgcv 1.8-40” package in R (Wood, 2022) for analysing latitudinal and longitudinal patterns of total compositional turnover and compositional change (MRT partitions), where we treated these estimates as a response variable against latitude and longitude of the records as predictor variables. We assumed a “Tweedie” error distribution (p = 1.1) for the models of compositional turnover and a “Poisson” error distribution for the MRT partition models.
Cross-scale patterns of pollen-assemblage composition and diversity estimates
For cross spatial-scale comparison of the temporal patterns of PAPs during the last 12,000 years, we analysed the patterns of each PAP at three spatial scales (grains): “Pollen record level” (patterns for individual records), “Climate-zone level” (assembled the records into the five climate-zones and summarised the patterns of each PAPs within each climate-zone), and “Continent level” (summarised the temporal patterns of each PAPs for the entire continent).
For “record level,” we developed a single generalised linear model (GAM) for each record using “mgcv 1.8-40” package in R (Wood, 2022), in which we treated estimates of each PAP as a response variable and time (ka) as a predictor variable. However, for the “climate-zone level,” we developed one hierarchical generalised additive model (hGAM) for each climate-zone, and for the “continent level,” we developed a single hGAM for the whole continent using “mgcv 1.8-40” package in R (Pedersen et al., 2019).
We treated location (“dataset_id”) of each record as a random effect variable with a separate smoother and penalty for each record within the climate-zone, and a shared smoother and penalty for the overall (global) model of the climate-zone (similar to Model GI in Pedersen et al., 2019). For the temporal patterns at the “continent level,” we fitted a single hierarchical GAM model with a separate smoother and penalty for each “dataset_id” and a shared smoother and penalty for the overall (global) model for the whole continent (similar to Model GI in Pedersen et al., 2019). We assumed a “Tweedie” error distribution (p = 1.1) for models of N0, N1, N2, DCCA1, and RoC, and a “beta” error distribution for models of evenness measures (N2/N1 and N1/N0). For all models we predicted values for each 100 years but limited the prediction to only span the time period with data (i.e., we did not fore- or back-cast more than 100 years from the first and last data point, respectively). For “records level” patterns, we summarised the similarity between patterns of records using the root-mean-square error (RMSE), calculated for each 100 years. All figures of the spatial and temporal patterns are plotted using “ggplot2” (Wickham, 2016).
Major temporal changes in the pollen-assemblage properties
Regression tree partitioning
To answer our second research question concerning synchronicity of temporal changes in PAPs among records, we performed regression tree (RT) partitioning of the estimates of compositional turnover (DCCA axis 1 sample or “CaseR” scores) and Hill’s richness, diversity, and evenness estimates, with respect to the time (sample-age) predictor variable for each record. This gives us the time or age of each split in a RT of a PAP, which represents the time of major changes in that PAP, called the “change-point.” RT, like MRT, are a specific family of machine-learning techniques, in which the trees are used to partition a record by successively separating the response variable based on relative abundances with respect to a predictor variable (De’ath, 2007). Classification and RTs (Breiman et al., 1984) are being widely used to explore, describe, and summarise ecological data (e.g., De’ath, 2002; Simpson and Birks, 2012; Chevalier et al., 2020). A univariate RT is a useful tool to analyse variation in a single numeric response variable using numeric and/or categorical predictor variables. We used the “mvpart” package in R (De’ath, 2014) to partition the PAP estimates.
To summarise the temporal trends of RT change-points of each PAP, we estimated the density of RT and MRT “change-points” per 1,000-year time bin for each PAP, using the “reflecting technique” of Silverman (1986), which mitigates edge effects. For “record level” we estimated density from change-points of each record. However, for the “climate-zone level,” and “continent level,” we pooled the change-points within each climate-zone and the continent, respectively, and then estimated the density of the change-points for each PAP. For all spatial scales we rescaled the density values between 0 and 1.
Results
The great variation in climate, physiography, and spatial distribution of the records across the continent is reflected in the complex variation in the spatio-temporal patterns of the different PAPs (see Figures 1–5).
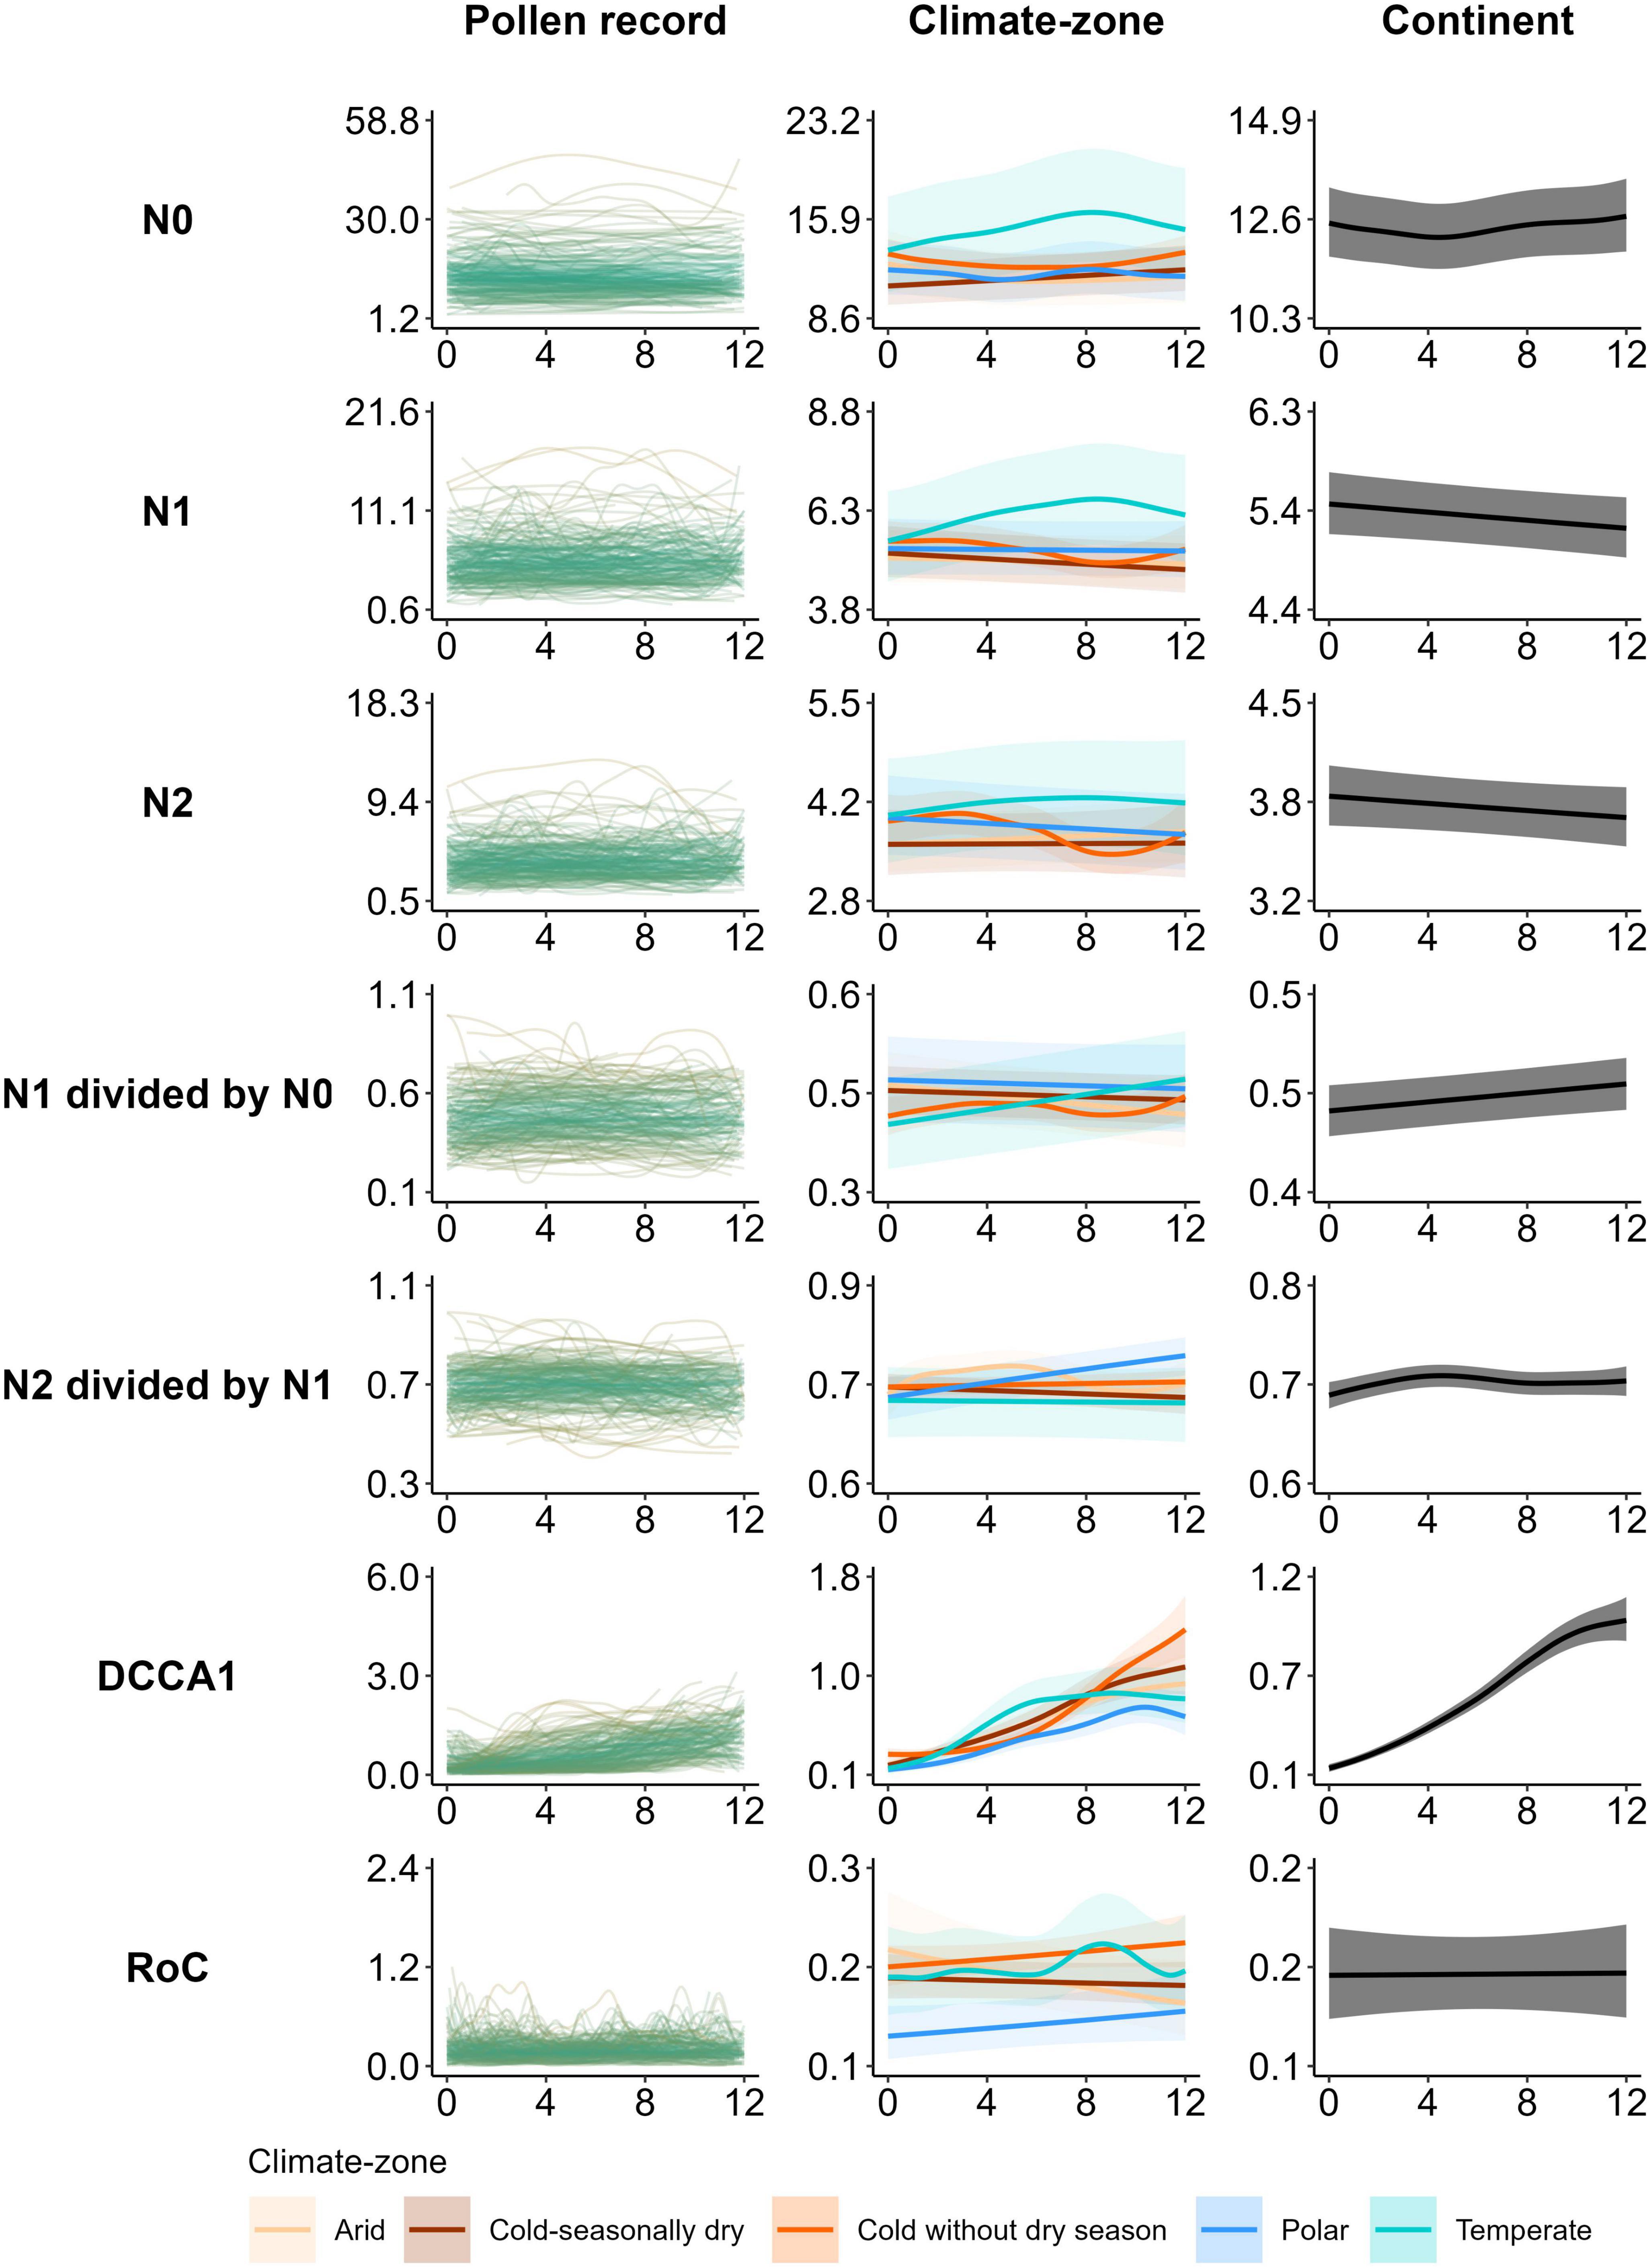
Figure 4. Pollen record-, climate-zone-, and continent-scale temporal trends of Hill (1973) numbers: richness (N0); exponent of Shannon entropy (N1); inverse of Simpson’s index of concentration (N2); evenness ratios (N1 divided by N0 or N1/N0; and N2 divided by N1 or N2/N1), compositional turnover [site CaseR scores of the first axis of a detrended canonical correspondence analysis (DCCA1)], and rate of change (RoC) estimated for 205 records across Asia. Record level (first column) is a trend line for each record (green) for each PAP-estimate fitted by a generalised additive model for each location (“dataset_id”). Climate-zone level (middle column) models are fitted by five (one for each climate-zone) hierarchical generalised additive model (hGAM), accounting for the random effect of location. The continent level (third column) models are fitted by a single hGAM for all data within the continent accounting for the random effect of location. Lines are values predicted for each 100 years and shading (only climate-zone and continental scales) is error measurement represented by 95% confidence interval. For “record level”, the gradient of colour of the trend lines from pale green to green reveals the similarity between patterns of records based on the root-mean-square error (RMSE), calculated for each 100 years. The X-axis of each panel represents time (calibrated years before present expressed as thousands of years) and the Y-axis represents the estimates of the pollen-assemblage properties.
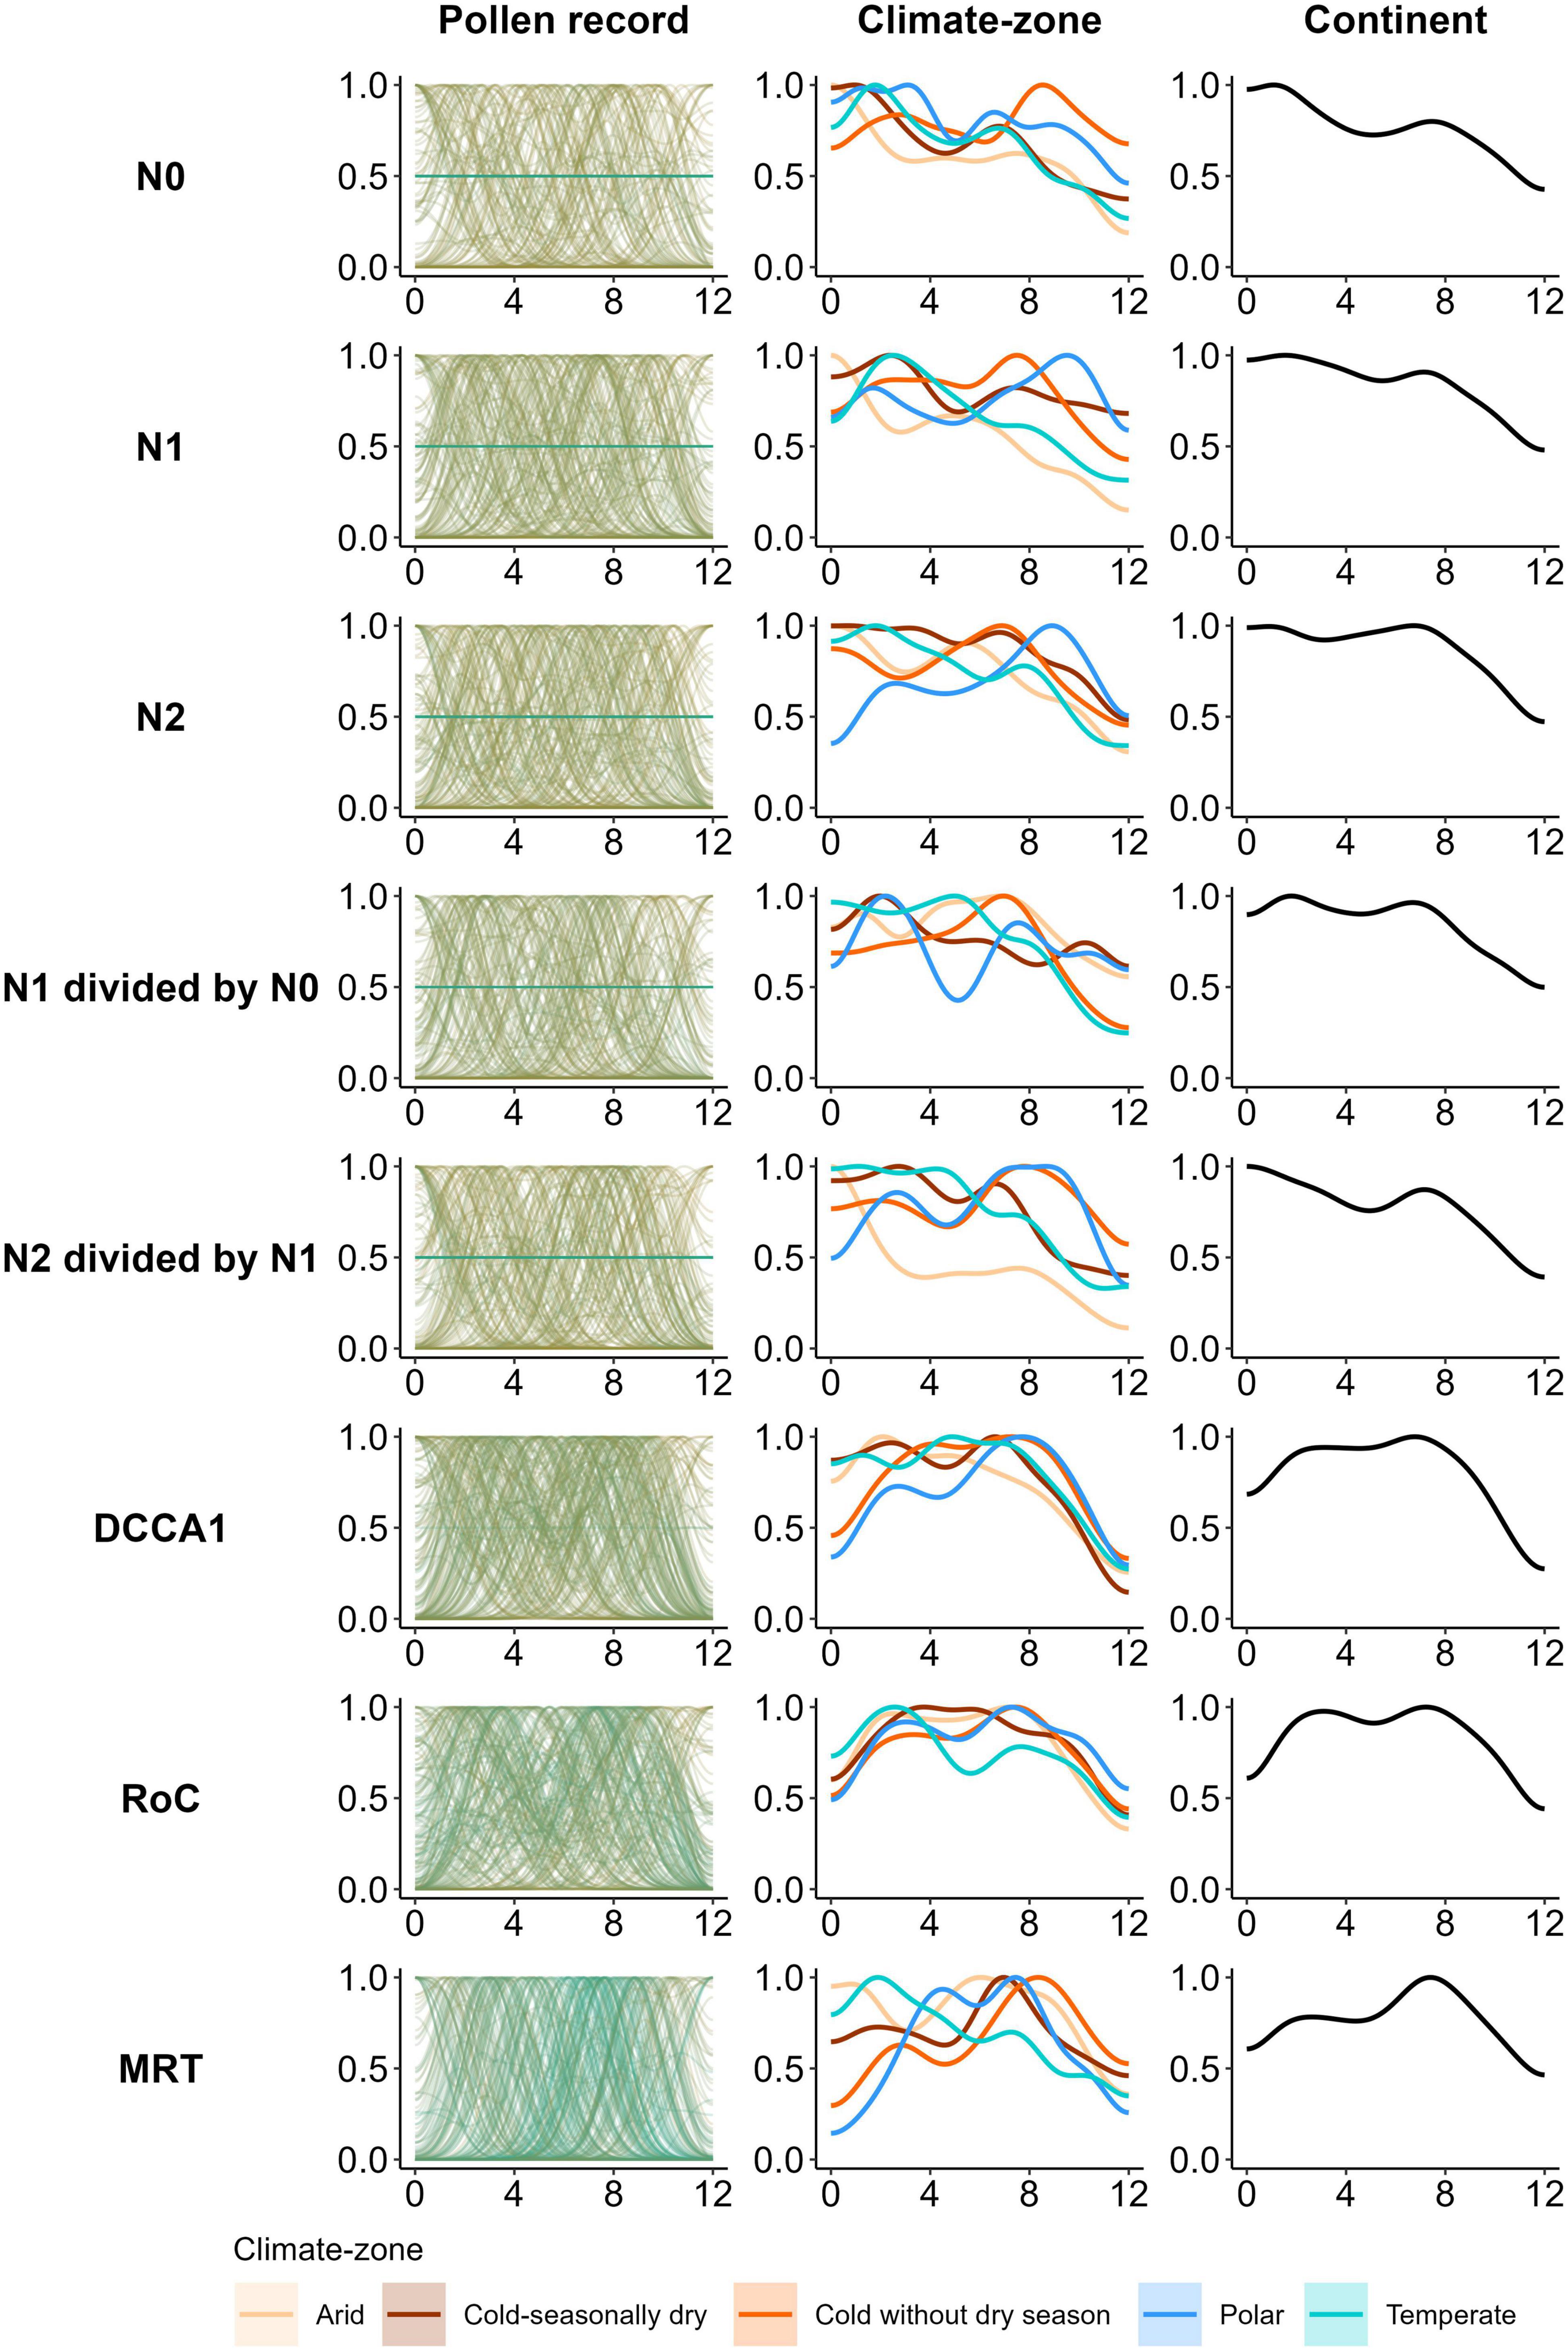
Figure 5. Pollen record-, climate-zone-, and continent-scale temporal trends of density of regression tree (RT) and multivariate regression tree (MRT) change-points (time/age of the major changes in a PAP) for each PAP of 205 datasets across Asia. Trends of the change-point density are presented for Hill (1973) numbers: richness (N0); exponent of Shannon entropy (N1); inverse of Simpson’s index of concentration (N2); evenness ratios (N1 divided by N0 or N1/N0 and N2 divided by N1 or N2/N1), compositional turnover [site CaseR scores of the first axis of a detrended canonical correspondence analysis (DCCA1)], rate of change (RoC), and compositional change [multivariate regression tree (MRT) partitions]. For “record level”, the gradient of colour of the trend lines from pale green to green reveals similarity between patterns of the records based on the root-mean-square error (RMSE) calculated for each 100 years. The X-axis of each panel represents time (calibrated years before present expressed as thousands of years) and the Y-axis represents the standardised density of the regression tree change points for the pollen-assemblage properties.
Spatial patterns of compositional turnover and change
Total compositional turnover along the temporal gradient of each record – as estimated by the DCCA axis 1 gradient length – varies markedly (0.3–2.1 SD units) across records (Figure 1A). However, there is no noticeable pattern in total compositional turnover along the latitudinal gradient (predicted values range between 1.1 and 1.2 SD units, 95% confidence intervals “CI” range between 0.8 and 1.2; Figure 1B). We observe a decline in compositional variation (total compositional turnover and change) eastward along the longitudinal gradient, but with an increase in compositional turnover between ca. 100° E and 150° E (Figures 1C, 2C). Temporal variation in compositional change (number of MRT zones in each record) along the latitudinal gradient is slightly more pronounced and exhibits a weak curvilinear latitudinal pattern, which declines from mid- to high-latitudes (predicted values 3.2–2.2 MRT groups or assemblages, CI 1.6–4.9; Figures 2A, B).
Cross-scale patterns of pollen-assemblage composition and diversity estimates
Temporal patterns of Hill’s indices (N0, N1, N2, N2/N1, and N1/N0), compositional turnover, and RoC are presented at three different spatial scales (individual record, climate-zone, and whole continent) (Figure 4), whereas the temporal pattern of compositional change (MRT partitions) at the same spatial scales is presented in the form of the density of RT change-points in each 1,000-year time-bin in the last 12 ka (Figure 5, “MRT”).
Taxonomic richness, diversity, and evenness
Holocene-wide patterns of Hill’s (1973) diversity estimates are rather heterogeneous across spatial scales. Pollen richness (N0) at the record level is highly heterogeneous and shows no general temporal pattern with predicted values ranging between 2.4 and 48.7 pollen-taxa (CI 1.4–53.5; Figure 4, “N0: Pollen record”). However, when N0 estimates are summarised at the climate-zone level (Figure 4, “N0: Climate-zone”), there is less heterogeneity in the patterns across the climate-zones. All the climate-zones except the “Temperate” zone either reveal a gradual or no temporal variation in pollen richness (predicted values 11.5–12.7, CI range 9.3–5.0). Pollen richness in the “Temperate zone” shows an increasing trend during the early-Holocene and then it decreases gradually until the present (predicted values 13.6–16.4, CI 10.5–21.1; Figure 4, “N0: Climate-zone”). At the continental-scale, a gradually declining pattern from the early- to mid-Holocene and then a gradual increase in N0 from the mid-Holocene to the present is evident (predicted values 12.2–12.6, CI 11.4–13.5; Figure 4, “N0: Continent”).
Temporal patterns of Hill’s (1973) N1 and N2 measures also vary across spatial scales. No general temporal patterns of N1 and N2 are observed at the record level (Figure 4, “N1, N2 Pollen record”). At the climate-zone level, both PAPs in the “Temperate” climate-zone reveal a unique pattern, where both N1 and N2 reveal a gradual increase during the early-Holocene and then decrease linearly from the mid-Holocene to the present (predicted values 5.5–6.6 and 3.9–4.2; CI 4.5–7.9 and 3.3–5, respectively for N1 and N2; Figure 4, “N1, N2: Climate-zone”). However, in the climate-zone of “Cold without dry season,” both diversity estimates decrease gradually during the early-Holocene and then increase from the late early- to mid-Holocene, followed by a slight decrease during the most recent period of the late-Holocene (predicted values 5.0–5.6 and 3.4–4; CI 4.6–6 and 3.2–4.3, respectively, for N1 and N2; Figure 4, “N1, N2: Climate-zone”). There is a gradual linear increasing or no temporal pattern of N1 and N2 in other climate-zones. At the continental scale, a gradually increasing pattern in N1 and N2 from the early- to late-Holocene is evident (predicted values 5.2–5.4 and 3.7–3.8; CI 4.9–5.7 and 3.5–4, respectively, for N1 and N2; Figure 4, “N1, N2: Continent”).
No general temporal patterns of Hill’s evenness ratio estimates (N2/N1 and N1/N0) are evident at the record level (Figure 4, “Pollen record”). At the scale of climate-zones, estimates of both evenness ratios in the majority of the climate-zones either decrease gradually or remain unchanged from the early- to late-Holocene (Figure 4, “N2/N1 and N1/N0: climate-zone”). However, a gradual increase in the evenness ratios from the early- to mid-Holocene, followed by a decline in the estimates from the mid- to late-Holocene, is evident in the “Arid” zone (predicted values 0.70–0.75 and 0.43–0.47; CI 0.67–0.77 and 0.38–0.42, respectively for N2/N1 and N1/N0; Figure 4, “N2/N1 and N1/N0: Climate-zone”). At the continental scale, both the evenness estimates reveal a gradual declining trend from the early-Holocene to the present (predicted values 0.70–0.72 and 0.44–0.46; CI 0.69–0.73 and 0.42–0.48, respectively, for N2/N1 and N1/N0; Figure 4, “N2/N1 and N1/N0: Climate-zone”).
Compositional turnover
Temporal pattern of compositional turnover (CaseR scores of DCCA axis 1) is relatively more consistent across the spatial scales of individual records, climate-zones, and the whole continent, which declines linearly from the onset of the Holocene to present (Figure 4, “DCCA1”). However, turnover in the “Temperate” zone does not reveal a clear temporal pattern from the early- to mid-Holocene, whereas it declines linearly from the mid-Holocene to the present (predicted values 0.14–0.81; CI 0.11–1; Figure 4, “DCCA1: climate-zone”). At the continental scale, a linear declining pattern in DCCA1 from the early-Holocene to the present is evident (predicted values 0.18–0.97; CI 0.16–1.1; Figure 4, “DCCA1: continent”).
Rate of change
Rates of pollen-compositional change per 500-years vary along the temporal gradient of Holocene as well as across the spatial scales of study (Figure 4, “RoC”). No general temporal pattern in RoC is observed at the record level, whereas it decreases gradually from the early-Holocene to the present in most of the climate-zones. Notably, an increase in RoC during the early-Holocene, followed by a gradual decrease until the present time, is evident in the “Temperate zone” (predicted values 0.16–0.20; CI 0.12–0.25), whereas there is a linear increase in RoC from the early- to late-Holocene in the “Arid zone” (predicted values 0.14–0.20; CI 0.10–0.26) (Figure 4, “RoC: Climate-zone”). At the continental scale, a very gradual linearly declining pattern of RoC from the early-Holocene to the present is evident (predicted values 0.167–0.168; CI 0.15–0.18; Figure 4, “RoC: Continent”).
Major temporal changes in the pollen-assemblage properties
Temporal patterns of major changes in PAPs (density of RT and MRT change-points of PAPs), especially for DCCA1, MRT, and RoC are broadly consistent across spatial scales (Figure 5). Record level temporal patterns in the density of RT change-points are heterogeneous for the Hill’s indices. However, there is a clearly increasing temporal pattern of the density of change-points from the early- to mid-Holocene for the record level trends of DCCA1, RoC, and MRT (Figure 5, “Pollen record”). At the climate-zone- and continent-scales, the density of the RT change-points increases from the early- to mid-Holocene for all PAPs. However, from the mid-Holocene to recent times, temporal patterns are slightly less consistent across the spatial scales as well as across the PAPs (Figure 5, “Climate-zone”). During this period, the density of RT change-points for most of the PAPs decreases during the mid-Holocene (ca. 4,000–5,000 cal year BP), followed by an increase in change-point density during the mid- to late-Holocene transition, but again with a decrease in the density during the most recent time (Figure 5, “Climate-zone”, “Continent”). Temporal patterns in the density of RT change-points for the majority of PAPs are rather erratic in the “Arid” climate-zone, where the patterns reveal a generally increasing trend from the early-Holocene to the recent times (Figure 5, “Climate-zone”).
Discussion
Before discussing the spatial and temporal patterns of the PAPs, we briefly summarise the Holocene history of climate and vegetation in Asia to provide a background for interpreting the PAP patterns.
Holocene climate and vegetation development
Climate
There is considerable debate about the fine-scale patterns and timing of Holocene climate change in Asia. However, there is a general consensus that humid and warmer conditions gradually increased in eastern and central Asia during the early-Holocene due to an increase in temperature and East Asian summer monsoon activity resulting in relatively wet conditions during the mid-Holocene, and a subsequent decline in precipitation (Chen F. et al., 2015, 2019). Trends in temperature follow the general trend of precipitation but a steep increase in temperature trend has been observed over recent centuries (Chen F. et al., 2015). Arid central Asia experienced a cold dry climate during the early-Holocene, and possibly warmer climate conditions during the mid- to late-Holocene (Wang and Feng, 2013; Chen F. et al., 2019). Pollen-based climatic reconstructions for the Tibetan Plateau indicate progressively warmer and wetter conditions in the early- to mid-Holocene and a general trend of cooling and drying toward the present (Herzschuh et al., 2006; Chen et al., 2020; Sun and Feng, 2021). The Indian subcontinent experienced a rising trend in temperature and Indian summer monsoon rainfall during the early- to mid-Holocene. However, this trend was punctuated by a global cooling event around 8,000 cal year BP. Climate started to shift from warm humid to cool arid from the mid-Holocene and reached an arid phase during the late-Holocene (Laskar and Bohra, 2021). Inferences on palaeoclimate from various proxies (such as fossil pollen, diatom, and bio-chemical data) suggest that the early-Holocene in south-west Asia was characterised by dry and warm conditions, whereas the mid-Holocene was wetter and colder, and the late-Holocene was drier and warmer (Litt et al., 2012; Cheng et al., 2015). However, some regional palynological studies infer relatively humid conditions in the eastern Mediterranean region during and Levant the early-Holocene (e.g., Cheddadi and Rossignol-Strick, 1995; Kadosh et al., 2004; Langgut et al., 2011). This may be due to an extension of the monsoonal climate system combining with the Mediterranean climate system (Rossignol-Strick, 1985; Rossignol-strick, 1999; Langgut, 2018), where as only the latter now influences the present climate. Historically, Siberian climate varied broadly, being both warmer and colder than the present. However, during the past century, it became much warmer and winter precipitation north of 55° N increased (Groisman et al., 2013). The early-Holocene in Siberia was characterised by a warmer and wetter climate resulting in a change from severe continental climatic conditions to a milder climate. However, during this period, cooling was noted in southern Siberia. The thermal maximum was most strongly expressed in Siberia during the mid-Holocene, when conditions were warmer and wetter than the twentieth century climate (Monserud et al., 1995). The late-Holocene was characterised by dry and cool conditions, especially in western Siberia (Karpenko, 2006). Most of the present-day Siberian vegetation and ecosystems started to develop after ca. 3,000 cal year BP, when climatic conditions started to become cooler and drier.
Vegetation development
In this section we summarise the modern vegetation and the Holocene vegetation development of the major areas in Asia from where pollen-stratigraphical data are used in our analyses. Southern Asia is not discussed because of a lack of any available palynological data. A summary of the area’s vegetation and its vegetation history is given in the Supplementary Material 1.
Eastern Asia
Natural vegetation here today changes from a moist coastal-forest zone to steppe/desert, following the south-east – north-west precipitation gradient. Main vegetation types are broad-leaved, deciduous, and boreal coniferous forests. Alpine vegetation on the Tibetan Plateau consisting of montane forest, high meadow, steppe, semi-desert, and desert follows the south-east to north-west gradient of decreasing precipitation (Hou, 2001; Cao et al., 2015). During the early-Holocene, tropical and subtropical regions were colonised by thermophilous broad-leaved forest (dominant taxa Castanea, Castanopsis, Cyclobalanopsis, Fagus, Pterocarya, etc.). Forest expanded westward and achieved its maximum distribution and abundance during the early- or mid-Holocene, reflecting optimal regional conditions (Cao et al., 2015). Forest declined from the mid- to late-Holocene, probably in response to changes in regional climate and land-use (Gong et al., 2007; Fuller and Qin, 2010). Mixed broad-leaved forest (dominant taxa Juglans, Quercus, Tilia, Ulmus, etc.) was confined to the southern parts of eastern Asia and extended northward and increased in abundance during the early- to mid-Holocene. However, during the mid- to late-Holocene, mixed vegetation declined, and conifer taxa such as Abies, Picea, and Pinus increased in response to changes in regional climate, especially the weakening of the summer monsoon.
On the north-eastern border of the Tibetan Plateau, Picea together with Betula flourished during the early- to mid-Holocene, in response to increasingly humid conditions. However, Betula and Picea forests decreased regionally as conditions became drier during the mid- to late-Holocene and forest was replaced by alpine steppe vegetation (Herzschuh et al., 2010). Alpine steppe on the central and eastern Tibetan Plateau was relatively stable throughout the Holocene, with a gradual replacement of temperate steppe by high-alpine meadows during the mid- to late-Holocene. The northern and western parts were dominated by temperate desert through the Holocene (Herzschuh et al., 2010).
Central Asia
Vegetation here consists of Irano-Turanian and Central-Asiatic floristic elements. The predominant ecosystems are desert, semi-desert, and steppe (Zhang Y. et al., 2020). The gravel-desert flora typically includes taxa in the genera Anabasis, Atraphaxis, Caragana, Halolachne, Salsola, and Seriphidium. Arid ecosystems prevail at low elevations and in the foothills. Grassland, shrub, and forest are widespread at mid-altitudes on mountain slopes. Meadow and tundra-like ecosystems are found at high elevations. Abies and Betula forests occur mainly in the Tian Shan Mountains, whereas old-growth Juniperus forests are more common in the Pamir-Altai Mountains. Patches of riverine woodland with Elaeagnus, Halostachys, Populus euphratica, Tamarix, and Ulmus occur along rivers and lake shores. Most of the area in the south and south-west is sandy desert, changing to steppe vegetation in the east. In the north, forests form a transition zone between Siberian taiga forest and central Asian steppe. Major elements of the taiga forest are Betula, Larix sibirica, Pinus sibirica, and Pinus sylvestris (Zhang Y. et al., 2020).
In lowland regions during the early-Holocene, there was low forest cover and a high representation of drought-tolerant species compared to the mid-Holocene. Forest in general increased after the mid-Holocene in the low-elevation basins and plains due to increased humidity (Huang et al., 2018; Zhang Y. et al., 2020). High-elevation valleys in the Altai were dominated by meadow-steppe vegetation during the early-Holocene, which was gradually replaced by taiga (dominated by Abies, Juniperus, Picea, and Pinus) from the early- to mid-Holocene. Trees decreased after the mid-Holocene (Blyakharchuk et al., 2007; Huang et al., 2018), and steppe-meadow expanded since the mid-Holocene (Blyakharchuk et al., 2007; Zhang Y. et al., 2020).
South-west Asia (Levant region)
Vegetation here can be broadly grouped into five phytogeographic divisions: Mediterranean, Irano-Turanian, Saharo-Arabian, Sudano-Zambesian, and Euro-Siberian (Schiebel, 2013). Mediterranean vegetation, mainly distributed around the Mediterranean Sea is dominated by oaks (e.g., Quercus calliprinos and Q. ithaburensis), as well as olive (Olea europaea) and pistachio (Pistacia lentiscus) (Schiebel, 2013). Irano-Turanian vegetation in the Asian steppes of the Syrian Desert, Iran, Anatolia in Turkey, and Gobi Desert supports Achillea santolina, Artemisia herba-alba, Thymelaea hirsuta, and several Poaceae and Amaranthaceae taxa. Sudano-Arabian vegetation is distributed in the Sahara, Sinai, and Arabian deserts and is characterised by many Amaranthaceae and Tamarix taxa. Sudano-Zambesian vegetation is mainly distributed in the subtropical savannahs of Africa and in oases along the Jordan Valley. Major taxa include Acacia, Balanites aegyptiaca, and Phoenix dactylifera (Zohary, 1982; Schiebel, 2013). Euro-Siberian vegetation grows mainly in damp habitats, along the Mediterranean coasts, and to the north of Mount Hermon (south-eastern Turkey). This vegetation consists of broad-leaved (Carpinus betulus, Cornus mas, Fagus orientalis, Ilex aquifolium, Quercus, etc.), beech (Fagus, Alnus, Ulmus, etc.), chestnut (Castanea sativa), alder (Alnus barbata), coniferous (Picea orientalis, P. sylvestris, etc.), and dry (Juniperus oxycedrus) forests (Atalay, 1986).
Palynological studies suggest that at the onset of the Holocene, vegetation was dominated by steppe and grasslands with Artemisia and members of the Amaranthaceae, Apiaceae, and Poaceae. This was gradually replaced by open oak-pistachio forest-steppe vegetation and then by forest from the early- to mid-Holocene. Forest vegetation consisted of oaks (Quercus spp.), conifers (Pinus and Abies), and broad-leaved species such as Acer, Alnus, Carpinus, Corylus, Fagus, Pistacia, Tilia, and Ulmus. This forest started to decline from the mid-Holocene and modern vegetation developed during the mid- to late-Holocene (e.g., Van Zeist and Wright, 1963; Wright, 1976; Van Zeist and Bottema, 1991).
Siberia
Siberian vegetation can be summarised in latitudinal vegetation zones (Safronova and Yurkovsksya, 2019). The tundra zone occupies the northern part. High Arctic tundra consists of herb-lichen-moss associations, with Alopecurus magellanicus, Papaver polare, and Saxifraga spp., whereas the central and southern tundra is dominated by low-shrub species such as Arctous alpina, Betula nana, and Cassiope tetragona. The taiga zone extends between ca. 52° N and 72° N latitude, mainly in western and central Siberia. It is dominated by conifers such as Larix gmelinii, L. sibirica, Picea obovata, Pinus sibirica, and P. sylvestris, and with scrub and woodlands of Betula pendula, B. pubescens, Populus tremula, and Salix spp. Almost half of this zone is occupied by mires. The forest-steppe zone occurs south of ca. 56° N in western Siberia and is dominated by birch-aspen (B. pendula and P. tremula) forest. The zone also contains meadow steppes, which are fragmentary and occur only in the southern region of western Siberia.
Pollen studies show that at the onset of the Holocene north-eastern Siberia supported cold and drought-resistant tundra and steppe plant communities with Artemisia, Betula, and members of the Poaceae and Amaranthaceae. Betula and Larix forests occupied flood plains. Warmer, humid climate during the early-Holocene favoured the replacement of tundra–steppe vegetation by spruce and larch forest-tundra with a shrub understory. In north-eastern Siberia, warmer and drier conditions during the early-Holocene also resulted in the spread of Betula nana – Duschekia fruticosa shrub-tundra. In southern Siberia, the Holocene onset is marked by an increase in woody cover in response to significant climate amelioration. In the southern taiga of Siberia, forests of Abies sibirica, Picea obovata, Pinus sibirica, and P. sylvestris spread. In the northern Arctic belt, Betula exilis, Duschekia fruticosa, and Larix dahurica forests dominated the area during the early- to mid-Holocene. After the mid-Holocene, when climate became cooler and drier, afforestation of forest-steppe by cold- and drought-tolerant birch forest, freezing of wet mires in the taiga, and the formation of palsa bogs occurred. During this period, relatively thermophilous Abies forests retreated southward to the position of the present southern taiga, widespread expansion of Pinus sibirica occurred, and forest vegetation retracted from the high mountain areas of the Altai. The late-Holocene is characterised by a continuous cold and dry phase, resulting in a southward retreat of the northern boundary of the forest zone to reach its present position (Blyakharchuk et al., 2007; Blyakharchuk, 2009; Groisman et al., 2013).
Spatial patterns of pollen-compositional turnover and change
We observe considerable variation in total temporal compositional turnover (gradient length) and change (MRT partitions) across the records. However, there is only a gradual latitudinal variation in both the PAPs (Figures 1, 2). Latitudinal variation in compositional change may be primarily due to the south-north gradient of major climatic factors, with southern Asia being warmer and wetter than the northern Siberian region, a pattern that likely persisted through the Holocene (Rohling et al., 2009; Cheng et al., 2015). Temporally consistent higher environmental stress toward the higher latitudes might have resulted in strong environmental filtering in these regions throughout the Holocene, thereby allowing only taxa with specialised environmental niches to coexist. Consequently compositional heterogeneity along the entire temporal gradient (age) of the records from high latitudes was lower than in the records from lower latitudes. Another potential factor for the higher number of MRT partitions in the records from low- to mid-latitudes is anthropogenic land-use change at these latitudes. Low- to mid-latitude regions in Asia, such as the Levant region, eastern China, and south-east Asia were settled extensively by humans in the early- to mid-Holocene who initiated agriculture and livestock farming (e.g., Flenley, 1988; Bottema, 1992; Ren, 2000; Fuller and Qin, 2010; Fuller et al., 2011; Bakker et al., 2012; Huang et al., 2017; Cheng et al., 2018; Whitlam et al., 2018) (see the Holocene climate and vegetation development sections for Levant and central Asia), thereby altering the natural ecosystems in various ways. This may have increased fine-scale habitat heterogeneity over time, and together with relatively mild climate conditions in the regions throughout the Holocene, may have allowed taxa of diverse niches to coexist via increasing dispersal and establishment, thereby increasing overall species heterogeneity. No clear latitudinal trend in compositional variation toward southern Asia may be due to the very low density of records south of ca. 25° N.
Longitudinal variation in compositional turnover (Figure 1) and change (Figure 2) possibly reflects the influence of climatic factors (especially precipitation regimes) and anthropogenic land-use change along the spatial and the temporal gradients. The Mediterranean climate system forms a prominent west-east winter precipitation gradient (Chen F. et al., 2019), where precipitation decreases from the western Levant region (Turkey) to arid central Asia. Moreover, there may also have been temporal variation in the precipitation (moisture) regime in South-western Asia, where environmental conditions were relatively humid during the early-Holocene (e.g., Cheddadi and Rossignol-Strick, 1995; Kadosh et al., 2004; Langgut et al., 2011). However, drier conditions prevailed since the mid-Holocene as the influence of the monsoon climate system faded leaving only the Mediterranean climate system active in the region. South-western Asia (Levant) is the region with one of the oldest human civilisations in Asia (Issar and Zohar, 2004), where agricultural practices most likely started during the early-Holocene with the domestication of important crop plants (Wright, 1968, 1976; Van Zeist, 1976; Bottema, 1992) (see the Holocene climate and vegetation development sections for Levant and central Asia). The higher values of temporal turnover and compositional change probably reflect the anthropogenic modification of the natural ecosystems in this region from the beginning of the Holocene. On the other hand, south-west Asia is reported to have experienced profound climatic variations (especially moisture conditions) during the Holocene, resulting in a significant impact on regional vegetation and human societies (Cullen et al., 2000; Staubwasser and Weiss, 2006; Kaniewski et al., 2013; Langgut et al., 2014; Leipe et al., 2014; Palmisano et al., 2019; Watanabe et al., 2019). Such an interplay of the spatially as well as temporally varying climatic changes and human land-use change probably influenced the spatial variation in vegetation composition in the region. Indeed, we observe higher compositional turnover in areas with higher temporal variation in climate and land-use (variation in habitat heterogeneity) resulting in larger temporal changes in vegetation, whereas lower compositional turnover occurred in areas with consistent environmental stress throughout the period that may have prevented colonisation of species with different ecological niches. Similarly, the south-east – west precipitation gradient formed by the East Asian summer monsoon (Cao et al., 2013), and anthropogenic land-use changes in south-eastern to central Asian region during the Holocene (Ren, 2000; Fuller and Qin, 2010; Fuller et al., 2011; Tan et al., 2015; Cheng et al., 2018) might have influenced the spatio-temporal variation in vegetation composition in the region (see the Holocene climate and vegetation development sections for eastern and central Asia). Hence, a gradual rise in compositional change in the eastern Asian region (Figures 1C, 2C) may be a result of an interaction between regional climate (mostly spatio-temporal variations in precipitation), human land-use changes, and fine-scale ecological processes of successional changes in vegetation in the mid- and low-latitude regions of eastern Asia during the Holocene.
Despite the enormous environmental variation along the latitudinal and longitudinal gradient in Asia during the Holocene, observed variation in total temporal compositional turnover and change along these gradients is lower than that would be expected when dealing with real vegetation. This is probably because pollen analysis is limited by rather crude taxonomic identification and pollen representation, and therefore the actual magnitude of change is difficult to infer. There is low temporal variation in the composition of the most frequent pollen-types (∼ major taxa or vegetation types) identified from the records. Compositional variation of less frequent pollen- or vegetation-types may not be represented well in sediments and hence is masked by the counts of the numerically dominant pollen-types. Moreover, there is considerable inconsistency in the nomenclature of pollen taxa (morpho-types) in the raw records, and therefore nomenclature of the pollen taxa is, by necessity, standardised to the taxonomically most robust pollen morpho-types identified by most palynologists. This is broadly equivalent to the plant family level. Hence, variations occurring at finer taxonomic levels (species and/or genus) are aggregated to a higher taxonomic level and thus only major ecological changes at a higher level are revealed in a synthetic study.
Cross-scale patterns of pollen-assemblage composition and diversity estimates
We observe considerable variation in the temporal patterns of the PAPs across the spatial scales of analyses. Finer-scale spatio-temporal variations in PAPs are mostly observed at the scale of individual records, likely in response to fine-scale climatic variations, land-use change, various disturbance events, and site-conditions. Consequently, there is enormous variation in the record-scale temporal patterns of all PAPs, and when these patterns are plotted together, a gradual common pattern exhibited by most of the records is potentially biased by the extreme patterns of a few records formed by extremely high or low values of PAP estimates along the Y-axis of the diagrams (Figures 4, 5, “record”). However, these become smoothed as we aggregate the records within climate-zones because PAP estimates of most of the records in each climate-zone consistently exhibit only the major temporal pattern in response to the major underlying drivers, which also hold true for the continent-scale patterns.
Taxonomic richness, diversity, and evenness
Rather heterogeneous temporal variation in the observed record-scale patterns of Hill’s indices (richness, diversity, and evenness) suggests a lack of synchronicity in the patterns (see above) (Figure 4, “N0, N1, N2, N2/N1, N1/N0: record”). However, when we aggregate the estimates of records into different climate-zones and the whole continent, record-specific spatio-temporal variations are averaged or smoothed slightly, and only the minimal general temporal pattern exhibited by the majority of the records in each aggregation are observed.
Temporal patterns of Hill’s indices at the level of climate-zone (Figure 4) are likely to reflect the broad-scale vegetation successional development in response to climatic (temperature and precipitation) and human land-use drivers during the Holocene (see above). Mostly, major expansion in forest biomes at the onset of the Holocene (Cao et al., 2019a,b) driven by climate change (progressively developed warmer and humid conditions) (see the Holocene climate and vegetation development sections for eastern and central Asia) may have resulted in a reduced taxon (∼ pollen) richness (N0) from the early- to mid-Holocene. A progressive cooling and drying in most parts of the continent during the mid-Holocene resulted in a marked decline in forests with a southward retreat of the forests at higher latitudes, retreat of scrub from arid central Asia, and a decline of total vegetation in subtropical Asia during the period (Cao et al., 2019a,b; Dallmeyer et al., 2021). Monodominant coniferous forests that developed during the early- to mid-Holocene in most of the climate-zones might also have negatively altered habitat conditions (increased aridity, formation of acidic soil, etc.) for the development of understorey (shrub and herb) plant diversity. Extensive anthropogenic land-use change in, for example, eastern (Ren, 2000; Li et al., 2009; Cheng et al., 2018) and south-west (e.g., Bakker et al., 2012) Asia (see the Holocene climate and vegetation development sections for eastern, central, and south-west Asia) might also have amplified the decrease in vegetation cover as well as taxon richness (Hill’s N0) during the early- to mid-Holocene. However, the decrease in forest cover and subsequent increase in scrub and grasslands in some of the climate-zones (e.g., “Cold without dry season,” “Arid” zones) during the mid- to late-Holocene, may be a reflection of habitat diversification via changes in regional climate and anthropogenic disturbance regimes (grazing, fire, logging, agricultural activities, etc.). These resulted in a greater variety of habitats, including meadow development, thus increasing pollen diversity. This continent-scale temporal pattern of Hill’s N0 is almost similar to the temporal pattern of plant taxa richness documented by a recent sedimentary-DNA based study from the Tibetan Plateau (Liu et al., 2021), which assigns the observed pattern to changes in regional climatic conditions and anthropogenic disturbances, especially livestock grazing. Consequently, the number of equally abundant taxa in the vegetation and thus in the pollen rain may have increased slightly from the early-Holocene to the present, resulting in a gradual temporal increase in Hill’s diversity estimates in the majority of climate-zones (Figure 4, “N1 and N2: climate-zone”). Abundance, and hence evenness, of forest or other major woody taxa was possibly maximal during the early- to mid-Holocene in response to progressively warmer and humid climatic conditions (see the Holocene climate and vegetation development section). However, as the regional climate started to become cooler and/or drier, and human pressure on the landscapes increased, dominant forest taxa in many of the climate-zones decreased resulting in a gradual decrease in evenness estimates from the mid- to late-Holocene (Figure 4, N2 divided by N1 and N1 divided by N0: “climate-zone”).
Pollen richness (N0) and diversity (N1 and N2) in the “Temperate zone” (Figure 4, “N0, N1, and N2: climate-zone”) show small but an opposite temporal trends. Optimal climate conditions for forest development in the present “Temperate” climate-zone (Asian monsoon climate-zone) that developed during the early- to mid-Holocene (see the Holocene climate and vegetation development section for the eastern Asia) favoured the expansion of broad-leaved forests and resulted in a significant reduction of arid vegetation (Yu et al., 2000; Ren, 2007; Zhao et al., 2009; Cao et al., 2015; Tian et al., 2016). A gradual replacement of steppe and steppe-savanna in the current Temperate zone by broad-leaved forests might have enhanced taxa richness as well as diversity initially. However, as the dense broad-leaved forests reached their mature stage, canopy closure may have resulted in unfavourable conditions for shade-intolerant understorey vegetation. Subsequently, changes in regional climatic conditions and increasing human land-use during the mid- to late-Holocene caused a decline in forests (Gong et al., 2007; Fuller and Qin, 2010), and may have negatively impacted richness and diversity of major forest taxa in this climate-zone.
The “Cold without dry season” climate-zone is represented by boreal vegetation, the temporal dynamics of which were likely driven by climatic changes. Pollen studies show that during the onset of the Holocene much of this zone was covered by cold, drought-resistant tundra and steppe plant communities with dwarf Betula, Artemisia, and members of the Poaceae and Amaranthaceae (Groisman et al., 2013). A warmer and humid climate during the early-Holocene favoured the replacement of tundra–steppe vegetation by forest mainly dominated by Abies, Larix, Picea, Pinus, etc., which negatively impacted the diversity of the less dominant herbaceous and shrub taxa. The climate progressively became cooler and drier after the mid-Holocene which caused the southward retreat of the relatively thermophilous coniferous forests (see the Holocene climate and vegetation development section for Siberia, and central and eastern Asia). This would have favoured the development of steppe, tundra, and meadow vegetation with a higher diversity of herbaceous and shrub taxa, thus explaining the climate-zone level temporal pattern of N1 and N2 observed in Figure 4 (“N1 and N2: climate-zone”). Continental-scale temporal patterns in Hill’s richness, diversity, and evenness estimates generally reflect the trends revealed in majority of the climate-zones (Figure 4, “N0, N1, N2, N2 divided by N1, and N1 divided by N0: continent”).
Pollen-compositional turnover and change
The higher heterogeneity in the temporal patterns of turnover at the record level (Figure 4, “DCCA1: record”), but slightly smoothed and more pronounced DCCA1 temporal patterns at the climate-zone- and continent-scales (Figure 4, “DCCA1: record and continent”), are likely a response to major underlying drivers (see above for possible explanations). However, of the temporal patterns analysed, those of temporal compositional turnover are relatively more consistent across the spatial scales of analysis. This indicates that pollen-compositional turnover has changed substantially and consistently from the beginning of the Holocene to the present throughout the whole of Asia. Based on studies on vegetation and climate history in Asia (see the Holocene climate and vegetation development section), this pattern suggests that temporal changes in turnover followed the major temporal climatic gradient of the Holocene at the continental scale, i.e., becoming progressively cooler and drier from the early- to late-Holocene (see the Holocene climate and vegetation development section for details). Progressively increasing environmental stress from the early- to late-Holocene probably increased environmental filtering in the regional assemblages, resulting in compositionally homogenous assemblages temporally. As a result, sample-to-sample compositional dissimilarity (turnover) decreased temporally throughout the analysed records. Broadly consistent with this trend, distributional as well as compositional changes in Holocene vegetation throughout the continent in response to temporal changes in climate have also been documented by recent broad-scale studies (e.g., Cao et al., 2019a,b; Herzschuh et al., 2019; Dallmeyer et al., 2021).
Rate of pollen-compositional change
Rates of pollen-compositional change vary along the temporal gradient of Holocene as well as across the spatial scales (Figure 4, “RoC”). Lack of a general temporal pattern in the RoC estimates at the record level is likely due to the heterogeneous record-specific patterns (see above for possible explanations). However, at the climate-zone scale (Figure 4, “RoC: climate-zone”), a general pattern of slightly gradually declining RoC from the early-Holocene to the present is detectable. The Holocene-wide pattern of RoC in Asia is partly consistent with the global as well as continental RoC patterns presented by Mottl et al. (2021a), despite the fact that the spatial density of the analysed records and the length of temporal gradient in our study differ from those used by Mottl et al. (2021a). However, in contrast to the increasing late-Holocene RoC pattern in Asia revealed by Mottl et al. (2021a), our study reveals a gradually linear-decreasing pattern of RoC in most of the climate-zones during the mid-Holocene to the present time. A pronounced rise in RoC in the “Temperate” climate-zone during the early- to mid-Holocene may be linked to climate change-driven vegetation changes in the region during the period (see the Holocene climate and vegetation development section for eastern Asia). Overall, a linear decline in RoC at the “climate-zone” scale is possibly driven by temporal variation in major regional climate and land-use changes during the Holocene, while an influence of shorter-term climatic fluctuations remains undetected in the RoC estimates at coarser spatial scales (see above for possible explanations). However, progressively increased aridity accompanied by divergent temporal temperature and land-use conditions in the different parts of “Arid” climate-zone in Asia, especially from the mid- to late-Holocene (see the Holocene climate and vegetation development section for south-west and central Asia), might have contributed to the temporal increase in RoC in the region (Figure 4, “RoC: climate-zone”).
Major temporal changes in the pollen-assemblage properties
Temporal patterns of major changes in PAPs (density of RT and MRT change-points), especially DCCA1, MRT, and RoC, are broadly consistent across spatial scales as well as across the PAPs (Figure 5). An increase in the density of RT change-points for all PAPs from the early- to mid-Holocene, especially evident at the spatial scales of “climate-zone” and “continent,” implies that the greatest change in assemblage properties in all climate-zones was during the early- to mid-Holocene (12,000 to ca. 5,000–7,000 cal year BP), probably in response to major temporal changes in climate, as suggested by the previous broad-scale studies from the region (Cao et al., 2019a,b). Fewer samples (less data) for the early-Holocene period may be another potential reason for the pattern (Supplementary Figure 1). From the mid-Holocene to recent times, temporal changes in PAPs are slightly less consistent across the spatial scales as well as across the properties (Figure 5, “climate-zone,” “continent”). These patterns most likely indicate an influence of multiple interacting factors operating at various spatial and temporal scales, such as changes in climatic (e.g., Liu and Feng, 2012; Leipe et al., 2014; Gurjazkaite et al., 2018; Watanabe et al., 2019), and land-use changes including agriculture, fire, and livestock grazing, especially in the “Arid” (central and south-west Asia) and “Temperate” (eastern and south-east Asia) zones (e.g., Ren, 2000; Li et al., 2009; Fuller and Qin, 2010; Fuller et al., 2011; Bakker et al., 2012; Bhagwat et al., 2014; Chen F. H. et al., 2015; Tan et al., 2015; Huang et al., 2017; Cheng et al., 2018), combined with changes in local site conditions (see above). However, in general, a decrease in the density of RT and MRT change-points during the most recent period of the late-Holocene (ca. 0 to 3,000 cal year BP) (Figure 5, “climate-zone,” “continent”) indicates that pollen assemblages and thus vegetation might have become more homogeneous during recent times, most likely in response to anthropogenic disturbances, as proposed by previous broad-scale studies (e.g., Daru et al., 2021).
Conclusion
In our study, many of the PAPs revealed marked variation across space and time, responding to spatio-temporal changes in regional environmental conditions and land-use. Weakly pronounced spatial patterns and high heterogeneity in the temporal patterns across the records indicate the influence of fine-scale (record-specific) environmental drivers, site-conditions, and conservative data processing and standardisation procedures. Generally decreasing temporal trends in the major PAPs of compositional change (DCCA1, RoC, and MRT) at coarser spatial scales indicate that there may have been an overall gradual decline in pollen- (∼ vegetation) compositional heterogeneity, especially during the most recent period of the late-Holocene. This implies that vegetation in many regions across Asia has become more homogenous during recent time. However, some of the observed patterns in PAPs have possibly revealed potential sensitivity to the density of high-quality pollen-data with uniform temporal resolution and data-standardisation procedures as well as the numerical approaches applied to summarise the PAPs.
Pollen-assemblage properties are “hidden” features within pollen-stratigraphic data. Exploration of the cross-scale spatial and temporal patterns in PAP throughout a continent is a novel and challenging approach and is potentially useful for summarising ecological features of pollen assemblages over time and space. Otherwise, qualitative studies of spatio-temporal variation in pollen-vegetation at the continent scale would require large numbers of pollen diagrams, maps, and taxon distribution models and it can become difficult to comprehend and interpret all the observed patterns. An ecological summary based on PAP analysis could be used to evaluate hypotheses of past vegetation and landscape dynamics using causational hypothesis-testing approaches. Multivariate analyses (e.g., ordinations) of pollen data or assessment of the spatio-temporal patterns of only selected taxa over a wide geographic extent with a large variation in climate, geography, and human-landscape interactions do not fully meet this objective. A future line of investigation could be to study PAPs over smaller areas such as climate or vegetation zones or areas with consistent amounts of human activity.
In future, our approach to spatio-temporal analysis of PAPs could be extended to other fields of palaeoecology, such as evolutionary palaeoecology to study the variation of pollen-based functional and phylogenetic diversity of co-occurring pollen-taxa at different temporal and spatial scales, and in biogeographical palaeoecology for comparing spatio-temporal patterns of PAPs in different phytogeographical areas or continents and in smaller selected areas. As this study highlights, PAP estimates vary considerably in both space and time. Resolving the causes of this variation is a challenge for future research.
Data availability statement
The majority of the datasets used in this study can be obtained via open-access resources: PANGAEA – Data Publisher for Earth and Environmental Science and Neotoma Paleoecology Database. However, 63 datasets (dataset_id starts with “PVT”, see Supplementary Table 1) are obtained from data contributors and therefore, can only be obtained from data contributors. PAP estimates and R script used for data analyses, and visualization are available at GitHub (https://github.com/HOPE-UIB-BIO/Asian_palynological_synthesis). The original contributions presented in this study are included in the article/Supplementary material, further inquiries can be directed to the corresponding author.
Author contributions
KB: conception, data acquisition and assembly, data processing and analysis, and manuscript writing. OM: data processing, statistical analyses, visualisations, and manuscript reviewing. VF, SF, J-AG, and AS: data processing and manuscript reviewing. HHB: manuscript revision and editing, and overall support to the team. XC and FC: data acquisition, and manuscript reviewing and commenting. HJB: conception, data acquisition and pollen harmonisation, manuscript reviewing and editing, and funding. All authors contributed to the article and approved the submitted version.
Funding
KB, HHB, OM, VF, J-AG, AS, and SF were supported by the European Research Council (ERC) under the European Union’s Horizon 2020 Research and Innovation Programme (grant agreement no. 741413) HOPE Humans on Planet Earth – long-term impacts on biosphere dynamics awarded to HJB. This publication is a contribution to the HOPE project.
Acknowledgments
We are grateful to Ole R. Vetaas for providing valuable feedback during data processing, analysis, and manuscript writing. We are indebted to the many colleagues who have provided data directly or indirectly via their publications. Most of the data were obtained from the Neotoma Paleoecology Database (http://www.neotomadb.org) and PANGAEA® – Data Publisher for Earth and Environmental Science Database (https://www.pangaea.de/). The work of data contributors, data stewards, and the Neotoma and Pangaea communities is gratefully acknowledged. We also appreciate the valuable comments from the reviewers. We thank Shonil Bhagwat, Jianhui Chen, and Feiya Lv for the data contribution.
Conflict of interest
The authors declare that the research was conducted in the absence of any commercial or financial relationships that could be construed as a potential conflict of interest.
Publisher’s note
All claims expressed in this article are solely those of the authors and do not necessarily represent those of their affiliated organizations, or those of the publisher, the editors and the reviewers. Any product that may be evaluated in this article, or claim that may be made by its manufacturer, is not guaranteed or endorsed by the publisher.
Supplementary material
The Supplementary Material for this article can be found online at: https://www.frontiersin.org/articles/10.3389/fevo.2023.1115784/full#supplementary-material
Footnotes
- ^ http://www.europeanpollendatabase.net/
- ^ www.neotomadb.org
- ^ https://www.pangaea.de/
- ^ https://github.com/HOPE-UIB-BIO/R-Ecopol-package
References
Atalay, I. (1986). Vegetation formations of Turkey. Trav. Inst. Geogr. Reims 65–66, 17–30. doi: 10.3406/tigr.1986.1183
Bakker, J., Paulissen, E., Kaniewski, D., De Laet, V., Verstraeten, G., and Waelkens, M. (2012). Man, vegetation and climate during the Holocene in the territory of Sagalassos, Western Taurus mountains, SW Turkey. Veg. Hist. Archaeobot. 21, 249–266. doi: 10.1007/s00334-011-0312-4
Beck, H. E., Zimmermann, N. E., McVicar, T. R., Vergopolan, N., Berg, A., and Wood, E. F. (2018). Present and future Köppen-geiger climate classification maps at 1-km resolution. Sci. Data 5:180214. doi: 10.1038/sdata.2018.214
Bhagwat, S. A., Nogué, S., and Willis, K. J. (2014). Cultural drivers of reforestation in tropical forest groves of the Western Ghats of India. For. Ecol. Manag. 329, 393–400. doi: 10.1016/j.foreco.2013.11.017
Birks, H. H. (1994). Late-glacial vegetational ecotones and climatic patterns in Western Norway. Veg. Hist. Archaeobot. 3, 107–119. doi: 10.1007/BF00189930
Birks, H. J. B. (2007). Estimating the amount of compositional change in late-quaternary pollen-stratigraphical data. Veg. Hist. Archaeobot. 16, 197–202. doi: 10.1007/s00334-006-0079-1
Birks, H. J. B. (2012). “Analysis of stratigraphical data,” in Tracking Environmental Change using Lake Sediments, Volume 5: Data Handling and Numerical Techniques, eds H. J. B. Birks, A. F. Lotter, S. Juggins, and J. P. Smol (Dordrecht: Springer), 355–378. doi: 10.1007/978-94-007-2745-8_11
Birks, H. J. B. (2019). Contributions of quaternary botany to modern ecology and biogeography. Plant Ecol. Divers. 12, 189–385. doi: 10.1080/17550874.2019.1646831
Birks, H. J. B., Felde, V. A., Bjune, A. E., Grytnes, J.-A., Seppä, H., and Giesecke, T. (2016a). Does pollen-assemblage richness reflect floristic richness? a review of recent developments and future challenges. Rev. Palaeobot. Palynol. 228, 1–25. doi: 10.1016/j.revpalbo.2015.12.011
Birks, H. J. B., Felde, V. A., and Seddon, A. W. R. (2016b). Biodiversity trends within the Holocene. Holocene 26, 994–1001. doi: 10.1177/0959683615622568
Birks, H. J. B., and Gordon, A. (1985). Numerical Methods in Quaternary Pollen Analysis. London: Academic Press.
Birks, H. J. B., Lotter, A. F., Juggins, S., and Smol, J. P. (eds). (2012). Tracking Environmental Change using Lake Sediments, Volume 5: Data Handling and Numerical Techniques. Dordrecht: Springer. doi: 10.1007/978-94-007-2745-8
Blyakharchuk, T. A. (2009). Western Siberia, a review of Holocene climatic changes. J. Siberian Federal Univ. Biol. 2, 4–12. doi: 10.17516/1997-1389-0244
Blyakharchuk, T. A., Wright, H. E., Borodavko, P. S., van der Knaap, W. O., and Ammann, B. (2007). Late Glacial and Holocene vegetational history of the Altai mountains (southwestern Tuva Republic, Siberia). Palaeogeogr. Palaeoclimatol. Palaeoecol. 245, 518–534. doi: 10.1016/j.palaeo.2006.09.010
Bottema, S. (1992). Prehistoric cereal gathering and farming in the near east: the pollen evidence. Rev. Palaeobot. Palynol. 73, 21–33. doi: 10.1016/0034-6667(92)90042-F
Breiman, L., Friedman, J. H., Olshen, R. A., and Stone, C. G. (1984). Classification and Regression Trees. Belmont, CA: Wadsworth Inter-national Group.
Cao, X., Herzschuh, U., Ni, J., Zhao, Y., and Böhmer, T. (2015). Spatial and temporal distributions of major tree taxa in eastern continental Asia during the last 22,000 years. Holocene 25, 79–91. doi: 10.1177/0959683614556385
Cao, X., Ni, J., Herzschuh, U., Wang, Y., and Zhao, Y. (2013). A late Quaternary pollen dataset from eastern continental Asia for vegetation and climate reconstructions: set up and evaluation. Rev. Palaeobot. Palynol. 194, 21–37. doi: 10.1016/j.revpalbo.2013.02.003
Cao, X., Tian, F., Andreev, A., Anderson, P. M., Lozhkin, A. V., Bezrukova, E., et al. (2020). A taxonomically harmonized and temporally standardized fossil pollen dataset from Siberia covering the last 40 kyr. Earth Syst. Sci. Data 12, 119–135. doi: 10.5194/essd-12-119-2020
Cao, X., Tian, F., Dallmeyer, A., and Herzschuh, U. (2019a). Northern Hemisphere biome changes (>30°N) since 40 cal ka BP and their driving factors inferred from model-data comparisons. Quat. Sci. Rev. 220, 291–309. doi: 10.1016/j.quascirev.2019.07.034
Cao, X., Tian, F., Li, F., Gaillard, M.-J., Rudaya, N., Xu, Q., et al. (2019b). Pollen-based quantitative land-cover reconstruction for northern Asia covering the last 40 ka cal BP. Clim. Past 15, 1503–1536. doi: 10.5194/cp-15-1503-2019
Chao, A., Gotelli, N. J., Hsieh, T. C., Sander, E. L., Ma, K. H., Colwell, R. K., et al. (2014). Rarefaction and extrapolation with hill numbers: a framework for sampling and estimation in species diversity studies. Ecol. Monogr. 84, 45–67. doi: 10.1890/13-0133.1
Cheddadi, R., and Rossignol-Strick, M. (1995). Eastern mediterranean quaternary paleoclimates from pollen and isotope records of marine cores in the Nile Cone area. Paleoceanography 10, 291–300. doi: 10.1029/94PA02672
Chen, F., Chen, J., Huang, W., Chen, S., Huang, X., Jin, L., et al. (2019). Westerlies Asia and monsoonal Asia: spatiotemporal differences in climate change and possible mechanisms on decadal to sub-orbital timescales. Earth Sci. Rev. 192, 337–354. doi: 10.1016/j.earscirev.2019.03.005
Chen, F., Zhang, J., Liu, J., Cao, X., Hou, J., Zhu, L., et al. (2020). Climate change, vegetation history, and landscape responses on the Tibetan Plateau during the Holocene: a comprehensive review. Quat. Sci. Rev. 243:106444. doi: 10.1016/j.quascirev.2020.106444
Chen, F. H., Dong, G. H., Zhang, D. J., Liu, X. Y., Jia, X., An, C. B., et al. (2015). Agriculture facilitated permanent human occupation of the Tibetan Plateau after 3600 B.P. Science 347, 248–250. doi: 10.1126/science.1259172
Chen, F., Xu, Q., Chen, J., Birks, H. J. B., Liu, J., Zhang, S., et al. (2015). East Asian summer monsoon precipitation variability since the last deglaciation. Sci. Rep. 5, 1–11. doi: 10.1038/srep11186
Cheng, H., Sinha, A., Verheyden, S., Nader, F. H., Li, X. L., Zhang, P. Z., et al. (2015). The climate variability in northern Levant over the past 20,000 years. Geophys. Res. Lett. 42, 8641–8650. doi: 10.1002/2015GL065397
Cheng, Z., Weng, C., Steinke, S., and Mohtadi, M. (2018). Anthropogenic modification of vegetated landscapes in southern China from 6,000 years ago. Nat. Geosci. 11, 939–943. doi: 10.1038/s41561-018-0250-1
Chevalier, M., Davis, B. A. S., Heiri, O., Seppä, H., Chase, B. M., Gajewski, K., et al. (2020). Pollen-based climate reconstruction techniques for late quaternary studies. Earth Sci. Rev. 210:103384. doi: 10.1016/j.earscirev.2020.103384
Cullen, H. M., De Menocal, P. B., Hemming, S., Brown, F. H., Guilderson, T., and Sirocko, F. (2000). Climate change and the collapse of the Akkadian empire: evidence from the deep sea. Geology 28, 379–382. doi: 10.1130/0091-7613(2000)28<379:CCATCO>2.0.CO;2
Dallmeyer, A., Claussen, M., Lorenz, S. J., Sigl, M., Toohey, M., and Herzschuh, U. (2021). Holocene vegetation transitions and their climatic drivers in MPI-ESM1.2. Clim. Past 17, 2481–2513. doi: 10.5194/cp-17-2481-2021
Daru, B. H., Davies, T. J., Willis, C. G., Meineke, E. K., Ronk, A., Zobel, M., et al. (2021). Widespread homogenization of plant communities in the Anthropocene. Nat. Commun. 12:6983. doi: 10.1038/s41467-021-27186-8
De’ath, G. (2002). Multivariate regression trees: a new technique for modelling species-environment relationships. Ecology 83, 1105–1117. doi: 10.1890/0012-9658(2002)083[1105:MRTANT]2.0.CO;2
De’ath, G. (2007). Boosted trees for ecological modeling and prediction. Ecology 88, 243–251. doi: 10.1890/0012-9658(2007)88[243:BTFEMA]2.0.CO;2
Divíšek, J., Hájek, M., Jamrichová, E., Petr, L., Večeřa, M., Tichý, L., et al. (2020). Holocene matters: landscape history accounts for current species richness of vascular plants in forests and grasslands of eastern Central Europe. J. Biogeogr. 47, 721–735. doi: 10.1111/jbi.13787
Ellis, E. C., Gauthier, N., Klein Goldewijk, K., Bliege Bird, R., Boivin, N., Díaz, S., et al. (2021). People have shaped most of terrestrial nature for at least 12,000 years. Proc. Natl. Acad. Sci. 118:e2023483118. doi: 10.1073/pnas.2023483118
Felde, V. A., Flantua, S. G. A., Jenks, C. R., Benito, B. M., de Beaulieu, J.-L., Kuneš, P., et al. (2020). Compositional turnover and variation in Eemian pollen sequences in Europe. Veg. Hist. Archaeobot. 29, 101–109. doi: 10.1007/s00334-019-00726-5
Felde, V. A., Hooghiemstra, H., Torres-Torres, V., and Birks, H. J. B. (2016). Detecting patterns of change in a long pollen-stratigraphical sequence from Funza, Colombia – a comparison of new and traditional numerical approaches. Rev. Palaeobot. Palynol. 234, 94–109. doi: 10.1016/j.revpalbo.2016.08.003
Flenley, J. R. (1988). Palynological evidence for land use changes in south-east asia. J. Biogeogr. 15, 185–197. doi: 10.2307/2845059
Fordham, D. A., Jackson, S. T., Brown, S. C., Huntley, B., Brook, B. W., Dahl-Jensen, D., et al. (2020). Using paleo-archives to safeguard biodiversity under climate change. Science 369:eabc5654. doi: 10.1126/science.abc5654
Fuller, D. Q., and Qin, L. (2010). Declining oaks, increasing artistry, and cultivating rice: the environmental and social context of the emergence of farming in the lower yangtze region. Environ. Archaeol. 15, 139–159. doi: 10.1179/146141010X12640787648531
Fuller, D. Q., van Etten, J., Manning, K., Castillo, C., Kingwell-Banham, E., Weisskopf, A., et al. (2011). The contribution of rice agriculture and livestock pastoralism to prehistoric methane levels: an archaeological assessment. Holocene 21, 743–759. doi: 10.1177/0959683611398052
Fyfe, R. M., Woodbridge, J., and Roberts, N. (2015). From forest to farmland: pollen-inferred land cover change across Europe using the pseudobiomization approach. Glob. Chang. Biol. 21, 1197–1212. doi: 10.1111/gcb.12776
Giesecke, T., Davis, B., Brewer, S., Finsinger, W., Wolters, S., Blaauw, M., et al. (2014). Towards mapping the late quaternary vegetation change of Europe. Veg. Hist. Archaeobot. 23, 75–86. doi: 10.1007/s00334-012-0390-y
Gong, D. Y., and Ho, C. H. (2002). The Siberian high and climate change over middle to high latitude Asia. Theor. Appl. Climatol. 72, 1–9. doi: 10.1007/s007040200008
Gong, Z., Chen, H., Yuan, D., Zhao, Y., Wu, Y., and Zhang, G. (2007). The temporal and spatial distribution of ancient rice in China and its implications. Chin. Sci. Bull. 52, 1071–1079. doi: 10.1007/s11434-007-0130-3
Groisman, P. Y., Blyakharchuk, T. A., Chernokulsky, A. V., Arzhanov, M. M., Marchesini, L. B., Bogdanova, E. G., et al. (2013). “Climate changes in Siberia,” in Regional Environmental Changes in Siberia and Their Global Consequences, eds P. Y. Groisman and G. Gutman (Dordrecht: Springer), 57–109. doi: 10.1007/978-94-007-4569-8_3
Gurjazkaite, K., Routh, J., Djamali, M., Vaezi, A., Poher, Y., Beni, A. N., et al. (2018). Vegetation history and human-environment interactions through the late Holocene in Konar Sandal. SE Iran. Quat. Sci. Rev. 194, 143–155. doi: 10.1016/j.quascirev.2018.06.026
Haslett, J., and Parnell, A. (2008). A simple monotone process with application to radiocarbon-dated depth chronologies. J. R. Stat. Soc. Ser. C Appl. Stat. 57, 399–418. doi: 10.1111/j.1467-9876.2008.00623.x
Herzschuh, U., Birks, H. J. B., Ni, J., Zhao, Y., Liu, H., Liu, X., et al. (2010). Holocene land-cover changes on the Tibetan Plateau. Holocene 20, 91–104. doi: 10.1177/0959683609348882
Herzschuh, U., Cao, X., Laepple, T., Dallmeyer, A., Telford, R. J., Ni, J., et al. (2019). Position and orientation of the westerly jet determined Holocene rainfall patterns in China. Nat. Commun. 10:2376. doi: 10.1038/s41467-019-09866-8
Herzschuh, U., Winter, K., Wünnemann, B., and Li, S. (2006). A general cooling trend on the central Tibetan Plateau throughout the Holocene recorded by the Lake Zigetang pollen spectra. Quat. Int. 154–155, 113–121. doi: 10.1016/j.quaint.2006.02.005
Hill, M. O. (1973). Diversity and evenness: a unifying notation and its consequences. Ecology 54, 427–432. doi: 10.2307/1934352
Hill, M. O., and Gauch, H. G. (1980). Detrended correspondence analysis, an improved ordination technique. Vegetatio 42, 47–58. doi: 10.1007/BF00048870
Hogg, A. G., Heaton, T. J., Hua, Q., Palmer, J. G., Turney, C. S. M., Southon, J., et al. (2020). SHCal20 southern hemisphere calibration, 0-55,000 years cal BP. Radiocarbon 62, 759–778. doi: 10.1017/RDC.2020.59
Huang, X., Liu, S., Dong, G., Qiang, M., Bai, Z., Zhao, Y., et al. (2017). Early human impacts on vegetation on the northeastern Qinghai-Tibetan Plateau during the middle to late Holocene. Prog. Phys. Geogr. Earth Environ. 41, 286–301. doi: 10.1177/0309133317703035
Huang, X., Peng, W., Rudaya, N., Grimm, E. C., Chen, X., Cao, X., et al. (2018). Holocene vegetation and climate dynamics in the altai mountains and surrounding areas. Geophys. Res. Lett. 45, 6628–6636. doi: 10.1029/2018GL078028
Issar, A. S., and Zohar, M. (2004). Climate Change: Environment and Civilization in the Middle East. Berlin: Springer. doi: 10.1007/978-3-662-06264-7
Jackson, S. T., and Blois, J. L. (2015). Community ecology in a changing environment: perspectives from the quaternary. Proc. Natl. Acad. Sci. U S A. 112, 4915–4921. doi: 10.1073/pnas.1403664111
Jackson, S. T., and Hobbs, R. J. (2009). Ecological restoration in the light of ecological history. Science 325, 567–569. doi: 10.1126/science.1172977
Kadosh, D., Sivan, D., Kutiel, H., and Weinstein-Evron, M. (2004). A late quaternary paleoenvironmental sequence fromDor, Carmel coastal plain, Israel. Palynology 28, 143–157. doi: 10.2113/28.1.143
Kaniewski, D., Van Campo, E., Morhange, C., Guiot, J., Zviely, D., Shaked, I., et al. (2013). Early urban impact on mediterranean coastal environments. Sci. Rep. 3:3540. doi: 10.1038/srep03540
Karpenko, L. V. (2006). Reconstructing quantitative indices of climate and vegetation successions of the Sym-Dubches interfluve for the Holocene. Geogr. Nat. Resour. 2, 77–82.
Kuneš, P., Abraham, V., and Herben, T. (2019). Changing disturbance-diversity relationships in temperate ecosystems over the past 12000 years. J. Ecol. 107, 1678–1688. doi: 10.1111/1365-2745.13136
Langgut, D. (2018). Late quaternary nile flows as recorded in the levantine basin: the palynological evidence. Quat. Int. 464, 273–284. doi: 10.1016/j.quaint.2017.07.006
Langgut, D., Almogi-Labin, A., Bar-Matthews, M., and Weinstein-Evron, M. (2011). Vegetation and climate changes in the South Eastern mediterranean during the last glacial-interglacial cycle (86 ka): New marine pollen record. Quat. Sci. Rev. 30, 3960–3972. doi: 10.1016/j.quascirev.2011.10.016
Langgut, D., Cheddadi, R., Carrión, J. S., Cavanagh, M., Colombaroli, D., Eastwood, W. J., et al. (2019). The origin and spread of olive cultivation in the mediterranean basin: the fossil pollen evidence. Holocene 29, 902–922. doi: 10.1177/0959683619826654
Langgut, D., Neumann, F. H., Stein, M., Wagner, A., Kagan, E. J., Boaretto, E., et al. (2014). Dead sea pollen record and history of human activity in the Judean highlands (Israel) from the Intermediate Bronze into the Iron ages (∼2500–500 BCE). Palynology 38, 280–302. doi: 10.1080/01916122.2014.906001
Laskar, A. H., and Bohra, A. (2021). Impact of Indian summer monsoon change on ancient Indian civilizations during the Holocene. Front. Earth Sci. 9:709455. doi: 10.3389/feart.2021.709455
Legendre, P., and Birks, H. J. B. (2012). “Clustering and partitioning,” in Tracking Environmental Change Using Lake Sediments, Volume 5: Data Handling and Numerical Techniques, eds H. J. B. Birks, A. F. Lotter, S. Juggins, and J. P. Smol (Dordrecht: Springer), 167–200. doi: 10.1007/978-94-007-2745-8_7
Leipe, C., Demske, D., and Tarasov, P. E. (2014). A Holocene pollen record from the northwestern Himalayan lake Tso Moriri: implications for palaeoclimatic and archaeological research. Quat. Int. 348, 93–112. doi: 10.1016/j.quaint.2013.05.005
Leipe, C., Long, T., Sergusheva, E. A., Wagner, M., and Tarasov, P. E. (2019). Discontinuous spread of millet agriculture in eastern Asia and prehistoric population dynamics. Sci. Adv. 5:eaax6225. doi: 10.1126/sciadv.aax6225
Li, X., Dodson, J., Zhou, J., and Zhou, X. (2009). Increases of population and expansion of rice agriculture in Asia, and anthropogenic methane emissions since 5000BP. Quat. Int. 202, 41–50. doi: 10.1016/j.quaint.2008.02.009
Litt, T., Ohlwein, C., Neumann, F. H., Hense, A., and Stein, M. (2012). Holocene climate variability in the levant from the dead sea pollen record. Quat. Sci. Rev. 49, 95–105. doi: 10.1016/j.quascirev.2012.06.012
Liu, F., and Feng, Z. (2012). A dramatic climatic transition at ~4000 cal. yr BP and its cultural responses in Chinese cultural domains. Holocene 22, 1181–1197. doi: 10.1177/0959683612441839
Liu, S., Kruse, S., Scherler, D., Ree, R. H., Zimmermann, H. H., Stoof-Leichsenring, K. R., et al. (2021). Sedimentary ancient DNA reveals a threat of warming-induced alpine habitat loss to Tibetan Plateau plant diversity. Nat. Commun. 12:2995. doi: 10.1038/s41467-021-22986-4
Lyons, S. K., Amatangelo, K. L., Behrensmeyer, A. K., Bercovici, A., Blois, J. L., Davis, M., et al. (2016). Holocene shifts in the assembly of plant and animal communities implicate human impacts. Nature 529, 80–83. doi: 10.1038/nature16447
McGill, B. J., Dornelas, M., Gotelli, N. J., and Magurran, A. E. (2015). Fifteen forms of biodiversity trend in the anthropocene. Trends Ecol. Evol. 30, 104–113. doi: 10.1016/j.tree.2014.11.006
Monserud, R. A., Tchebakova, N. M., Kolchugina, T. P., and Denissenko, O. V. (1995). Change in phytomass and net primary productivity for Siberia from the mid-Holocene to the present. Glob. Biogeochem. Cycle 9, 213–226. doi: 10.1029/95GB00596
Mottl, O., Flantua, S. G. A., Bhatta, K. P., Felde, V. A., Giesecke, T., and Simon Goring, et al. (2021a). Global acceleration in rates of vegetation change over the past 18,000 years. Science 372, 860–864. doi: 10.1126/science.abg1685
Mottl, O., Grytnes, J. A., Seddon, A. W. R., Steinbauer, M. J., Bhatta, K. P., Felde, V. A., et al. (2021b). Rate-of-change analysis in paleoecology revisited: a new approach. Rev. Palaeobot. Palynol. 293:104483. doi: 10.1016/j.revpalbo.2021.104483
Nolan, C., Overpeck, J. T., Allen, J. R. M., Anderson, P. M., Betancourt, J. L., Binney, H. A., et al. (2018). Past and future global transformation of terrestrial ecosystems under climate change. Science 361, 920–923. doi: 10.1126/science.aan5360
Palmisano, A., Woodbridge, J., Roberts, C. N., Bevan, A., Fyfe, R., Shennan, S., et al. (2019). Holocene landscape dynamics and long-term population trends in the Levant. Holocene 29, 708–727. doi: 10.1177/0959683619826642
PANGAEA® Data Publisher for Earth & Environmental Science. Available online at: www.pangaea.de (accessed January 13, 2020). doi: 10.1126/science.350.6267.1452
Pedersen, E. J., Miller, D. L., Simpson, G. L., and Ross, N. (2019). Hierarchical generalized additive models in ecology: an introduction with mgcv. PeerJ 7:e6876. doi: 10.1016/0034-6667(80)90023-8
Pennisi, E. (2015). Human impacts on ecosystems began thousands of years ago: early humans broke up existing plant and animal networks, perhaps boosting extinction risks. Science 350:1452. doi: 10.1111/j.1469-8137.2009.03111.x
Prentice, I. C. (1980). Multidimensional scaling as a research tool in quaternary palynology: a review of theory and methods. Rev. Palaeobot. Palynol. 31, 71–104.
Proctor, M. C. F. (2010). Trait correlations in bryophytes: exploring an alternative world. New Phytol. 185, 1–3. doi: 10.1017/RDC.2020.41
R Core Team (2022). R: A Language and Environment for Statistical Computing. Vienna: R Foundation for Statistical Computing. doi: 10.1002/(SICI)1099-1417(200003)15:3<273::AID-JQS504>3.0.CO;2-2
Reimer, P. J., Austin, W. E. N., Bard, E., Bayliss, A., Blackwell, P. G., Bronk Ramsey, C., et al. (2020). The IntCal20 northern hemisphere radiocarbon age calibration curve (0-55 cal kBP). Radiocarbon 62, 725–757. doi: 10.1007/s00334-006-0075-5
Ren, G. (2000). Decline of the mid- to late Holocene forests in China: climatic change or human impact? J. Quat. Sci. 15, 273–281. doi: 10.1016/S0277-3791(01)00119-6
Ren, G. (2007). Changes in forest cover in China during the Holocene. Veg. Hist. Archaeobot. 16, 119–126.
Ren, G., and Beug, H.-J. (2002). Mapping Holocene pollen data and vegetation of China. Quat. Sci. Rev. 21, 1395–1422. doi: 10.1016/0031-0182(85)90056-2
Rohling, E. J., Hayes, A., Mayewski, P. A., and Kucera, M. (2009). “Holoceneclimate variability in the eastern mediterranean, and the end of the Bronze age,” in Forces of Transformation: the End of the Bronze Age in the Mediterranean, eds C. Bachhuber and N. G. Roberts (Oxbow: Oxford University), 2–5. doi: 10.1016/S0277-3791(98)00093-6
Rossignol-Strick, M. (1985). Mediterranean quaternary sapropels, an immediate response of the African monsoon to variation of insolation. Palaeogeogr. Palaeoclimatol. Palaeoecol. 49, 237–263. doi: 10.1016/j.quascirev.2020.106386
Rossignol-strick, M. (1999). The Holocene climatic optimum and pollen records of sapropel 1 in the eastern mediterranean, 9,000-6,000 BP. Quat. Sci. Rev. 18, 515–530. doi: 10.1051/bioconf/20191600047
Ruddiman, W. F., He, F., Vavrus, S. J., and Kutzbach, J. E. (2020). The early anthropogenic hypothesis: a review. Quat. Sci. Rev. 240:106386.
Safronova, I., and Yurkovsksya, T. (2019). The latitudinal distribution of vegetation cover in Siberia. BIO Web Conf. 16:00047.
Schiebel, V. (2013). Vegetation and Climate History of the Southern Levant During the Last 30,000 Years Based on Palynological Investigation. PhD thesis. Bonn: Universität Bonn. doi: 10.1007/978-94-007-2745-8_9
Silverman, B. W. (1986). Density Estimation for Statistics and Data Analysis. New York, NY: Springer. doi: 10.1016/j.yqres.2006.09.001
Simpson, G. L., and Birks, H. J. B. (2012). “Statistical learning in palaeolimnology,” in Tracking Environmental Change Using Lake Sediments, Volume 5: Data Handling and Numerical Techniques, eds H. J. B. Birks, A. F. Lotter, S. Juggins, and J. P. Smol (Dordrecht: Springer), 249–327. doi: 10.1126/science.aax1192
Staubwasser, M., and Weiss, H. (2006). Holocene climate and cultural evolution in late prehistoric–early historic West Asia. Quat. Res. 66, 372–387. doi: 10.1016/j.revpalbo.2021.104581
Stephens, L., Fuller, D., Boivin, N., Rick, T., Gauthier, N., Kay, A., et al. (2019). Archaeological assessment reveals Earth’s early transformation through land use. Science 365, 897–902. doi: 10.1016/j.quascirev.2014.11.013
Sun, A., and Feng, Z. (2021). Holocene moisture variations across the Tibetan Plateau: a synthesis of pollen records. Rev. Palaeobot. Palynol. 297:104581. doi: 10.2307/1938672
Tan, Z., Han, Y., Cao, J., Chang Huang, C., and An, Z. (2015). Holocene wildfire history and human activity from high-resolution charcoal and elemental black carbon records in the Guanzhong basin of the Loess Plateau. China. Quat. Sci. Rev. 109, 76–87.
ter Braak, C. J. F. (1986). Canonical correspondence analysis: a new eigenvector technique for multivariate direct gradient analysis. Ecology 67, 1167–1179.
ter Braak, C. J. F., and Šmilauer, P. (2002). Canoco for Windows Version 4.5. Wageningen: BiometrisPlant Research International. doi: 10.1016/j.quascirev.2016.02.001
ter Braak, C. J. F., and Šmilauer, P. (2012). Canoco Reference Manual and User’s Guide: Software for Ordination (version 5.0). Microcomputer Power: Ithaca. doi: 10.1007/s00334-022-00879-w
Tian, F., Cao, X., Dallmeyer, A., Ni, J., Zhao, Y., Wang, Y., et al. (2016). Quantitative woody cover reconstructions from eastern continental Asia of the last 22 kyr reveal strong regional peculiarities. Quat. Sci. Rev. 137, 33–44. doi: 10.1098/rstb.1976.0068
Väli, V., Odgaard, B. V., Väli, Ü, and Poska, A. (2022). Pollen richness: a reflection of vegetation diversity or pollen - specific parameters? Veg. Hist. Archaeobot. 31, 611–622.
Van Zeist, W. (1976). On macroscopic traces of food plants in Southwestern Asia (with some reference to pollen data). Philos. Trans. R. Soc. Lond. B. Biol. Sci. 275, 27–41.
Van Zeist, W. (1992). The origin and development of plant cultivation in the near east. Japan Rev. 3, 149–165. doi: 10.1126/science.140.3562.65
Van Zeist, W., and Bottema, S. (1991). Late Quaternary Vegetation of the Near East. Wiesbaden: Dr. Ludwig Reichert Verlag. doi: 10.1016/j.earscirev.2013.03.005
Van Zeist, W., and Wright, H. E. (1963). Preliminary pollen studies at lake Zeribar, Zagros mountains, Southwestern Iran. Science 140, 65–67. doi: 10.1130/G46604.1
Wang, W., and Feng, Z. (2013). Holocene moisture evolution across the Mongolian Plateau and its surrounding areas: a synthesis of climatic records. Earth Sci. Rev. 122, 38–57. doi: 10.1007/s00334-018-0675-x
Watanabe, T. K., Watanabe, T., Yamazaki, A., and Pfeiffer, M. (2019). Oman corals suggest that a stronger winter shamal season caused the Akkadian empire (Mesopotamia) collapse. Geology 47, 1141–1145. doi: 10.1007/978-3-319-24277-4
Whitlam, J., Bogaard, A., Matthews, R., Matthews, W., Mohammadifar, Y., Ilkhani, H., et al. (2018). Pre-agricultural plant management in the uplands of the central Zagros: the archaeobotanical evidence from Sheikh-e Abad. Veg. Hist. Archaeobot. 27, 817–831. doi: 10.1007/s00334-005-0075-x
Wickham, H. (2016). ggplot2: Elegant Graphics for Data Analysis. Berlin: Springer. doi: 10.1017/qua.2017.105
Willcox, G. (2005). The distribution, natural habitats and availability of wild cereals in relation to their domestication in the near east: multiple events, multiple centres. Veg. Hist. Archaeobot. 14, 534–541.
Williams, J. W., Grimm, E. C., Blois, J. L., Charles, D. F., Davis, E. B., Goring, S. J., et al. (2018). The Neotoma paleoecology database, a multiproxy, international, community-curated data resource. Quat. Res. 89, 156–177. doi: 10.1126/science.161.3839.334
Wood, S. (2022). Mixed GAM Computation Vehicle with Automatic Smoothness Estimation. Available online at: https://cran.r-project.org/web/packages/mgcv/ doi: 10.1126/science.194.4263.385 (accessed october 29, 2022).
Wright, H. E. (1968). Natural environment of early food production North of Mesopotamia. Science 161, 334–339. doi: 10.1016/j.quascirev.2011.08.009
Wright, H. E. (1976). The environmental setting for plant domestication in the near east. Science 194, 385–389. doi: 10.1046/j.1365-2699.2000.00431.x
Yang, X., Scuderi, L., Paillou, P., Liu, Z., Li, H., and Ren, X. (2011). Quaternary environmental changes in the drylands of China - a critical review. Quat. Sci. Rev. 30, 3219–3233. doi: 10.1046/j.1365-2699.1998.00237.x
Yu, G., Chen, X., Ni, J., Cheddadi, R., Guiot, J., Han, H., et al. (2000). Palaeovegetation of China: a pollen data-based synthesis for the mid-Holocene and last glacial maximum. J. Biogeogr. 27, 635–664. doi: 10.1016/j.palaeo.2020.109744
Yu, G., Prentice, I. C., Harrison, S. P., and Sun, X. (1998). Pollen-based biome reconstructions for China at 0 and 6000 years. J. Biogeogr. 25, 1055–1069. doi: 10.1016/j.regsus.2020.08.001
Zhang, D., Chen, X., Li, Y., and Zhang, S. (2020). Holocene vegetation dynamics and associated climate changes in the Altai mountains of the arid central Asia. Palaeogeogr. Palaeoclimatol. Palaeoecol. 550:109744. doi: 10.1016/j.quaint.2007.12.002
Zhang, Y., Zhang, D., Li, W., Li, Y., Zhang, C., Guan, K., et al. (2020). Characteristics and utilization of plant diversity and resources in Central Asia. Reg. Sustain. 1, 1–10. doi: 10.1093/acprof:osobl/9780199549061.001.0001
Zhao, Y., Yu, Z., and Chen, F. (2009). Spatial and temporal patterns of Holocene vegetation and climate changes in arid and semi-arid China. Quat. Int. 194, 6–18.
Zohary, D., Hopf, M., and Weiss, E. (2012). Domestication of Plants in the Old World: the Origin and Spread of Domesticated Plants in Southwest Asia, Europe, and the Mediterranean Basin, 4th Edn. Oxford: Oxford University Press.
Keywords: climate change, pollen-compositional turnover, detrended canonical correspondence analysis (DCCA), Hill indices, land-use change, multivariate regression tree (MRT), pollen-assemblage property (PAP), past vegetation dynamics
Citation: Bhatta KP, Mottl O, Felde VA, Flantua SGA, Birks HH, Cao X, Chen F, Grytnes J-A, Seddon AWR and Birks HJB (2023) Exploring spatio-temporal patterns of palynological changes in Asia during the Holocene. Front. Ecol. Evol. 11:1115784. doi: 10.3389/fevo.2023.1115784
Received: 04 December 2022; Accepted: 03 April 2023;
Published: 05 May 2023.
Edited by:
Anna Maria Mercuri, University of Modena and Reggio Emilia, ItalyCopyright © 2023 Bhatta, Mottl, Felde, Flantua, Birks, Cao, Chen, Grytnes, Seddon and Birks. This is an open-access article distributed under the terms of the Creative Commons Attribution License (CC BY). The use, distribution or reproduction in other forums is permitted, provided the original author(s) and the copyright owner(s) are credited and that the original publication in this journal is cited, in accordance with accepted academic practice. No use, distribution or reproduction is permitted which does not comply with these terms.
*Correspondence: Kuber P. Bhatta, kuber.bhatta@uib.no
†ORCID: Kuber P. Bhatta, orcid.org/0000-0001-7837-1395; Ondřej Mottl, orcid.org/0000-0002-9796-5081; Vivian A. Felde, orcid.org/0000-0002-2855-0894; Suzette G. A. Flantua, orcid.org/0000-0001-6526-3037; Hilary H. Birks, orcid.org/0000-0001-6881-9133; Xianyong Cao, orcid.org/0000-0001-5633-2256; Fahu Chen, orcid.org/0000-0002-8874-1035; John-Arvid Grytnes, orcid.org/0000-0002-6365-9676; Alistair W. R. Seddon, orcid.org/0000-0002-8266-0947; Harry John B. Birks, orcid.org/0000-0002-5891-9859