Synergistic effects of technological innovation, industrial structure upgrading, and ecological environment optimization—evidence from China
 Jiaojiao Yang1,2
  Ting Wang1,2*
- 1School of Management, Guizhou University, Guiyang, China
- 2Key Laboratory of "Internet+" Collaborative Intelligent Manufacturing in Guizhou Provence, Guiyang, China
The benign interaction between technological innovation, industrial structure, and ecological environment optimization is important for the sustainable development of China’s economy. Based on panel data from 30 provinces (municipalities) in China from 2003 to 2019, a coupling coordination degree (CCD) model was adopted to evaluate the coordinated development level of the technological innovation-industrial structure-ecological environment system (TIE). Fixed-effect models were used to explore the subsystem impact on the coupling coordination level. A fully modified least-squares (FMOLS) method was used to analyze TIE subsystem interactions. The results show the following: (1) The coordinated development level of TIE has steadily improved. The CCD of the TIE was high in the east, flat in the center, and low in the west. (2) Subsystem development significantly and positively affected the degree of coupling coordination. The ecological environmental impact on the coordinated development level was the largest in the eastern regions and the influence of technological innovation on the coordinated development level was the largest in the central and western regions. (3) Industrial advancement had a positive impact on technological innovation in 30 provinces as a whole, and in the eastern, central, and western regions. A “U”-shaped relationship was found between technological innovation and industrial advancement in all 30 provinces, and in the eastern, central provinces. Industrial rationalization, industrial advancement, and technological innovation can promote the improvement of the ecological environment in all 30 provinces, and the eastern, central, and western regions.
1. Introduction
Economic growth and resource exploitation have exacerbated the deterioration of China’s ecological environment over the past few years (Liao et al., 2018). Owing to pressure from resource exhaustion and environmental deterioration, achieving green, coordinated, and sustainable development has become an urgent goal for both government and academia. The United Nations 2030 Agenda for Sustainable Development sets out 17 sustainable development goals and 169 targets, including the goals of sustainable management of environmental health (Goal 6), sustainable economic growth (Goal 8), promoting innovation (Goal 9), and ecosystem protection (Goal 15) (United Nations, 2015). A report of the 19th National Congress of the Communist Party of China pointed out that sustainable regional economic development has played a key role in transforming China’s economy from a high-speed growth stage to a high-quality development stage (China, 2017). Industrial structure and technological innovation have become the main driving factors in the improvement of China’s ecological environment. These two factors are not only the determinants of improving the ecological environment but are also inherently required for the high-quality economic development of China’s economy. The improvement in energy-saving and emission-reduction efficiency has also forced the government and enterprises to carry out technological innovation and industrial structure transformation to varying degrees. The 14th Five-Year Plan and Outline of Vision 2035 proposed investment in technological innovation to promote economic development, which in turn promotes the overall development of the regional economy (China, 2020).
As the largest developing country, China has always attached great importance to technological innovation and upgrading its industrial structure. The latest Global Innovation Index (GII) report released by the World Intellectual Property Organization shows that China’s GII rank from 2019, moved up two places to 12th in 2020. Data from the National Bureau of Statistics show that the ratio of secondary and tertiary industries to GDP in China is as high as 93%. However, the problems of unbalanced development of regional industrial structures and insufficient innovation momentum are still prominent and have become key factors restricting the sustainable development of China’s economy.
Upgrading industrial structure and optimizing ecological environment have always piqued the interests of scholars. China’s economy is in a critical period of transforming its development mode, optimizing its economic structure, and renovating its growth impetus. The concept of sustainable development provides a new opportunity to solve the problem of imbalanced and inadequate development and completely reverse resource and environmental constraints in China. There is a complex relationship between technological innovation, industrial structure upgrading, and the eco-environment, which is interrelated, influenced, and coupled (Figure 1). There are several questions that remain unanswered, such as regarding the coordinated development level of technological innovation, industrial structure, and ecological environment in China’s 30 provinces. Is there a difference in the influence of subsystem development level on the overall coupling coordination degree in different regions? Can technological innovation stimulate the optimization of the ecological environment while promoting industrial structure upgrading? Does upgrading the industrial structure positively impact ecological environment optimization? Is there a benign interaction mechanism between technological innovation, industrial structure upgrading, and ecological environment optimization? If so, what is the mechanism of interaction? Does this interaction mechanism differ between the regions? These questions highlight the need to clarify the relationship between these constructs. Through promoting the coupled and coordinated development of technological innovation, industrial structure, and ecological environment, and establishing an optimal situation in which technological innovation promotes industrial structure and ecological environment optimization, industrial upgrading, and environmental improvement promotes technological innovation, will become the key to sustainable economic development in China.
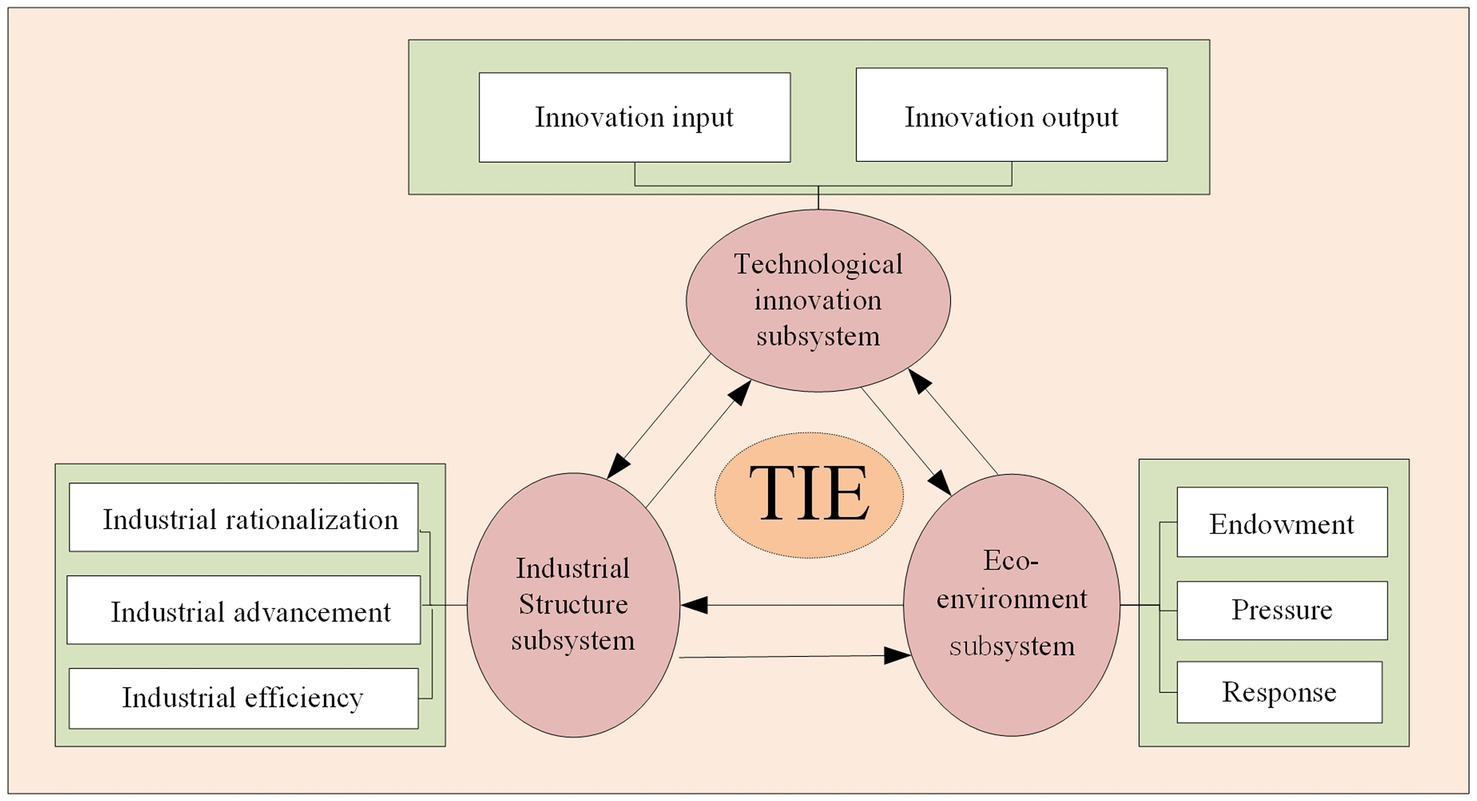
Figure 1. Interaction between subsystems of TIE.
Based on the concept of sustainable economic development, this study constructs an interactive framework for technological innovation, industrial structure upgrading, and ecological environment optimization. The coupling coordination model (CCDM) and Fully Modified Least-Squares method (FMOLS) were used to test the interaction mechanism between the three, to provide useful references and suggestions for promoting sustainable development of China’s economy. A flowchart outlining the research is shown in Figure 2.
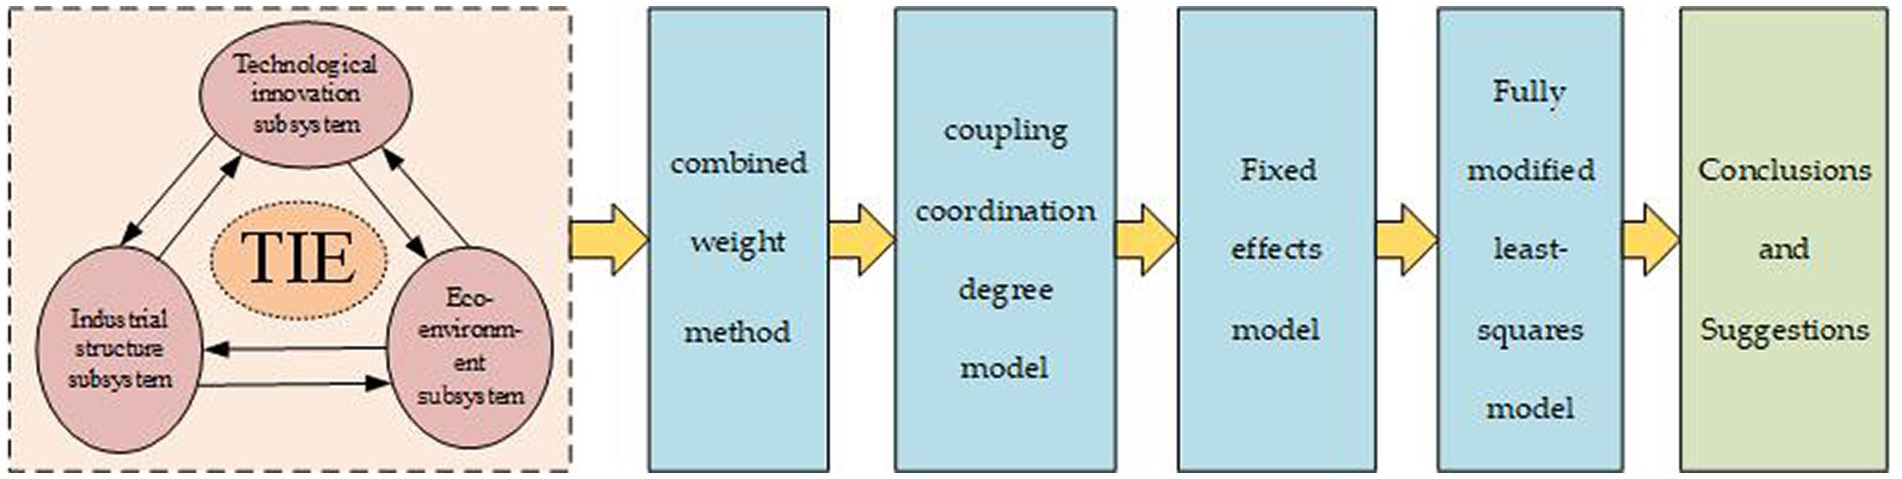
Figure 2. The research flow chart.
2. Literature review
Previous studies have investigated the relationships between technological innovation and industrial structure, industrial transformation, and environmental development, covering the following three aspects.
The first objective is the study of the relationship between technological innovation and the industrial structure. Technological innovation promotes the upgrading of industrial structures, which is an important means to achieve industrial upgrading (Gong et al., 2015). Using data from Chinese manufacturing industries to analyze the impact of technological innovation on industry structure, Fan and Fang (2016) found that technological innovation can promote the manufacturing industry structure toward developing high technology density. Liao et al. (2020) found that importing technology, both disembodied and embodied, is not conducive to industrial structure rationalization and upgrading. Wen et al. (2020) found that the ecological efficiency of China’s industrial structure decreases from east to west, and the gap between provinces gradually increases. Wang et al. (2019) and Wang and Zhang (2020) found regional differences in the impact of upgrading trade structures on green technological innovation. Wang et al. (2021) concluded that marine technological innovation significantly promotes the rationalization and advancement of the marine industrial structure. Moreover, the impact of technological innovation on industrial structures under environmental regulation (ER) has been a focus of discussion. Shi and Zhao (2018) found that high-intensity environmental regulation has a forcing effect on technological innovation, which can promote industrial structure upgrading. Song and Bi (2020) found that weaker environmental regulation intensity for technology imports provides the possibility of promoting the rationalization of the industrial structure effect of technology innovation. Wang et al. (2022) found that the interaction between ER and technological innovation strengthens the role of technological innovation and environmental regulation in the upgrading and rationalization of industrial structures. Zhang and Lin (2022) found that formal environmental regulations weaken the industrial structure adjustment effect of technological innovation. He and Zheng (2023) found that technological innovation is an important means for environmental regulation to promote industrial advancement.
The second objective is to study the relationship between technological innovation and environmental development. Jin et al. (2014) found that the pollution emissions caused by technological innovation driving economic development are higher than their energy-saving and emission-reduction effects, and technological innovation will bring more pollution emissions. Wang and Luo (2020) found that the positive effects of technological innovation capacity on environmental pollution are strengthened by an improvement in FDI quality. Based on the CCDM, Yang et al. (2021) found that the coupling coordination degree of China’s technological innovation and ecological environment systems showed a fluctuating upward trend, but the gap between regions gradually increased, showing a spatial pattern of high in the eastern and central regions and low in the western and northeastern regions. Dong et al. (2022) found that environment-related green technological innovation considerably improved carbon emission efficiency. Yi et al. (2022) found that green technological innovation could alleviate haze pollution and reduce pollution emissions by promoting clean energy to replace traditional energy. Adebayo et al. (2022) used data from 1980 to 2018 in Sweden and adopted ARDL and spectral causality approaches to analyze the impact of technological innovation on CO2 emissions. They found that a positive shock in technological innovation causes a decrease in these emissions. Edziah et al. (2022) found that machinery equipment imports significantly reduce CO2 emissions in 18 countries in sub-Saharan Africa. On the other hand, the government has adopted ER measures to improve environmental quality. Therefore, the impact of ER on technological innovation has been an important discussion. Zhang et al. (2018) found that command-control ER and market-based incentive ER have different positive effects on green product innovation behavior, cleaner process innovation behavior, and end-of-pipe technological innovation behavior. Cai et al. (2020) find that direct ER can considerably promote green technological innovation in heavily polluting and technology-capital-intensive industries. Quyang et al. (2020) found that ER is not conducive to the technological innovation of state-owned enterprises with a higher cost of energy conservation and emission reduction. Using a panel regression model, Zhang et al. (2022) found that command-control and market-incentivized ERs have a “U”-shaped relationship with technological innovation, and public-participation ER has a marked positive impact on technological innovation. Li et al. (2023) fond that heterogeneous environmental regulatory measures (environmental protection subsidies and pollution charges) can improve the green technology innovation through compensation effects.
The third objective was to study the impact of industrial structure on the ecological environment. Zhao (2007) found that the interaction between the regional differentiation of the ecological environment and that of the industrial spatial structures in Gansu aggravated the vulnerability of the ecological environment. Zhou et al. (2017) found that upgrading industrial structure and spatial optimization is helpful for achieving a balance between economic development and environmental protection. Li et al. (2017) found that industrial structure upgrading and transformation can reduce energy consumption per unit of output value and reduce carbon emissions. Using enterprise survey data, Wang et al. (2018) found that the concentration of the manufacturing industry has a negative impact on pollutant emissions. Liu et al. (2019) found that economic restructuring and technological progress could not alleviate ozone pollution. Li et al. (2019) found that the adjustment and optimization of industrial structures improved the overall environmental pollution and industrial source pollution situation. Cui (2020) found that the synergy among the three industries has continuously improved, the structure ratio has become more reasonable, and a positive impact on the eco-environment has gradually emerged. Li J. et al. (2022) and Li R. R. et al. (2022) found that technological progress and industrial restructuring had a significant negative impact on pollutant emissions. Sun et al. (2022) found that the development of tertiary industry promoted the optimal allocation of resources, reduced pollution emissions, and improved green total factor productivity. Liu et al. (2023) found that economic globalization improves energy efficiency only in upper-middle and lower-middle income countries and not in high and lower-income countries. In addition, the coordinated development between industrial structure and ecological environment has always been the focus of discussion. Wang et al. (2019) found that there is a significant difference in the degree of coupling coordination between the industrial structure and ecological environment in the Beijing-Tianjin-Hebei region, and most areas in Hebei are at a low level of coordination. Chen and Zhao (2019) found that the degree of coupling between the industrial structure and ecological environment in Beijing is in the stage of “superior coordinated development,” and the development gap between them is diminishing. Ding et al. (2020) found that the coupling coordination level between the industrial structure and the atmospheric environment in most cities of the Zhejiang province is relatively high, and there is a benign development relationship between the industrial structure, and the atmospheric environment. Zhang et al. (2021) found that the evolution of industrial structures conforms to the concept of green development. In the long run, the optimization of industrial structures has contributed to the continuous improvement of the ecological environment.
In summary, the existing research is still a lack of the following: (1) The existing literature on technological innovation, industrial structure, and the ecological environment tends to split the three subsystems, and there is a lack of research on technological innovation, industrial structure, and ecological environment as three measurable systems into the same framework to explore their coordinated development trend. (2) In terms of research methods, most publications have adopted the CCDM, which does not fully consider the effect of the development level of subsystems on the overall coupling coordination level. (3) The traditional CCDM ignores the endogenous relationship among technological innovation, industrial structure, and ecological environment optimization and cannot reflect the nonlinear relationship between the three.
The contributions of this studies are as follows: (1) Three subsystems were studied at the same level and a complex technological innovation-industrial structure-ecological environment system (TIE) was constructed. The coordinated development level and spatial evolution pattern of TIE in China’s 30 provinces (cities) were discussed. (2) The difference influence of subsystem development level on coupling coordination degree of TIE in eastern, central and western regions was studied. (3) This paper studies the interaction mechanism between technological innovation, industrial structure upgrading and ecological environment optimization with multiple methods to ensure the reliability of the results, and explores the regional differences of this interaction mechanism.
3. Materials and methods
3.1. Data sources and data pre-processing
The data on the technological innovation, industrial structure and eco-environment of 30 provinces (cities) (except Tibet, Hong Kong, Macau, and Taiwan) is collected from the online version of the China Statistical Yearbook (2003–2019), China Environmental Statistical Yearbook (2003–2019), China Science and Technology Statistical Yearbook (2003–2019) and the provincial statistical yearbooks (2003–2019). The interpolation approach is utilized for the processing of individual missing data. Due to China’s uneven geographical growth, the 30 provinces (cities) were also separated into three groups: eastern, central, and western regions (Xu and Lin, 2016).
Since there are discrepancies in the size and magnitude of each of the selected indicators, the original data are adjusted. After treatment, every index value was within the range [0,1].
Positive indicator:
Negative indicator:
where represents the year, represents the province(city), represents the indicator, is the original value, is the normalized values. and respect the minimum and maximum values of the j-th indicator in all of the provinces and years.
3.2. Research methods
3.2.1. Construction of the indicator system
To highlight the important link and coordination role of technological innovation in the industrial structure and ecological environment, three subsystems of TIE were studied at the same level. Based on the scientific, systematic, availability, and operability of the index system, technological innovation can be measured through innovation inputs and outputs (Ruan and Li, 2019; Yang et al., 2021; Guo et al., 2022). Innovation input includes the full-time equivalent of R&D personnel, internal expenditure of R&D funds, input intensity of R&D funds, and the number of R&D projects. Innovation output includes the number of authorized invention patents, the number of new product development projects in high-tech enterprises, the number of traded contracts, and the value of traded contracts in the technical market.
An industrial structure system can be measured through rationalization (Yu, 2015), advancement (Gan et al., 2011), and efficiency of the industrial structure. Industrial rationalization measures the efficient utilization of resources and the degree of coordinated development between the input and output of industrial elements. The reciprocal of the Theil index is used to measure the rationalization of industrial structure (Gan et al., 2011). Industrial advancement reflects the evolution of the industrial structure from primary to secondary, and then to a tertiary industry (Yu, 2015). The advancement of industrial structure is measured by the ratio of the output value of the tertiary to secondary industry and the employment ratio of the tertiary to secondary industry. It is believed that the proportion of high-efficiency industries should gradually increase with continuous economic development. The high-efficiency industrial structure includes the per capita output value of the secondary industry, per capita output value of the tertiary industry, output–input ratio of the secondary industry, and output–input ratio of the tertiary industry.
This study selected indicators to measure the environmental system from three aspects: ecological environment endowment, environmental pressure, and environmental response (Chen and Zhao, 2019; Li J. et al., 2022; Li R. R. et al., 2022), including forest coverage rate, the green coverage rate of built-up areas, per capita water resources, and per capita park green area. Environmental pressure included per capita industrial wastewater discharge, per capita industrial SO2 discharge, per capita industrial solid waste production, and per capita industrial soot discharge. Environmental responses included annual investment in per capita industrial pollution control, per capita domestic waste clearing and transporting volume, urban sewage treatment capacity, and the comprehensive utilization rate of industrial solid waste. In conclusion, 27 indicators were selected to construct an index system for evaluating the coordinated development of TIE (Table 1).
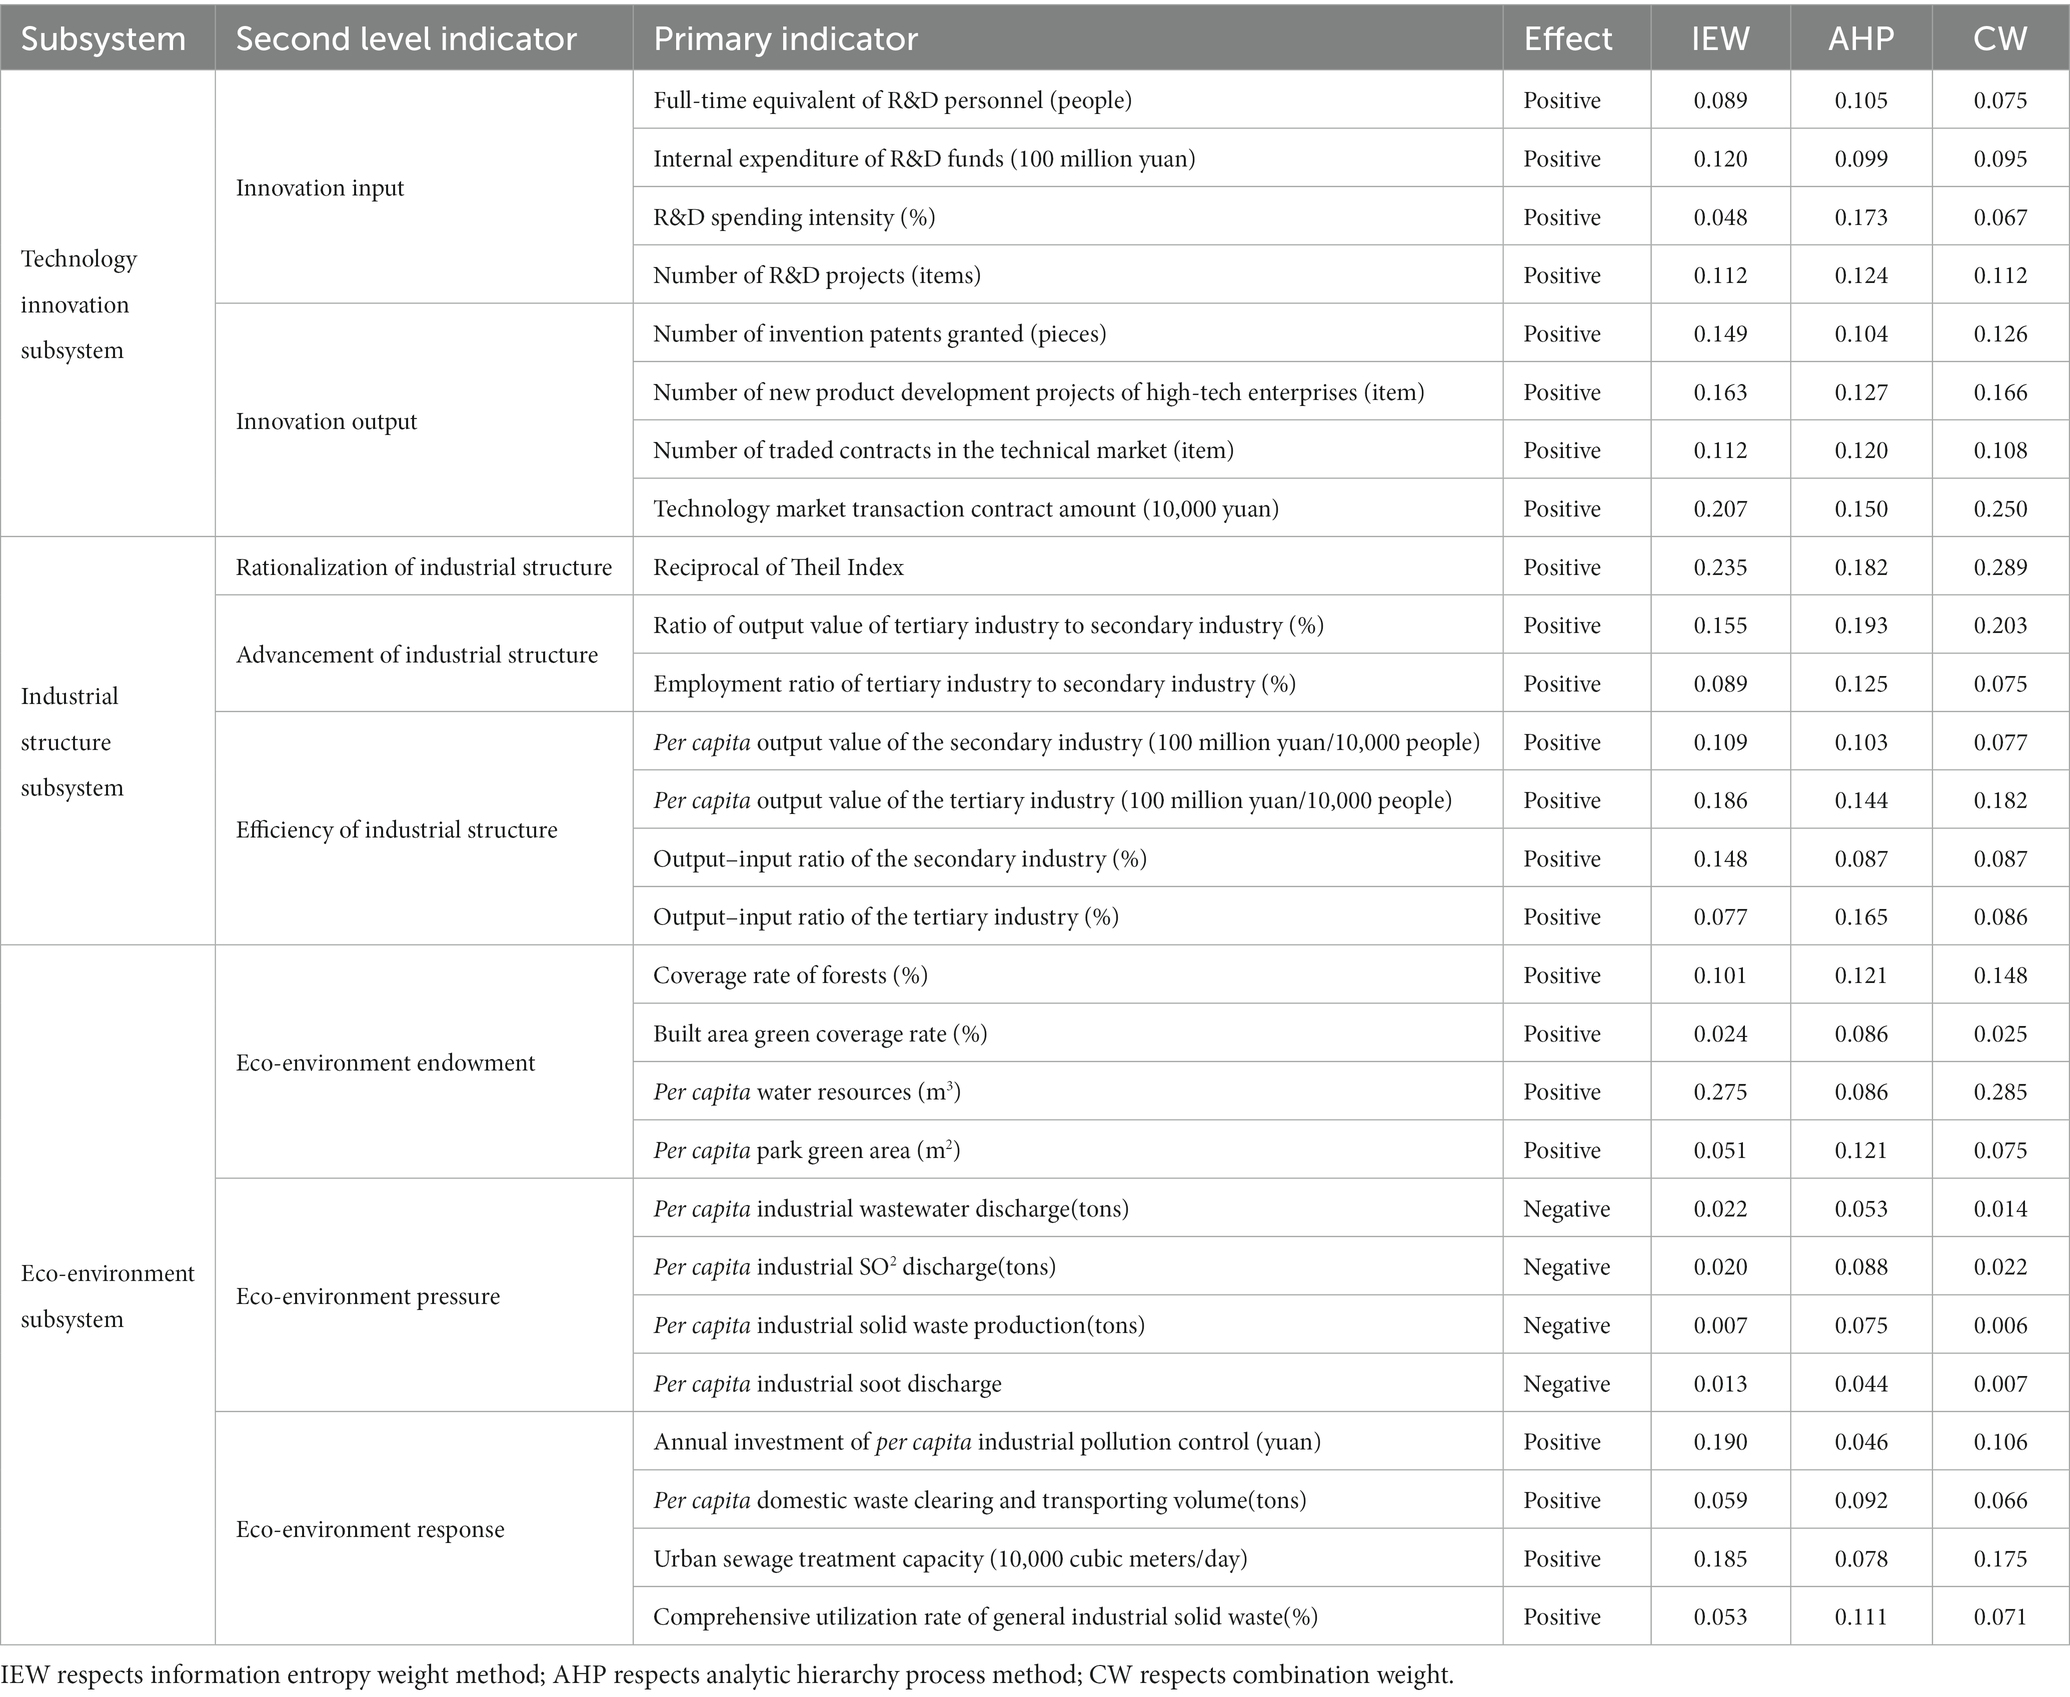
Table 1. Technological innovation, industrial structure, and eco-environment comprehensive evaluation index system.
Among these, Theil reciprocal formula:
Where Yi indicates the output value of the i-th industry, Li represents its employment level. When TL equals zero, economic progress is balanced. If TL’s value is greater, more economic development deviates from the equilibrium state. Therefore, the greater the value of RS, the more balanced the economic development and rational the industrial structure.
It is necessary to determine the weight of each index prior to a comprehensive evaluation of the subsystem. The combined weight method (Liu et al., 2014; Lai et al., 2015) was adopted to determine the weight, which can overcome the limitation of determining the weight of a single method. The subjective and objective weights of each index were calculated using the Analytic Hierarchy Process (AHP) and the entropy method.
Using the change in information entropy, the weight of each index was calculated using the entropy weighting method (Dong and Li, 2021). According to the basic principle of information theory, information is a measure of the degree of order of the system and entropy is a measure of system disorder. According to the definition of information entropy, the entropy value can be used to determine the degree of dispersion of an indicator. The smaller the information entropy, the greater the degree of dispersion of the index. If the entropy values of an index are equal, the index does not work in the comprehensive evaluation.
The AHP is a decision-making method that decomposes the elements related to decision-making into the levels of goals, criteria, and schemes, and conducts qualitative and quantitative analysis on this basis. AHP is more suitable for decision-making problems with hierarchical and interlaced evaluation indexes, and the objective value is difficult to describe quantitatively. It is used to construct the judgment matrix and to calculate its maximum eigenvalue and eigenvector. The normalized eigenvector is the weight of an index. When the judgment matrix passed the consistency test, the calculated weights were considered reliable (Chen et al., 2013). Otherwise, the judgment matrix is adjusted to pass the consistency test. In this study, we invited 10 experts in the field of the relationship between industrial structure and environment to compare the importance of the indicators in the subsystems.
Based on the principle of entropy, the entropy weight represents the degree of change in the index and not the importance of the index. Therefore, the weights of the indicators were calculated by combining AHP and entropy weight methods.
Where is the weight calculated by entropy weight method, is the weight calculated by AHP.
The comprehensive score of the subsystems is the sum of the standardized values of each index in the subsystem and the product of its weight.
Where is the combined weight of indicator j, is the normalized value of each index.
3.2.2. The coupling coordination degree model
The coupling degree is derived from a physical concept, which refers to the interaction between two or more systems, and can reflect the degree of interdependence and mutual restriction between systems. The coupling coordination degree refers to the degree of benign coupling in the coupling relationship, which can reflect the quality of coordination. Therefore, this study used the CCDM to measure the coordination development level of TIE, and three system coupling coordination degree models (CCDM) were introduced (Xu and Zhou, 2021). as follows:
where D denotes the coupling coordination degree of TIE; C is the coupling degree; T is the degree of influence of technological innovation, industrial structure, and ecological environment subsystem; represent the comprehensive level of technological innovation, industrial structure, and ecological environment subsystems, respectively; stand for the contributions of the technological innovation, industrial structure, and ecological environment subsystems to TIE. The degree of coupling coordination is not considerably affected by (He et al., 2017). The three subsystems of TIE were identified as equally important, and the coefficient was set to .
The larger the D value, the higher the CCD of TIE. Based on the value of D and referring to existing research (Liu et al., 2018; Chen and Zhao, 2019), the CCD of TIE was classified into four stages and further divided into nine types (Table 2).
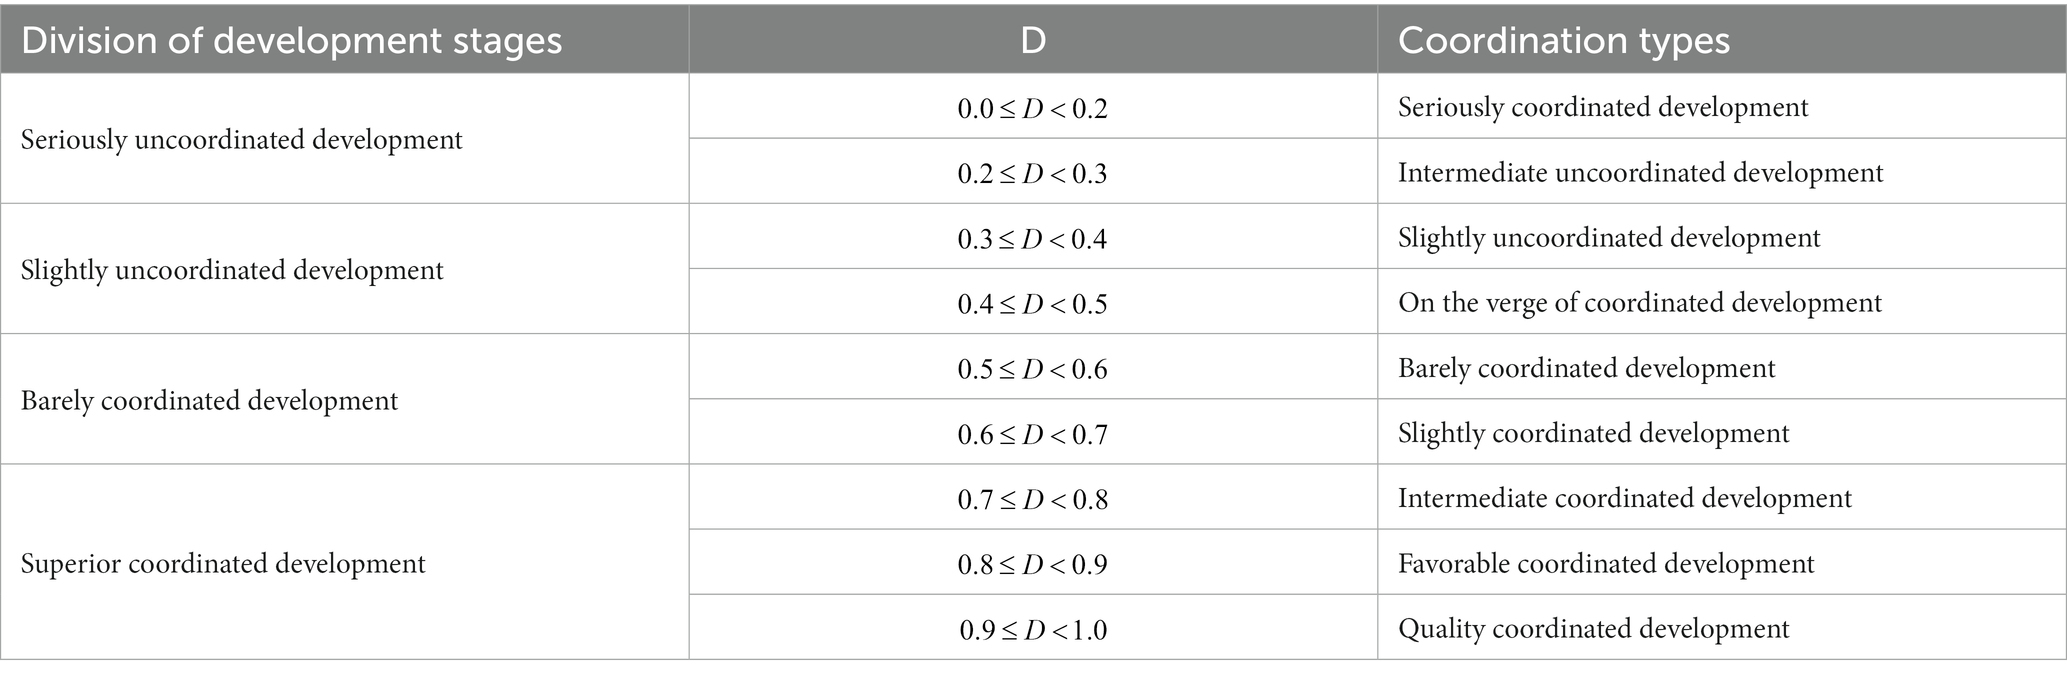
Table 2. The development type of coupling coordinated degree of TIE.
High-quality economic development focuses on the coordinated development of subsystems. However, many problems are associated with the development process. It is important for economic development to identify these problems and address their shortcomings. To study the development of TIE subsystems, this study calculated the mean value of the comprehensive level of subsystems, which represents the national average level. The difference between the comprehensive level and the mean value was used to evaluate the situation of subsystem development, and whether the development of subsystems was in a balanced state could be clearly observed. Based on a comparison between the evaluation value of the subsystems and their average level, this study classified the development of subsystems into eight types (Table 3).
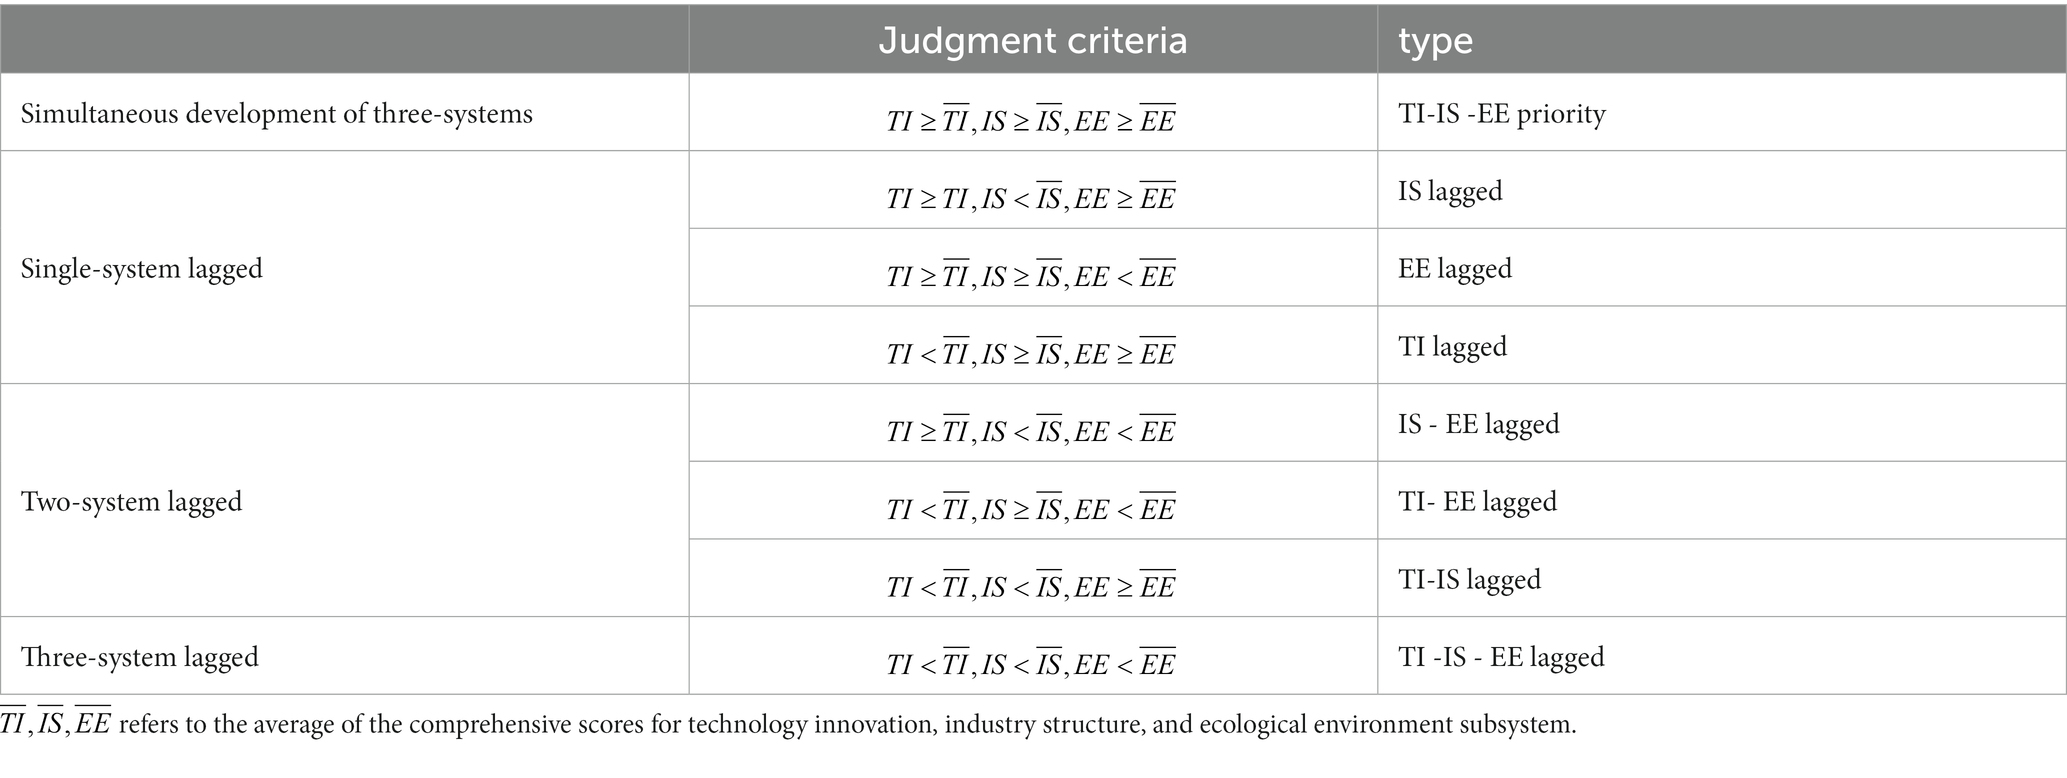
Table 3. Types of subsystem development.
3.2.3. Fixed effects model
The degree of coordinated coping reflects the level of coordinated development of TIE. As a subsystem’s level of development varies, the proportionate relationship between these three subsystems also shifts. This further impacts their levels of coordinated development. The levels of these three subsystems consequently influenced the degree of coupling coordination of TIE.
The CCDM is incapable of reflecting the variable contribution of subsystem development to the overall degree of coupling coordination. This study utilized a panel regression model to examine the impact of the subsystem development level on the CCD across 30 provinces in the eastern, central, and western regions. Based on the preceding investigation, the following panel regression model was developed:
Where D represents the coupling coordination degree of province (city) at year t; is the comprehensive level of the technology innovation subsystem, industrial structure subsystem, and ecological environment subsystem denotes the constant term; parameters represents the elasticity estimates of D with respect to respectively; represents individual fixed effects; represents time fixed effect; represents the random disturbance term.
3.2.4. Fully modified least-squares estimations
There is a complex interaction mechanism between the TIE subsystems. It is difficult to effectively describe the interrelationships between subsystems using a single equation. Therefore, a simultaneous equation system, including technological innovation, industrial structure upgrading, and the ecological environment, was constructed, and the interactive relationships among them were empirically analyzed. The 30 provinces were divided into eastern, central, and western regions for discussion purposes. The influence of technological innovation on the rationalization and advancement of industrial structures is different (Song and Bi, 2020; Wang et al., 2021). This study analyzed the impact of technological innovation, rationalization, and the advancement of the industrial structure and ecological environment. Through the implementation of ER, the government stimulates enterprises to continuously carry out technological innovation and clean production, improve the industrial structure, and reduce pollution emissions. Therefore, the ER variables were added to the simultaneous equations. In this study, the reciprocal of industrial sulfur dioxide and industrial wastewater discharge per unit of industrial output was used to represent the ER. The FMOLS method eliminates the sequence correlation and endogeneity problems and is suitable for small amounts of sample data (Wang and Zhang, 2021; Jin et al., 2022). Therefore, FMOLS was used to solve the following simultaneous equations.
Equation (10) considers technological innovation as the explained variable, examines the influence of industrial rationalization, industrial advancement, and improvement in the ecological environment on technological innovation, and introduces the quadratic term of ER into the model to test the nonlinear relationship between ER and technological innovation. Equation (11) considers the rationalization of industrial structure as the explained variable, examines the influence of industrial advancement, technological innovation, and the ecological environment on industrial rationalization, and introduces the quadratic term of the level of technological innovation and ER into the model, which is used to test the nonlinear relationship. Equation (12) takes industrial advancement as the explained variable, examines the impact of industrial rationalization, technological innovation, and ecological environment on industrial advancement, and introduces the quadratic term of the level of technological innovation and ER into the model to test the nonlinear relationship. Equation (13) considers the ecological environment as the explained variable and examines the impacts of industrial rationalization, industrial advancement, and technological innovation on the ecological environment.
4. Results and discussion
4.1. Trend analysis of the three-system composite index
According to the combined weight method, the comprehensive scores of the three subsystems and the CCD were calculated. Overall, the comprehensive levels of the three subsystems showed a distinct developmental differentiation trend (Figure 3). The comprehensive level of technological innovation was the lowest, but increased each year, rising from 0.0326 in 2003 to 0.1749 in 2019, indicating that China’s technological innovation started late, but its development trend was relatively good. The comprehensive level of industrial structure increased from 0.1093 in 2003 to 0.1501 in 2019, an increase of 37.3285%. The industrial structure underwent tremendous change from 2003 to 2014. By 2015, the proportion of tertiary industries in China had exceeded the sum of the proportion of primary and secondary industries. The ecological environment level showed a downward trend during the observation period, but the overall trend was upward. The CCD trend is rising steadily, indicating that China is paying attention to the interactive development between TIE subsystems in the process of economic development. The CCD of TIE increased by 46.9203%, from 0.2776 in 2003 to 0.4071 in 2019, indicating the rapid development of China’s economy. The level of technological innovation has continuously improved, and the ecological environment has improved over the past 17 years.
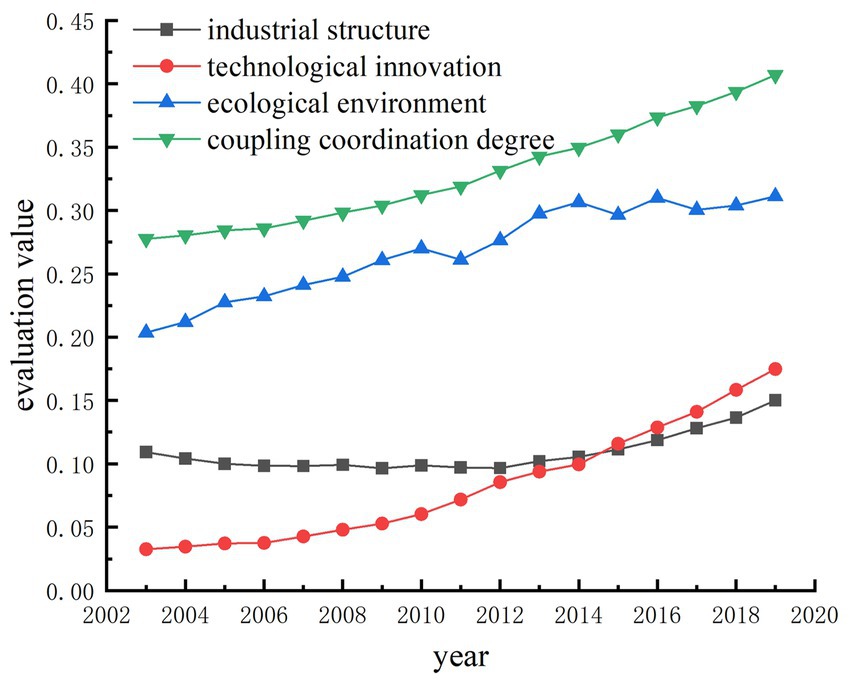
Figure 3. Trends in the comprehensive levels.
4.2. Spatiotemporal differences in the CCD of TIE
4.2.1. Coupling and coordinated development type and evolution pattern
Further study of the distribution characteristics of the CCD of different provinces: Considering the CCD of four time-sections in 2003, 2008, 2014, and 2019 (Supplementary Data Sheet 1), the spatiotemporal evolution of the CCD of 30 provinces (cities) was drawn using ArcGIS 10.8 (Figure 4).
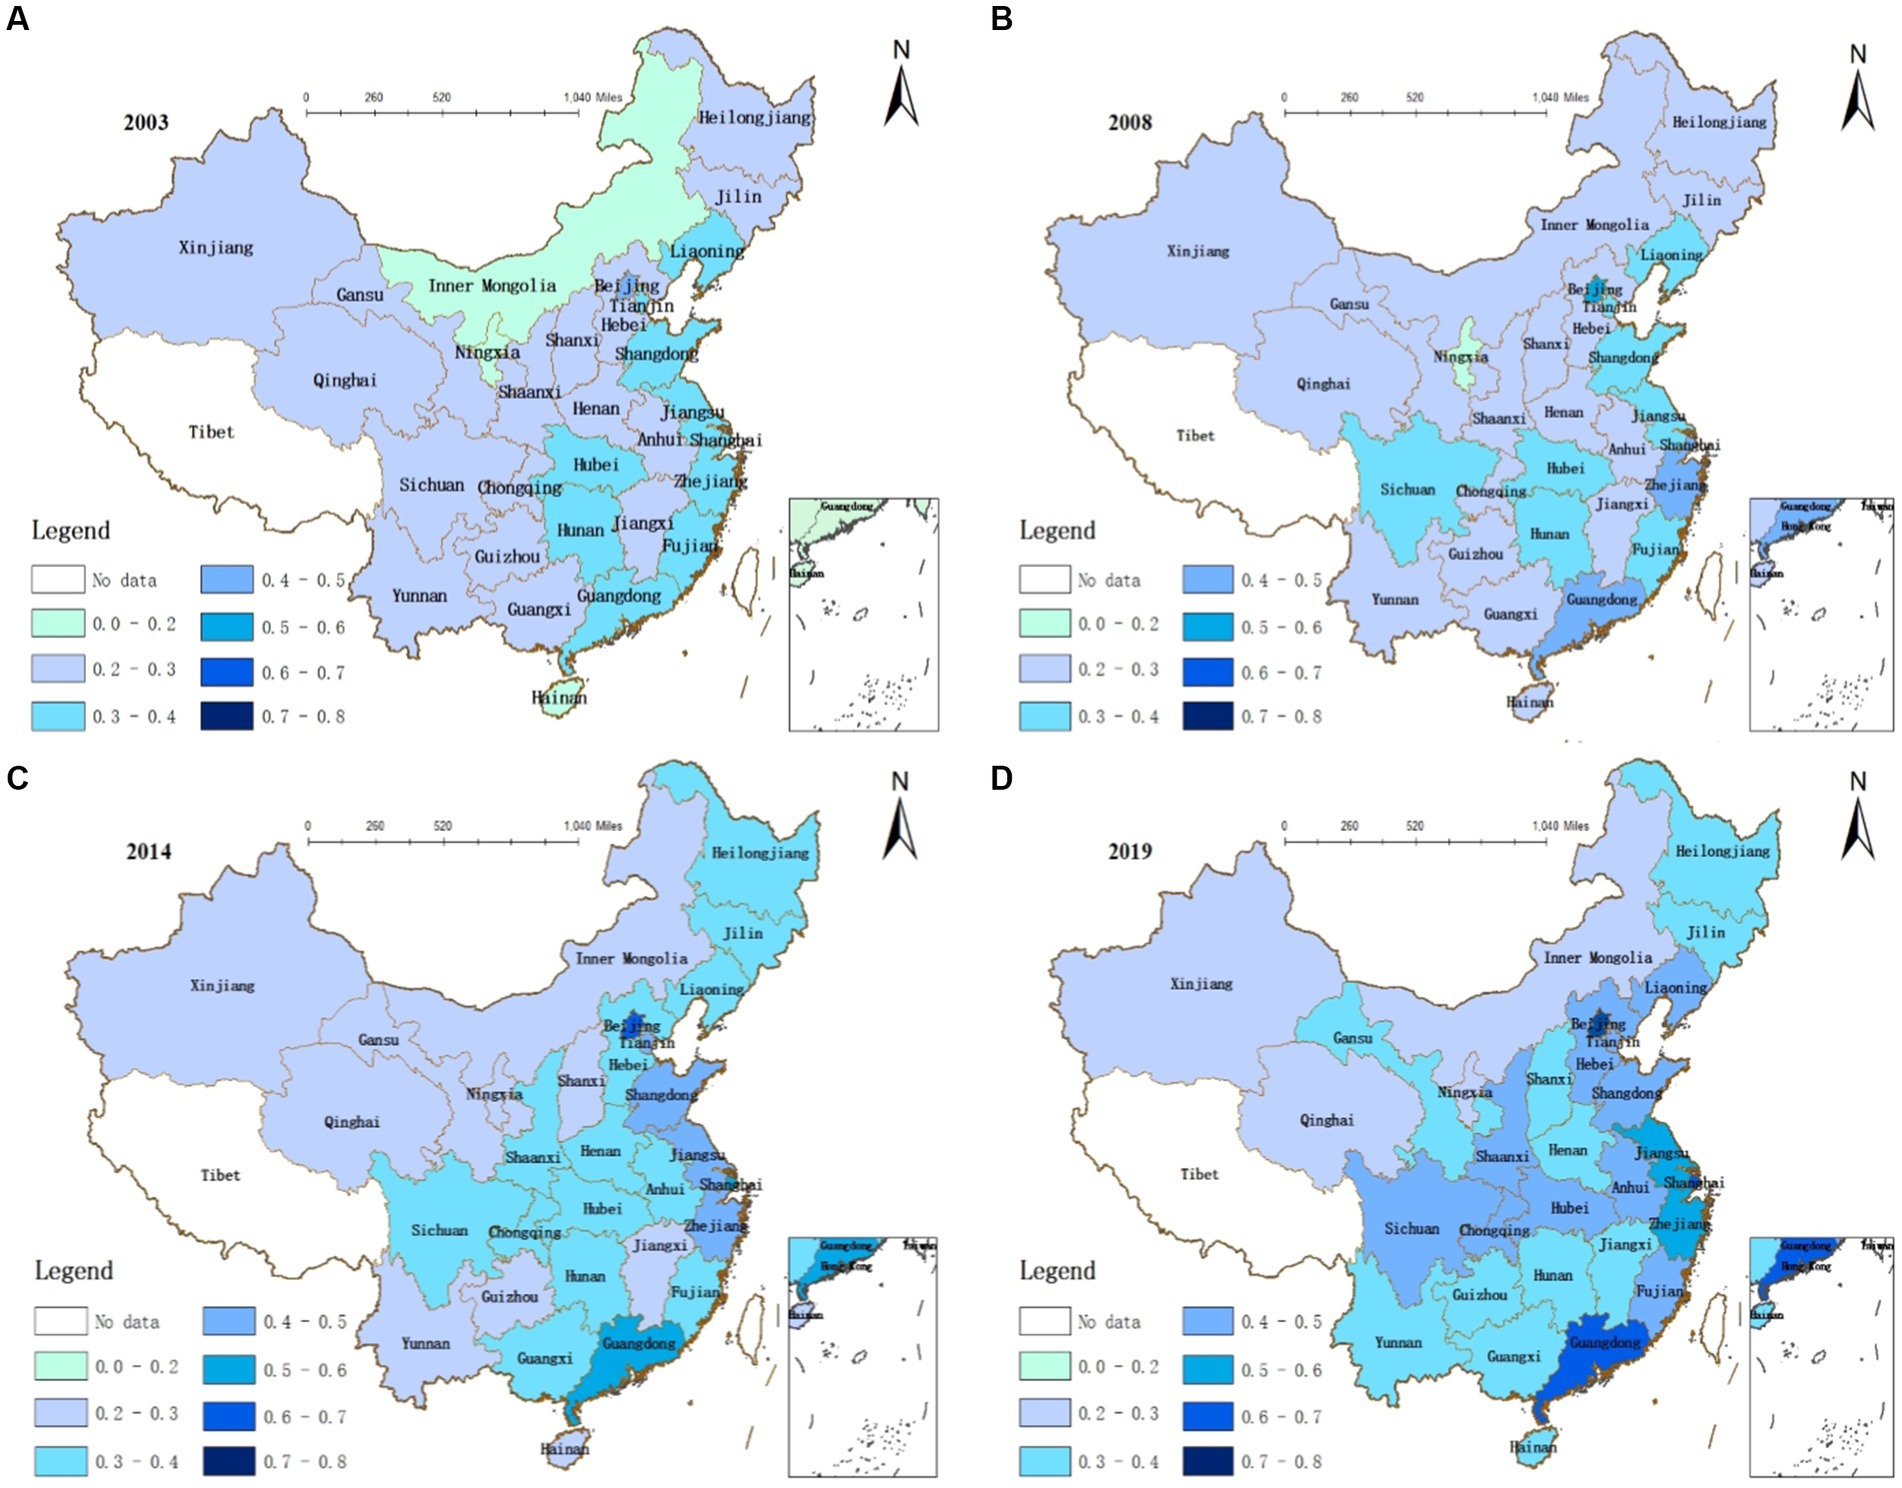
Figure 4. Spatial distribution of the coupling coordination degree in (A) 2003, (B) 2008, (C) 2014, (D) 2019.
From 2003 to 2019, the CCD of TIE steadily improved in all provinces. However, there are differences in the degree of coupling coordination between provinces (cities). In 2003, there were only two CCD stages in various provinces (cities): seriously uncoordinated and slightly uncoordinated. All provinces (cities) in the west were seriously uncoordinated. Hebei and Hainan in the east were in a seriously uncoordinated stage, whereas other eastern provinces (cities) were in a slightly uncoordinated stage. It is worth noting that Hainan and Ningxia are in a stage of serious imbalance. The levels of technological innovation in Hainan, and ecological environment in Ningxia are the lowest in the country. The spatial pattern of the CCD of the TIE was east high, central level, and west low. By 2008, the pattern of coordinated TIE development had not significantly changed. The provinces (cities) with slightly uncoordinated development were still concentrated in the east, which is in a very unbalanced state overall, with the gap between the high and low CCD values further increasing. Beijing is in a stage of barely coordinated development owing to the rapid development of industry and technology. Sichuan is in a slightly uncoordinated stage, whereas other provinces (cities) in the western China are still seriously uncoordinated. It is worth noting that the coordinated development level of TIE in Qinghai in 2008 is lower than that in 2003, the reason is that the level of industrial structure and technological innovation in Qinghai is lower than that in 2003. In 2014, the number of intermediate uncoordinated provinces (cities) decreased with slightly uncoordinated development becoming mainstream. Shanghai and Guangdong were barely coordinated. In the eastern region, the lowest CCD of Hainan Province was 0.260, and its technological innovation ability has become a shortcoming of coordinated development. As of 2019, only Qinghai, Ningxia, Xinjiang, and Inner Mongolia are in the seriously uncoordinated stage. Shanghai, Jiangsu, Zhejiang, and Guangdong barely coordinated. Beijing has entered the stage of high-quality coordination. The coordinated development level of TIE in Beijing was far ahead of that in other provinces (cities) during the observation period. The coupling-coordinated levels of TIE in Shanghai, Jiangsu, Zhejiang, and Guangdong also began to lead to other provinces (cities) from 2008 to 2019.
By comparing Figures 4A–D, it can be observed that Guangdong had the largest change, with the CCD rising from 0.3619 in 2003 to 0.6128 in 2019, an increase of 69.33%. The score of the technological innovation subsystem is relatively low compared to the comprehensive scores of the subsystems. The level of technological innovation in Guangdong has greatly improved with economic development, and its comprehensive score in 2019 was 0.6874 compared with only 0.064 in 2003. Qinghai is in the intermediate uncoordinated stage; its industrial structure and technological innovation levels were at the bottom for the country during the four observation periods. Overall, provinces (cities) with a higher degree of coupling coordination demonstrated higher levels of technological innovation.
4.2.2. Evolution pattern of subsystem development types
The development of subsystems was divided into eight types. Four time-sections of 2003, 2008, 2014, and 2019 were selected in this study to examine the distribution type of each subsystem and were visually expressed using ArcGIS 10.8 (Figure 5).
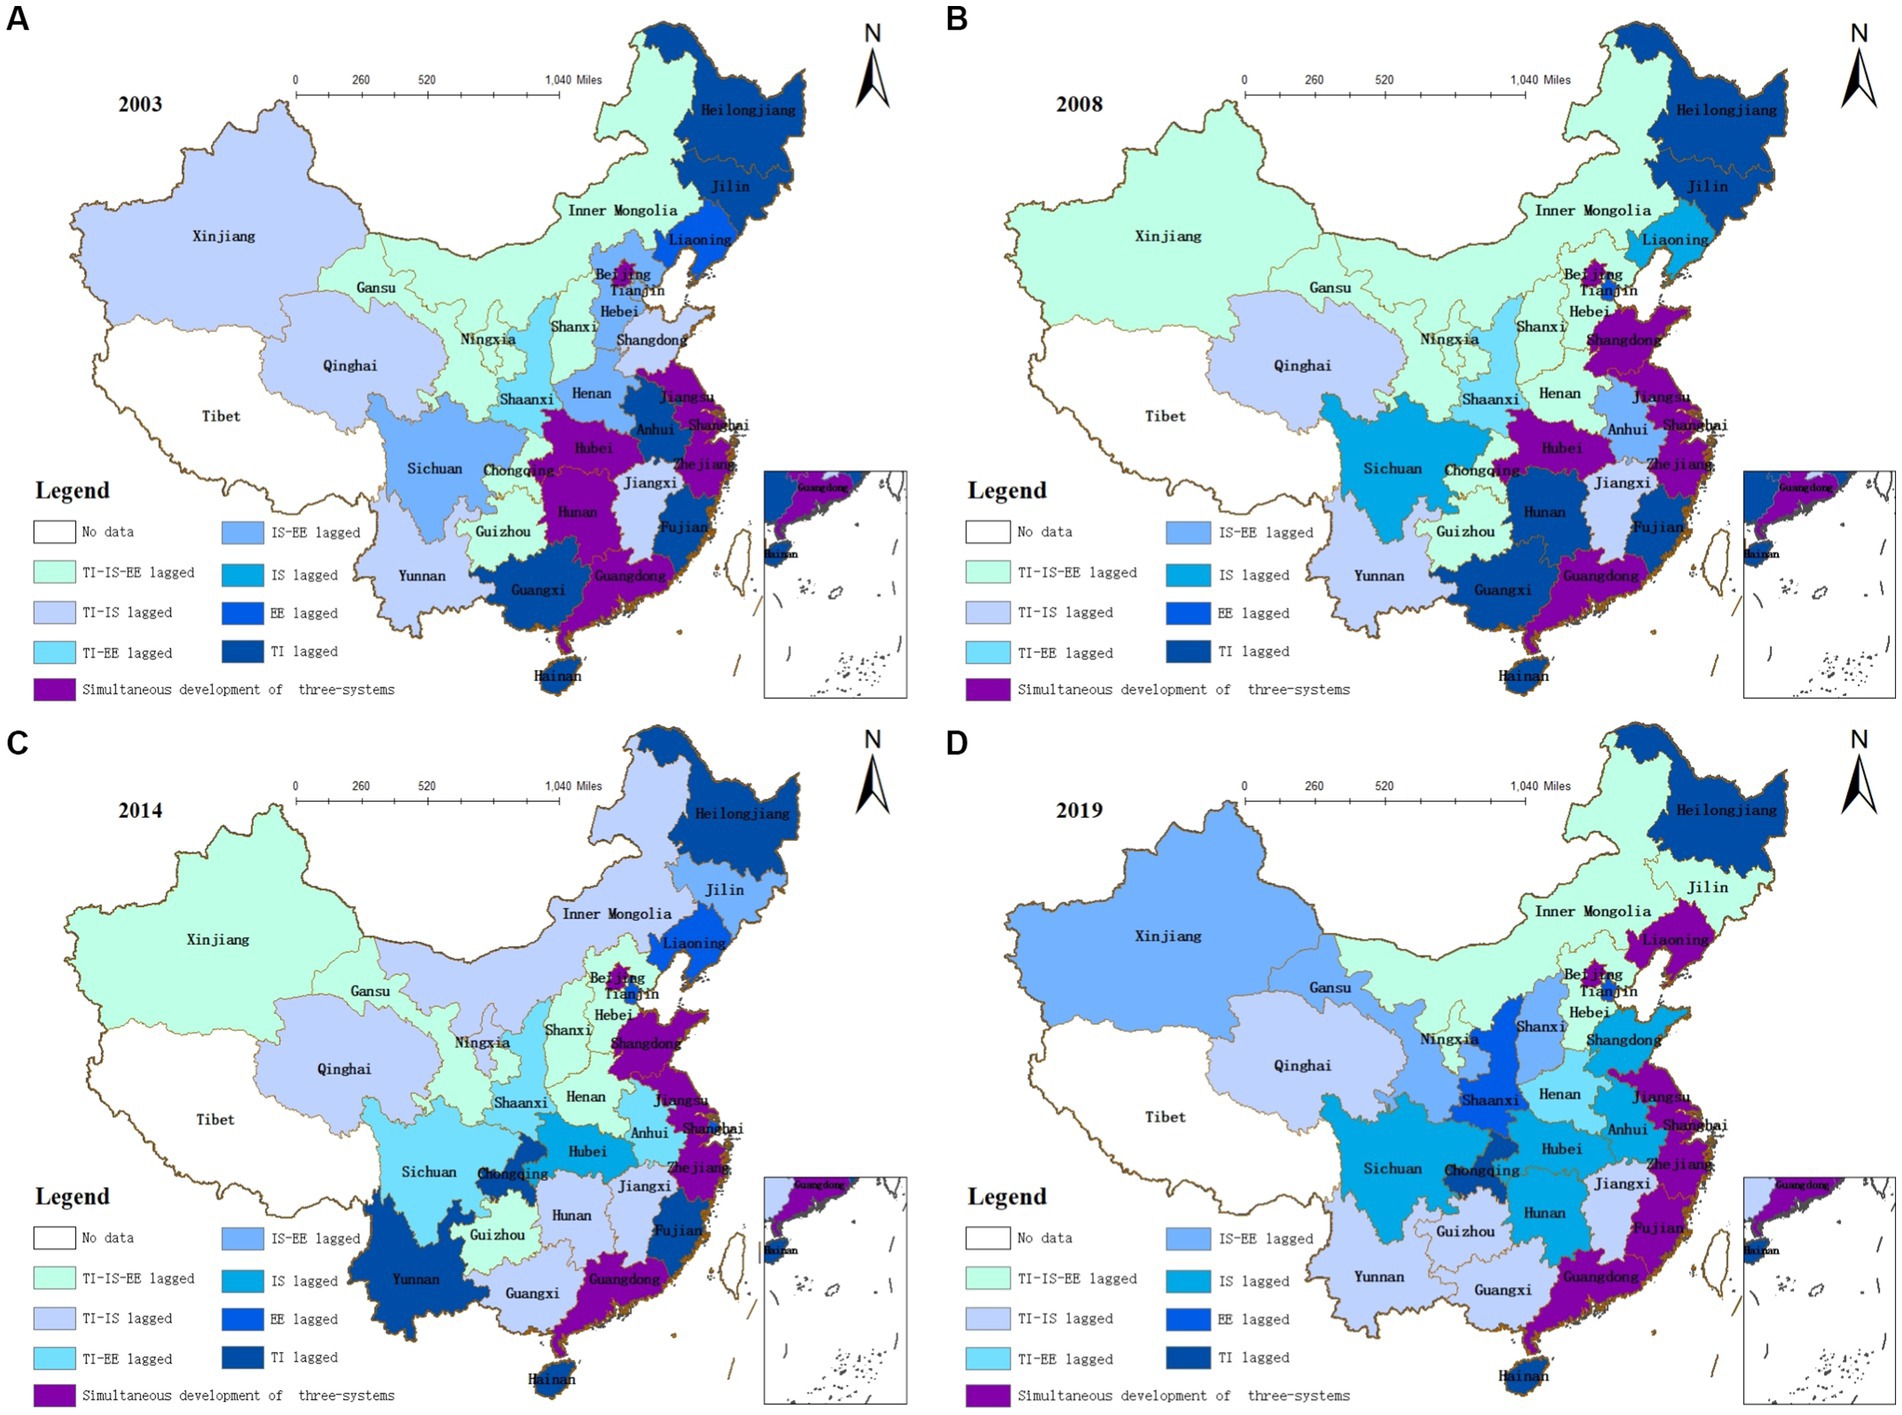
Figure 5. Spatial distribution of subsystem development types in (A) 2003, (B) 2008, (C) 2014, (D) 2019.
In 2003, the spatial distribution pattern of subsystem development was like that of CCD. Provinces (cities) with synchronized development of the three systems are concentrated in the eastern and central regions. Provinces (cities) with a three-system lag were mainly concentrated in the western regions. In 2008, the number of provinces (cities) with three-system lags was higher than in 2003. The rapid development of some provinces (cities) increased the average comprehensive score of the subsystems, resulting in more provinces (cities) with three-system lags, and the provinces (cities) with three-system synchronous development and single-system lags were mainly concentrated in the east. The western and central regions have insufficient industrial development momentum and do not provide adequate support for technological innovation. The unbalanced development gap of subsystems in the three major regions and various provinces (cities) of China has increased. The level of technological innovation in Hunan was lower than the national average, and the development of the technological innovation subsystem lagged. The comprehensive level of Shandong’s industrial structure was higher than the national average, and the three systems have been developed simultaneously. In 2014, there was little change in the evolution patterns of the subsystem development types. All provinces (cities), with simultaneous development of the three systems, are concentrated in the east. Shanghai has experienced rapid economic development in the past 5 years but has ignored the improvement of the ecological environment. The industrial structure level of Hubei is lower than the national average and has developed into an industrial structure lag type. The leading positions of Beijing, Jiangsu, Zhejiang, Shandong, and Guangdong in the simultaneous development of these three systems remained unchanged. After 5 years of development, the lagging problem of the three systems was alleviated. In 2019, seven provinces (cities) with the simultaneous development of the three systems were concentrated in the east, and only Hebei had a three-system type lag. Although the development level of the subsystems in Jilin has improved, it is still lower than the national average. Fujian attaches great importance to technological innovation and developed from “TI lagged” in 2014 to three-system synchronization development. Gansu from the “three-system lagged” in 2014 to “TI-EE lagged” with the rapid development of the economy. The problem of the three-system lag was further alleviated.
Comparing Figures 5A–D, reveals that in the northeast region, the level of technological innovation in Liaoning is higher than that in the other two provinces, and technological innovation plays an important role in promoting the upgrading of industrial structure and ecological improvement. After 2008, technological innovations in Henan and Hunan exceeded the national average. The technological innovation impetus of Hainan is insufficient, and it belongs to the “TI lagged” category in the four observation points. The overall level of the ecological environment in the southwestern region was relatively high. Shaanxi’s technological innovation level is the highest among the five provinces in the northwest.
4.3. Fixed effect model
Table 4 displays descriptive statistics for all model variables. First, a panel unit root test is conducted to determine the stability of the variable sequence. The most prevalent tests for determining the unit root of panel data are the LLC test, Breitung test, Hadri test, IPS test and Fisher test (including ADF Fisher and PP Fisher test). The LLC, Breitung, and Hadri tests assume that the series has a standard AR structure, implying the same root. The IPS and Fisher tests, on the other hand, assume that the series have distinct AR structures, resulting in different roots. In this study, the unit root test was conducted using six techniques. Among them, Breitung test assumes there is cross-sectional dependence. The other five tests hypothesized no cross-sectional dependence. Therefore, to alleviate the possible cross-sectional dependence, when conducting LLC, Hadri, IPS and Fisher tests, the panel data were first subtracted cross-sectional means, and then perform the test (Levin et al., 2002). The results of panel unit root testing are shown in Table 5. The results indicate that all variables are differentially stationary on the first order. The KAO panel test examines the co-integration connection between degree of coupling coordination and all explanatory factors. The significance of the ADF test data is displayed in Table 6. The VIF test for each explanatory variable reveals a maximum VIF of 1.82 (<5), indicating that the multicollinearity issue may be disregarded in the estimation findings. The F-test and Hausman test results in this paper indicate that the fixed effect model should be used to analyze the effects of technological innovation, industrial structure, and ecological environment on the degree of coupling coordination in all 30 provinces, and in the eastern, central, and western regions (Table 7).
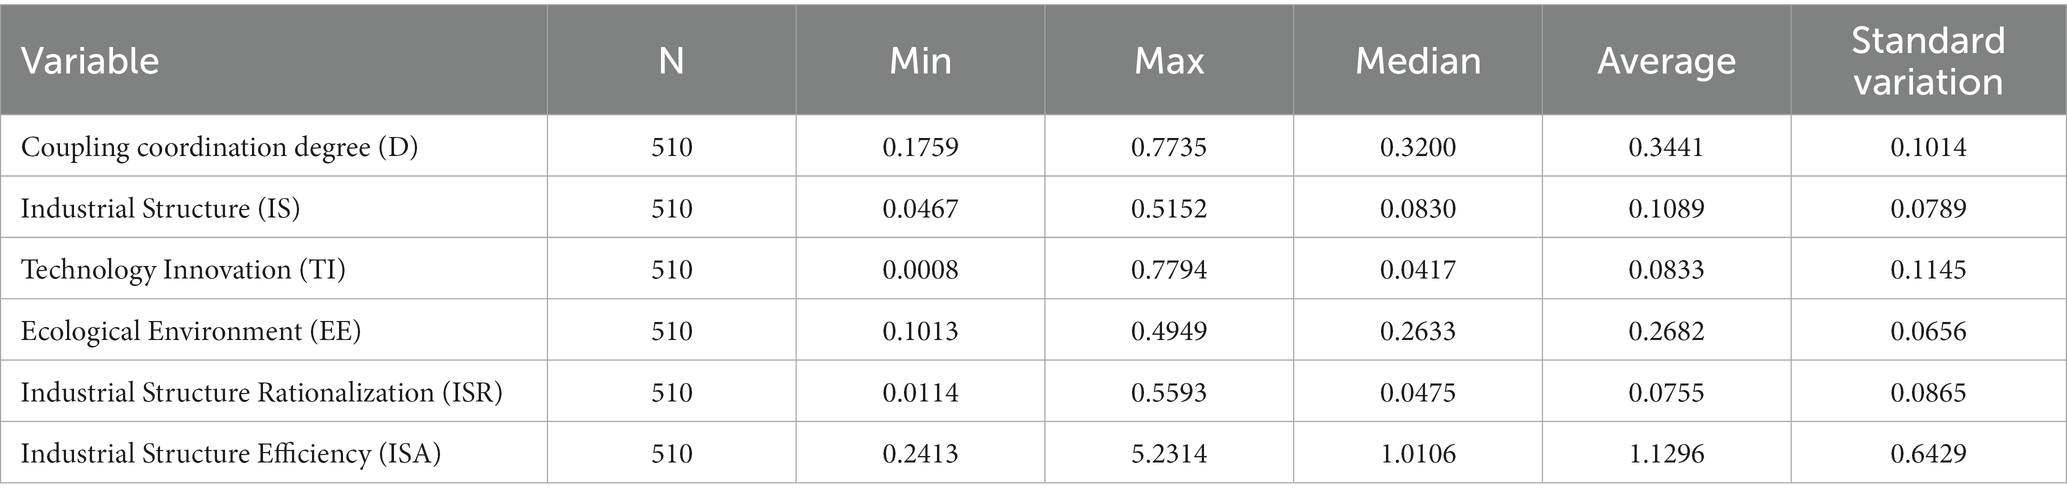
Table 4. Descriptive statistics of variables.
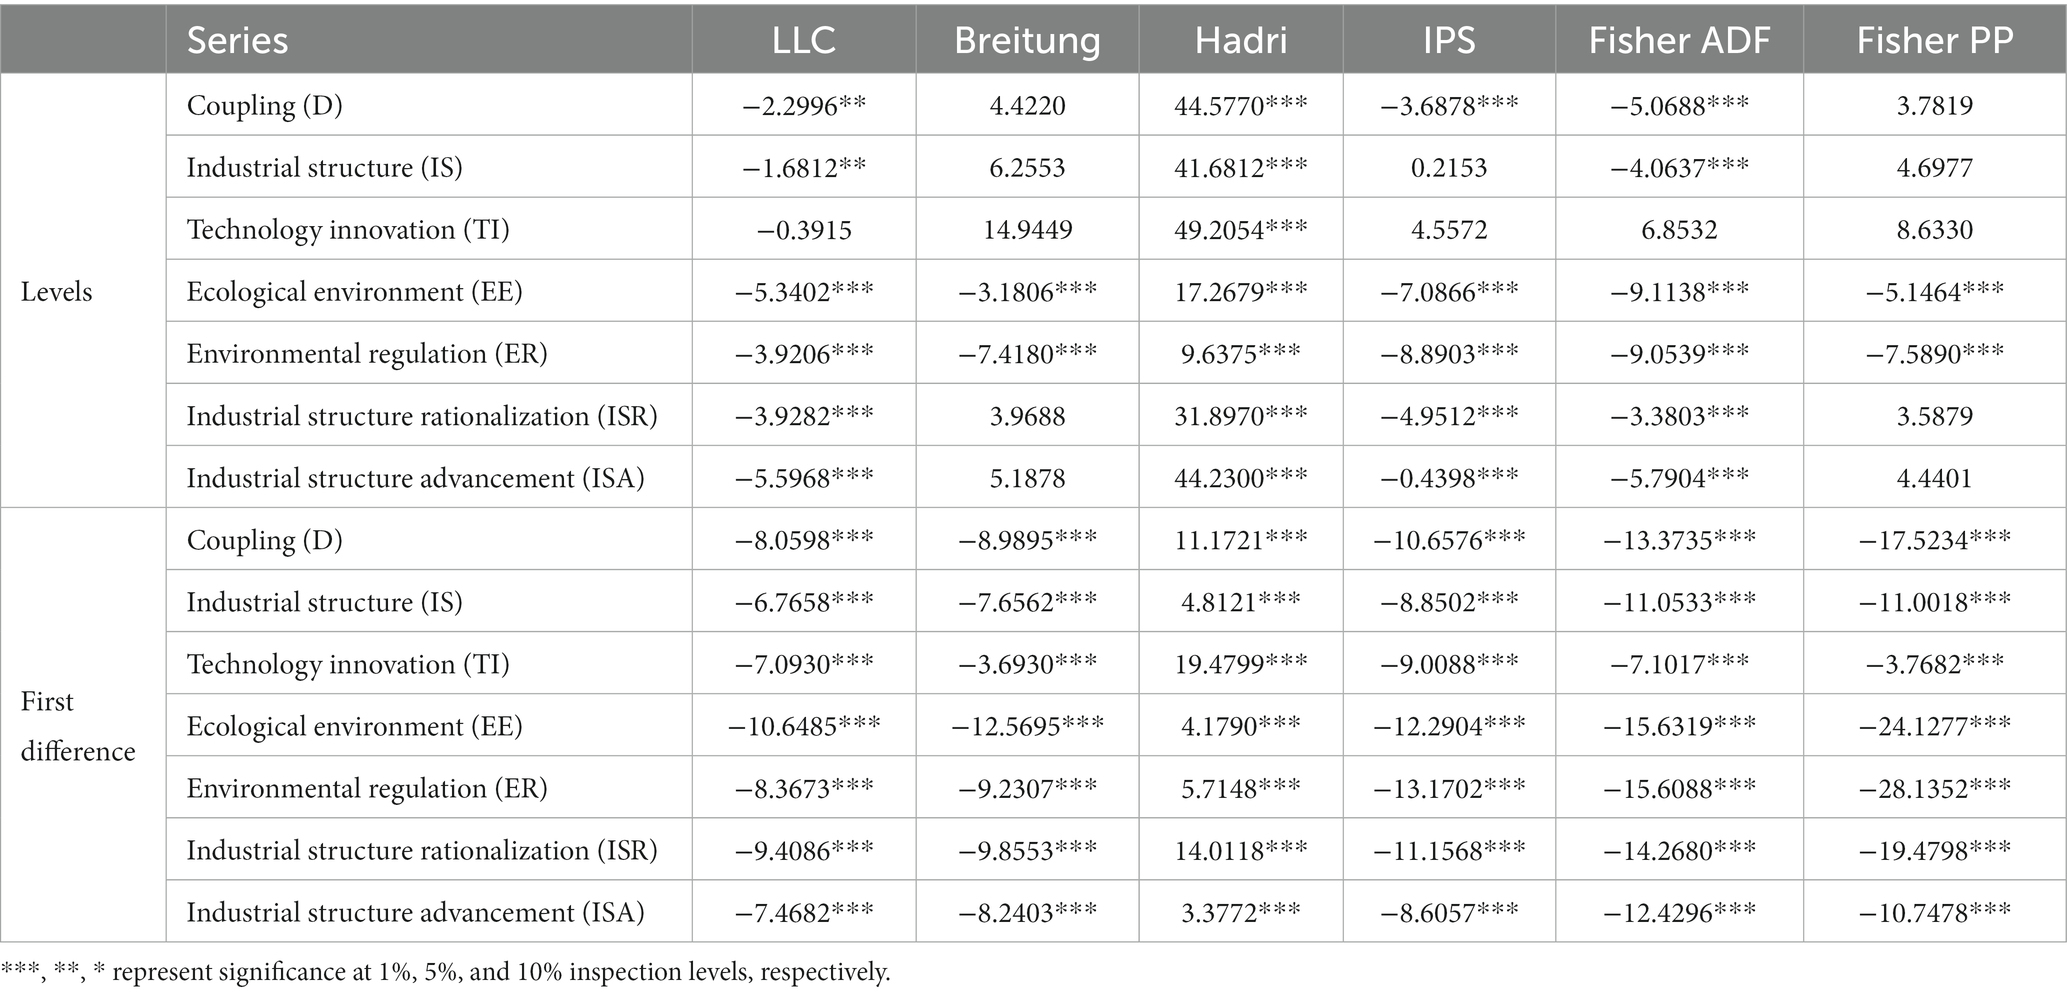
Table 5. Result of panel unit root tests.
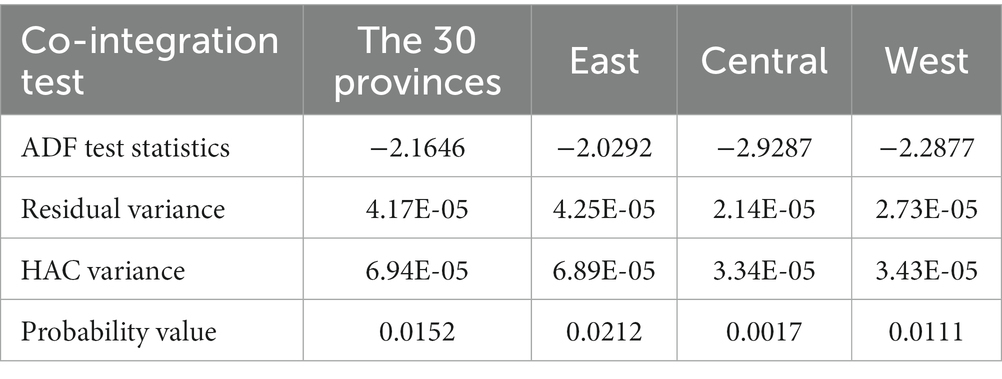
Table 6. Kao panel co-integration test.
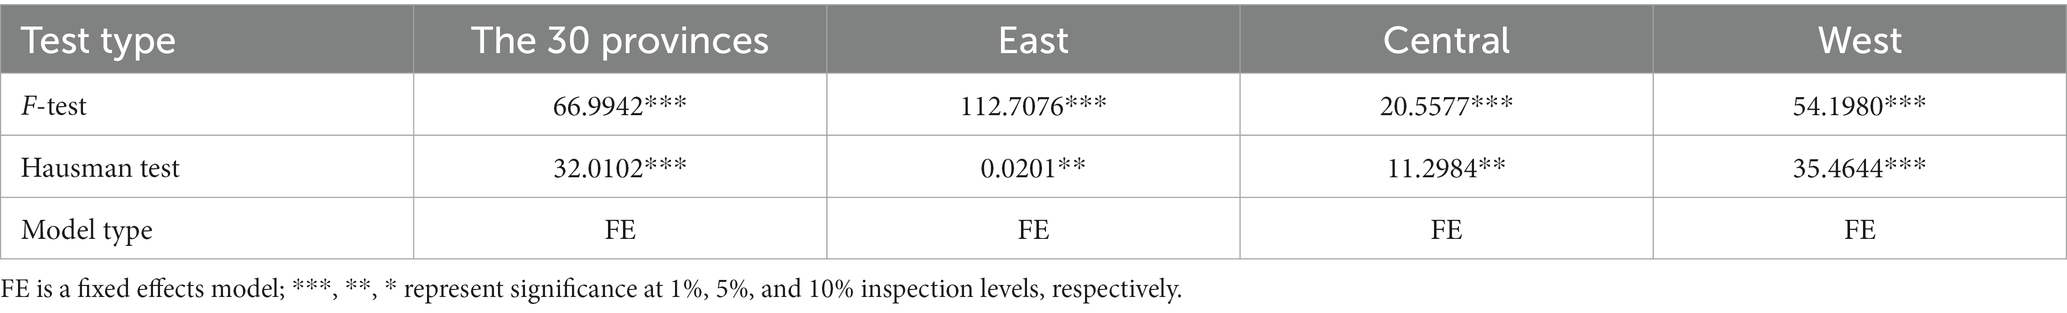
Table 7. Panel data model selection.
Table 8 presents the estimation results of whether technological innovation, industrial structure, and the ecological environment have significantly positive influences on the coupling coordination level in the 30 provinces collectively, or in the three regions. Nationally, the elasticity of the ecological environment was the greatest (0.6812), indicating that a 1% increase in the level of the ecological environment would lead to a 0.9383% increase in the CCD when other factors remained constant. The elasticity of the industrial structural level is the lowest (0.3218). The results revealed that improvement in the ecological environment was the main contributor to the increased CCD of TIE in all 30 provinces, the level of technological innovation was the second highest, and the industrial structural level was the lowest. The ecological environment was the main contributor to the increase in CCD in the eastern region, followed by the industrial structure, and technological innovation had the least contribution. In the central region, improvement in CCD was mainly caused by technological innovation, followed by the level of ecological environment development, and industrial structure had the least impact. The level of technological innovation in the western region is the main reason for improving the coupling coordination degree, followed by the level of industrial structure. The impact on the ecological environment is the least important reason. Whether across the whole country or in the three regions, the elasticity difference of the subsystem development level to CCD is statistically significant.
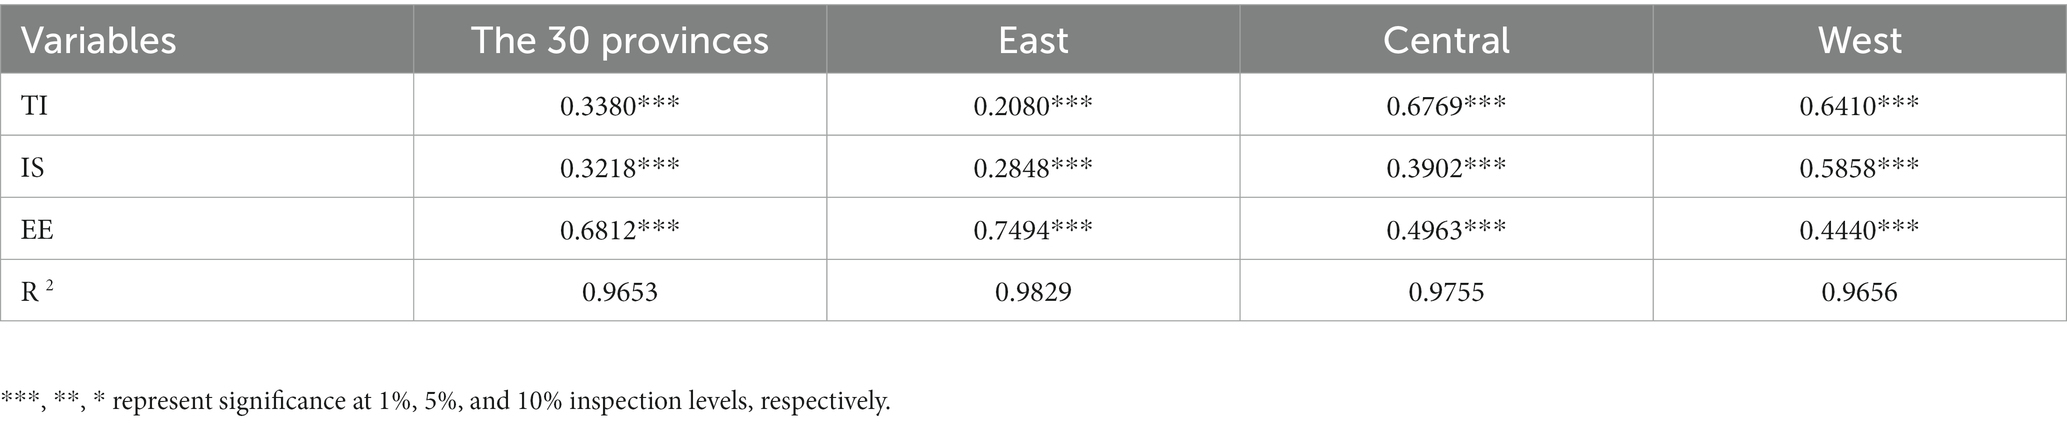
Table 8. Panel regression model estimation results.
4.4. Fully modified least-squares model
4.4.1. Fully modified least-squares estimation results
As indicated in the preceding section, descriptive statistics were computed on the necessary variables, and the stability of the variable sequence was examined. Using the KAO panel test, the connection between the dependent and independent variables was examined. The greatest VIF for each explanatory variable was 1.98 (5), indicating that the multicollinearity issue may be disregarded. Table 9 displays the results of the approximated cointegration equations for the FMOLS.
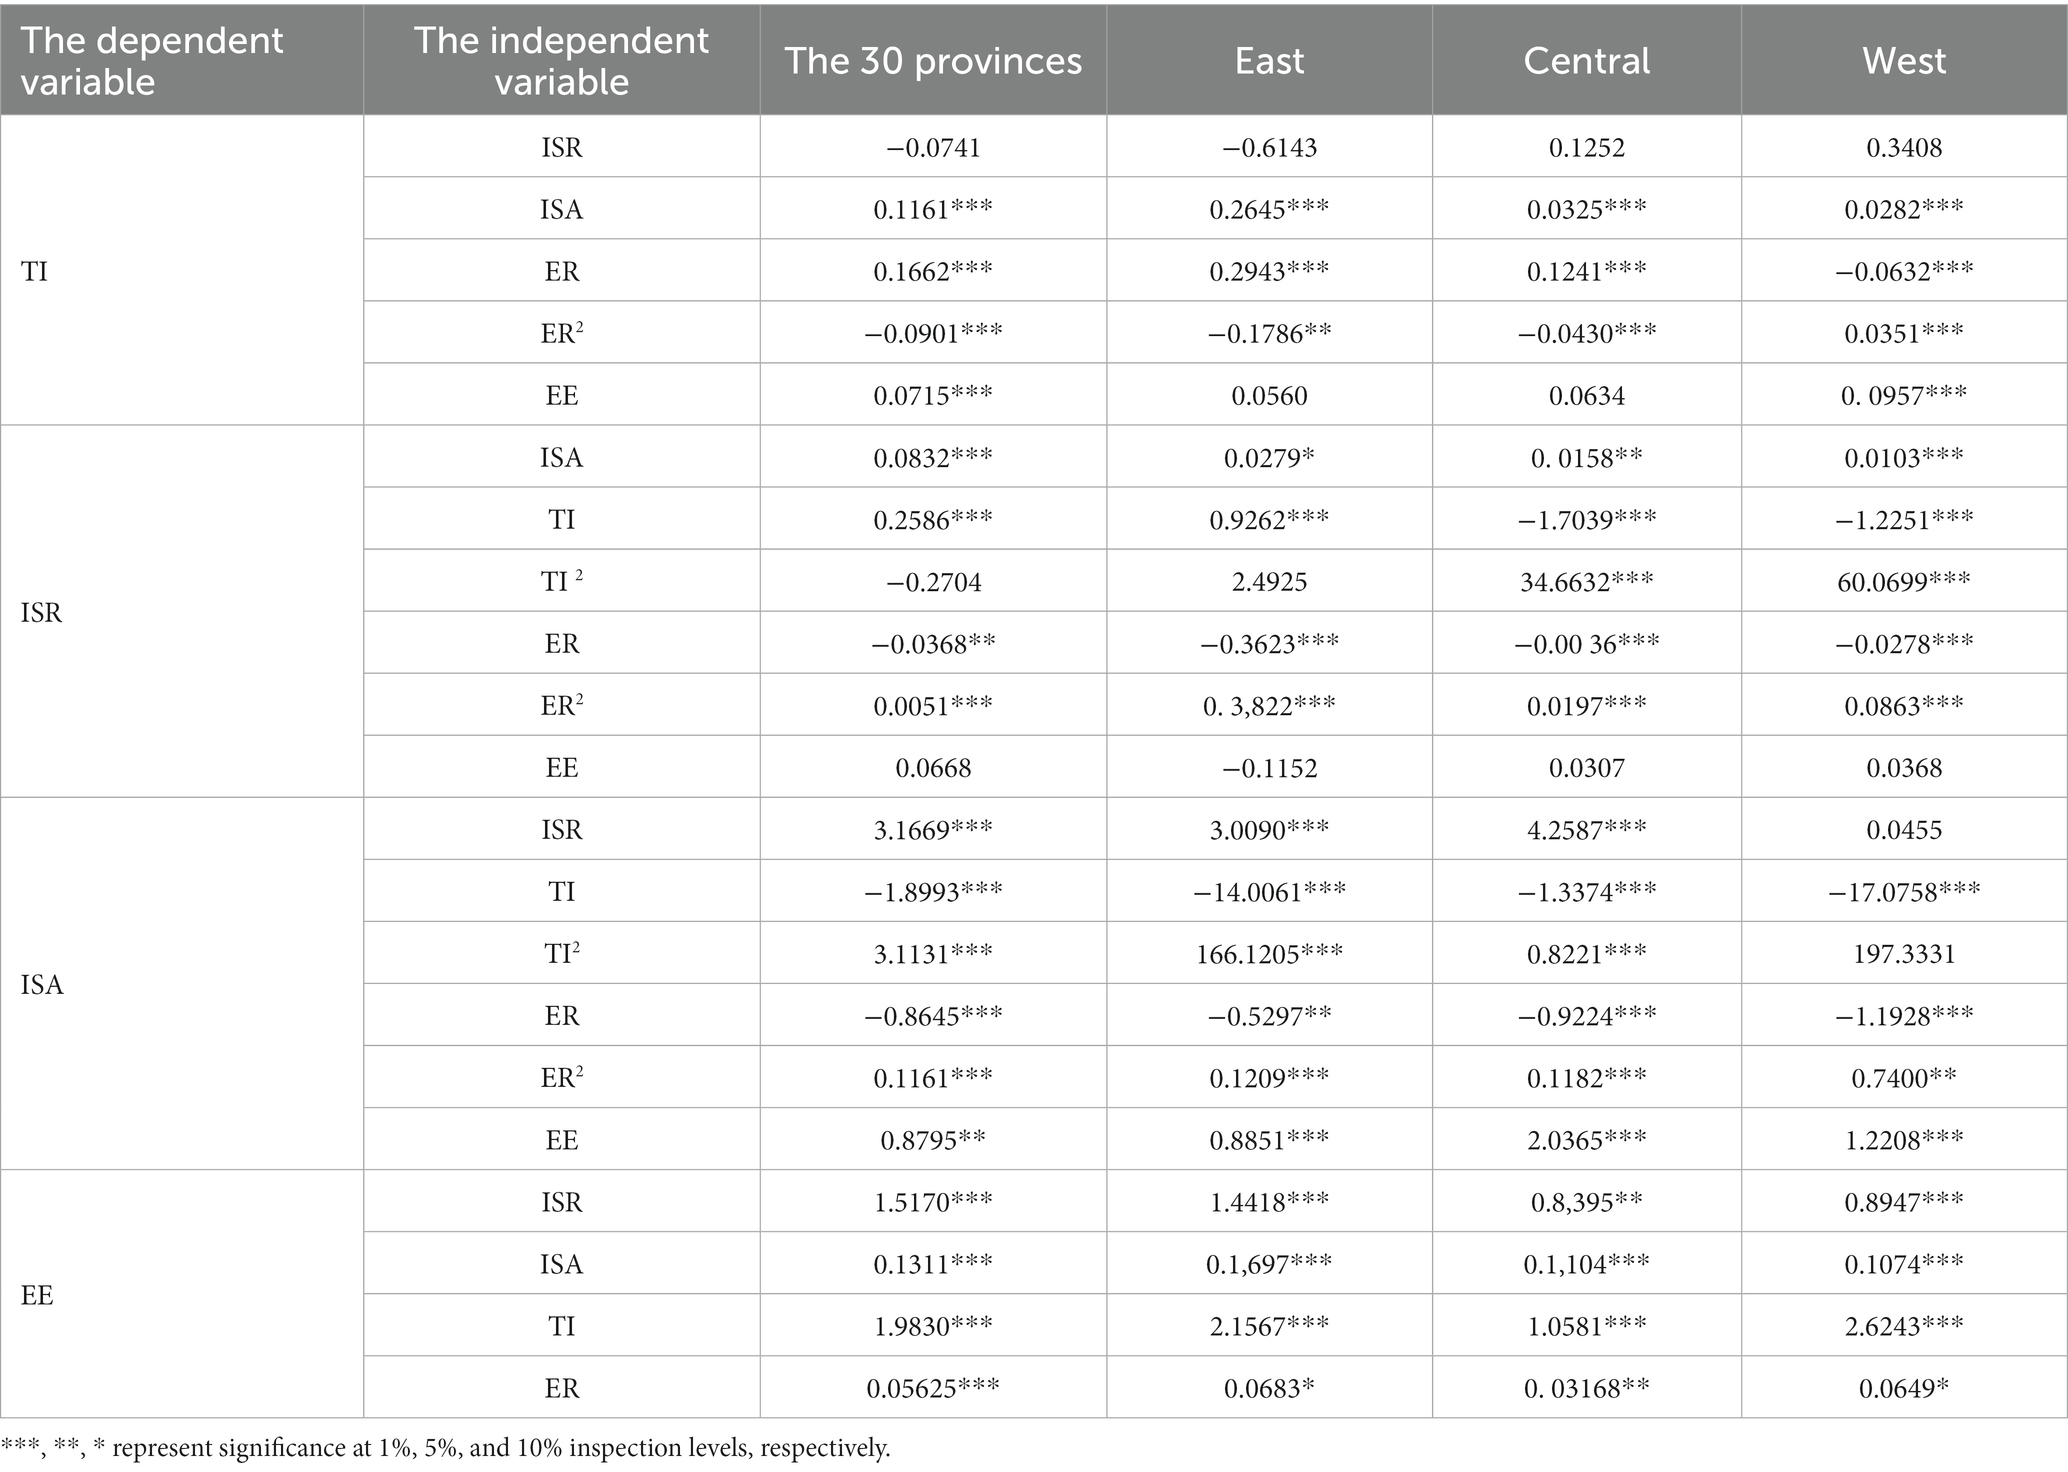
Table 9. Equations based on FMOLS regression results.
1. At a significance level of 1%, industrial advancement had a positive impact on technological innovation in 30 provinces as a whole, and in the eastern, central, and western regions. It demonstrates an inverted “U”-shaped relationship between ER and technology innovation in eastern and central China, which supports the “Porter Hypothesis.” A “U”-shaped relationship was identified between ER and technology innovation in the western region. A possible reason is that when ER is in the developing stage in the western regions, the government’s awareness of environmental protection is relatively lacking. When the ER intensity is relatively low, enterprises prefer to follow specific pollution spending to reduce pollutant emissions instead of pursuing technological progress. When the intensity of ER is relatively high, the pollution management cost of enterprises further increases, compelling them to achieve the goals of saving energy and reducing emissions through science and technological innovation.
2. Industrial advancement has a significantly positive impact on industrial rationalization in all 30 provinces, and in the eastern, central, and western provinces. Technological innovation has a “U”-shaped impact on industrial rationalization in the central and western regions, which first inhibits and then promotes. In the long term, technological innovation can effectively promote industrial rationalization. At the significance level of 5%, ER and industrial structure rationalization showed a “U”-shaped impact that first inhibited and then promoted in all 30 provinces, and in the eastern, central, and western provinces, indicating that with the increase in ER intensity, the technological innovation level of enterprises improved, improving resource utilization efficiency and the factor input–output ratio.
3. A “U”-shaped relationship was found between technological innovation and industrial advancement in all 30 provinces, and in the eastern, central, and western provinces, but this relationship was not statistically significant in the west. ER and advanced industrial structure follow a “U”-shaped relationship in all 30 provinces, and in the three regions, indicating that with the increase in the intensity of ER, pollution-oriented industries changed their management style from “end-control” to “source-control” treatment, promoting the advancement of industrial structure. Improvements in the ecological environment play a significant positive role in promoting industrial advancement. In areas with a better ecological environment, the local government has not weakened the intensity of ERs owing to improvements in the ecological environment. To maintain a good local ecological state and prevent the emergence of ecological environmental degradation, the government will continue to maintain governance of the ecological environment.
4. At a significance level of 1%, industrial rationalization, industrial advancement, and technological innovation can promote the improvement of the ecological environment in all 30 provinces, and the eastern, central, and western provinces. The impact of ER on ecological environment improvement in all 30 provinces, and in the three regions, is significant at the 10% level. This shows that governments can not only improve the ecological environment through ER, but also impact the investment behavior of enterprises, “forcing” some high-polluting enterprises to promote industry structural upgrading by shutting down outdated production facilities, carrying out the technological transformation, improving production technology and other measures, reducing pollutant emissions, and effectively promoting the improvement of the local ecological environment.
4.4.2. Robustness test
Considering the data availability of the variables, this study adopted the method of replacing the variables to conduct a robustness test. In addition to the reciprocal of industrial sulfur dioxide and industrial wastewater discharge per unit of industrial output value, the ratio of investment in industrial pollution control to industrial added value can also effectively measure environmental regulation intensity. Table 10 shows the regression results of FMOLS, which uses the ratio of industrial pollution control investment to industrial added value to represent the environmental regulation variables. The results of the robustness test are basically consistent with those of the previous analysis, indicating that the empirical results in Table 9 are robust.
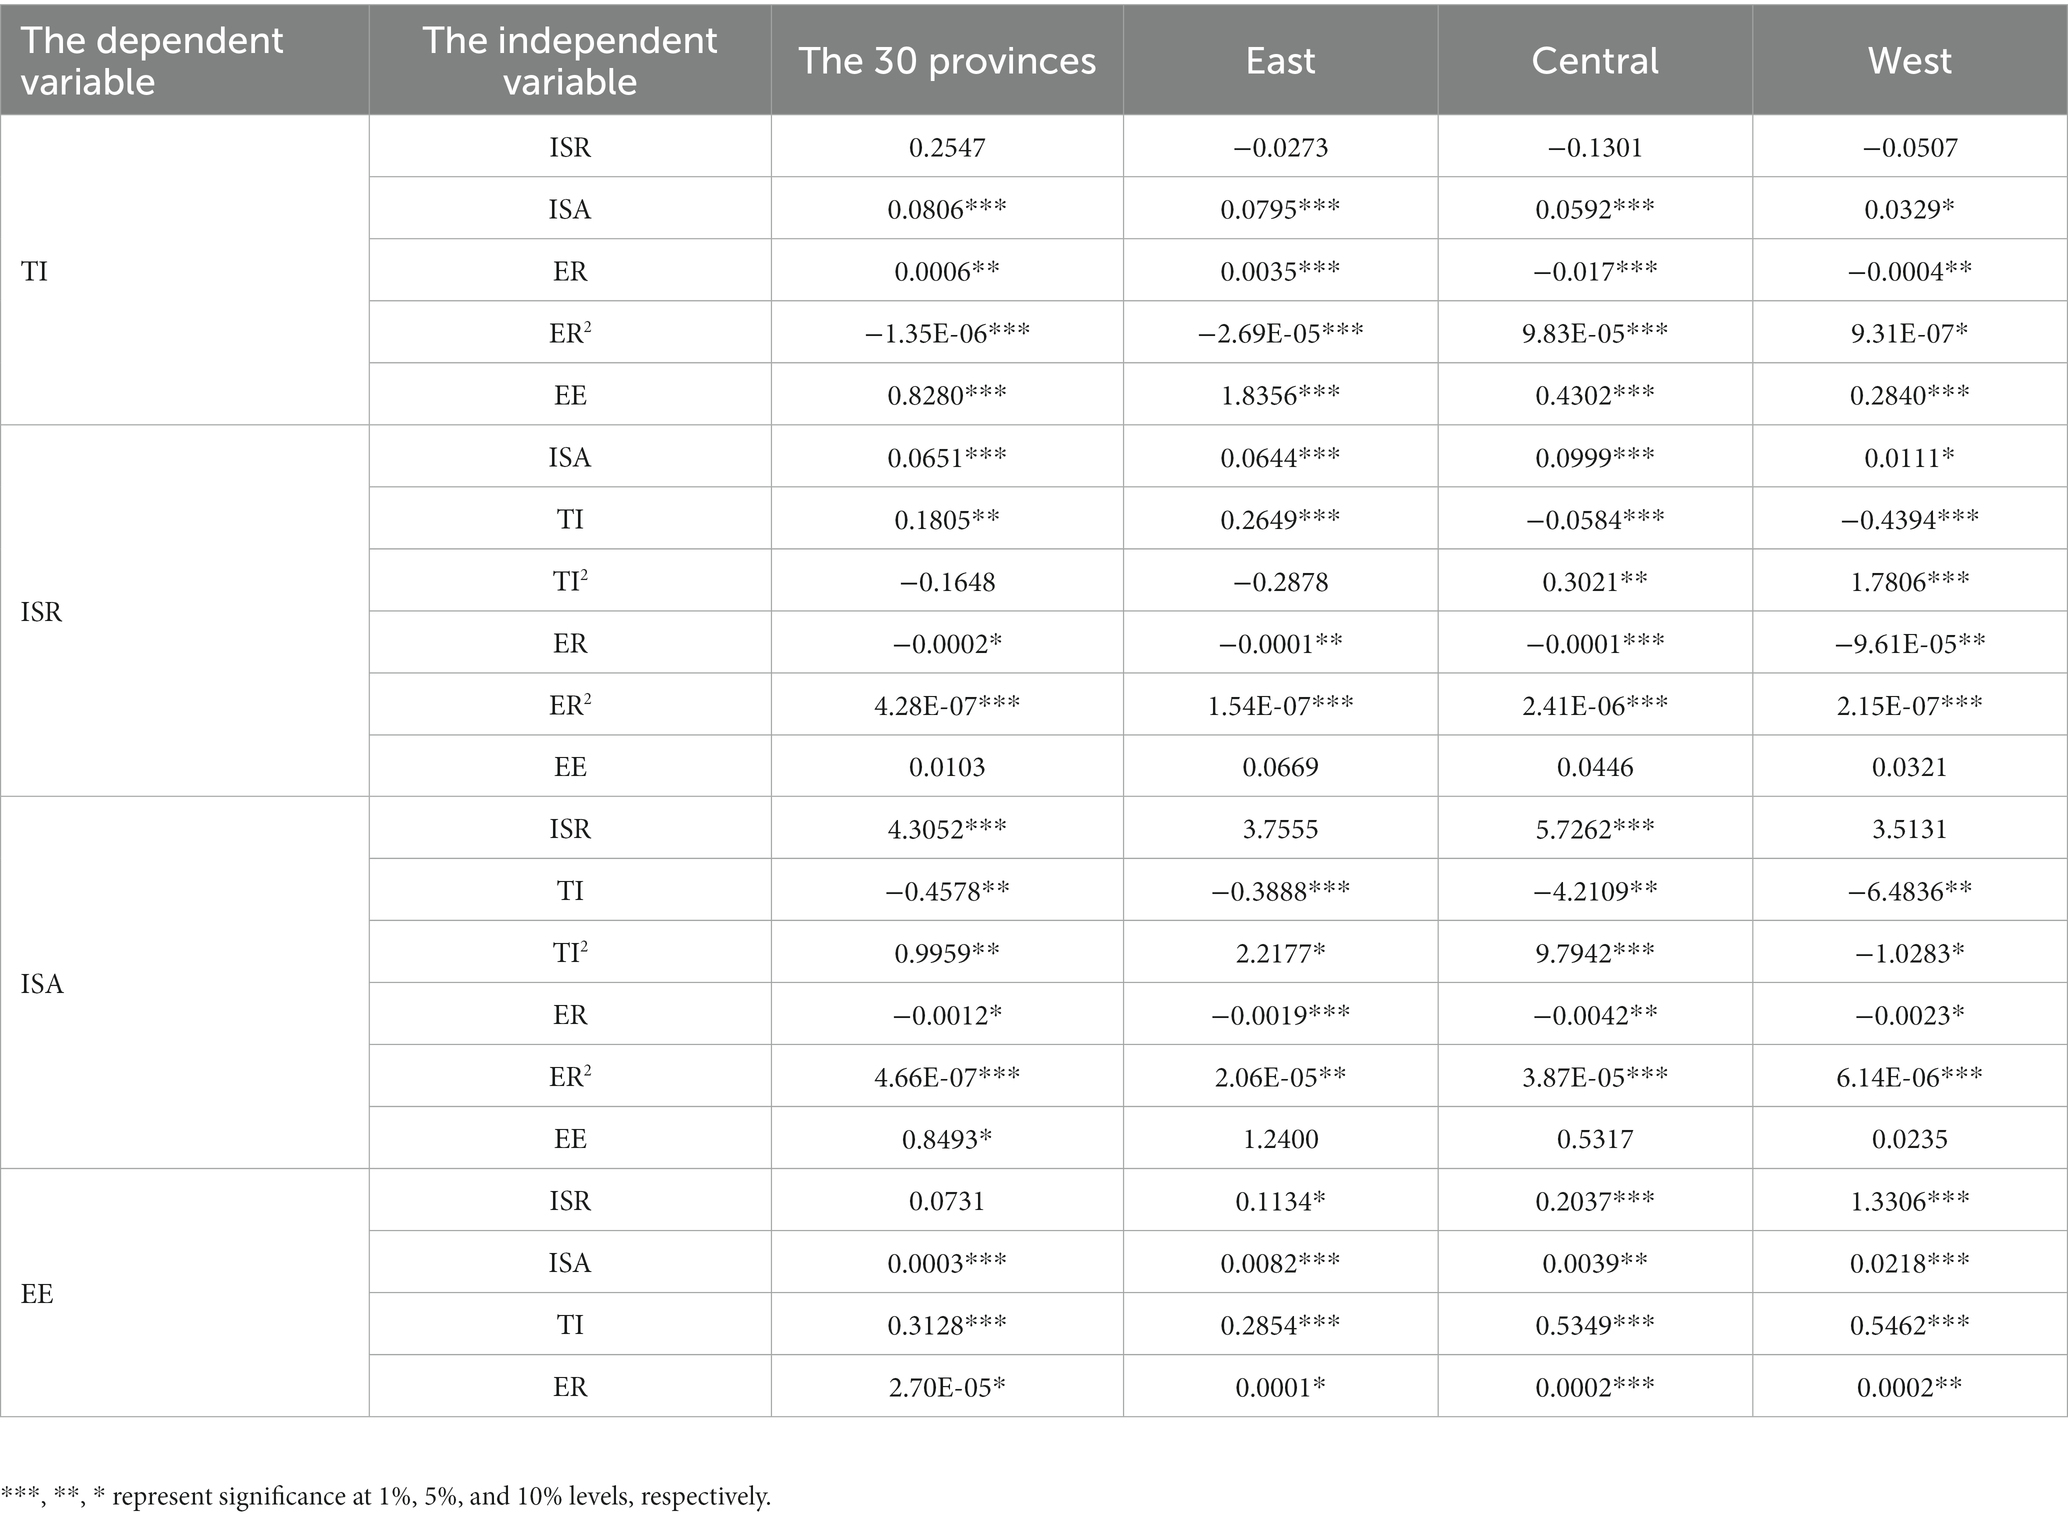
Table 10. Robustness test of results.
4.5. Discussion
Based on the results of section 4.4, we find that:
In the long run, the effect of industrial structure rationalization on technological innovation is not statistically significant for all 30 provinces and in the three (eastern, central, and western) regions. However, regardless of all 30 provinces, and the eastern, central, or western regions, the upgrading of industrial structure significantly promoted regional innovation, which is consistent with the results of Sun et al. (2022). The regression coefficient showed a declining east to west trend. This shows that industrial development can provide impetus and conditions for technological innovation. There is an inverted “U”-shaped relationship between environmental regulation and technological innovation in the central region, which is inconsistent with the results of Song et al. (2019). Before the turning point, environmental regulation in these regions motivates enterprises to develop green technological innovation. After the turning point, when environmental regulation is further strengthened, it imposes a burden on firms and reduces their innovation output.
In the long run, technological innovation plays a significant positive role in promoting the rationalization of industrial structures. This shows that the improvement in technological innovation level is conducive to the rational allocation of production factors and the coordinated development of various industries. There is a “U”-shaped relationship between technological innovation and the advancement of industrial structure in all 30 provinces (Song et al., 2019), this is consistent with the result of this study. The increase in a large amount of R&D investment in the short term will lead to higher technology costs and occupy other resources to improve industrial efficiency. However, with improvements in technological innovation, its innovation effect will gradually emerge. The impact of environmental regulation on the upgrading of industrial structure is in a “U”-shaped relationship in the central and western regions, which is inconsistent with Zhang and Lin (2022). This shows that with the improvement of environmental regulation intensity, pollution-intensive industries face higher compliance and cost and have stronger internal motivation to carry out technological innovation and optimize the structure, which is conducive to promoting the advanced industrial structure.
Yuan et al. (2019) believe that there is a negative relationship between the intensity of environmental regulation and the optimization of the ecological environment in the central and western regions, which is not consistent with the results of this study, and the reason may be related to the selection of different research objects, research methods, and sample time span. The empirical results show that the transformation of industrial structure and technological progress is conducive to ecological environment optimization, which is consistent with the result of Li et al. (2022). From Table 9, it can be inferred that a reasonable industrial structure can reduce the pressure on the ecological environment brought about by economic development to a great extent. The resource elements of the ecosystem provide the material basis for upgrading industrial structure and technological innovation. A good ecological environment is beneficial for the introduction of talent and high-tech industries.
5. Conclusion and suggestions
From the perspective of sustainable economic development in China, this study regarded technological innovation, industrial structure, and the ecological environment as three measurable subsystems, constructed a comprehensive evaluation index system for TIE, and studied the coupling relationship of TIE at the provincial level using the CCDM. This study investigated the spatiotemporal differentiation characteristics of the coordinated development of TIE. A fixed effect model was used to examine the differential impact of subsystem development on the coupling coordination level. Furthermore, to extend and enrich the study, the interaction between the three subsystems was studied using the FMOLS model, and the results showed that:
1. From 2003 to 2019, the CCD of TIE showed an upward trend. However, the speed of development was relatively slow, and the development of TIE in most areas was still in the stage of slight imbalance. During the observation period, the CCD of the TIE was east high, center-level, and west-low. After 17 years of development, the problems of serious imbalances were alleviated and the problems of the lagged development of subsystems were further alleviated.
2. Technological innovation, industrial structure, and ecological environment have a statistically significant impact on the coupling coordination level, and the elasticity of development subsystems to the CCD of TIE shows obvious regional heterogeneity. The impact of the ecological environment on their coordinated development level was largest in all 30 provinces and in the eastern regions, while technological innovation was the main contributor to the increase in the CCD of TIE in the central and western regions.
3. The advancement of the industrial structure has a positive effect on technological innovation. Because economic development levels vary at the regional level, the impact of technological innovation on the rationalization of industrial structure varies among regions. However, in the long run, technological innovation has a positive impact on the rationalization of industrial structures. There is a “U”-shaped relationship between technological innovation and industrial advancement. However, this relationship was not statistically significant in the western region. Rationalization and advancement of industrial structure, as well as technological innovation, are conducive to the improvement of the ecological environment.
Based on our research findings, we make the following recommendations:
1. China should continue to upgrade its industrial structure. Different regions should formulate differentiated industrial policies according to their economic development stages and regional resource situations (Lin and Zhu, 2019). The industrial structure of the eastern provinces should play a demonstrative role in the development of high-tech and emerging industries, and the central and western provinces should further promote the transformation of old and new driving forces based on the existing industrial structure, further promoting the vigorous development of energy-saving and environmentally friendly high-tech industries and accelerating the ecological development of the regional industrial structure.
2. Appropriate ER policies were adopted according to local conditions. Relevant government departments should comprehensively consider local environmental pollution, technological innovation, and industrial development and implement differentiated ER policies. The intensity of ER should be within an appropriate range, and it is necessary to strengthen ERs in the western region and improve the environmental protection consciousness of enterprises there.
3. Encourage technological innovation and provide an endogenous impetus for changes in industrial structure. Governments and enterprises should increase investments in technological innovation and guide more funds to flow into the high-tech and green energy industries. It is necessary to further implement an innovation-driven strategy and formulate targeted talent introduction policies. Western regions should continuously increase innovation investment, attach importance to cooperation between enterprises and scientific research institutions, and create a good environment for technological innovation to improve the level of regional technological innovation.
Although this study provides sufficient evidence for the interaction between technological innovation, industrial structure upgrading, and the ecological environment, it also has limitations that require further research. First, due to the constraints of data acquisition, the sample period of this study was limited to 2003–2017. If additional data were available, this study would have produced more robust results. Second, this study considers 30 provinces (cities) in China as the research object, but there is a large gap between the resource endowment and the economic development of these 30 provinces (cities). Third, this study focuses only on regional disparities at the macro level, omitting the influence of micro-level differences in firm characteristics. The interaction between technological innovation, industrial structure upgrading, and ecological environment optimization must be thoroughly discussed to provide a more effective and practical reference for government policy designation.
Data availability statement
The original contributions presented in the study are included in the article/Supplementary material, further inquiries can be directed to the corresponding author.
Author contributions
JY: conceptualization, formal analysis, investigation, and writing – original draft. TW: methodology, writing – review and editing, supervision, and funding acquisition. Both authors contributed to the article and approved the submitted version.
Funding
This research was funded by National Natural Science Foundation of China, grant number (72104062), the Humanities and Social Science Research Youth Fund project of the Ministry of Education, grant number (21YJC630041), the Guizhou Province Philosophy and Social Science Planning Joint Fund Project, grant number (18GZLH03), and Guizhou Provincial Department of Education Fund Project, grant number YJSKYJJ [2021] 017.
Conflict of interest
The authors declare that the research was conducted in the absence of any commercial or financial relationships that could be construed as a potential conflict of interest.
Publisher’s note
All claims expressed in this article are solely those of the authors and do not necessarily represent those of their affiliated organizations, or those of the publisher, the editors and the reviewers. Any product that may be evaluated in this article, or claim that may be made by its manufacturer, is not guaranteed or endorsed by the publisher.
Supplementary material
The Supplementary material for this article can be found online at: https://www.frontiersin.org/articles/10.3389/fevo.2023.1039865/full#supplementary-material
References
Adebayo, T. S., Oladipupo, S. D., and Kirikkaleli, D. (2022). Asymmetric nexus between technological innovation and environmental degradation in Sweden: an aggregated and disaggregated analysis. Environ. Sci. Pollut. Res. 29, 36547–36564. doi: 10.1007/s11356-021-17982-6
Cai, X., Zhu, B. Z., Zhang, H. J., Li, L., and Xie, M. Y. (2020). Can direct environmental regulation promote green technology innovation in heavily polluting industries? Evidence from Chinese listed companies. Sci. Total Environ. 746:140810. doi: 10.1016/j.scitotenv.2020.140810
Chen, Y., Yu, J., and Khan, S. (2013). The spatial framework for weight sensitivity analysis in AHP-based multi-criteria decision making. Environ. Model Softw. 48, 129–140. doi: 10.1016/j.envsoft.2013.06.010
Chen, Y. Q., and Zhao, L. M. (2019). Exploring the relation between the industrial structure and the eco-environment based on an integrated approach: a case study of Beijing, China. Ecol. Indic. 103, 83–93. doi: 10.1016/j.ecolind.2019.04.001
China (2017). Xi Jinping's report at the 19th National Congress of the Communist Party of China. Available at: http://sousuo.gov.cn/column/8381ac7bb4d84b3ca9c4d89b801d8ed5/0.html
China (2020). The Fourteenth Five-Year Plan. Available at: www.guancha.cn/politics/2021_03_13_583945.shtml
Cui, M. H. (2020). Analysis on the eco-environmental effect of industrial structure evolution in Anhui Province. Econ. Geogr. 40, 131–137. doi: 10.15957/j.cnki.jjdl.2020.08.016
Ding, L., Chen, K. L., Hua, Y. D., Dong, H. A., and Wu, A. P. (2020). Investigating the relationship between the industrial structure and atmospheric environment by an integrated system: a case study of Zhejiang, China. Sustainability 12:12. doi: 10.3390/su12031278
Dong, F. G., and Li, W. Y. (2021). Research on the coupling coordination degree of "upstream-midstream-downstream" of China's wind power industry chain. J. Clearn Produc. 283:124633. doi: 10.1016/j.jclepro.2020.124633
Dong, F., Zhu, J., and Li, Y. F. (2022). How green technology innovation affects carbon emission efficiency: evidence from developed countries proposing carbon neutrality targets. Environ. Sci. Pollut. Res. 29, 35780–35799. doi: 10.1007/s11356-022-18581-9
Edziah, B. K., Sun, H. P., Adom, P. K., Wang, F., and Agye Mang, A. O. (2022). The role of exogenous technological factors and renewable energy in carbon dioxide emission reduction in sub-Saharan Africa. Renew. Energy 196, 1418–1428. doi: 10.1016/j.renene.2022.06.130
Fan, D.C., and Fang, L. (2016). Analysis of the influence of technological innovation on manufacturing industry internal structure evolution in China [C]//2016 international conference on management science and engineering (ICMSE). 1009–1014.
Gan, C. H., Zheng, R. G., and Yu, D. F. (2011). An empirical study on the effects of industrial structure on economic growth and fluctuations in China. Econ. Res. J. 46, 4–16. doi: CNKI:SUN:JJYJ.0.2011-05-002
Gong, Y., Wang, Z., and Gu, G. X. (2015). Technology innovation and industry structure optimization: a study of agent- based simulation. Sci. Res. Manage. 36, 44–51. doi: 10.19571/j.cnki.1000-2995.2015.08.007
Guo, C. Y., Zhang, Y. J., and Li, N. (2022). A coupling mechanism and the measurement of science and technology innovation and rural revitalization systems. Sustainability. 14:10343. doi: 10.3390/su141610343
He, J. Q., Wang, S. J., Liu, Y. Y., Ma, H. T., and Liu, Q. Q. (2017). Examining the relationship between urbanization and the eco-environment using a coupling analysis: case study of Shanghai. China Ecol. Indic. 77, 185–193. doi: 10.1016/j.ecolind.2017.01.017
He, Y., and Zheng, H. (2023). How does environmental regulation affect industrial structure upgrading? Evidence from prefecture-level cities in China. J. Environ. Manag. 331:117267. doi: 10.1016/j.jenvman.2023.117267
Jin, L., Chang, Y. H., Wang, M., Zheng, X. Z., Yang, J. X., and Gu, J. (2022). The dynamics of CO2 emissions, energy consumption, and economic development: evidence from the top 28 greenhouse gas emitters. Environ. Sci. Pollut. Res. 29, 36565–36574. doi: 10.1007/s11356-021-18069-y
Jin, P. Z., Zhang, Y. B., and Peng, X. (2014). The double-edged effect of technological progress in carbon dioxide emissions reduction: empirical evidence from 35 sub-industrial sectors in China. Stud. Sci. Sci. 32, 706–716. doi: 10.16192/j.cnki.1003-2053.2014.05.006
Lai, C. G., Chen, X. H., Chen, X. Y., Wang, Z. L., Wu, X. S., and Zhao, S. W. (2015). A fuzzy comprehensive evaluation model for flood risk based on the combination weight of game theory. Nat. Hazards 77, 1243–1259. doi: 10.1007/s11069-015-1645-6
Levin, A., Lin, C. F., and Chu, C. S. J. (2002). Unit root tests in panel data: asymptotic and finite-sample properties. J. Econ. 108, 1–24. doi: 10.1016/S0304-4076(01)00098-7
Li, R. R., Ding, Z. Y., and An, Y. (2022). Examination and forecast of relationship among tourism, environment, and economy: a case study in Shandong Province, China. Int. J. Environ. Res. Public Health. 19:2581. doi: 10.3390/ijerph19052581
Li, Z. H., Huang, Z. M., and Su, Y. Y. (2023). New media environment, environmental regulation and corporate green technology innovation: evidence from China. Energy Econ. 119:106545. doi: 10.1016/j.eneco.2023.106545
Li, W. W., Wang, W. P., Wang, Y., and Qin, Y. B. (2017). Industrial structure, technological progress and CO2 emissions in China: analysis based on the STIRPAT framework. Nat. Hazards 03, 1545–1564. doi: 10.1007/s11069-017-2932-1
Li, J., Wang, J., and Zhao, B. (2022). Are industrial structure adjustment and technical progress conducive to environmental improvement? J. Glob. Inf. Manag. 30, 1–7. doi: 10.4018/JGIM.290828
Li, L. G., Zhang, P. Y., Liu, W. X., Li, J., and Wang, L. F. (2019). Spatial-temporal evolution characteristics and influencing factors of countyscale environmental pollution in Jilin Province, Northeast China. Chin. J. Appl. Ecol. 30, 2361–2370. doi: 10.13287/j.1001-9332.201907.031
Liao, Z. J., Xu, C. K., Cheng, H., and Dong, J. C. (2018). What drives environmental innovation? A content analysis of listed companies in China. J. Clean. Prod. 198, 1567–1573. doi: 10.1016/j.jclepro.2018.07.156
Liao, H. W., Yang, L. P., Ma, H. N., and Zhang, J. J. (2020). Technology import, secondary innovation, and industrial structure optimization: a potential innovation strategy for China. Pac. Econ. Rev. 25, 145–160. doi: 10.1111/1468-0106.12326
Lin, B. Q., and Zhu, J. P. (2019). Fiscal spending and green economic growth: evidence from China. Energy Econ. 83, 264–271. doi: 10.1016/j.eneco.2019.07.010
Liu, C., Dai, H. C., Zhang, L., and Feng, C. C. (2019). The impacts of economic restructuring and technology upgrade on air quality and human health in Beijing-Tianjin-Hebei region in China. Front. Environ. Sci. Eng. 13:70. doi: 10.1007/s11783-019-1155-y
Liu, W. J., Jiao, F. C., Ren, L. J., Xu, X. G., Wang, G. C., and Wang, X. (2018). Coupling coordination relationship between urbanization and atmospheric environment security in Jinan City. J. Clean. Prod. 204, 1–11. doi: 10.1016/j.jclepro.2018.08.244
Liu, F., Sim, J. Y., Sun, H., Edziah, B. K., Adom, P. K., and Song, S. (2023). Assessing the role of economic globalization on energy efficiency: evidence from a global perspective. China Econ. Rev. 77:101897. doi: 10.1016/j.chieco.2022.101897
Liu, Y. Q., Xu, J. P., and Luo, H. W. (2014). An integrated approach to modelling the economy-society-ecology system in urbanization process. Sustainability 6, 1946–1972. doi: 10.3390/su6041946
Quyang, X. L., Li, Q., and Du, K. R. (2020). How does environmental regulation promote technological innovations in the industrial sector? Evidence from Chinese provincial panel data. Energy Policy 139:111310. doi: 10.1016/j.enpol.2020.111310
Ruan, W. Q., and Li, Y. Q. (2019). Coupling coordination of internet development, technology innovation and star hotel efficiency. IJSWIS 15, 48–64. doi: 10.4018/IJSWIS.2019070104
Shi, L. L., and Zhao, J. (2018). Environmental regulation, technological innovation and industrial structure upgrading. Sci. Res. Manage. 39, 119–125. doi: 10.19596.2022.01.007
Song, D. Y., and Bi, D. J. (2020). The influence of technological innovation on the upgrading of industrial structure under environmental regulation: empirical analysis based on panel data of central cities along the Yangtze River. Econ. Survey 39, 79–87. doi: 10.15931/j.cnki.1006-1096.2022.01.007
Song, Y., Yang, T. T., and Zhang, M. (2019). Research on the impact of environmental regulation on enterprise technology innovation-an empirical analysis based on Chinese provincial panel data. Environ. Sci. Pollut. Res. 26, 21835–21848. doi: 10.1007/s11356-019-05532-0
Sun, J. H., Tang, D. C., Kong, H. J., and Boamah, V. (2022). Impact of industrial structure upgrading on green total factor productivity in the Yangtze River Economic Belt. Int. J. Environ. Res. Public Health 19:3718. doi: 10.3390/ijerph19063718
United Nations. Transforming our world: The 2030 agenda for sustainable development. (2015). Available at: www.un.org/sustainabledevelopment/ (Accessed May 5, 2022).
Wang, Z., Jia, H. F., Xu, T., and Xu, C. Q. (2019). Manufacturing industrial structure and pollutant emission: An empirical study of China. J. Clean. Prod. 197, 462–471. doi: 10.1016/j.jclepro.2018.06.092
Wang, J. J., Jiang, S. L., and Jiao, Y. (2022). Environmental regulation, technological progress bias and industrial structure upgrading. Statis. Decis. 38, 49–54. doi: 10.13546/j.cnki.tjyjc.2022.12.009
Wang, X. T., and Luo, Y. (2020). Has technological innovation capability addressed environmental pollution from the dual perspective of FDI quantity and quality? Evidence from China-science direct. J. Clean. Prod. 258:120941. doi: 10.1016/j.jclepro.2020.120941
Wang, L. L., Su, M., Kong, H., and Ma, Y. X. (2021). The impact of marine technological innovation on the upgrade of China's marine industrial structure. Ocean Coastal Manage. 211:105792. doi: 10.1016/j.ocecoaman.2021.105792
Wang, S., Tong, L., and He, Y. D. (2019). Quantitative measurement of the coupling relationship between industrial structure and ecological environment in Beijing. Tianjin Hebei. Soft Sci. 33, 75–79. doi: 10.13956/j.ss.1001-8409.2019.03.16
Wang, H. Q., and Zhang, Y. (2020). Trade structure upgrading, environmental regulation and green technology innovation in different regions of China. China Soft Sci. 02, 174–181. doi: CNKI:SUN:ZGRK.0.2020-02-016
Wang, Q., and Zhang, F. Y. (2021). The effects of trade openness on decoupling carbon emissions from economic growth – evidence from 182 countries. J. Clean. Prod. 279:123838. doi: 10.1016/j.jclepro.2020.123838
Wang, Z., Jia, H. F., Xu, T., and Xu, C. Q. (2018). Manufacturing industrial structure and pollutant emission: An empirical study of China. J. Clean. Prod. 197, 462–471. doi: 10.1016/j.jclepro.2018.06.092
Wen, J. L., He, W. D., and Zhang, M. Y. (2020). Research on ecological efficiency of industrial structure. J. Sci. Industrial Res. 79, 531–533.
Xu, B., and Lin, B. Q. (2016). Differences in regional emissions in China’s transport sector: Determinants and reduction strategies. Energy. 95, 459–470. doi: 10.1016/j.energy.2015.12.016
Xu, X. G., and Zhou, Y. F. (2021). Spatio-temporal differentiation characteristics and determinants of coupling coordination degree in technological innovation-industrial upgrading-ecological environment system: a case study of Jiangsu Province, China. Polish J. Environ. Stud. 30, 3341–3355. doi: 10.15244/pjoes/130949
Yang, R., Miao, X., and Wong, CWY.; Wang, T.; Du, MJ. (2021). Assessment on the interaction between technology innovation and eco-environmental systems in China. Environ. Sci. Pollut. Res. 28 : 63127–63149, doi: 10.1007/s11356-021-15149-x
Yi, M., Lu, Y., Wen, L., Luo, Y., Xu, S. J., and Zhang, T. (2022). Whether green technology innovation is conducive to haze emission reduction: empirical evidence from China. Environ. Sci. Pollut. Res. 29, 12115–12127. doi: 10.1007/s11356-021-16467-w
Yu, B. B. (2015). Economic growth effects of industrial restructuring and productivity improvement-analysis of dynamic spatial panel model with Chinese City data. China Ind. Econ. 12, 83–98. doi: 10.19581/j.cnki.ciejournal.2015.12.007
Yuan, X. L., Li, H., and Di, Q. (2019). Analysis of interactive mechanism of environmental regulation strength, industrial structure upgrading and ecological environment optimization. J. Guizhou Univ. Finance Econ. 01, 73–81. doi: 10.3969/j.issn.1003-6636.2019.01.008
Zhang, X. X., Cao, Z. X., and Dong, H. Z. (2021). Study on the coupling correlation and dynamic response of industrial structure, urbanization and ecological environment in Beijing-Tianjin-Hebei region. J. Southwest Minzu Univ. (Human. Soc. Sci.) 42, 121–128.
Zhang, Y., Hu, H. Y., Zhu, G. J., and You, D. M. (2022). The impact of environmental regulation on enterprises' green innovation under the constraint of external financing: evidence from China's industrial firms. Environ. Sci. Pollut. Res. 30, 42943–42964. doi: 10.1007/s11356-022-18712-2
Zhang, Q., and Lin, Y. Z. (2022). Dual environmental regulation, technological innovation and industrial structure changes empirical test based on panel data of Chinese cities. Soft Sci. 36, 37–43. doi: 10.13956/j.ss.1001-8409.2022.01.06
Zhang, Y., Wang, J. R., Xue, Y. J., and Yang, J. (2018). Impact of environmental regulations on green technological innovative behavior: An empirical study in China. J. Clean. Prod. 188, 763–773. doi: 10.1016/j.jclepro.2018.04.013
Zhao, X. Y. (2007). The eco-environment effect of the industrial spatial structure in Gansu. J. Arid Land Resour. Environ. 06, 17–21. doi: 10.13448/j.cnki.jalre.2007.06.004
Keywords: technological innovation, industrial structure, ecological environment, coupling coordination degree model, fully modified least-squares method
Citation: Yang J and Wang T (2023) Synergistic effects of technological innovation, industrial structure upgrading, and ecological environment optimization—evidence from China. Front. Ecol. Evol. 11:1039865. doi: 10.3389/fevo.2023.1039865
Edited by:
Justyna Żywiołek, Częstochowa University of Technology, PolandReviewed by:
Yantuan Yu, Guangdong University of Foreign Studies, ChinaHuaping Sun, Jiangsu University, China
Copyright © 2023 Yang and Wang. This is an open-access article distributed under the terms of the Creative Commons Attribution License (CC BY). The use, distribution or reproduction in other forums is permitted, provided the original author(s) and the copyright owner(s) are credited and that the original publication in this journal is cited, in accordance with accepted academic practice. No use, distribution or reproduction is permitted which does not comply with these terms.
*Correspondence: Ting Wang, twang@gzu.edu.cn