Cyclical browning in a subtropical lake inferred from diatom records
 Meredith A. Emery Boeck1*
  Evelyn E. Gaiser1*
  Hilary M. Swain2
  Mark Brenner3,4
  Jason H. Curtis3
  William F. Kenney4
- 1Department of Biological Sciences and Institute of Environment, Florida International University, Miami, FL, United States
- 2Archbold Biological Station, Venus, FL, United States
- 3Department of Geological Sciences, University of Florida, Gainesville, FL, United States
- 4Land Use and Environmental Change Institute, University of Florida, Gainesville, FL, United States
Changing climate and land use activity are altering inputs of colored dissolved organic carbon (cDOC) into lakes. Increased cDOC reduces water transparency (browning) and changes lake physicochemistry, with biological consequences. Identifying the drivers and effects of changing cDOC inputs is critical for mitigating the consequences of climate change on lake ecosystems through adaptive watershed management. This study focused on determining the drivers of lake browning by evaluating shifts in diatom assemblages in subtropical, oligotrophic Lake Annie (FL, United States), which is known to experience climate-driven oscillations in transparency associated with watershed inputs of cDOC. We combined long-term limnological monitoring data and paleolimnological techniques to determine how diatoms respond to changes in cDOC and to infer past cDOC fluctuations relative to records of past climate and land use changes in the watershed. Diatom assemblage composition in a 14-year phytoplankton dataset was strongly correlated with cDOC-driven transparency fluctuations. Likewise, diatom assemblages in the upper 35 cm of the sediment core, which corresponded to a 35-year lake monitoring record, were also strongly related to past water transparency, yielding a strong transfer function (paleo model, R2 = 0.72). When the model was applied to the diatom record from a 166-cm sediment core, diatom-inferred transparency and rates of nutrient input showed that localized ditching in the 1930s enhanced the effect of climate oscillations on water transparency, intensifying cyclical browning thereafter. Integration of long-term monitoring and paleoecological data provided valuable insights into the history of the aquatic ecosystem, enabling implementation of adaptive management strategies to contend with a changing climate.
Introduction
Lake browning is caused by inputs of terrestrially derived, colored dissolved organic carbon (cDOC) and concentrations are increasing in water bodies of some regions as a consequence of climate change and land-use modifications (Kritzberg, 2017; Kritzberg et al., 2020). A recent study found an ~18% reduction in “blue” lakes in the United States from 2007 to 2012, caused by both greening (eutrophication) and browning (Leech et al., 2018). Whereas 20th-century browning of some temperate lakes has been associated with atmospherically derived acidification (Monteith et al., 2007; Clark et al., 2010; Kritzberg, 2017), paleolimnological studies showed that some lakes have undergone “re-browning,” with recent cDOC concentrations surpassing historic levels (Meyer-Jacob et al., 2019). The causes and consequences of such cyclical browning are not well documented, particularly in understudied subtropical regions where lake color and transparency can be strongly influenced by precipitation and related cDOC input dynamics (De Senerpont Domis et al., 2013; Regier et al., 2016). Increasing precipitation variability may be driving increased cDOC inputs to lakes (Haaland et al., 2010; Chiu et al., 2020), but if or how land-use activity modifies these inputs is not known.
Given the profound effect that cDOC has on lake physicochemistry and biology, unraveling the climatological drivers and consequences of lake browning, and the land-use drivers that may enhance or reverse browning, is important. Browning reduces transparency, changes thermal regimes, and can increase the volume of hypolimnetic anoxia, thereby playing an important role in regulating the distribution and abundance of lake biota (Solomon et al., 2015; Knoll et al., 2018; Pilla et al., 2018). The composition and productivity of plankton communities respond to browning directly, through changes in carbon quality and acquisition, and indirectly, related to changes in transparency, mixing, and both external and internal nutrient loading of nitrogen and phosphorus (Kelly et al., 2018; Olson et al., 2020). As cDOC increases in oligotrophic lakes, phytoplankton dominance shifts from diatoms to cyanobacteria (Senar et al., 2021), or from synurophyte algae to diatoms (Sullivan et al., 2022), as a consequence of the addition of nutrients associated with the input of terrestrial organic matter. Higher concentrations of cDOC, however, can reduce production of cyanobacteria because of light limitation (Burford et al., 2022) and therefore, continued browning of dystrophic lakes can shift phytoplankton dominance from cyanobacteria to mixotrophs, which ultimately changes the path of energy transfer through the ecosystem (Senar et al., 2021). For example, cold-water fishes may be limited by light-limited food webs and anoxic hypolimnia in lakes that experience browning (Solomon et al., 2015; Symons et al., 2019; Williamson, 2020). Browning has a cascading effect on lake metabolism, population and community dynamics, and biodiversity, and can influence ecosystem services, including provisioning of clean drinking water (Kritzberg et al., 2020). Thus, determining whether and how land-use modifications interact with climate drivers to influence browning is critically important.
Fluctuations in climate-change-driven external inputs of cDOC to lakes can occur throughout a season or year, or over multi-year intervals, whereas land-use contributions to changing cDOC inputs may be associated with particular activities in watersheds that may or may not be well documented, often depending on availability of historical records (Meyer-Jacob et al., 2015). Discerning how climate and land-use changes interact to alter cDOC and its consequences therefore requires a multi-disciplinary approach. Paleolimnological approaches can provide evidence of climate and land-use change on long time scales (years to millennia), whereas neolimnological approaches can provide data at interannual to seasonal resolution (Fritz, 2008; Woodbridge and Roberts, 2010; Saros et al., 2012). Paleolimnologists have used diatoms to infer Holocene climate variability (Kilham et al., 1996) and the consequences of climate warming (Rühland et al., 2015) and drought (Laird et al., 1996) on lake ecosystems. Diatoms can respond rapidly to changing cDOC concentrations and diatom assemblages in lake sediments have been used to infer past cDOC shifts (Kingston and Birks, 1990; Dixit et al., 2001; Brown et al., 2017). For instance, increasing cDOC concentrations have been associated with a shift in dominance from benthic to phytoplanktonic taxa (Rosén et al., 2009; Gushulak and Cumming, 2020), driven by changes in light attenuation (Gushulak and Cumming, 2020). Diatom assemblage changes in browning lakes may therefore provide insights into the history of browning, potential drivers of browning, and the physicochemical consequences of browning cycles.
One lake where there is the potential to differentiate among the three factors contributing to browning is Lake Annie, a subtropical lake with a history of cyclical browning, as well as extensive monitoring data and watershed information. Lake Annie is a small (0.36 km2), relatively deep (zmax = 21 m) subtropical sinkhole lake that lies at 33.65 masl on the southernmost part of Lake Wales Ridge (LWR), in Highlands County, Florida (United States; 27°12′35″N, 81°20′57″W; Bishop, 1956; Layne, 1979). The lake and its surrounding area were purchased in 1983 by the Archbold Biological Station (Archbold; Battoe, 1987), which protects and monitors the lake and watershed. Monthly monitoring of transparency, thermal structure, and water chemistry in Lake Annie began in 1983, to which phytoplankton net tows were added in 2005. Until the 1990s Lake Annie was classified as oligotrophic, but since phytoplankton monitoring started, Lake Annie has been classified as oligotrophic to mesotrophic based on ranges of Secchi depth (0.7–6.7 m) and surface water total phosphorus and nitrogen concentrations (3–26 μg L−1 and 0.17–0.95 mg L−1, respectively). During relatively dry years, Lake Annie receives 80% of its hydrologic input from groundwater flow from the south, east, and west and 20% from direct rainfall (Battoe, 1987; Sacks et al., 1998). Water leaves Lake Annie via evaporation, subsurface flow, and a small outflow ditch, presumably constructed between 1917 and 1930, which flows north (Sacks et al., 1998).
Human modification Lake Anne’s hydrology began in 1917 when a railroad line east of the water body was built and cut off historic sheet flow. A 5-km-long ditch adjacent to the railroad was constructed and expanded the size of the lake’s surficial watershed under high-water conditions. Two other drainage ditches, one on the east side (smaller ditch) and one on the south side (larger ditch) of Lake Anne were dug in the early 1930s and connected the lake to the railroad ditch (Layne, 1979). This enabled delivery of overland flow to the lake from the railroad ditch during high groundwater and high rainfall events. Over the decades, erosion of sandy soils along the ditch likely contributed to increased flow, and the four hurricanes of 2004 and 2005 further eroded the network of sandy roads on Archbold, connecting the railroad ditch to more seasonal wetlands.
Monitoring data since 1983 showed that cDOC and transparency fluctuate with seasonal and interannual variability in groundwater input to the lake, driven by the Atlantic Multidecadal Oscillation (AMO; Gaiser et al., 2009b). During the AMO warm and wet phase (Enfield et al., 2001), the lake is brown and has a cooler, larger hypolimnion and more stable summer thermocline than during the drier AMO cool phase (Gaiser et al., 2009a). Lake Annie, with its combined long-term limnological monitoring and historical data on climate oscillations and their interaction with minor land use change in the watershed, offers an opportunity, in combination with paleolimnological data, to discern the role that watershed modifications have had on climate-driven browning.
We explored whether stratigraphic changes in diatom assemblages in Lake Annie sediments reflect long-term fluctuations in water transparency, driven by shifts in cDOC. We hypothesized that seasonal changes in diatom community composition in a 14-year, monthly-resolved monitoring dataset reflect climate and hydrologic drivers and lake responses to cDOC shifts, as recorded by transparency measurements. We assumed that past and modern diatom assemblages responded similarly to transparency shifts, and hypothesized that diatoms in thin strata from the uppermost lake sediments reflect interannual variability in transparency documented directly in a 35-year monitoring record. These data can be used to develop a sensitive lake-specific diatom-based transparency calibration that could be applied to sediments deposited over the last several thousand years to infer past water transparency. This would help resolve important questions about the history of climate oscillations, their interaction with local land-use modifications, and whether browning of Lake Annie occurred in the past, or is instead, a recent, human-mediated phenomenon.
Methods
Our study used three data sets: (1) a monthly physicochemical limnological, meteorological, and phytoplankton data set (October 2005–December 2019), (2) an annual average physicochemical limnological and meteorological data set (1985–2019), and (3) sediment element composition and diatom data from a 166-cm sediment core that spans approximately the last four centuries. We ran two intra-lake diatom analyses. One used monthly limnological and phytoplankton data and the other used mean annual limnological values along with diatom samples from the top 35 cm of the sediment core, which corresponded to the years of monitoring data. Two intra-lake diatom analyses were used to identify the physicochemical or meteorological factor that had the greatest effect on diatom assemblage changes. That factor (Secchi depth) was inferred using the strongest transfer function model from the two calibration datasets and the diatoms from the sediment core, then compared to the element stratigraphy in the core.
Calibration data
To examine relationships among climate and hydrologic drivers, limnological variables, and diatom assemblages, we accessed data on the major climate phenomena that influence Florida on interannual timescales (Enfield et al., 2001; Donders et al., 2011; Moses et al., 2013). Data for the Atlantic Multidecadal Oscillation (AMO), Pacific Decadal Oscillation (PDO), and Southern Oscillation Index (SOI) were obtained from the National Oceanic and Atmospheric Administration (NOAA) website, which includes the full index of the parameters (Physical Sciences Laboratory, 2020; NOAA, 2020b, 2020a). Modeled AMO values for the interval 1633–1985 were taken from dendrochronological inferences (Gray et al., 2004), which are reported to have high similarity (81%) to the known Sea Surface Temperature Anomalies Index.
We used mean monthly precipitation, lake stage, and groundwater elevation from Archbold’s long-term dataset to quantify hydrologic drivers of lake water transparency. Mean monthly precipitation for 1985–2019 was calculated from values recorded daily at Archbold’s National Weather Service Main Grounds Weather Station. Mean monthly lake stage (LWS) was calculated from weekly to biweekly measurements from the georeferenced staff gauge at the lake’s north outlet that was replaced in the late 1990s and subsequently monitored by Archbold for the Southwest Florida Water Management District. Mean monthly groundwater stage (GWS) was calculated from biweekly to monthly measurements in a well located 2.5 km south of the lake, established by the United States Geological Survey (USGS). We used data from Archbold’s long-term monthly lake monitoring (1985–2019) to explore linkages between water transparency and other limnological variables. Monthly Secchi depth was determined and served as a measure of water transparency. Monthly profile measurements were made at 1-m depth intervals at the deepest site in the lake (21 m), using a YSI Model 58 m for temperature, pH, and conductivity. Photosynthetically active radiation (PAR) was calculated from the photon flux density (PFD) at the lake surface and at 1-m depth intervals to the depth below which PFD was <1 μmol m−2 s−1, using a LiCor LI-1888B Integrating Photometer with 2 pi surface and underwater sensors. Lake thermal stability was calculated from the water temperature vertical profiles, using the rLakeAnalyzer package in RStudio v. 1.2.5001.
Surface water samples for total phosphorus (TP), total nitrogen (TN), and chlorophyll-a (Chl-a) were collected monthly by Archbold staff and analyzed by Florida LAKEWATCH from 2001 to 2019 (Florida LAKEWATCH, 2020). An additional set of surface water samples was collected from 2006 to 2019 and analyzed for total organic carbon (TOC) by the CAChE Nutrient Analysis Core Facility at Florida International University.
Phytoplankton net diatom samples
Monthly phytoplankton samples from 2005 to 2019 were collected using a 10-m vertical tow of a 20-μm phytoplankton net. Samples were used to determine the seasonal variability of diatom assemblages in the monthly record. Samples were refrigerated in 2% glutaraldehyde solution, then settled for 24 h before pipetting the concentrated phytoplankton sample (5–8 mL) into a glass vial. A 3-ml subsample of the concentrated sample was oxidized using sulfuric acid, potassium dichromate, and oxalic acid, following the procedure of Battarbee et al. (2001). For 21 samples with low diatom abundances, a second 3–5-mL subsample or the entire remaining material (6–8 mL) was used. A measured volume (0.05–1.00 mL) of the neutral diatom sample was dried and mounted on a slide with Naphrax®. Identification and enumeration of diatoms were done on a Zeiss Axioskop 2 microscope at 1,000× magnification. At least 600 diatom valves, including broken valves that were 60% intact, were counted along a random transect (Battarbee et al., 2001). For the 21 samples with low diatom abundances, 25% of the slide was enumerated. Digital photos of each taxon were captured using a Leica Microsystems Ltd. camera and Leica Application Suite (LAS) V 4.12 software. Diatoms were identified to the lowest taxonomic level possible (species and variety) using the taxonomic literature and the Diatoms of North America website (Spaulding et al., 2019).1 Taxa that were not identifiable were given a numeric code and documented in the image-based flora found at https://diatoms.org/practitioners/voucher-flora-archive.
Sediment core
A 166-cm-long sediment/water interface core was recovered from a water depth of ~21 m in Lake Annie on 6 September 2019, using a 7.62-cm-diameter piston corer (Fisher et al., 1992). The core was extruded at 1-cm intervals and wet subsamples were kept in sterile bags under refrigeration. A 2–3-cm3 subsample was removed from each 1-cm interval, weighed, and dried at 100°C in an oven, and re-weighed to determine percent dry mass and percent water content. Remaining wet material from each stratigraphic sample was freeze-dried prior to subsequent analyses.
Core chronology
We established the recent sediment chronology by 210Pb dating. Total 210Pb, 137Cs, and 226Ra activities were measured using low-background gamma detectors (Schelske et al., 1994). Sediments in the topmost 8 cm had low bulk density, so dry sediments from 0 to 4 cm depth were combined, proportional to their respective dry bulk densities, to provide sufficient mass. Samples in the interval 4–8 cm were likewise combined. From 8 to 40 cm, activities were measured at 2-cm intervals, and below 40 cm, activities were measured at 4-cm intervals. Unsupported 210Pb activity in each sample was determined by subtracting 226Ra activity (i.e., supported 210Pb activity) from total 210Pb activity. We calculated sediment ages with the constant-flux, constant-sedimentation (CFCS) model (Krishnaswamy et al., 1971) and estimated the average linear sedimentation rate (S, cm a−1) as the quotient of the decay constant of 210Pb (0.031) divided by the slope of the regression of the natural log of 210Pbunsupported against the mid-depth of each sediment interval. We estimated the average mass sedimentation rate (MSR, mg cm−2 a−1) as the quotient of the decay constant of 210Pb (0.031) divided by the slope of the regression of the natural log of 210Pbunsupported against the mid-depth cumulative mass (mg cm−2) for each sediment interval. We calculated age errors using the 95% confidence interval of that MSR estimate.
Because the stratigraphic profile of 210Pbunsupported activity indicated variable sedimentation rates, we also applied the constant rate of supply (CRS) model (Appleby and Oldfield, 1983; Oldfield and Appleby, 1984) so that sedimentation rates within each stratigraphic interval could be calculated. Age errors for the CRS model were propagated using first-order approximations and calculated according to Binford (1990). To correct for “too old” ages at greater depths in the core, which are an artifact of the CRS model, we applied a “CFCS-CRS Hybrid” model that increased the unsupported inventory of 210Pb (A0) in the CRS model by mathematically adding a small amount of 210Pbunsupported activity below the deepest sample with measurable 210Pbunsupported activity. This approach uses the CFCS age for the deepest sample with measurable 210Pbunsupported activity to calculate the missing unsupported inventory of 210Pb for the CRS model. We made the adjustment using the following formulas:
To calculate ages at 1-cm intervals within sediments that contained 210Pbunsupported (40–80 cm), we interpolated 210Pbunsupported activity between measured values and applied the CFCS-CRS Hybrid model to the measured and interpolated data. To calculate ages for sediment sections deeper than those with 210Pbunsupported, we extrapolated the depth-age relation using the mean mass sedimentation rate determined by the CFCS model for the 210Pb-dated section of the core.
Core geochemistry
Percent total carbon (%TC) and total nitrogen (%TN) in sediment were measured in the Light Stable Isotope Mass Spectrometry Laboratory at the University of Florida, using a Carlo Erba NA1500 CNS elemental analyzer. Samples for analysis of carbon stable isotopes in organic matter (δ13C) were treated with 1 N HCl to remove any possible trace carbonate, and then washed with distilled water to remove chloride. Samples for nitrogen isotope analysis (δ15N) were not acidified. Samples for carbon and nitrogen isotopes were loaded into tin capsules and placed in a 50-position automated carousel on the Carlo Erba elemental analyzer. Samples were combusted at 1020°C, after which the generated gases were carried in a helium stream through a Conflo II interface to a Thermo Electron DeltaV Advantage isotope ratio mass spectrometer. Stable carbon isotope results are expressed as permil (‰) in standard delta notation relative to VPDB. Stable nitrogen isotope values are expressed as permil (‰) relative to AIR, i.e., δ15N = 0.
Biogenic silica (SiO2) in freeze-dried sediment (n = 166 samples) was measured in the laboratory of the St. Croix Watershed Research Station, MN, using the methods of Conley and Schelske (2001). Total phosphorus in the freeze dried sediment samples was measured at the Wetland Ecosystems Research Laboratory at FIU, using a dry-ashed and acid hydrolysis method and analyzed on a UV-2450 Shimadzu Scanning Spectrophotometer (Solorzano and Sharp, 1980).
Diatoms in the sediment core
Diatom analysis used 20–40 mg of freeze-dried subsample from each core interval, which was oxidized using the procedure described above for phytoplankton. The neutral samples were settled for 24 h in Battarbee Chambers containing three round glass cover slips (Battarbee, 1973) that were subsequently mounted on microscope slides using Naphrax®. A total of 600 intact diatom valves were identified and counted in each sample. Diatom counts and chronologies from the sediment core are available at https://data.neotomadb.org/55915 and https://doi.org/10.21233/VES5-3E24.
Data analysis
Sub-annual responses of diatoms to transparency changes
Diatom assemblage response to monthly variability in transparency and the hydrologic drivers and limnological consequences of transparency variability were evaluated using the 14-year phytoplankton record (2005–2019). Secchi depth was used to indicate the consequences of browning on water transparency, since prior studies showed a strong positive correlation between the frequent measures of Secchi depth, and less frequent measures of water color and total organic carbon (TOC, 98% of which is DOC; Gaiser et al., 2009a; Dempsey et al., 2020). The relationship between hydrologic drivers and limnological correlates of Secchi depth variability were evaluated using the monthly means of all meteorological and limnological variables. Missing meteorological and physicochemical data (3% of values) were interpolated using the average of the previous and subsequent values. A Pearson correlation matrix was used to determine correlations, after adjusting the mean to zero and the standard deviation to 1 for each variable. Strong correlations had a rounded correlation coefficient (R2) that was >0.5 or <−0.5, and significant correlations had p-values < 0.05. The influence of the primary hydrologic and chemical drivers of hydrologic change, GWS and TOC, respectively, on Secchi depth variability, were further evaluated relative to the other hydrologic and physicochemical variables, using an Auto Regression Integrated Moving Average (ARIMA) time series analysis. The Akaike’s Information Criterion (AIC) values were compared between the explanatory models, with the best model having the lowest AIC value.
The abundance of each diatom taxon was calculated relative to the total count, and all taxa, including rare and infrequently encountered taxa, were retained in the analysis because they hold valuable information and have been shown to improve transfer functions (Marquardt et al., 2021). Diatom assemblage transitions associated with a dark to clear transparency shift were determined using constrained cluster analysis (CONISS; “rioja” R package). Diatom relative abundances were square-root transformed before applying the Bray–Curtis similarity index and dissimilarity analysis (SIMPER), and an analysis of similarity (ANOSIM), using PRIMER-E software (Clarke and Gorley, 2015), was used to determine the magnitude and significance of phase differences. The ANOSIM output statistic (R) ranges between 0 and 1, for which a value of 1 indicates strong separation between the two phases, and a significance level of p < 0.001. Climate and physicochemical differences between the two phases were then evaluated using a t-test. Diatom assemblage shifts were also evaluated in a two-dimensional metric multidimensional scaling (nMDS) ordination, with samples coded by dark or clear phase. Climate, hydrological, and physicochemical variables that explain more than 50% of the variation in diatom assemblage compositional differences (R2 > 0.5) and with a p-value < 0.05 were plotted as vectors. Indicator species analysis (ISA) was used to determine indicator taxa for each diatom-transparency phase (dark and clear), using the “indicspecies” R package (De Cáceres et al., 2010). The Shannon Diversity Index (SDI) was calculated to determine whether taxon diversity and evenness also differed between dark and clear phases. Finally, the relative abundances of planktonic and tychoplanktonic taxa (diatoms that are benthic or weakly attached to the substratum) were compared to determine if planktonic taxa had higher abundance during dark lake phases.
Decadal responses of diatoms to transparency and the “paleo” transfer function
The “paleo” transfer function was created using the 35-year limnological record (1985–2019) that was chronologically calibrated to the near-annually-resolved sedimented diatom record. This in-situ “paleo” transfer function was desirable because it was known that this longer-term sediment record captured multi-decadal transparency oscillations driven by the AMO (Gaiser et al., 2009b). Samples from the uppermost 35 cm of the core were used for the “paleo” transfer function based on the 210Pb age model, for which the date at 35 cm was ~1985 (Quillen et al., 2013). The top 35 samples were used to examine the drivers of variability in diatom assemblage composition and to derive the paleo-diatom-Secchi depth transfer function by using the annual averages of weekly to monthly data for all climate, hydrologic, and limnological variables in the long-term monitoring record, excluding years that did not correspond to the 210Pb age estimates (1987, 1989, 1991, 1996, 2001, and 2005).
We evaluated the relationship between diatom assemblages and climate, hydrologic, and physicochemical variables in a manner similar to how we examined the monthly dataset. A Pearson correlation matrix of all variables was performed. Among-sample variability in diatom percent relative abundances was determined by a CONISS, which resulted in two clusters that matched the dark and clear lake phases, confirmed by SIMPER and ANOSIM analyses. A t-test was used to evaluate differences in climate drivers and physicochemical correlates between the diatom-indicated dark and clear phases. A two-dimension nMDS ordination showed among-sample differences in diatom composition and their relation to the climate, hydrological and physicochemical variables (R2 > 0.5). An ISA was used to determine the indicator taxa for the diatom-indicated dark and clear phases. Lastly, the Secchi depth optimum and tolerance for each diatom taxon was calculated using weighted-averaging regression with the C2 software (Juggins, 2007). We used weighted-averaging partial least squares (WA-PLS) regression to generate the diatom-Secchi depth transfer function. The predictive ability and error were calculated from the correlation (R(apparent)2) between measured and diatom-inferred Secchi depth and a root mean square error (RMSE), and the bootstrap cross validation method that used 100 permutations and output an R(bootstrap)2 and a root mean square error of prediction (RMSEP). Model choice was based on largest R(apparent)2 and smallest value of RMSEP (Battarbee et al., 2001). The C2 software program was used to generate and test the models, and to hindcast the diatom-inferred transparency values for both models (Juggins, 2007; Birks, 2012).
Diatom-based transparency inferences and drivers
Diatom-inferred Secchi depth was calculated for sediment depths 166–36 cm, using the “paleo” transfer function. We also examined changes in accumulation rates of four elements [nitrogen, carbon, phosphorus, and silica (SiO2)], two molar nutrient ratios (C:N and N:P), and two stable isotopes in organic matter, δ13C and δ15N. The four accumulation rates were calculated from the percent mass weight of the variable and the bulk sedimentation rate. We determined the AMO Index for the corresponding sediment core sample using the estimated 210Pb age. The interval 166–76 cm (~1633–1903) used AMO inferred data from a model developed from tree rings (Gray et al., 2004), whereas the top 75 cm (~1906–2019) used AMO Index data from NOAA (Physical Sciences Laboratory, 2020). In addition, the SDI was calculated from each sediment core sample to explore the change in diatom assemblage diversity. We also used stratigraphic plots to examine the change in the percent relative abundance between planktonic and tychoplanktonic diatom taxa throughout the core. A Pearson correlation matrix was used to determine relationships between elements in the sediment core (nitrogen, carbon, phosphorus and silica), Secchi depth (measured and diatom-inferred transparency), SDI and the AMO, before plotting them as vectors on the nMDS, which showed how they relate to changes in the diatom assemblages. The sediment core was separated into six subzones, established by a CONISS of the diatom assemblage. A SIMPER and ANOSIM determined the significant difference within and between subzones. In addition, the indicator diatom taxa for each subzone were determined by the ISA. All variables were divided into six subzones and a Tukey post-hoc test was used to determine significant differences for a variable between subzones.
Results
Sub-annual and annual transparency responses
The Secchi depth oscillated from dark to clear sub-annually in the 2005–2019 monthly record, ranging from 0.7 to 6.7 m, and decadally in the 1985–2019 annual means, ranging from 1.86 to 7.06 m (Figure 1). Both the monthly and annual average records showed that the Secchi depth was negatively correlated with GWS and LWS, and positively correlated with PAR (1% PAR and 10% PAR; Supplementary Tables 1, 2). The monthly Secchi depth record also showed strong negative correlations with TP, TN, TOC, and Chl-a (Supplementary Tables 1A, 2A). Of all these factors, the ARIMA time series analysis from the monthly record showed that monthly precipitation, GWS and TOC had a stronger influence on the Secchi depth than did the other variables (AIC = 299.61 and 305,43, respectively, Supplementary Table 3; Supplementary Figure 1). In the annual record, the Secchi depth showed strong correlation with Schmidt stability and surface stability, and was negatively correlated with the AMO. The AMO had a stronger positive correlation with GWS (Supplementary Table 2B).
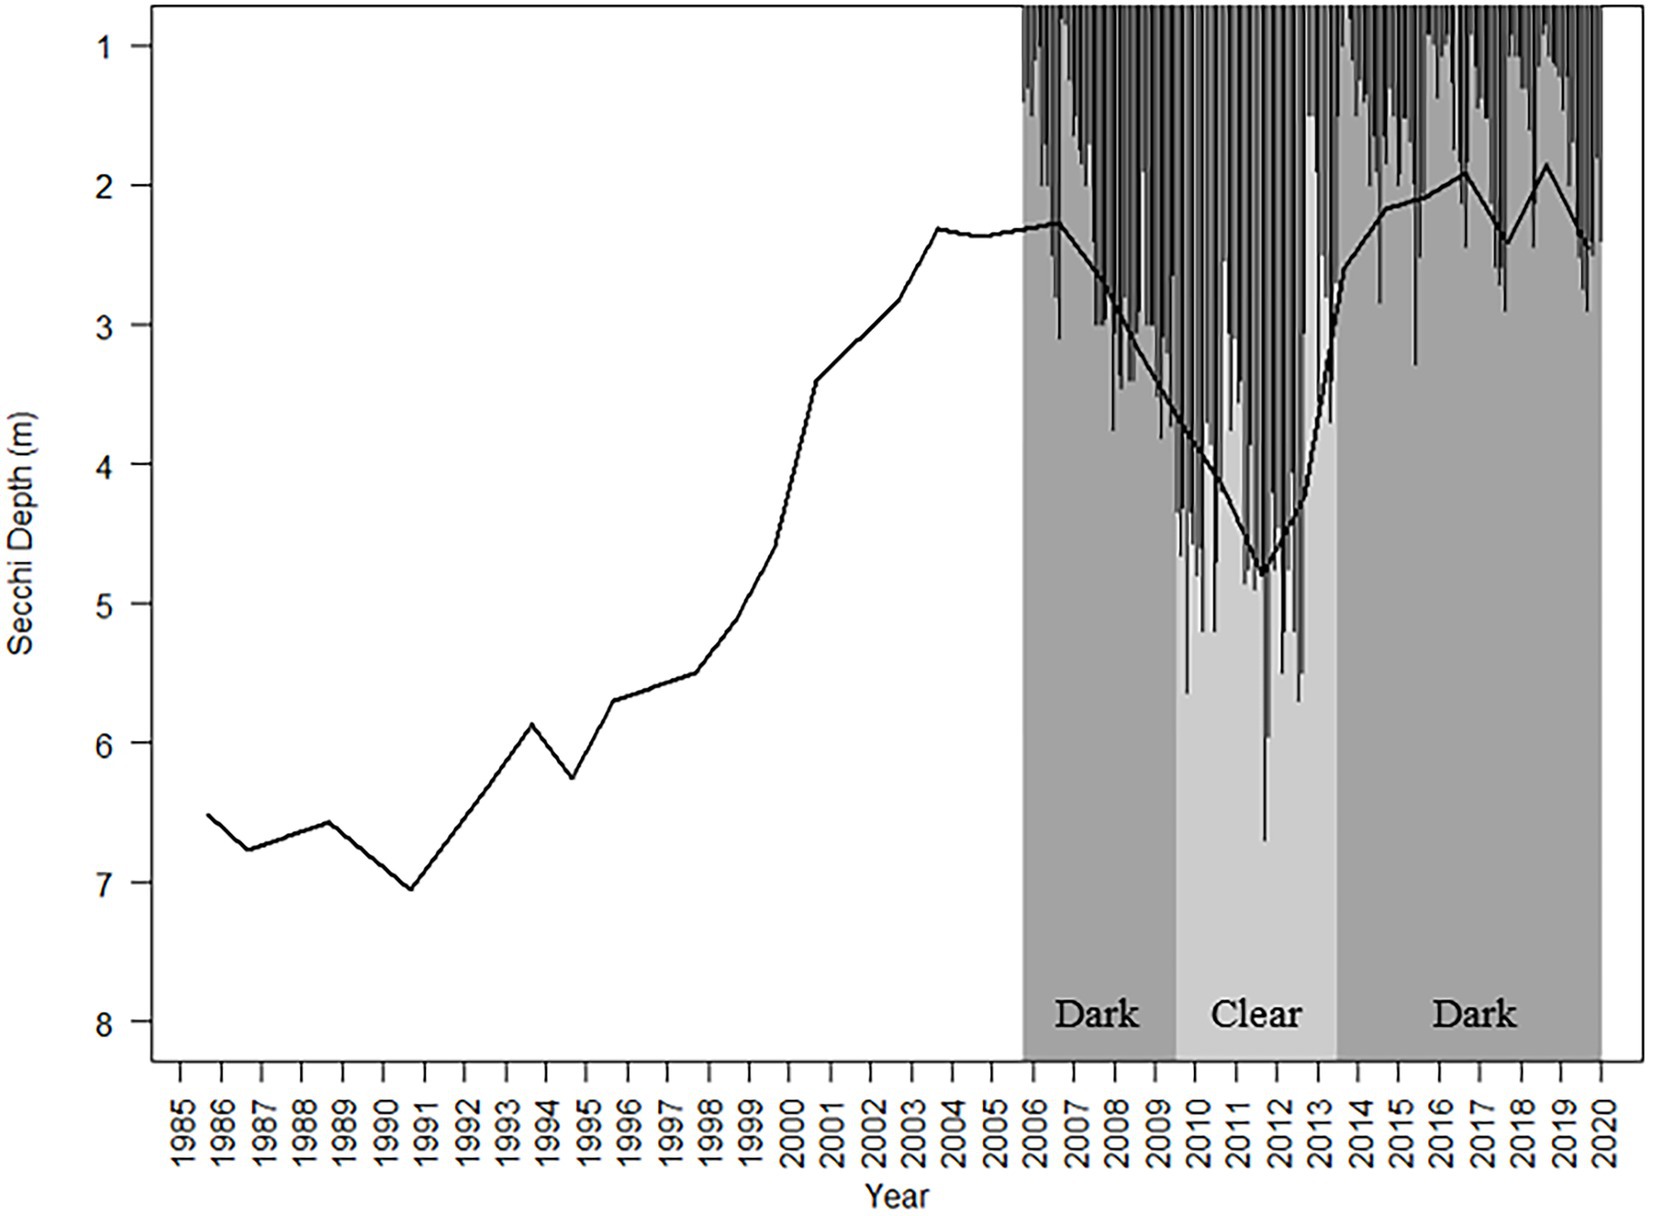
Figure 1. Average annual (1985–2019, line) and monthly (October 2005–December 2019, bars) Secchi depth measured during monthly phytoplankton sampling. The two diatom-based transparency phases are shown – dark (October 2005–July 2009 and August 2013–December 2019; indicated by the dark gray background) and clear (August 2009–July 2013: indicated by the light gray background).
Sub-annual responses of diatoms to transparency changes
A total of 203 diatom taxa were identified in the 1985–2019 monthly calibration set (18 planktonic taxa and 185 tychoplanktonic taxa; Supplementary Table 5). The CONISS analysis separated diatom assemblages into two transparency phases – the dark phase (October 2005–July 2009 and August 2013–December 2019) and the clear phase (August 2009–July 2013; Figure 1; ANOSIM R = 0.36, p = 0.001; SIMPER = 60.1% dissimilarity). The Shannon Diversity Index was higher, and the phytoplankton abundance was lower during the clear diatom-transparency phase, compared to the dark diatom-transparency phase (Figure 2). The dark diatom-transparency phases (n = 122 months, two dark phases) were in total longer than the clear diatom-transparency phase (n = 47 months). The ISA determined 12 indicator taxa for the dark diatom-transparency phase and 70 indicator taxa for the clear diatom-transparency phase. The dark diatom-transparency phase indicators included Asterionella ralfsii var. americana, Aulacoseira herzogii, Aulacoseira tenella, Eunotia zasuminensis, Tabellaria fenestrata, and Urosolenia longiseta, which are all planktonic species and had high relative abundances during the dark diatom-transparency phase (Figure 3). The indicators of the clear diatom-transparency phase included Brachysira brebissonii, Brachysira gravida, Frustulia pseudomagaliesmontana, Kobayasiella mesp03, and Navicula leptostriata, which are all tychoplanktonic taxa (Figure 4). Fewer dark indicator taxa reached greater abundance during the dark diatom-transparency phase, than did clear-indicator taxa in the clear phase.
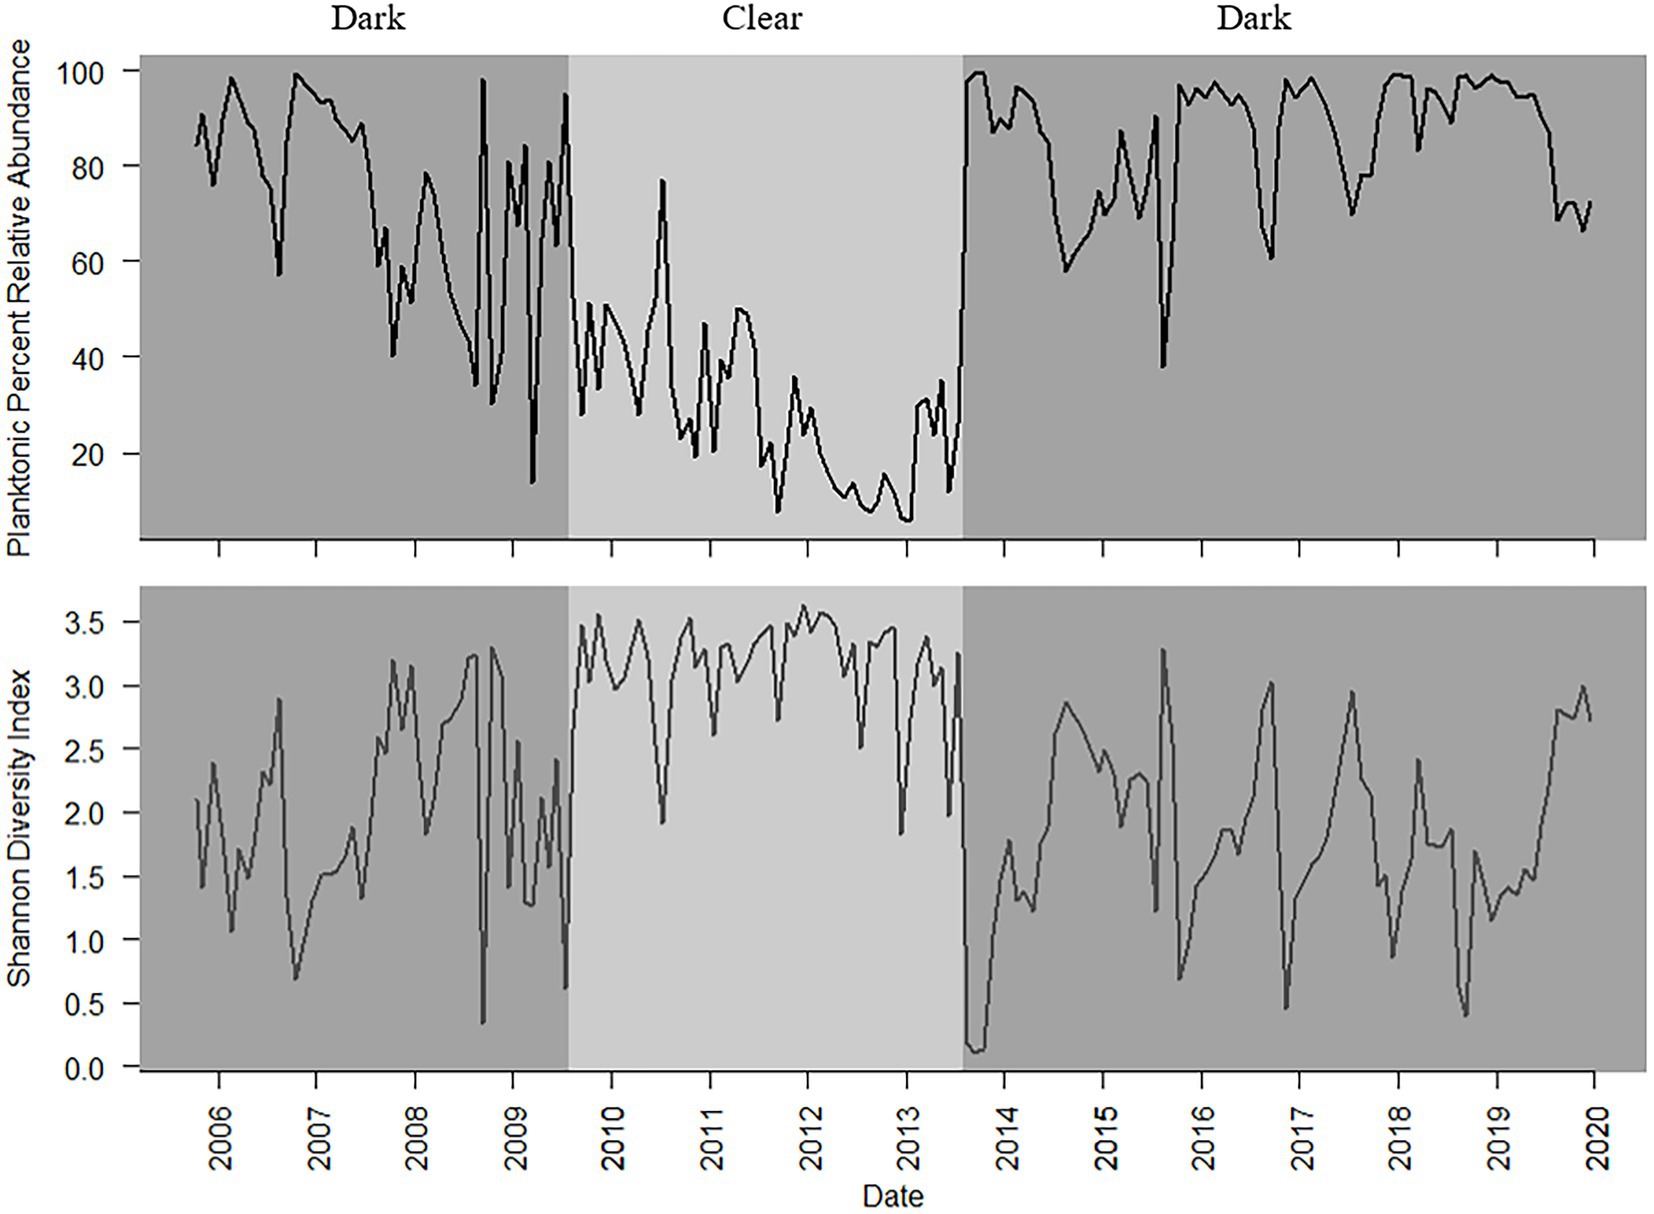
Figure 2. Planktonic diatom relative abundance (top) and Shannon Diversity Index (bottom) from October 2005 to December 2019, with dark and clear diatom-transparency phases denoted by the light and shaded background.
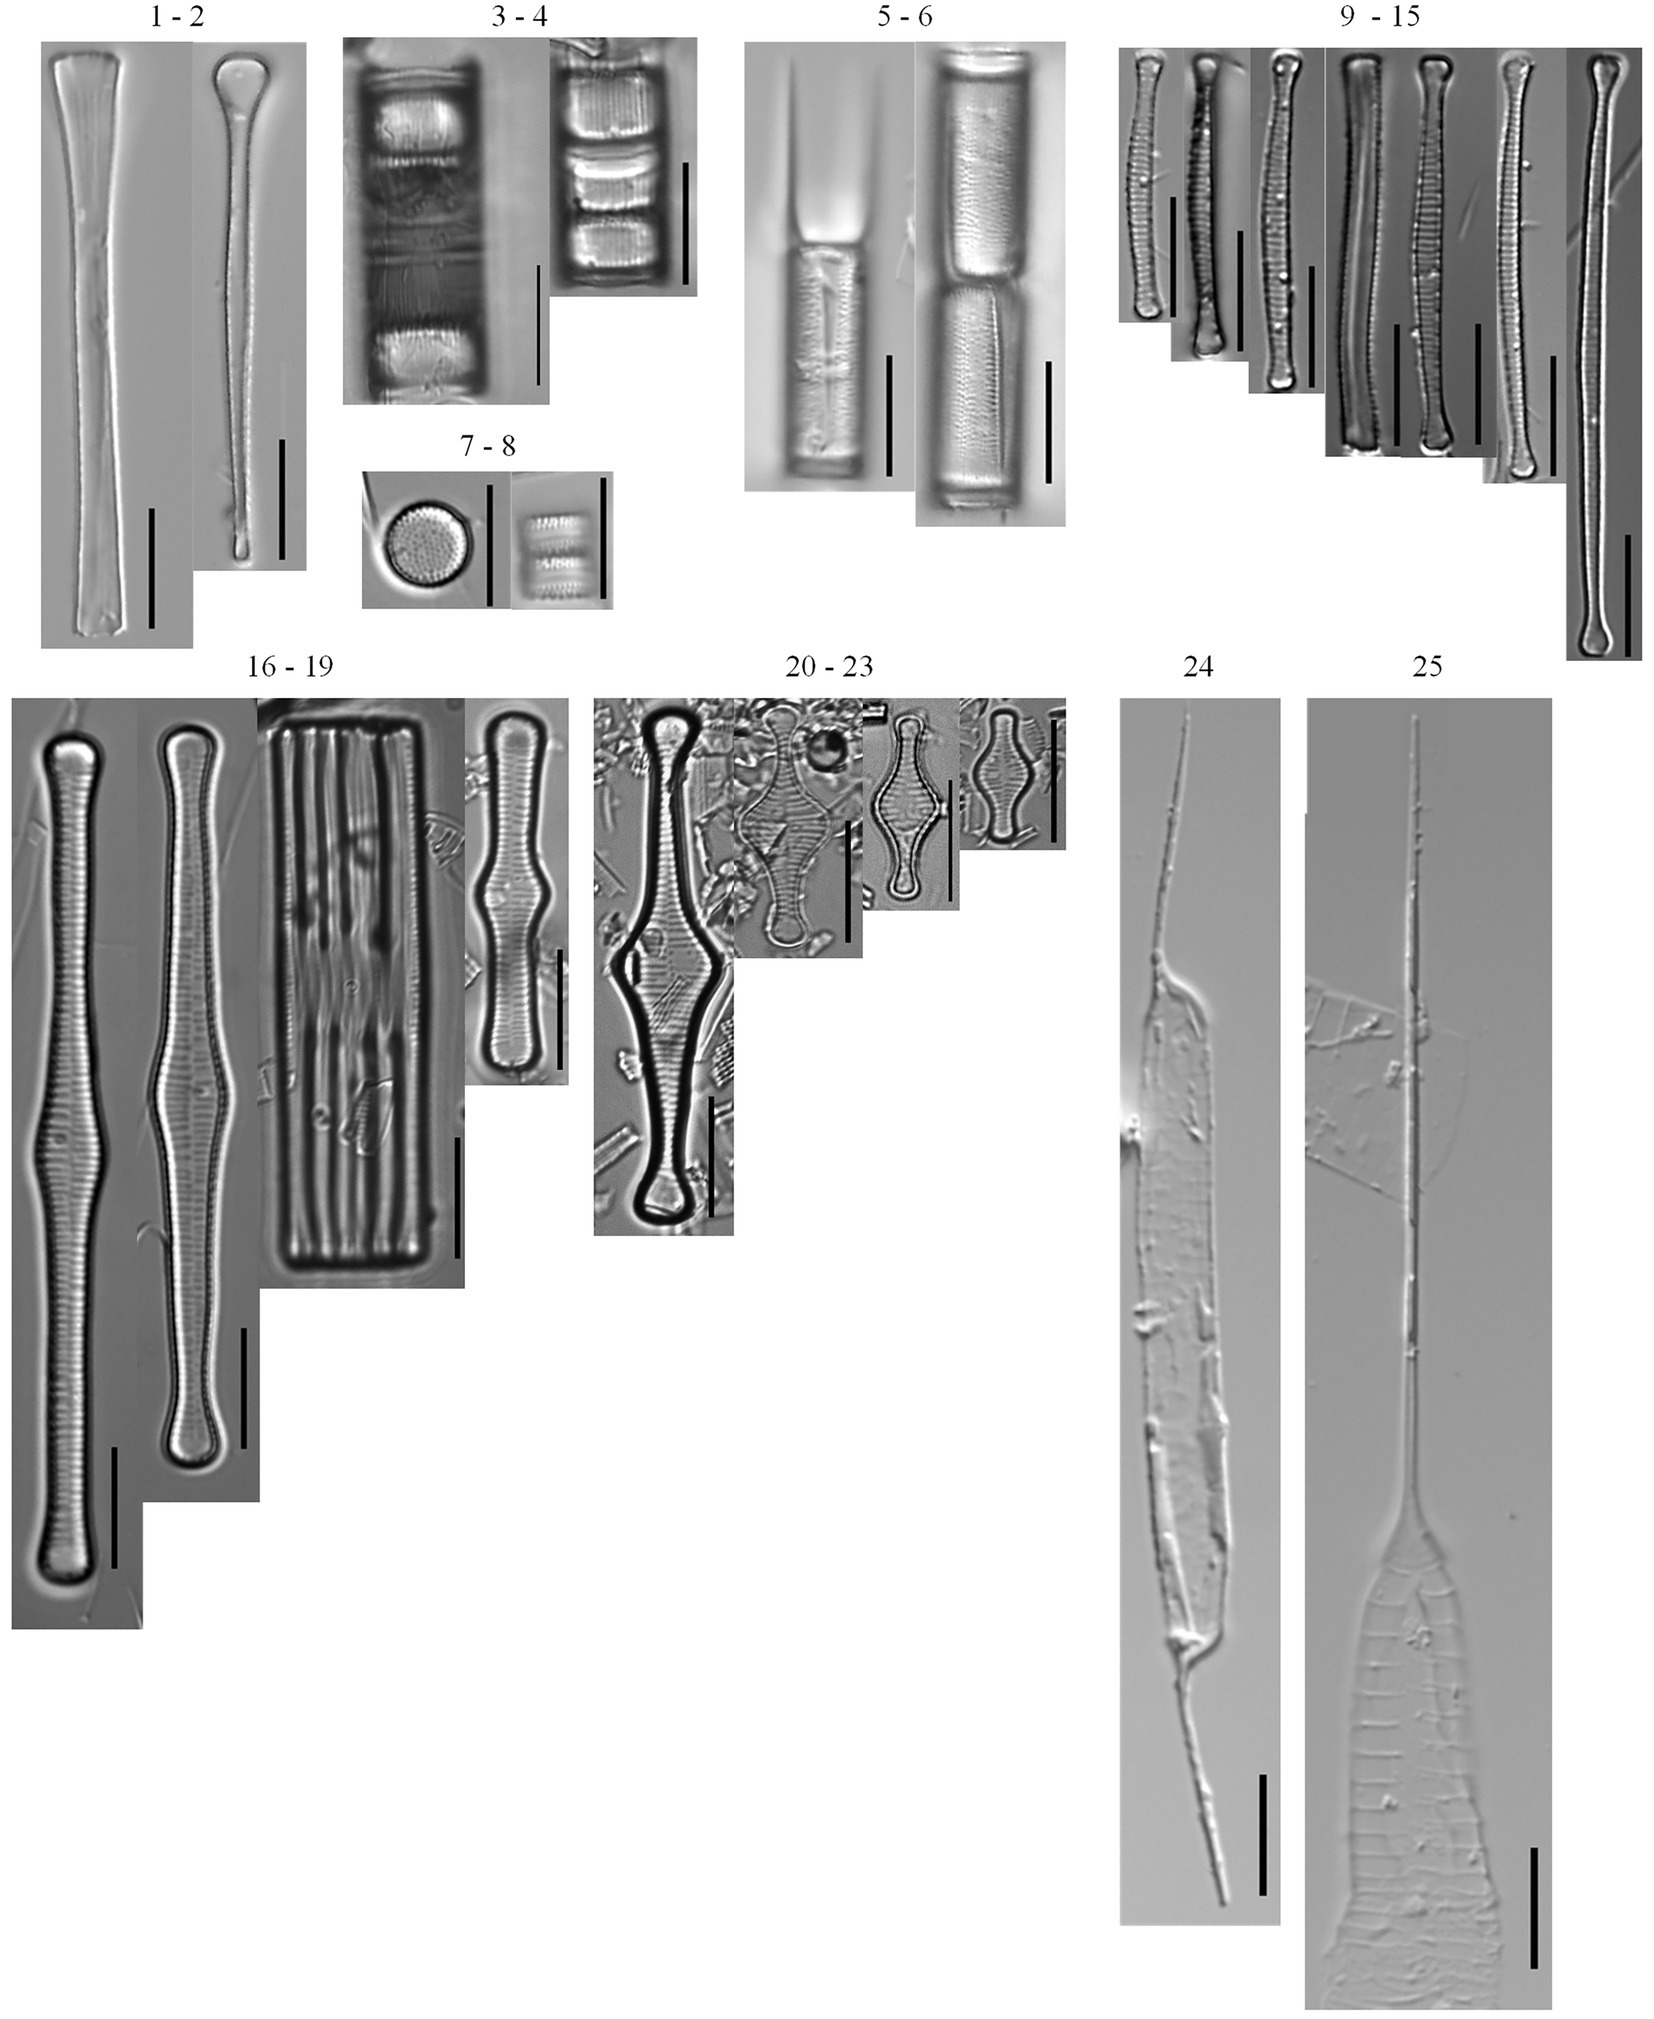
Figure 3. Planktonic diatom taxa found in the phytoplankton net monthly sampling (2005–2019) and the 166 cm sediment core. Common taxa (>10 samples): Asterionella ralfsii var. americana (1–2), Aulacoseira coroniformis (3–4), Aulacoseira herzogii (5–6), Aulacoseira tenella (7–8), Eunotia zasuminensis (9–15), Tabellaria fenestrata (16–19), Tabellaria flocculosa (20–23), Urosolenia eriensis (24), Urosolenia longiseta (25).
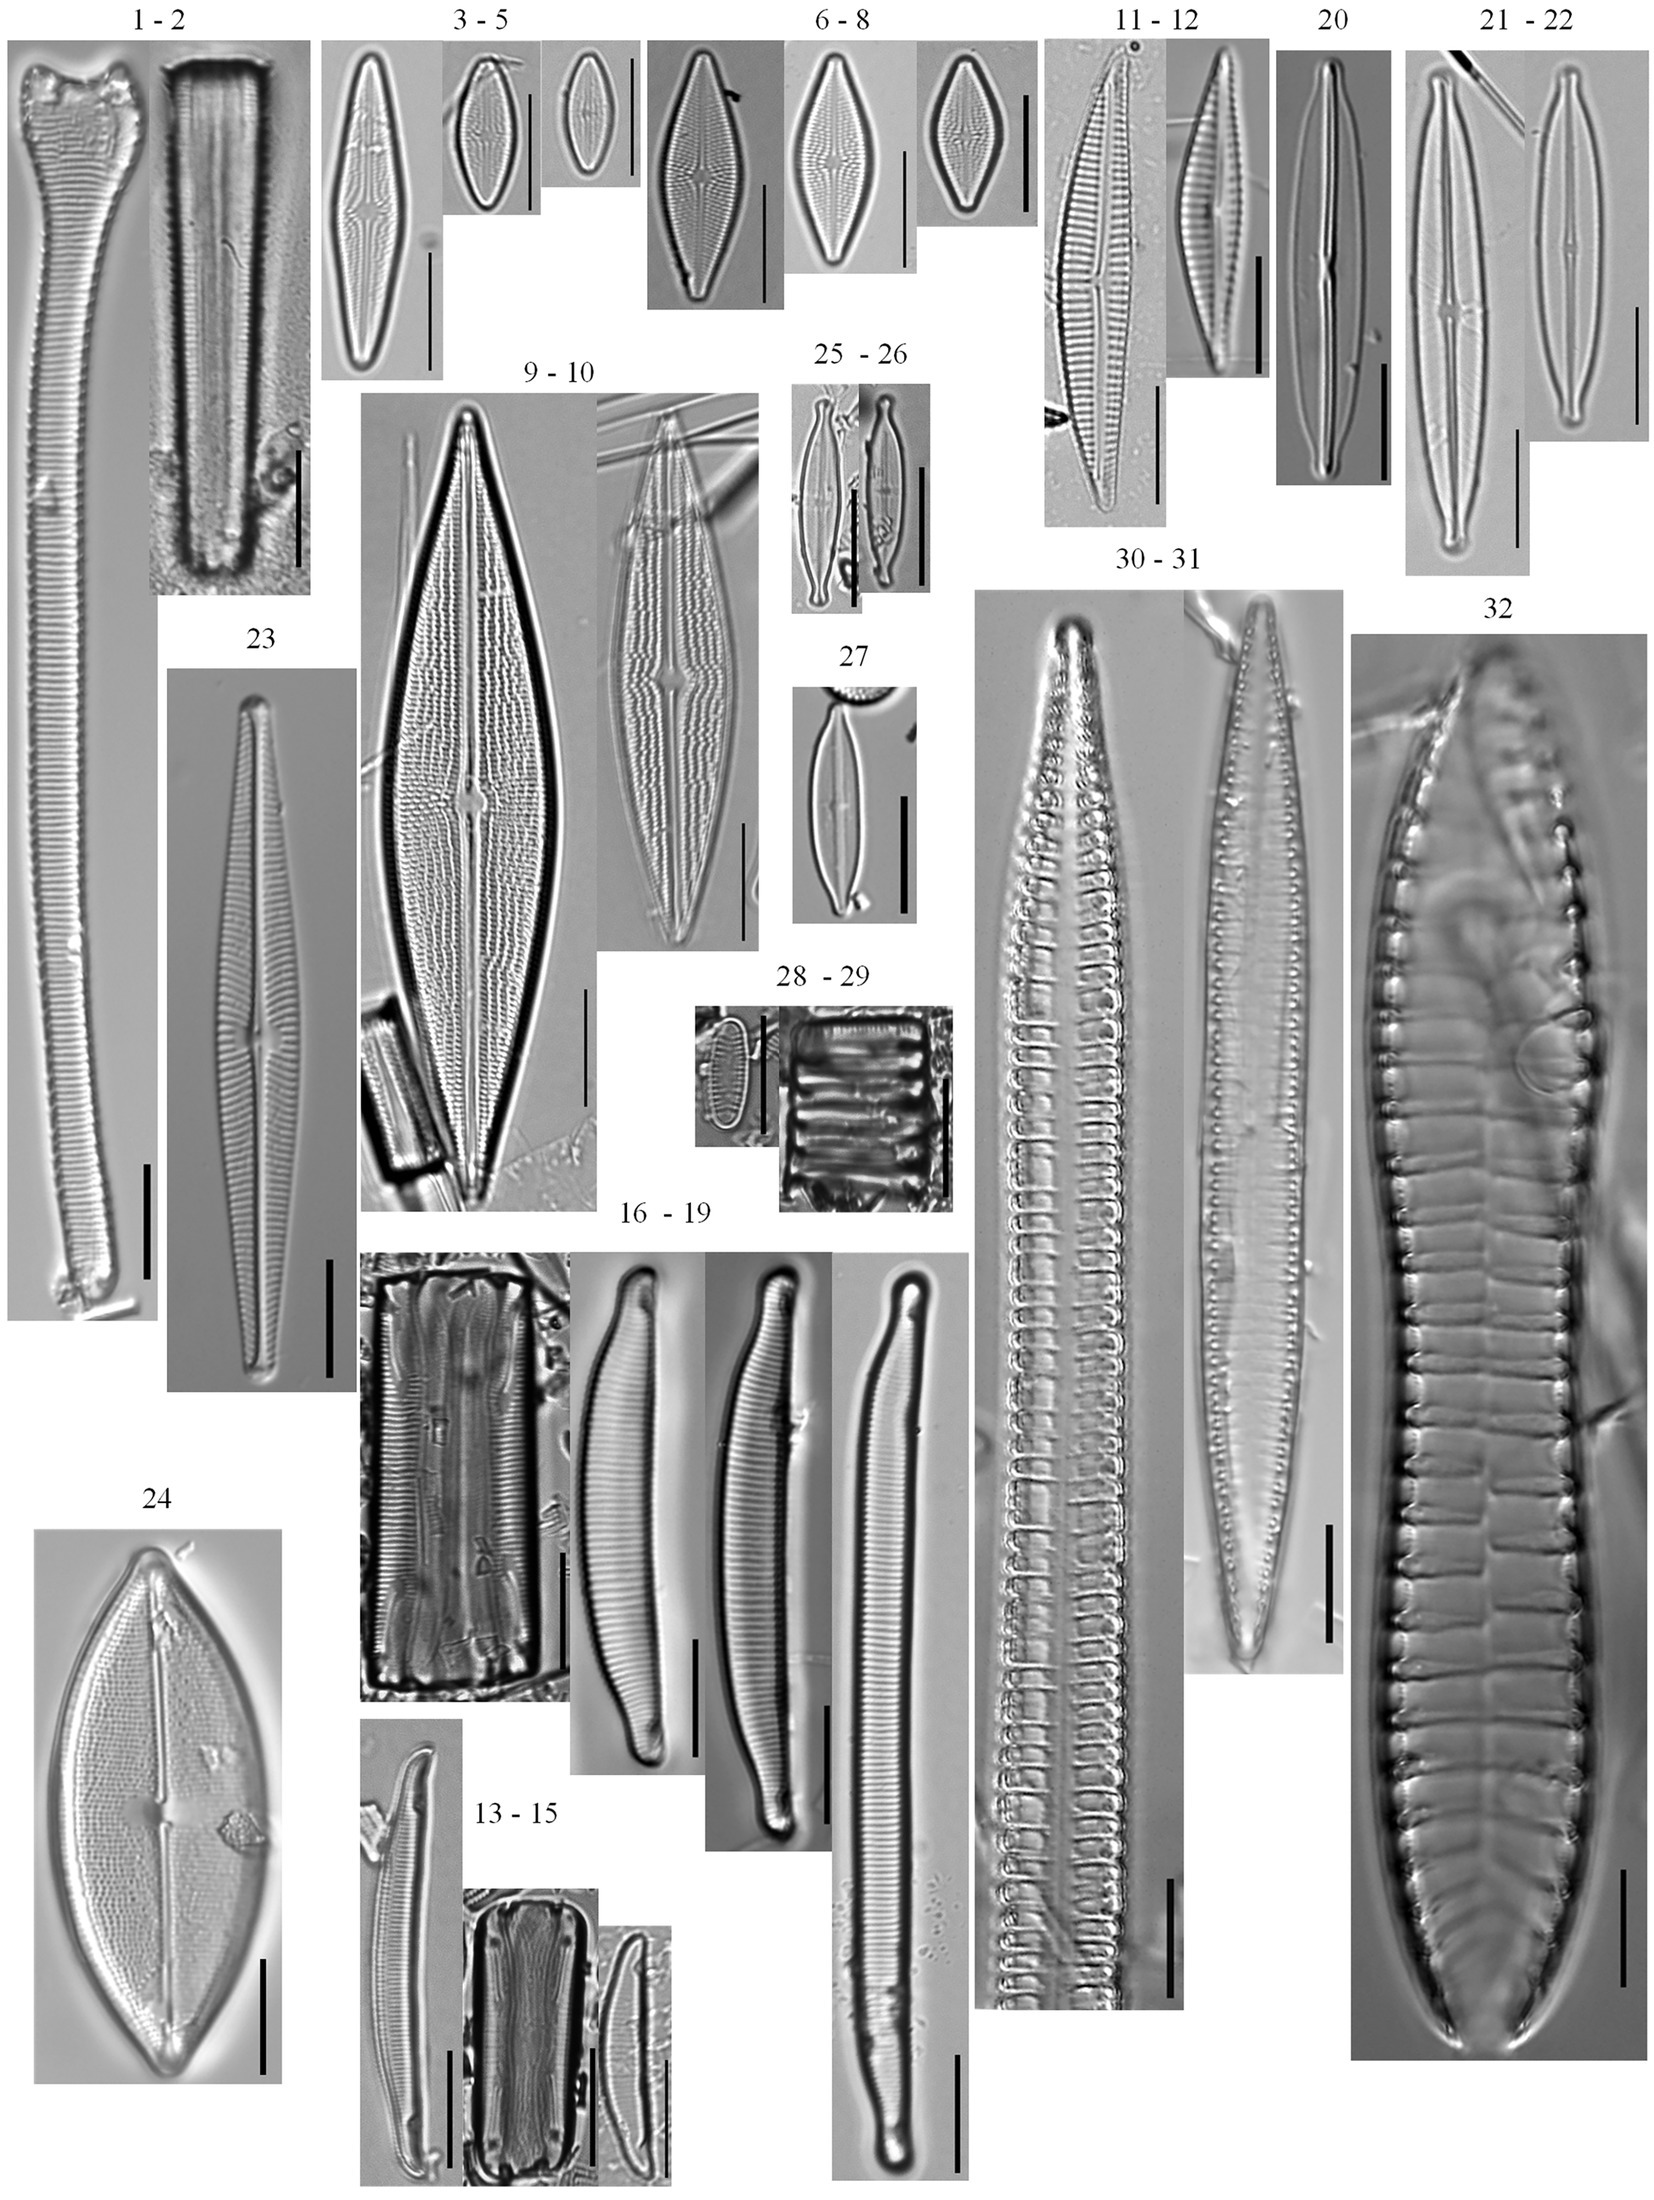
Figure 4. Tychoplanktonic diatom taxa found in the phytoplankton net monthly sampling (2005–2019) and the 166 cm sediment core. Actinella punctata (1–2), Brachysira brebissonii (3–5), Brachysira gravida (6–8), Brachysira serians (9–10), Encyonema neogracile (11–12), Eunotia incisa (13–15), Eunotia veneris (16–19), Frustulia pseudomagaliesmontana (20), Kobayasiella mesp03 (21–22), Navicula leptostriata (23), Neidium pseudodensestriatum (24), Nupela neotropica (25–26), Nupela rumrichorum (27), Oxyneis binalis var. elliptica (28–29), Surirella cuspidata (30–31), Surirella grunowii (32).
Two climate oscillations (PDO and SOI), two hydrological drivers of transparency (GWS, LWS), and 11 physicochemical variables differed between the two diatom-transparency phases (Supplementary Table 1A). The Secchi depth range for the clear diatom-transparency phase was 1.5–6.7 m (mean = 4.10 m), compared to the dark diatom-transparency phase, which had a Secchi depth range of 0.7–4.34 m (mean = 1.98 m; Supplementary Table 1A). The dark diatom-transparency phase had a higher GWS and TOC, resulting in a shallower PAR depth (Supplementary Table 1A). In contrast, the clear diatom-transparency phase had lower GWS depth and TOC, which enabled a deeper PAR and Secchi depth. The PDO, GWS, TOC, Secchi depth and the variables associated with PAR [1% PAR, 10%PAR, and PAR extinction rate (PAR Ext. rate)] were the main factors that influence the change in diatom assemblage between the two diatom-transparency phases (Figure 5A).
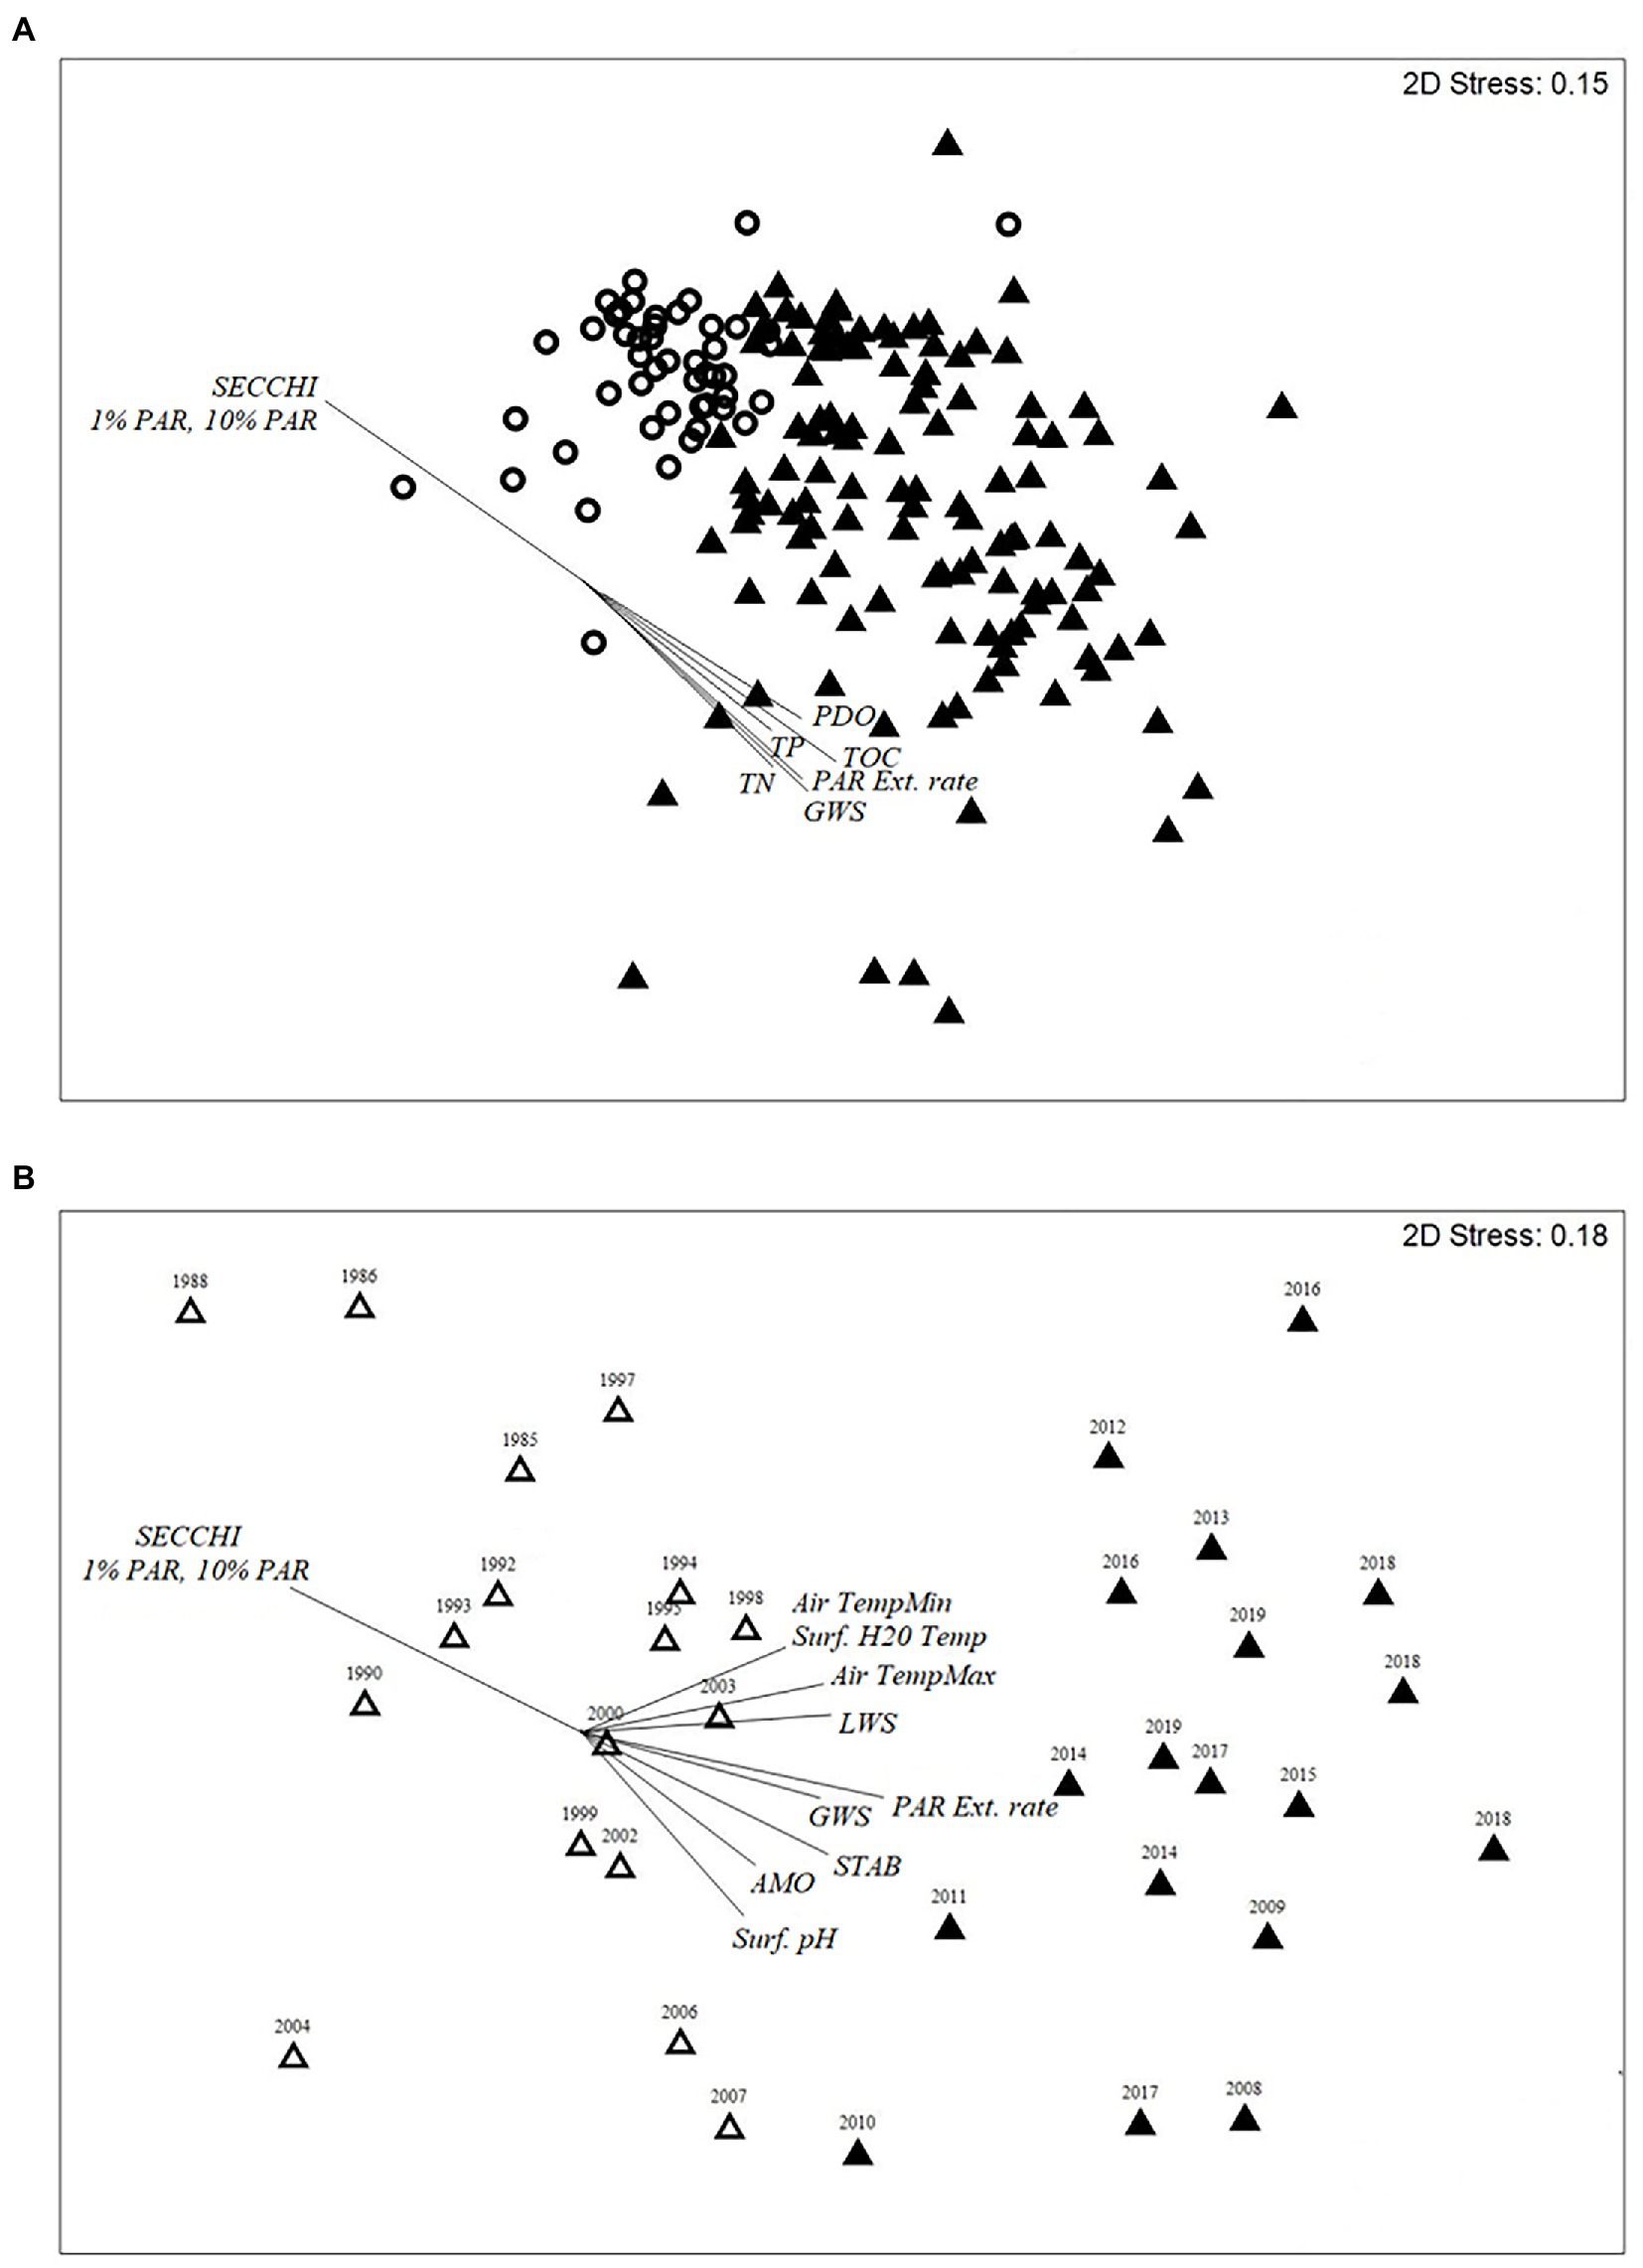
Figure 5. (A,B) Two-dimensional nMDS ordination biplot of (A) modern calibration diatom taxon realitive abundances and (B) of paleo calibration diatom taxon relative abundances. (A) nMDS plot of the Monthly record (2005–2019) of the two diatom-transprency phases; clear (circle) and dark (triangle). Vectors for the climate, hydrological and physiochemical parameters with a R2 > 0.5 are provided for plot (A). (B) nMDS plots of the two diatom-inferred paleo-diatom-transparency phases; dark (dark triangle) and clear (clear triangle, and contains some duplicate years because of the 210Pb age). Vectors for plot (B) are nutrient and silica flux rates (phosphorus, nitrogen, carbon, silica), nutrient ratios (C:N, N:P), 210Pb age of sample, ẟ15N and ẟ13C values, Shannon diversity index (SDI), the measured (Subzone 2a–3b) and predicted AMO (Gray et al., 2004 – Subzone 1a–1b), and Secchi depth (observed Secchi depth used since 1985, middle of subzone 3a-3b, and the diatom-inferred Secchi depth Secchi Depth from the paleo model was used for subzones 1a – middle 3a).
Decadal responses of diatoms to transparency and the “paleo” transfer function
A total of 163 diatom taxa were identified in the paleo calibration record (~1985–2019: 14 planktonic taxa and 149 tychoplanktonic taxa). The CONISS analysis separated the record into two paleo-diatom-transparency phases – clear (1985–2007) and dark (2008–2019) – with each phase having similar duration (clear; n = 17, and dark; n = 18; ANOSIM R = 0.757; SIMPER = 29.27% dissimilarity). The ISA identified 27 indicator taxa for the clear paleo-diatom-transparency phase and six indicator taxa for the dark paleo-diatom-transparency phase. Three of the dark paleo-diatom-transparency phase indicator taxa were also indicators of the dark diatom-transparency phase in the sub-annual record and were planktonic taxa (Aulacoseira tenella, Eunotia zasuminensis and Urosolenia longiseta; Figure 3). The clear paleo-diatom-transparency phase indicators were more diverse, including taxa from the genera Aulacoseira, Brachysira, Discostella, Encyonema, Eunotia, Frustulia, Kobayasiella, Navicula, Neidium, Nupela, Pinnularia and Tabellaria. The clear transparency phase indicators were similar between the annual (paleo-diatom) and sub-annual (modern-diatom) datasets, and were dominated by tychoplanktonic taxa, including Brachysira brebissonii, Brachysira gravida, Frustulia pseudomagaliesmontana, Kobayasiella mesp03, and Navicula leptostriata (Figure 4).
Shifts in the paleo diatom calibration assemblage were strongly influenced by the AMO and several physicochemical variables (Figure 5B). The dark paleo-diatom-transparency phase had a positive (warm phase) mean AMO index value (Supplementary Table 1B). However, the change in assemblage between the end of the clear paleo-diatom-transparency phase (1985–2007) and the NOAA AMO cool phase (1963–1994; Physical Sciences Laboratory, 2020) was lagged by about 13 years. The hydrologic drivers and lake physicochemical variables fluctuated in phase with the AMO cool and dark transitions, with clear water transparency during the AMO cool phase and dark in the AMO warm phase (mean Secchi depths of 4.83 m, 2.69 m, respectively). The “paleo” transfer function model had an R2 = 0.728 and RMSEP = 1.14 (Figure 6).
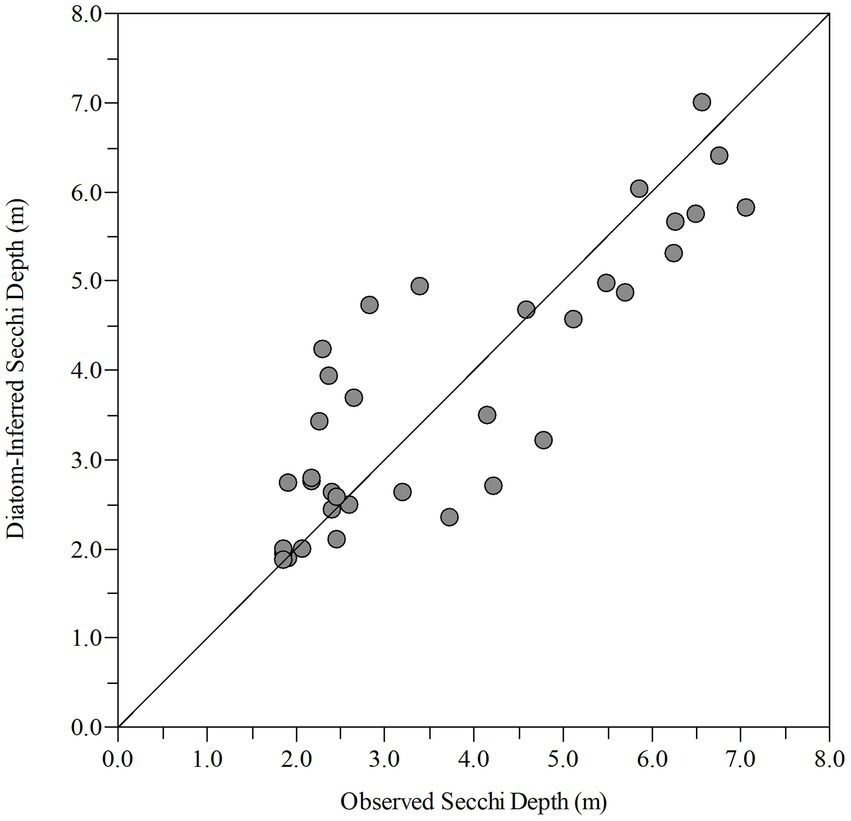
Figure 6. Observed vs. diatom-inferred Secchi depth from the paleo model (R2 = 0.728, RMSE = 0.905) (R(bootstrap)2 = 0.588, RMSEP(bootstrap) = 1.15).
Diatom-based transparency inferences and drivers
The diatoms and nutrients in the sediment core accumulated during the interval from the early 1600s to 2019 (Figures 7, 8). The sediment core had finer temporal resolution in the top 80 cm, with a range of 0.31–3.2 years cm−1 (mean 1.6 years cm−1), and the sedimentation rate ranged from 33.6 to 67.5 mg cm−2 year−1. The Hybrid model was used to estimate the age from 1892 to 2019 (80 cm to the core top). A constant mass sedimentation rate determined by the CFCS model (R2 = 0.956, n = 28) for the upper 80-cm of the core, was applied to the deeper section of the core (80–166 cm) and yielded a date for the bottom of the core (166 cm) of 1633. Temporal resolution in the core was lower below 80 cm, averaging 2.85 years cm−1, i.e., 245 years/86 cm (Figure 8).
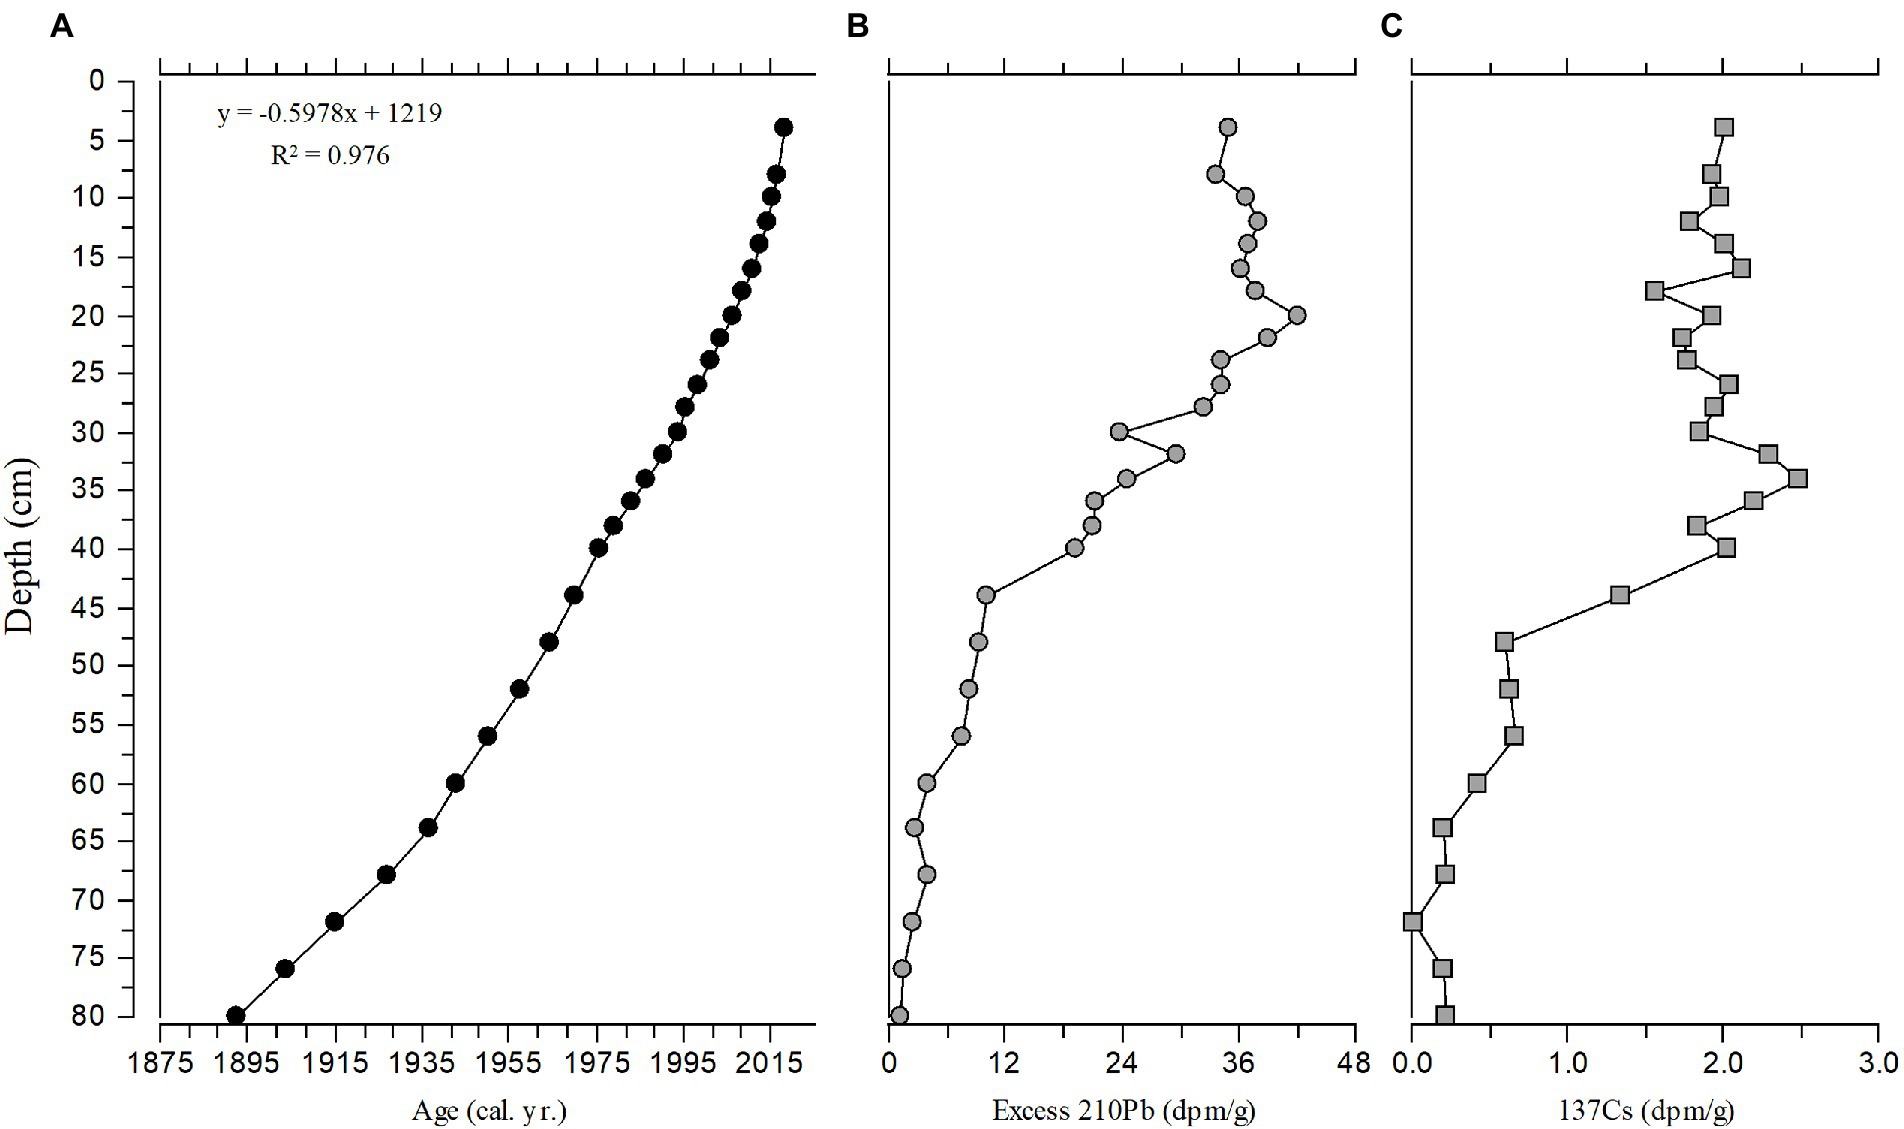
Figure 7. Stratigraphic plot for (A) Age, (B) Excess 210Pb, and (C) 137Cs with relationship to depth from the top 80 cm of the sediment core. Linear age vs. depth model is shown with the R2 value.
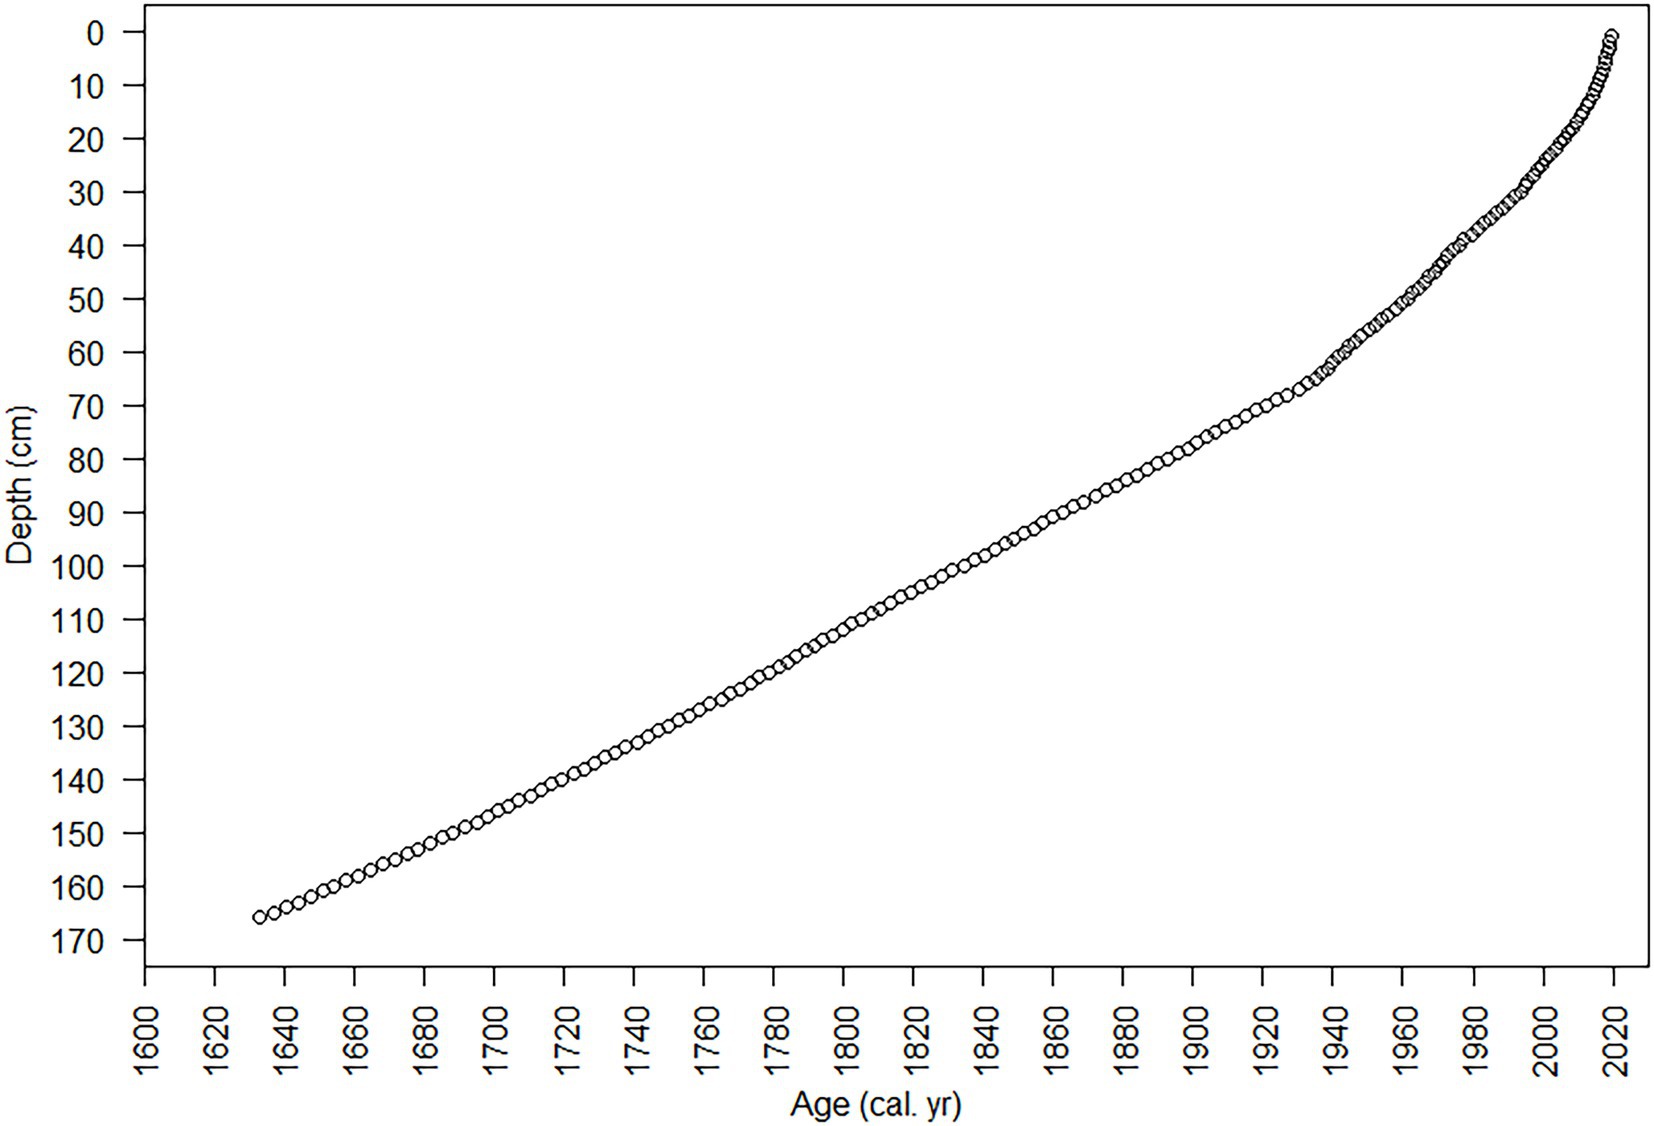
Figure 8. Age vs. depth plot from 210Pb analysis and age models. The 95% confidence intervals for dates estimated with 210Pb-dating models were small (~ ± 1 year) in the uppermost sample and increased with depth/age to ~ ± 11 year in the deepest sample (80 cm) with 210Pbunsupported. Dating errors for the CFCS-CRS Hybrid model were smaller (20 cm, 2006 ± 1 year; 40 cm, 1973 ± 2 year; 80 cm, 1893 ± 7 year) than those calculated for the CFCS model (20 cm, 2003 ± 2 year; 40 cm, 1976 ± 4 year; 80 cm, 1893 ± 11 year).
Diatoms in the sediment core were well preserved and a total of 216 taxa were identified (14 planktonic taxa and 202 tychoplanktonic taxa). Even the planktonic diatom in the genus Urosolenia, that is known to be delicate and poorly silicified, had intact identifiable portions. The CONISS determined three zones; zone 1 (166–76 cm), zone 2 (75–45 cm) and zone 3 (44–1 cm), and six subzones (1a, 1b, 2a, 2b, 3a, and 3b; 166–112 cm, 111–76 cm, 75–63 cm, 62–45 cm, 44–21 cm, and 20–1 cm, respectively, Figures 9–11 show ages for zones), from changes in the diatom assemblages in the sediment core. Zone 1 and zone 3 had the highest separation (ANOSIM R = 1; SIMPER = 50% dissimilarity), whereas zone 1 and zone 2 diatom assemblages were more similar (ANOSIM R = 0.75; SIMPER = 30% dissimilarity). Subzones 1a and 1b were the most similar (ANOSIM R = 0.468; SIMPER = 75% similarity), whereas subzone 3a and 3b were the most different (ANOSIM R = 0.744, SIMPER = 30% dissimilarity), compared to subzone 2a and 2b (ANOSIM R = 0.601, SIMPER = 27% dissimilarity). Eunotia was the dominant genus in all zones and was most abundant in zone 1 (bottom of the core; 45%; Figures 9, 10). Diatom diversity was highest in the middle zone (zone 2, subzone 2a and 2b), indicated by the Shannon Diversity Index (Figure 9). There is a marked transition to lower diatom diversity from Zone 2 to Zone 3 (the top zone). Zone 3 was dominated by five out of the 14 planktonic taxa that were present (Asterionella ralfsii var. americana, Aulacoseira herzogii, Aulacoseira tenella, Eunotia zasuminensis, and Tabellaria fenestrata), which had an overall mean of 46% relative abundance compared to zone 2 and zone 1 (12, 5%, respectively; Figure 9). Tychoplanktonic diatom taxa had higher abundance at the bottom of the core (zone 1) and declined in zone 2, with a sharp transition to a lower diversity from Zone 2b to 3a and thereafter decreasing substantially in zone 3 (Figure 10).
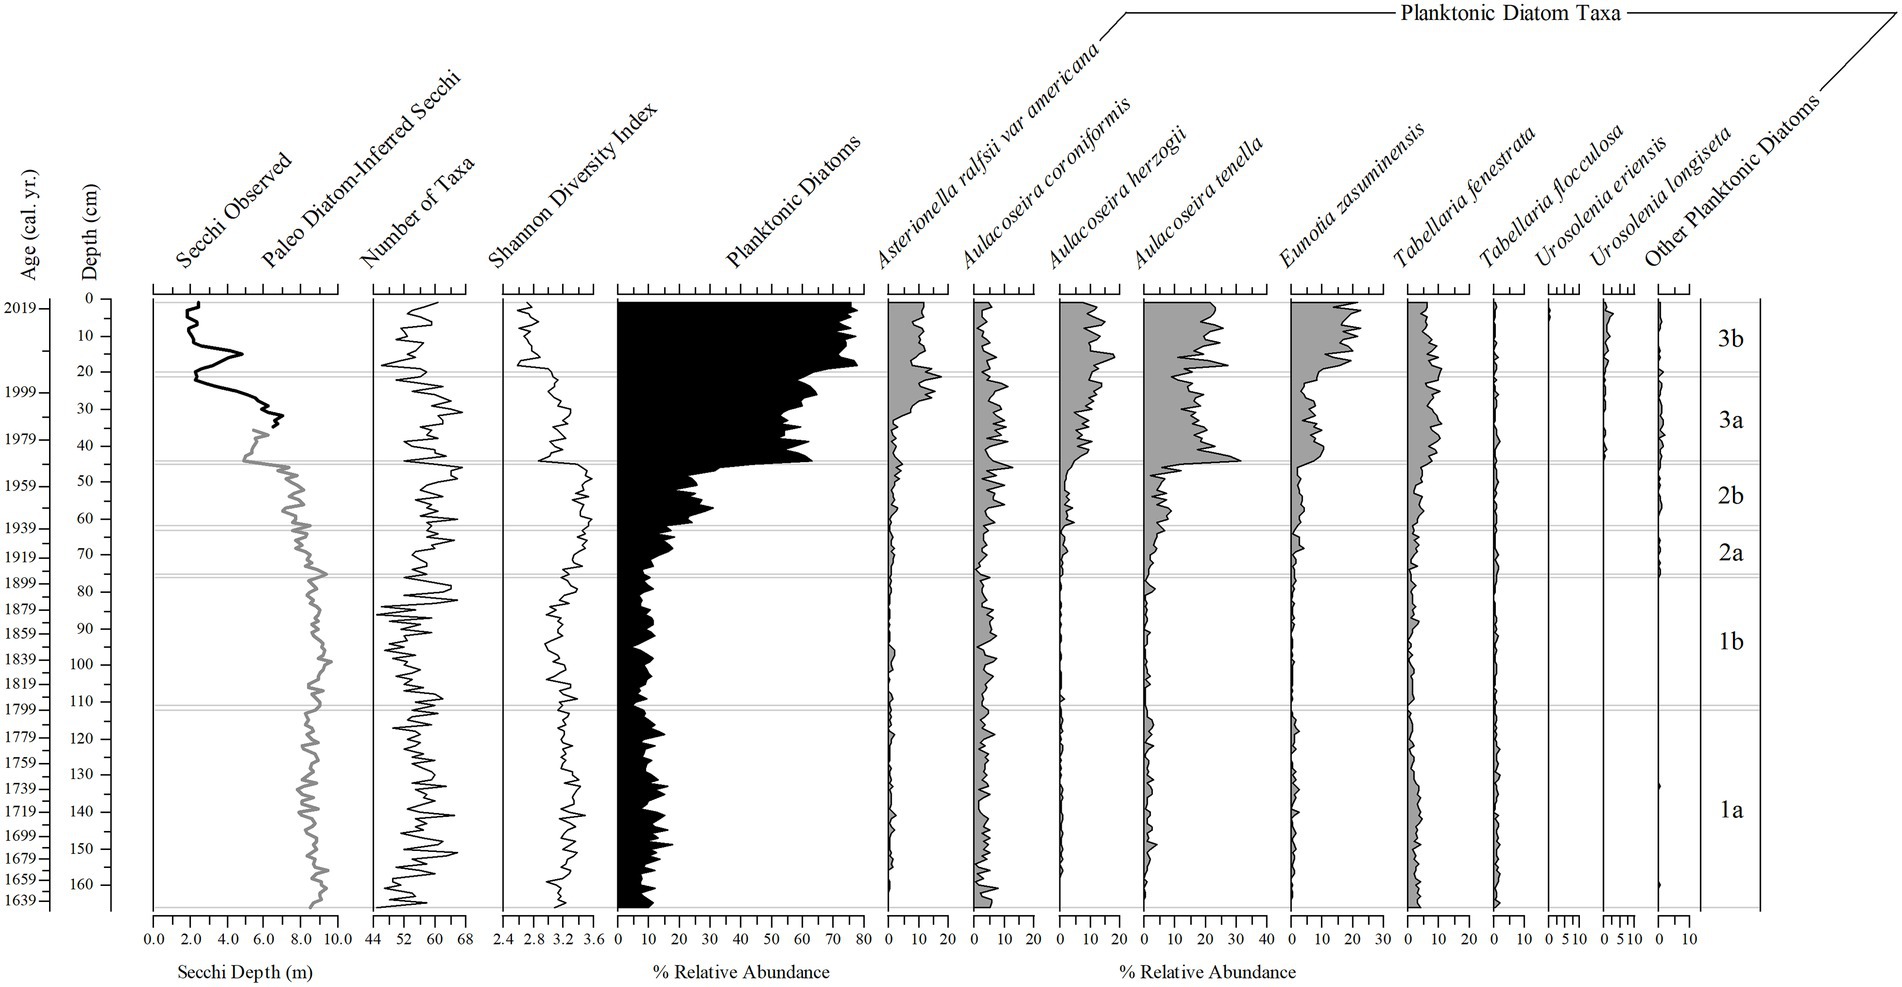
Figure 9. Stratigraphic plots of Secchi depth (observed – black line and diatom-inferred – gray line), number of diatom taxa present, Shannon Diversity Index, the percent relative abundance of planktonic diatom taxa, and the percent relative abundance of nine planktonic diatom taxa found throughout the 166 cm (1633–2019) sediment core. Subzones (right 1a–3b) are determined by the change in diatom assemblage from a constrained cluster analysis.
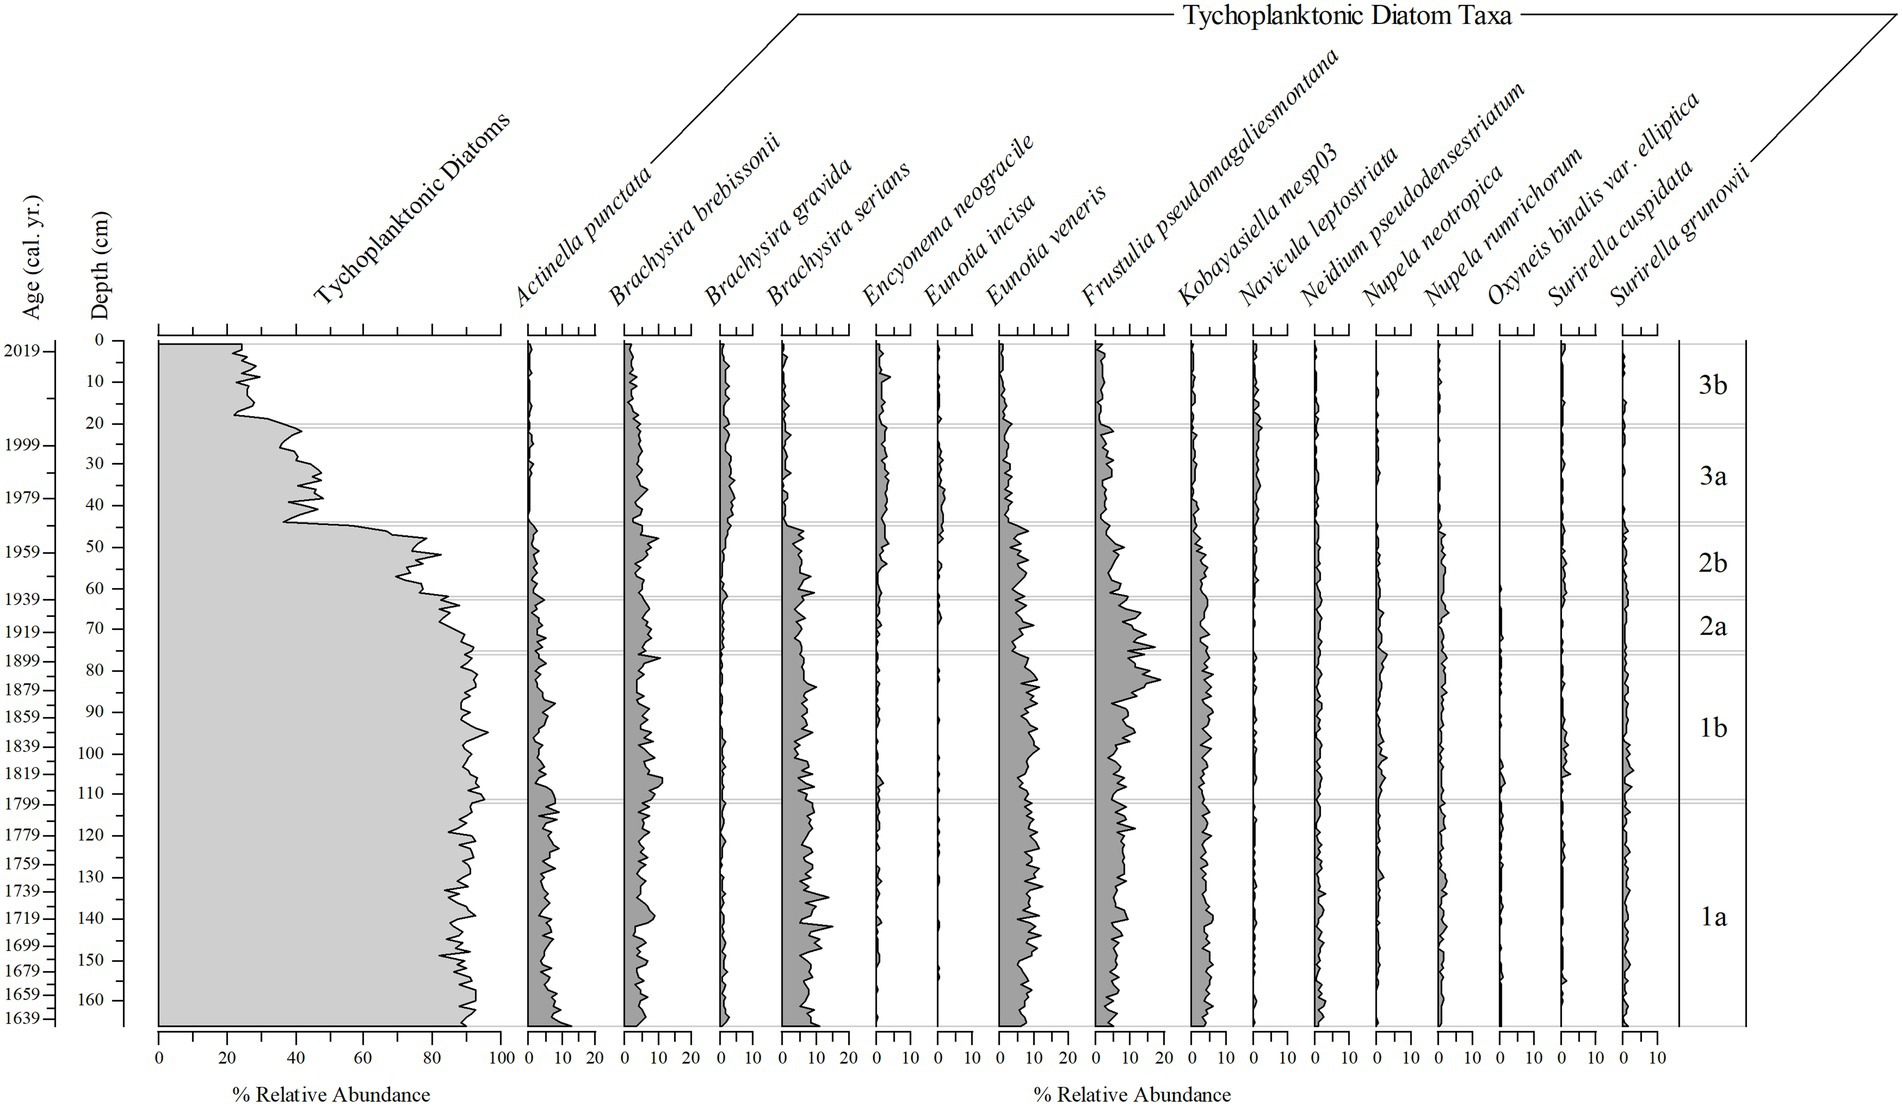
Figure 10. Stratigraphic plots of the percent relative abundance of tychoplanktonic diatom taxa, and the percent relative abundance of 16 tychoplanktonic diatom taxa (from 202 taxa) found throughout the 166 cm (1633–2019) sediment core.
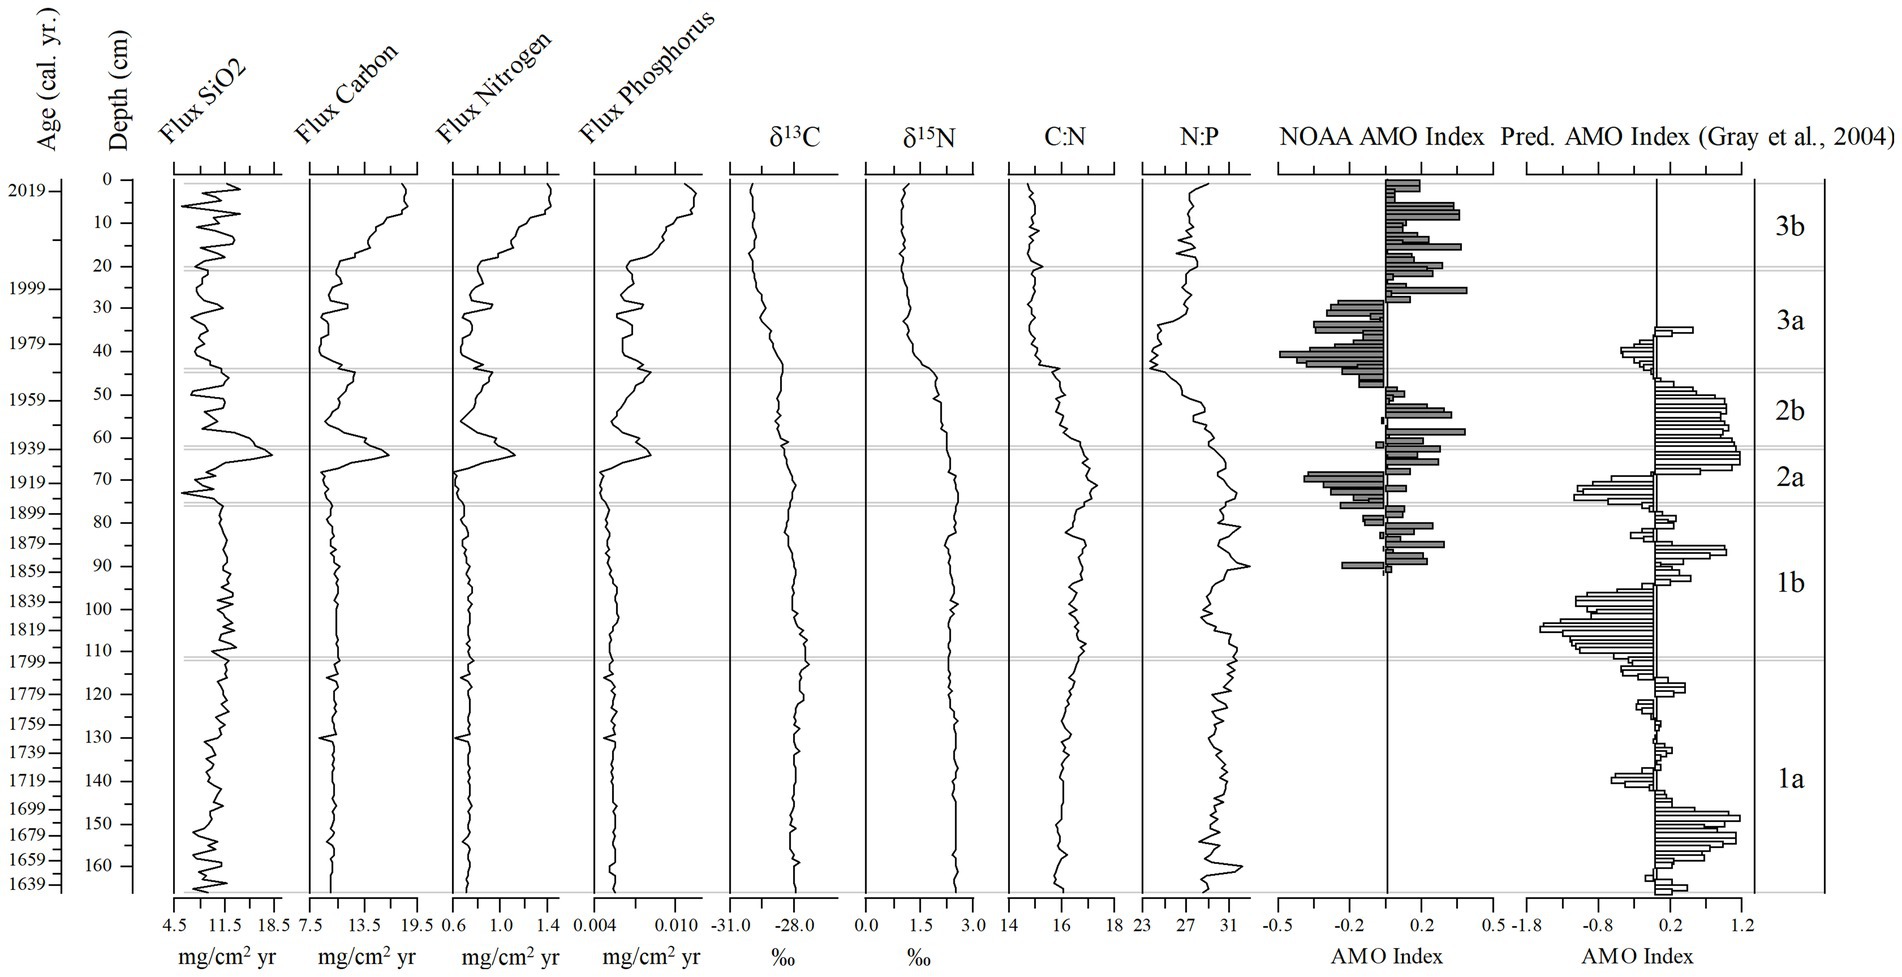
Figure 11. Stratigraphic diagram of flux rates of silica (SiO2), nitrogen, carbon, and phosphorus, ẟ15N and ẟ13C values, and the C:N and N:P ratios, from the sediment core (166 cm, 1633–2019). The timeseries for the AMO Index and the predicted AMO Index (Gray et al., 2004 model) are also shown.
The “paleo” model had strong taxonomic overlap with the sediment core (71.4%). The diatom-inferred transparency record had greater Secchi depth in zones 1 and 2 (range 7.8–9.6 m, and 6.1–9.4 m) compared to the diatom-inferred and observed Secchi depth in subzone 3a (range 2.2–7.0 m) and the observed Secchi depth in subzone 3b (1.86–4.8 m; Figure 9). The diatom-inferred transparency record, using the “paleo” model, had an estimated Secchi depth of 5.34 m in 1974 and 5.62 m in 1977, close to the measured annual averages in 1974 (4.27 m) and 1977 (5.40 m).
Total nutrient (TC, TN, TP) accumulation rates showed similar trends to the diatom-inferred transparency record, but with a stronger notable pulse in the 1930s followed by increased nutrient accumulation rates after 1999 (Figure 11). The C:N ratio increased steadily to subzone 2b, then decreased toward the top of the core, whereas there was a decline in the N:P ratio in subzone 3a (Figure 11). The δ13C and δ15N showed a more stable pattern, except those values in subzone 1a were higher than in subzone 3b (Figure 11). The SiO2 accumulation rate was variable throughout the core with a peak in the mid-1930s (Figure 11). Changes in diatom assemblage composition were strongly related to Secchi depth, the three nutrient accumulation rates, the two stable isotope values, and SDI (Supplementary Figure 2). The AMO and SiO2 did not have a strong relationship with the diatom assemblage fluctuations (Supplementary Figure 2). The relationship between the AMO and diatom-inferred Secchi depth was stronger in more recent times (1964–2019, R2 = 0.43) than in the past (1856–1962, R2 = 0.03; Figure 12).
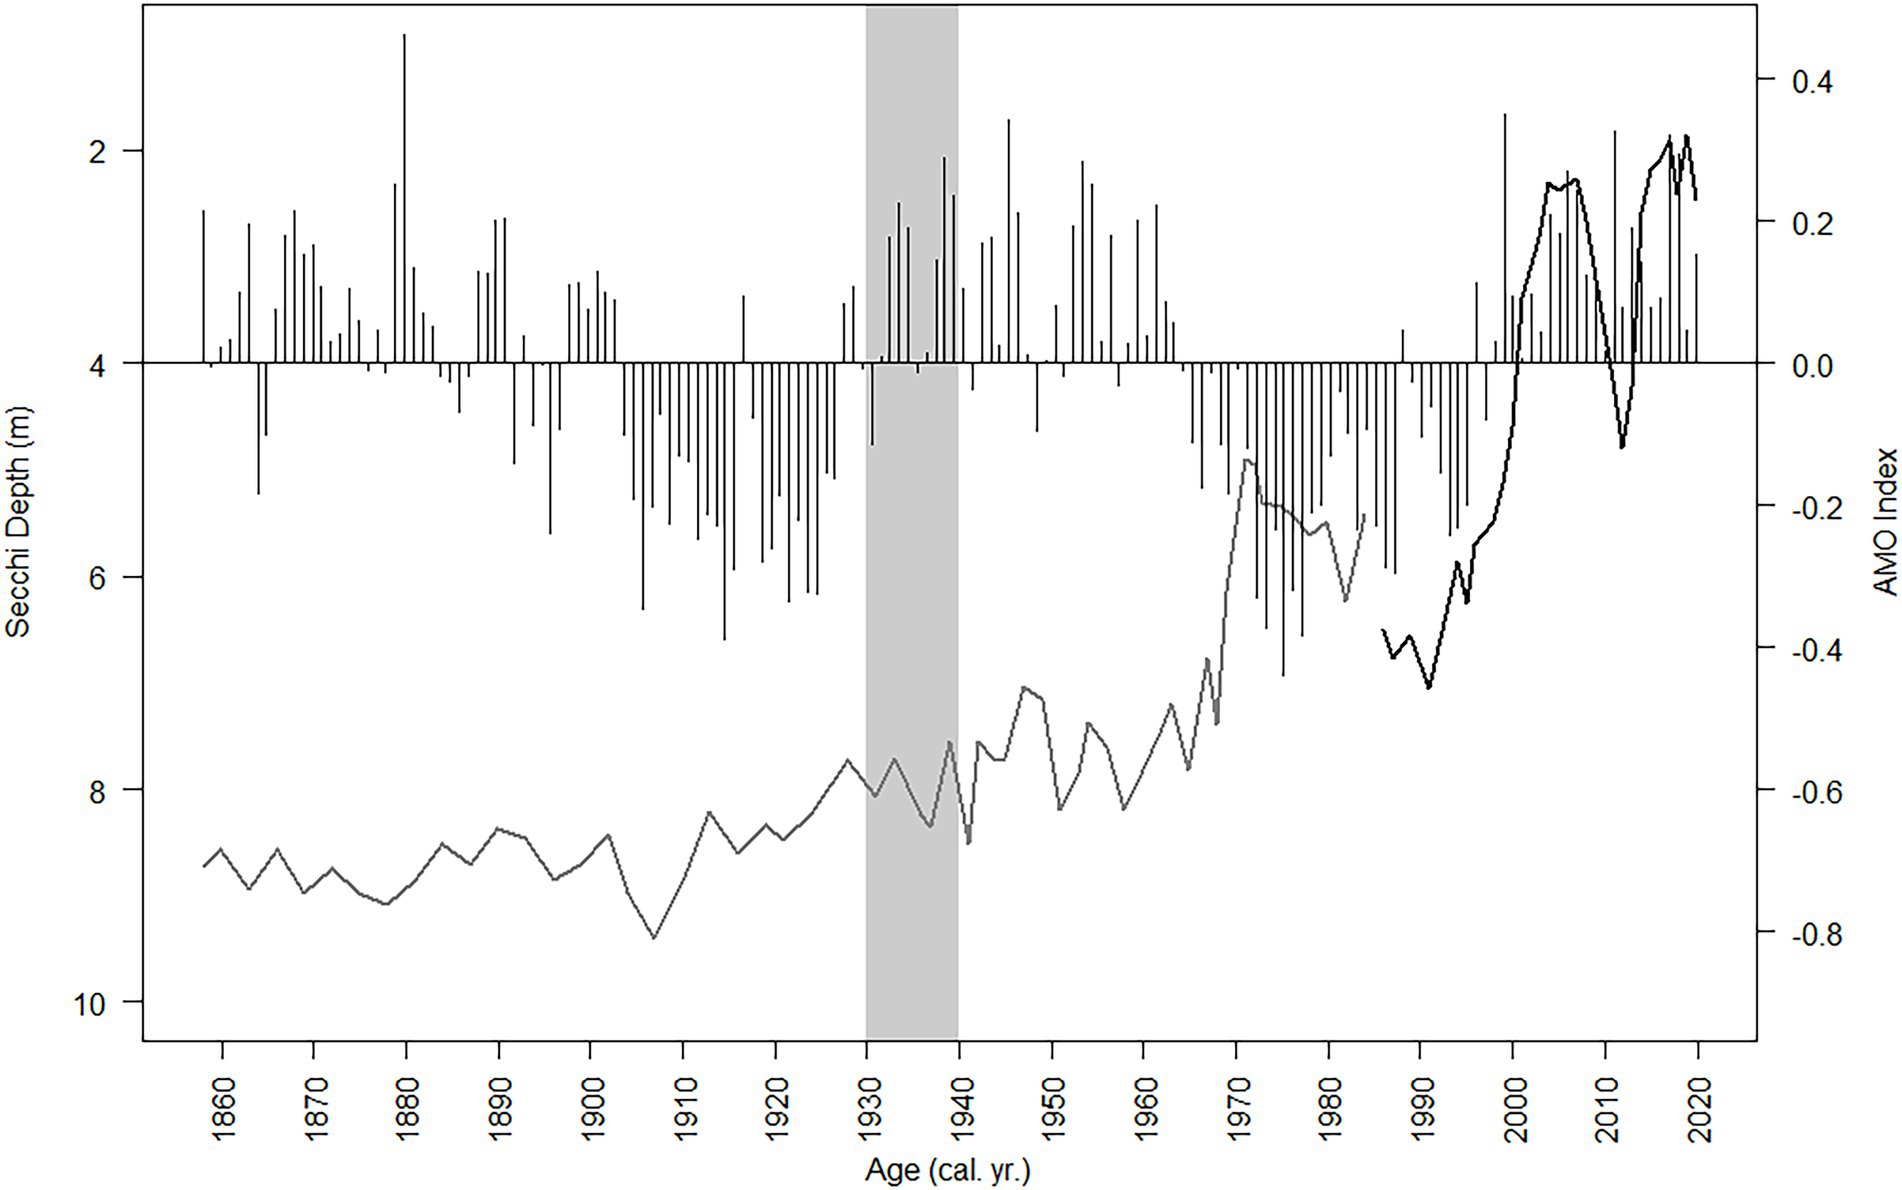
Figure 12. Secchi depth (observed and diatom-inferred, black line and gray line respectively) and the NOAA AMO index oscillation (black bars) from 1856 to 2019. The gray bar is when the two ditches were dredged near Lake Annie (estimated between 1930 and 1940).
Discussion
The three climate oscillations (AMO, PDO, and SOI) that regulate Florida precipitation (Enfield et al., 2001; Moses et al., 2013) and water transparency in Lake Annie (Gaiser et al., 2009a,b; Sullivan et al., 2022) also regulate the lake’s diatom assemblage composition. The two diatom-transparency lake phases (dark/clear/dark from 2005 – present) and two paleo-diatom-transparency phases (clear/dark 1985 – present) had different diatom assemblages, with overlapping representation between the dark and clear phases. The relationship between transparency and diatom assemblage composition in the long-term data and upper sediment record (“paleo” model) provided inferences (RMSE 0.905, Figure 6) for Lake Annie’s transparency extending back to about the mid-1600s. The diatom-inferred Secchi depth suggests the transparency of the lake was clear until the watershed ditches were dug, after which a climate-regulated clear/dark cyclical pattern began in 1969 and continued to present. In addition, nutrient accumulation rates were low before the ditches were excavated, but increased and oscillated thereafter. That local, seemingly minor land modification in the 1930s, enhanced the impact that the AMO and PDO play in regulating Lake Annie’s transparency, with the AMO being more recognizable than the PDO in our sediment record because of its multi-decadal rather than sub-decadal oscillation.
Sub-annual responses of diatoms to transparency changes
The sub-annual (seasonal) calibration data showed a distinct change in the lake diatom assemblage from tychoplanktonic to planktonic taxa as TOC increased and transparency declined, i.e., between clear and dark phases. Other studies have shown that light availability regulated by cDOC concentration is a key factor in controlling shifts in dominance from benthic to planktonic diatom taxa (Rosén et al., 2009; Gushulak and Cumming, 2020). In Lake Annie, the clear phase also had higher diatom species richness than the dark phase. A whole plankton community study of Lake Annie used the same 14-year record (2005–2019) and showed similar break points for the dark and clear transparency phases, as well as a lag in response to the AMO phase transition (Sullivan et al., 2022). Diatom biovolume was high in the dark phase and decreased in the clear phase, as biovolume of other microalgae, like synurophytes, increased (Sullivan et al., 2022). In addition to low TOC concentrations, the clear phase also had lower nutrient concentrations, suggesting a higher degree of nutrient limitation during the clear phases, whereas light may play a stronger role in regulating composition during the dark phase, when nutrients are more available (Isles et al., 2020, 2021). Higher nutrient concentrations are expected in times of higher cDOC, and a single rainfall event (or in temperate regions, snowmelt) can leave a long-term legacy on lake color and trophic status (Ågren et al., 2010; Qiao et al., 2017). The dark phase planktonic diatom indicators included species that tolerate both higher TOC, like Aulacoseira tenella and Eunotia zasuminensis (Eloranta, 1986; Burge and Edlund, 2017), and thrive at higher nutrient concentrations, like Aulacoseira herzogii and Tabellaria fenestrata (Wessels et al., 1999; DeColibus and Lowe, 2013; Bicudo et al., 2016). These taxa may also respond to corresponding changes in storm-generated mixing, which is more frequent in the dark phase and known to produce significant changes in phytoplankton species composition (Stockwell et al., 2020).
Decadal responses of diatoms to transparency and the “paleo” transfer function
We were able to generate a transfer function from the neolimnological climate and physicochemical data and the 210Pb-calibrated diatom record from the upper 35 cm of the core (1985–2019) because of the finer temporal resolution in the upper sediments where the diatom assemblage in each centimeter represented approximately annual resolution. The “paleo” transfer functions had similar oligotrophic, mesotrophic and dystrophic taxa seen in other Florida lakes (Whitmore, 1989), including Eunotia incisa and Tabellaria fenestrata, however Lake Annie had more Aulacoseira and Eunotia taxa, like Aulacoseira herzogii and Eunotia zasuminesis, which are known to represent mesotrophic and dystrophic lake conditions and were not included in the Whitmore (1989) study, but have been seen in other Florida water bodies such as Lakes Suggs and Lou (Sweets et al., 1990). The shift in dominance from tychoplanktonic diatom taxa in the past to planktonic diatom taxa more recently implies that Lake Annie was clearer in the past than it has been in recent decades.
The chronological resolution of the upper 80 cm determined by the hybrid 210Pb model (0.3–3.2, mean = 1.6 years cm−1) was somewhat higher than that determined by Quillen et al. (2013, 2.6 years cm−1), which enabled us to achieve higher sampling frequency and detect changes at high temporal resolution throughout the core. Other Florida lakes in the region yielded cores that enabled inferences about long-term climate changes and recent trophic state shifts (Grimm et al., 1993, 2006; Brenner et al., 1996). Sampling resolution in the Lake Annie core, however, was much higher (1 cm), enabling us to infer past changes at a finer scale.
Diatom subzones
Quillen et al. (2013) identified three diatom zones in a 4,000-year record from Lake Annie: a “stable lake phase” (~ 4,000–250 cal year BP), a “lake acidification phase” (1800–1980 CE), and a “local hydrologic change phase” (1980–2003 CE). We were able to resolve these transitions more finely in our study. Subzone 1a and 1b equate to Quillen et al. (2013) “stable lake phase” (~1630–1800) and “lake acidification” phase (~1800–1900), respectively. We term subzones 2a and 2b the “land modification phase” (~1906–1938) and “post local land modification phase” (~1940–1968), respectively. The upper portion of the core reflects the clear to dark transition, with subzone 3a representing the “transitional phase from clear to dark” (~1970–2004) and subzone 3b representing the “dark phase” (~2006–2019). Each of these time periods is described below, focusing on diatom diversity, change of tychoplanktonic to planktonic species, carbon, nitrogen and phosphorus accumulation rates, diatom-inferred water transparency, and the AMO (Table 1).
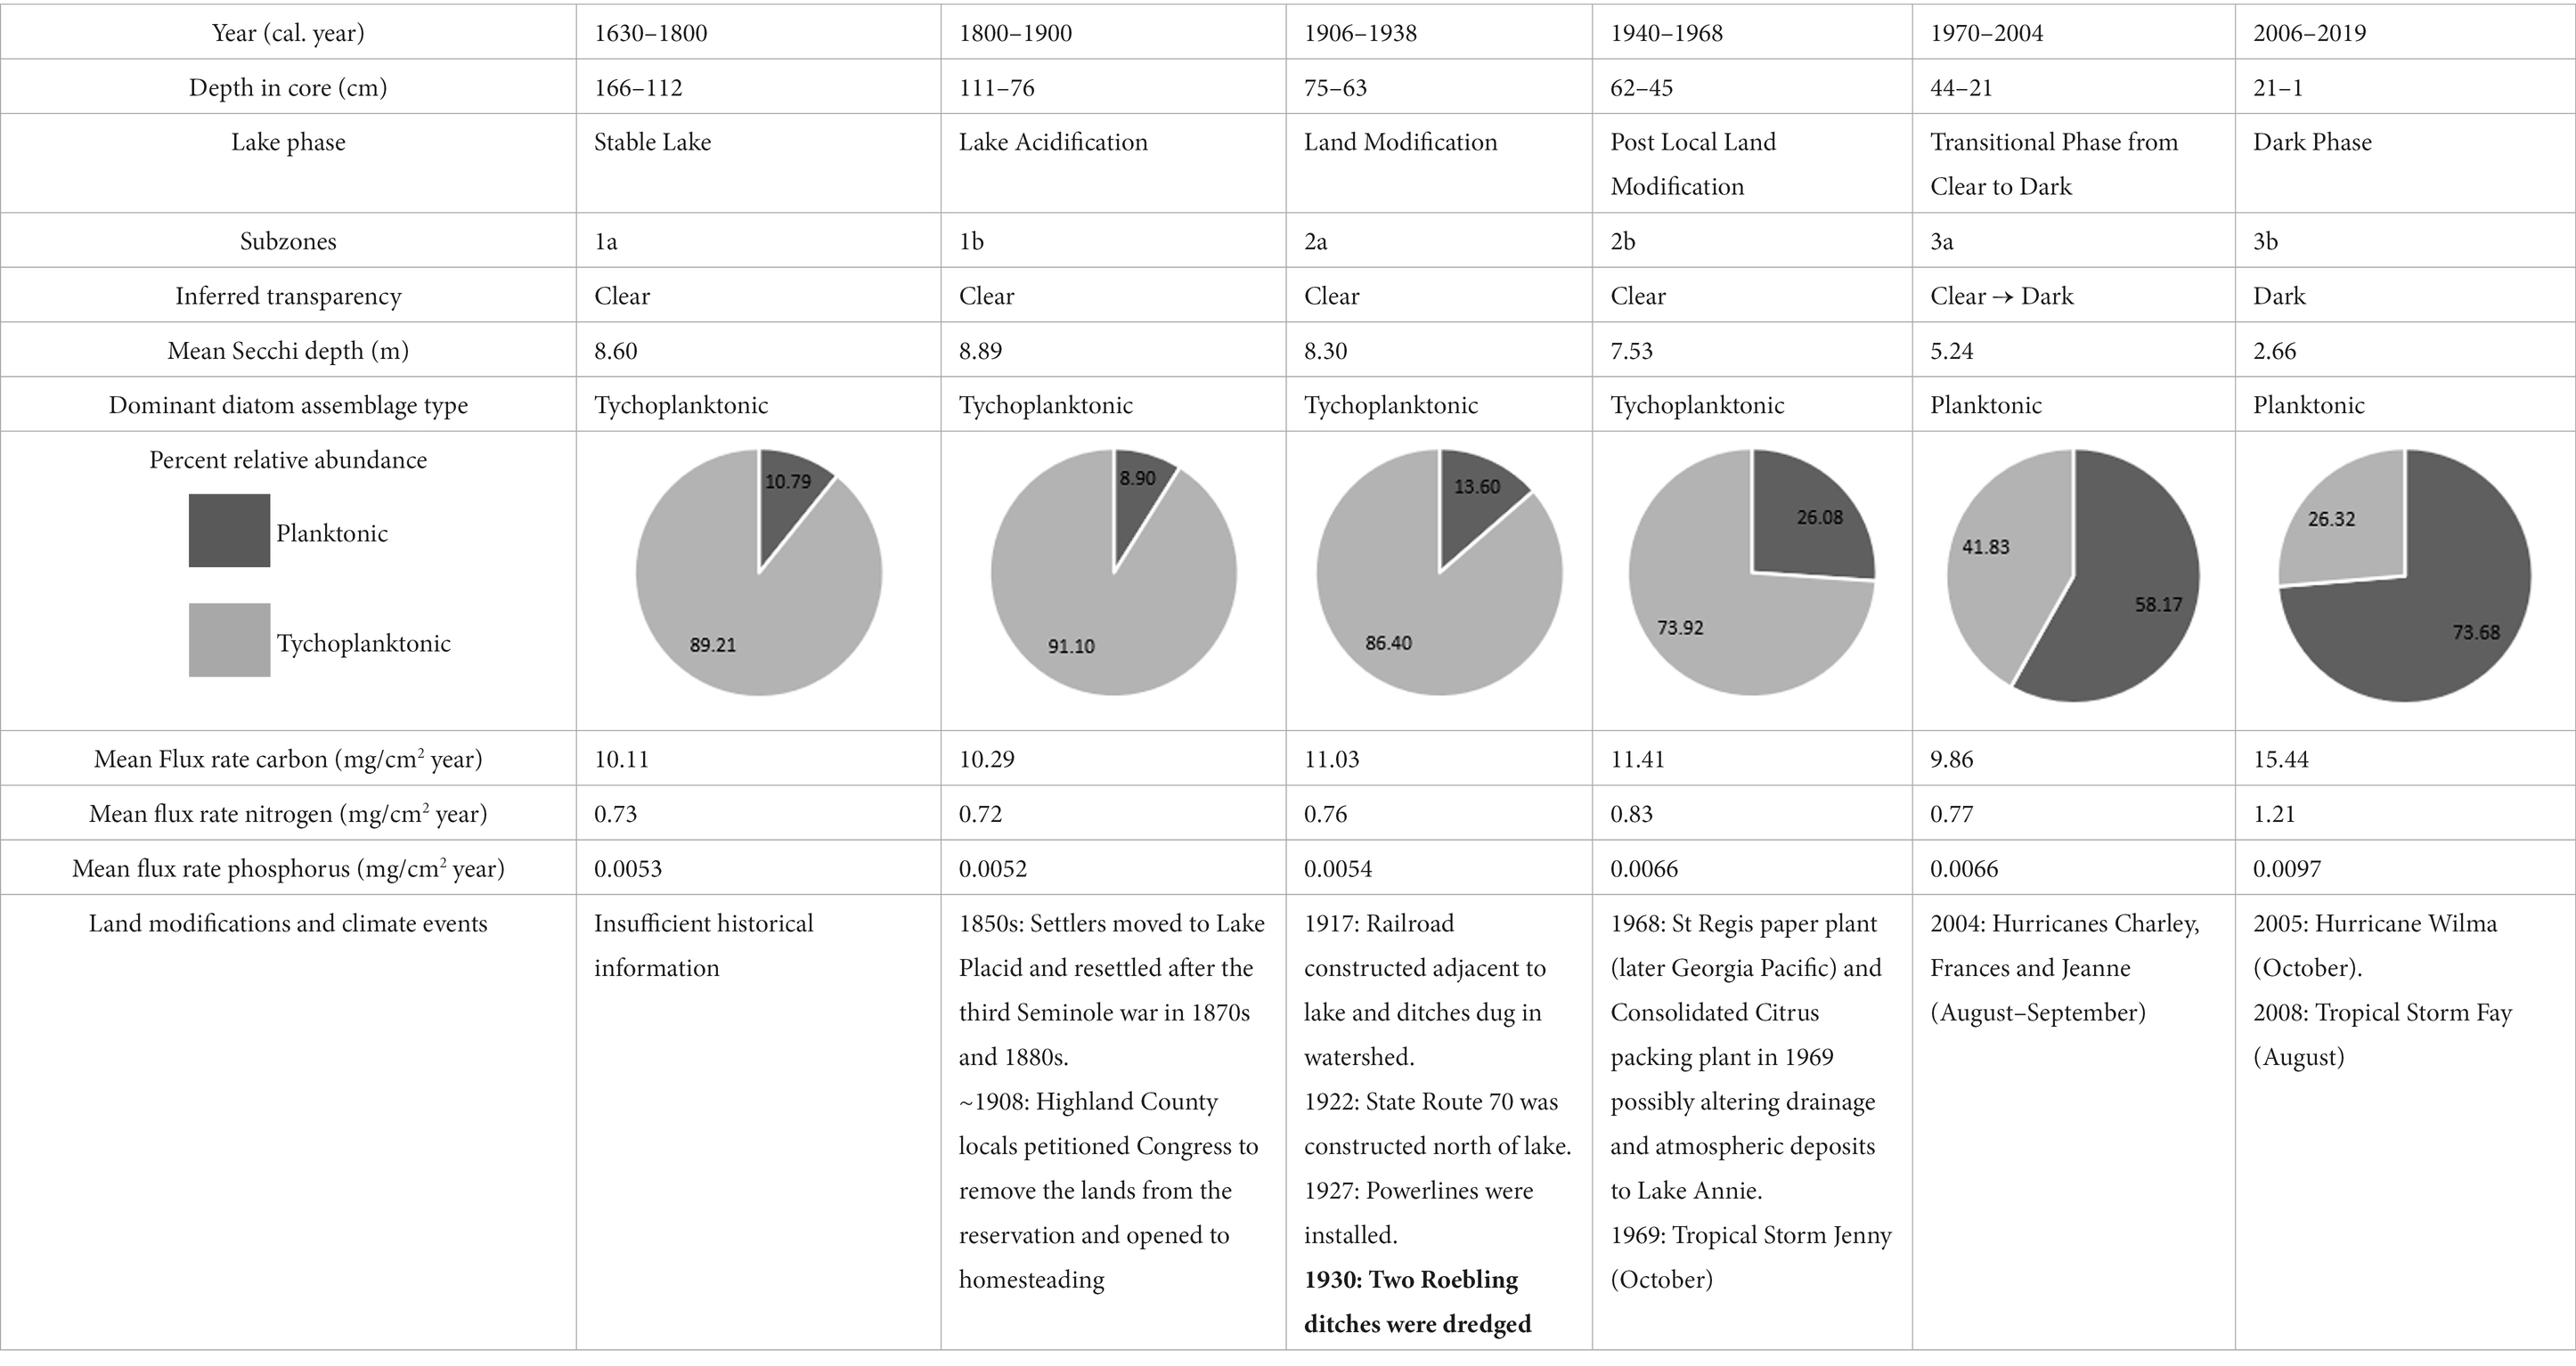
Table 1. Summary table of the Subzones including inferred transparency, percent relative abudance of planktonic and tychoplanktonic diatoms, mean flux rates of nutrients, and the potential land modifications and climate events that influenced the changes recorded in the sediments.
Stable Lake Phase (Subzone 1a, ~1630–1800)
This phase, in the lower part of the sediment core, was characterized by high diatom diversity, low planktonic diatom abundances, low carbon and nutrient accumulation rates, and large diatom-inferred Secchi depth values. This phase marks the end of the longer “stable phase” of Quillen et al. (2013), with low diatom-inferred water TP and a pH ~ 5.5. The δ13C value of −28‰ is probably indicative of an allochthonous C3 carbon source (−29 to −27‰; Meyers, 1997) and similar to values during this period reported from a sediment core taken in Lake Annie by Torres et al. (2012). The diatom-inferred transparency does not show a cyclical pattern, although dendrochronological records suggest the AMO was operational, yet mostly in the warm phase during this period (Gray et al., 2004). Overall, the lake was likely clear, acidic, and oligotrophic for a prolonged period during this phase.
Lake Acidification Phase (Subzone 1b, ~1800–1900)
The planktonic taxon abundances, carbon and nutrient accumulation rates, and diatom-inferred Secchi depth showed no change in this phase from the stable phase, however the diatom diversity decreased slightly. The diatom assemblages during this phase are suggestive of lower pH (Quillen et al., 2013), which was also shown in diatom-inferred pH records from other Florida lakes (Sweets et al., 1990; Sweets, 1992), driven by an increase in acid deposition that started ca. 1900. Carbon accumulation rates and the δ13C showed no change from subzone 1a, but the C:N ratio was higher in this phase, perhaps because increased acid rainfall mobilized terrestrial carbon (Clark et al., 2010). Like the previous phase, the diatom-inferred transparency record showed no cyclical pattern, though dendrochronological records suggest the AMO was oscillating and mostly in the cool phase (Gray et al., 2004). The lake during this phase remained clear and oligotrophic, but was more acidic.
Local Land Modification Phase (Subzone 2a, 1906–1938)
There was an abrupt increase in carbon and nutrient accumulation after 1930, when the ditches were established (Layne, 1979), however throughout this phase the diatom-inferred Secchi depth gradually decreased, while the diatom diversity steadily increased, and planktonic diatom relative abundances started to increase. The largest spike in silica occurred during this time, also indicating expansion of the watershed and input of silica-rich sand into the lake. The pH in the lake remained low during this period (Quillen et al., 2013). Whereas the ditches were dug during the AMO cool phase, the AMO shifted abruptly to the warm phase, but the diatom-inferred transparency record failed to detect the AMO signal, despite the higher resolution (1.1–5.5 year cm−1). Lower pH may have increased the photoreactivity of cDOC, maintaining clear conditions during this phase (Anesio and Granéli, 2003). Around the same time, there was substantial development around Little Lake Jackson, another Highlands County lake. Construction of hotels and a golf course increased organic carbon and nutrient input to the lake, causing an increase in planktonic diatom taxa, like Aulacoseira, indicative of a shift to eutrophic conditions, probably from nutrient-rich septic tank and golf course runoff (Whitmore et al., 2006). Compared to Little Lake Jackson, the watershed of Lake Annie was not developed, and since its purchase in 1983, lies largely within the protected scrub habitats of Archbold Biological Station, with far less local human impact. Lake Annie continued to be oligotrophic, acidic (although less so than in the early 21st Century), and clear, although its transparency gradually declined.
Post Local Land Modification (Subzone 2b, ~1940–1968)
During this phase, the relative abundances of five planktonic diatoms (Asterionella ralfsii var. americana, Aulacoseira herzogii, Aulacoseira tenella, Eunotia zasuminensis, and Tabellaria fenestrata) increased relative to benthic diatoms, the diatom-inferred Secchi depth decreased steadily, and the carbon and nutrient accumulation rates increased. Quillen et al. (2013) also found a gradual increase in diatom-inferred pH during this time period, although the pH was lower than in the more recent record. In addition, the slight increase in allochthonous organic carbon (δ13C = −29.0 to −28.5‰) and nutrients, which may have affected the diatom assemblage, was likely related to the newly established ditches and an increase in precipitation intensity during the AMO warm phase. The onset of an AMO warm phase may have mobilized carbon that had accumulated and oxidized in the watershed during the prior cool phase. Given that the tychoplanktonic diatom taxa decreased, we assume that light availability was decreasing, a consequence of increasing dissolved carbon. Similar changes occurred in wetlands around other Florida lakes from 1900 to the 1940s, caused by installment of levees or drainage of wetlands. For instance, Lake Apopka experienced a dramatic increase in dissolved organic matter input, which reduced light penetration and contributed to the shift in the lake from a macrophyte-dominated to a phytoplankton-dominated aquatic ecosystem (Schelske et al., 2005). Sediment cores from some Florida lakes showed a similar increase in planktonic diatoms (Aulacoseira herzogii, Aulacoseira tenella, and Eunotia zasuminensis) from ~1900 to the 1960s, associated with acidification (Sweets et al., 1990). However, Lake Annie’s response to atmospheric acidification is known to have been buffered by significant bicarbonate alkalinity, with declines in pH not detected in monitoring records until after 1966, when the buffering capacity was depleted (Battoe and Lowe, 1992). Lake Annie continued to be oligotrophic, somewhat less acidic, and clear, but the water transparency was slowly decreasing because of increased runoff from the ditches and climate-driven input of cDOC.
Transitional Phase (Clear to Dark) (Subzone 3a, ~1970–2004)
In Subzone 3a the five planktonic diatoms (Asterionella ralfsii var. americana, Aulacoseira herzogii, Aulacoseira tenella, Eunotia zasuminensis, and Tabellaria fenestrata) displayed high abundances relative to the tychoplanktonic diatoms, and diatom diversity started to decrease. The diatom-inferred TP steadily increased (Quillen et al., 2013) and the diatom-inferred Secchi depth started to oscillate, shifting from shallow to deep (1970–1986), after which the measured Secchi depth continued to decrease, from 7 m in 1986 to 2 m in 2004. Carbon and nutrient accumulation rates were high during this phase, but slowed temporarily. The change from the AMO warm to cool phase is a potential reason for the changes in biota and carbon and nutrient accumulation rates in subzone 3a. The NOAA AMO cool phase (1970–1993) occurred mostly during subzone 3a, when less intense precipitation and even droughts occurred more often in Florida (Enfield et al., 2001; Abiy et al., 2019), thus there were lower carbon and nutrient accumulation rates. In addition, the AMO index explained more of the variability in the transparency record (diatom-inferred and measured Secchi depth) during this time frame, compared to the previous subzones. The lake, however, was experiencing dystrophic conditions, indicated by the planktonic diatom taxa, especially the two taxa that prefer high TOC concentrations (Aulacoseira tenella, and Eunotia zasuminensis; Eloranta, 1986; Burge and Edlund, 2017). In addition, the lake was acidifying during the early part of this phase (1966–1978, Battoe and Lowe, 1992) and then began to recover. Decreasing transparency toward the end of this phase may have been reinforced by the positive relationship between pH and TOC (Davis et al., 1985). Changes to lake drainage driven by the excavation of the bayhead and enhancements of the road across the lake’s outlet may have increased water residence time and the accumulation of organic carbon in the lake. These factors may have caused Lake Annie to have remained slightly acidic relative to the present, but with clearer water that darkened during the shift to the warm AMO phase.
Dark Phase (Subzone 3b, 2006–2019)
The most recent time period, Subzone 3b, is characterized by the highest abundance of the five planktonic taxa relative to the tychoplanktonic diatoms, highest carbon and nutrient accumulation rates, lowest diatom diversity, and lowest measured average Secchi depth, compared to all other subzones. These changes in water quality and biota resulted from both the increase in precipitation intensity driven by the AMO warm phase (1990 – present; Enfield et al., 2001; Abiy et al., 2019), and the ditches that contribute runoff to the lake. The year 2004 had an active hurricane season, with three of four major Florida hurricanes (Charley, Frances, and Jeanne) affecting Archbold, causing extreme high water levels and runoff to the lake with extensive upstream erosion of ditches and sandy roads, which increased the size of the watershed under high water conditions since that time. These runoff events leave long legacies in the lake by increasing material inputs and prolonging stratification, causing a lengthened period of hypolimnetic anoxia (Gaiser et al., 2009a). Effects of large rainfall/flooding events are even more pronounced when they follow prolonged droughts that facilitate carbon and nutrient mineralization in the surrounding watershed, which are then mobilized into the lake via surface and groundwater (Gaiser et al., 2009a). Such events, which are common in the warm AMO phase, drive thermal and nutrient legacies and appear, from this study, to have biological consequences. Lake Annie is now an oligo-mesotrophic lake that has prolonged periods of low transparency. However, despite greater relative increases in phosphorus relative to nitrogen, the lake remains highly phosphorus-limited. The monthly transparency record during this time showed that Secchi depth was variable and displayed a seasonal signal, shifting between a clear and dark lake, a change that the diatom assemblage in the sediment core was unable to detect.
Application and summary
Other factors that influence the diatom assemblages
In this study we determined that reduced transparency caused by greater cDOC delivery was the main cause for a shift from tychoplanktonic to planktonic diatom assemblages. Those changes likely resulted from a combination of direct (i.e., light limitation) and indirect effects (i.e., changes in nutrient availability, mixing regimes, grazer abundances). Lower light availability may limit littoral production and reduce the relative abundance of tychoplankton that can access both planktonic and benthic nutrient sources (Fork et al., 2020). Associated increases in pelagic nutrient availability may promote proliferation of planktonic species. We acknowledge that our planktonic calibration dataset may be biased toward larger diatom taxa retained in the 20-μm mesh net. Smaller planktonic diatoms like Aulacoseira tenella, identified in the sediment core, might have been underrepresented in water column collections, but such bias would have been consistent across samples in the dataset.
Application to the AMO debate
Climate and local land modifications are the two major factors that currently regulate inter-annual to decadal changes in Lake Annie’s transparency and diatom dynamics, similar to lakes elsewhere. This study showed that land use modifications can amplify climate-induced oscillations in lakes by enhancing allochthonous supplies of cDOC. Currently, there is a debate about whether the AMO is a purely meteorological phenomenon or whether it was driven by tectonic activity in pre-industrial times and anthropogenic influences thereafter (Mann et al., 2021). There are four reasons why the effect of the AMO on lake browning may not have been apparent in the pre-1930s diatom-inferred transparency record: (1) the AMO itself was a weaker driver of Florida’s rainfall (Mann et al., 2021), (2) the pre-1930s transparency inferences were at a coarser scale than the AMO signal itself, or most likely, (3) ditches dug in the 1930s enhanced connections to the watershed, amplifying the effect of the AMO on the lake, and (4) potential interactions between cDOC and changes in pH caused by industrial atmospheric acidification. Attempts to infer the dynamics of the AMO have demonstrated its long-term existence (Mann et al., 2009; Svendsen et al., 2014; Moore et al., 2017), including the Gray et al. (2004) dendrochronological rainfall record, which shows an oscillation pattern extending back to 1567. The inferred amplitudes and durations of the AMO cycle differ among these records (Lohmann et al., 2015). Thus, uncertainty about the strength of the AMO in pre-industrial times remains because of its absence in our diatom-based record. Continued long-term meteorological and limnological monitoring may resolve this question – if the AMO is a natural climate cycle, the cool AMO phase should return, leading to another clear lake phase and the return of tychoplanktonic diatoms.
Application to “re-browning” debate
Land use amplification of climate impacts, leading to browning, has been observed in other lakes (Williamson et al., 2009; Lapierre et al., 2021) and paleolimnological studies can be used to determine when and how this interaction was strengthened (Turkia et al., 1998; Schelske et al., 2005). For instance, decadal oscillations in river DOC were attributed to interactions between land modifications and climate variability (Erlandsson et al., 2008). Unlike other acidic lakes that are currently re-browning (Meyer-Jacob et al., 2019), browning cycles appear to be a recent phenomenon in Lake Annie. Management of land use to reduce allochthonous DOC inputs is now a recognized approach (Kritzberg et al., 2020; Williamson, 2020). Manipulating water flow through Lake Annie’s ditches could improve understanding of the interaction between climate oscillation and groundwater versus surface-water inputs of cDOC. Such manipulations may also shed light on the effects of increased carbon, nitrogen, and phosphorus export to downstream lakes, including Lake Okeechobee. Combining long-term monitoring and paleolimnological methods provides ample evidence that even low-level land modification can dramatically change lake response to climate oscillations by modifying inputs of cDOC and contributing to lake browning. Therefore, conservation efforts to maintain the integrity of aquatic ecosystems should include projections for climate oscillations, especially in climate-sensitive regions.
Data availability statement
The original contributions presented in the study are included are openly available in Neotoma Paleoecology Database at https://data.neotomadb.org/55915 and https://doi.org/10.21233/VES5-3E24, and in the article/Supplementary material, further inquiries can be directed to the corresponding authors.
Author contributions
MEB conducted the research and wrote the manuscript. EG advised the research, assisted in core collection and processing, and edited the manuscript. HS advised the research, assisted in core collection, and edited the manuscript. MB led the core collection, advised analyses, and edited the manuscript. JC coordinated the core collection and processing and analysis of nutrients and isotopes. WK oversaw the chronological analysis and interpretation and edited the manuscript. All authors contributed to the article and approved the submitted version.
Funding
This research was supported in part by Archbold Biological Station and the George M. Barley Endowment at Florida International University, Friends of Lakeside Lab Inc., which provided the Becker Family Fellowship Scholarship, and the Management and Operation of a Continental Scientific Drilling Coordination Office, which supported the visiting graduate student program (EAR-1951112).
Acknowledgments
This work used limnological data and phytoplankton net samples supported by the long-term monitoring program at Archbold Biological Station. Samples were collected by Kevin Main and other members of the Archbold staff. We thank Gabriel Kamener, Samantha Hormiga, and Kaitlin Stansbury from the Gaiser Lab for helping collect the sediment core and process sediment samples. We thank the staff at St. Croix Watershed Research Station, Minnesota (Tori Thrash, Michelle Natarajan, and Alaina Fedie), who helped with biogenic silica analysis. In addition, we thank Marbelys Garriga and Emily Standen from the Wetland Ecosystems Research Lab at Florida International University, for assistance with total phosphorus analysis. We thank the diatomists who helped with identifications, including Franco Tobias, Sylvia Lee, Paula Furey, Mark Edlund, and Kalina Manoylov. Additionally, we thank Nathan Vaughan, who helped generate figures, and Sparkle Malone who helped with the time series analysis. Also, we would like to thank Sarah Spaulding and Don Charles who facilitated public access to the diatom flora and data used in this study. Finally, we thank the reviewers and editors, whose comments and edits improved this manuscript.
Conflict of interest
The authors declare that the research was conducted in the absence of any commercial or financial relationships that could be construed as a potential conflict of interest.
Publisher’s note
All claims expressed in this article are solely those of the authors and do not necessarily represent those of their affiliated organizations, or those of the publisher, the editors and the reviewers. Any product that may be evaluated in this article, or claim that may be made by its manufacturer, is not guaranteed or endorsed by the publisher.
Supplementary material
The Supplementary material for this article can be found online at: https://www.frontiersin.org/articles/10.3389/fevo.2023.1020024/full#supplementary-material
Footnotes
References
Abiy, A. Z., Melesse, A. M., and Abtew, W. (2019). Teleconnection of regional drought to ENSO, PDO, and AMO: southern Florida and the Everglades. Atmosphere (Basel). 10, 1–16. doi: 10.3390/atmos10060295
Ågren, A., Haei, M., Köhler, S. J., Bishop, K., and Laudon, H. (2010). Regulation of stream water dissolved organic carbon (DOC) concentrations during snowmelt; the role of discharge, winter climate and memory effects. Biogeosciences 7, 2901–2913. doi: 10.5194/bg-7-2901-2010
Anesio, A. M., and Granéli, W. (2003). Increased photoreactivity of DOC by acidification: implications for the carbon cycle in humic lakes. Limnol. Oceanogr. 48, 735–744. doi: 10.4319/lo.2003.48.2.0735
Appleby, P. G., and Oldfield, F. (1983). The assessment of 210Pb data from sites with varying sediment accumulation rates. Hydrobiologia 103, 29–35. doi: 10.1007/BF00028424
Battarbee, R. W. (1973). A new method for the estimation of absolute microfossil numbers, with reference especially to diatoms. Limnol. Oceanogr. 18, 647–653. doi: 10.4319/lo.1973.18.4.0647
Battarbee, R. W., Jones, V. J., Flower, R. J., Cameron, N. C., Bennion, H., Carlvalho, L., et al. (2001). “Chapter 8. Diatoms” in Tracking environmental change using Lake sediments, Vol. 3: Terrestial, algal, and siliceous indicators. eds. J. P. Smol, H. J. B. Birks, and W. M. Last (Netherlands: Kluwer Academic Plublishers), 155–191.
Battoe, L. E. (1987). Report of Limnological research on Lake Annie. (Gainesville, FL: Archbold Biological Station).
Battoe, L. E., and Lowe, E. F. (1992). Acidification of Lake Annie, Highlands Co., FL. Water Air Soil Pollut. 65, 69–80. doi: 10.1007/BF00482750
Bicudo, D. C., Tremarin, P. I., Almeida, P. D., Zorzal-Almeida, S., Wengrat, S., Faustino, S. B., et al. (2016). Ecology and distribution of Aulacoseira species (Bacillariophyta) in tropical reservoirs from Brazil. Diatom Res. 31, 199–215. doi: 10.1080/0269249X.2016.1227376
Binford, M. W. (1990). Calculation and uncertainty analysis of 210Pb dates for PIRLA project lake sediment cores. J. Paleolimnol. 3, 253–267. doi: 10.1007/BF00219461
Birks, H. J. B. (2012). “Overview of numerical methods in Palaeolimnology,” in Tracking environmental change using Lake sediment. eds. H. J. B. Birks, A. F. Lotter, S. Juggins, and J. P. Smol (Springer Dordrecht: Springer Science+Business Media), 19–92.
Bishop, E. W. (1956). Geology and ground-water resources of Highlands County, Florida. – Report of investigations #15. Tallahassee, FL.
Brenner, M., Whitmore, T. J., and Schelske, C. L. (1996). Paleolimnological evaluation of historical trophic state conditions in hypereutrophic Lake Thonotosassa, Florida, USA. Hydrobiologia 331, 143–152. doi: 10.1007/BF00025415
Brown, R. E., Nelson, S. J., and Saros, J. E. (2017). Paleolimnological evidence of the consequences of recent increased dissolved organic carbon (DOC) in lakes of the northeastern USA. J. Paleolimnol. 57, 19–35. doi: 10.1007/s10933-016-9913-3
Burford, M. A., Franklin, H., Faggotter, S. J., Chuang, A., Hayton, J. B., and Carroll, A. R. (2022). Effects of terrestrial dissolved organic matter on a bloom of the toxic cyanobacteria, Raphidiopsis raciborskii. Harmful Algae 117:102269. doi: 10.1016/j.hal.2022.102269
Burge, D. R. L., and Edlund, M. B. (2017). Eunotia zasuminensis. Diatoms North Am. Available at: https://diatoms.org/species/eunotia_zasuminensis (Accessed September 10, 2021).
Chiu, C. Y., Jones, J. R., Rusak, J. A., Lin, H. C., Nakayama, K., Kratz, T. K., et al. (2020). Terrestrial loads of dissolved organic matter drive inter-annual carbon flux in subtropical lakes during times of drought. Sci. Total Environ. 717:137052. doi: 10.1016/j.scitotenv.2020.137052
Clark, J. M., Bottrell, S. H., Evans, C. D., Monteith, D. T., Bartlett, R., Rose, R., et al. (2010). The importance of the relationship between scale and process in understanding long-term DOC dynamics. Sci. Total Environ. 408, 2768–2775. doi: 10.1016/j.scitotenv.2010.02.046
Conley, D. J., and Schelske, C. L. (2001). “Chapter 14. Biogenic silica” in Tracking environmental change using Lake sediment, Vol. 3: Terrestial, algal, and siliceous indicators. eds. J. P. Smol, H. J. B. Birks, and W. M. Last (Dordrecht, Netherlands: Kluwer Academic Plublishers), 281–293.
Davis, R. B., Anderson, D. S., and Berge, F. (1985). Palaeolimnological evidence that lake acidification is accompanied by loss of organic matter. Nature 316, 436–438. doi: 10.1038/316436a0
De Cáceres, M., Legendre, P., and Moretti, M. (2010). Improving indicator species analysis by combining groups of sites. Oikos 119, 1674–1684. doi: 10.1111/j.1600-0706.2010.18334.x
De Senerpont Domis, L. N., Elser, J. J., Gsell, A. S., Huszar, V. L. M., Ibelings, B. W., Jeppesen, E., et al. (2013). Plankton dynamics under different climatic conditions in space and time. Freshw. Biol. 58, 463–482. doi: 10.1111/fwb.12053
DeColibus, D., and Lowe, R. (2013). Tabellaria fenestrata. Diatoms North Am. Available at: https://diatoms.org/species/tabellaria_fenestrata (Accessed September 10, 2021).
Dempsey, C. M., Brentrup, J. A., Magyan, S., Knoll, L. B., Swain, H. M., Gaiser, E. E., et al. (2020). The relative importance of photodegradation and biodegradation of terrestrially derived dissolved organic carbon across four lakes of differing trophic status. Biogeosciences 17, 6327–6340. doi: 10.5194/bg-17-6327-2020
Dixit, S. S., Keller, B., Dixit, A. S., and Smol, J. P. (2001). Diatom-inferred dissolved organic carbon reconstructions provide assessments of past UV-B penetration in Canadian shield lakes. Can. J. Fish. Aquat. Sci. 58, 543–550. doi: 10.1139/f01-013
Donders, T. H., de Boer, H. J., Finsinger, W., Grimm, E. C., Dekker, S. C., Reichart, G. J., et al. (2011). Impact of the Atlantic warm Pool on precipitation and temperature in Florida during North Atlantic cold spells. Clim. Dyn. 36, 109–118. doi: 10.1007/s00382-009-0702-9
Eloranta, P. (1986). Melosira distans var. tenella and Eunotia zasuminensis, two poorly known planktonic diatoms in Finnish lakes. Nord. J. Bot. 6, 99–103. doi: 10.1111/j.1756-1051.1986.tb00865.x
Enfield, D. B., Mestas-Nuñez, A. M., and Trimble, P. J. (2001). The Atlantic multidecadal oscillation and its relation to rainfall and river flows in the continental U.S. Geophys. Res. Lett. 28, 2077–2080. doi: 10.1029/2000GL012745
Erlandsson, M., Buffam, I., Fölster, J., Laudon, H., Temnerud, J., Weyhenmeyer, G. A., et al. (2008). Thirty-five years of synchrony in the organic matter concentrations of Swedish rivers explained by variation in flow and sulphate. Glob. Chang. Biol. 14, 1191–1198. doi: 10.1111/j.1365-2486.2008.01551.x
Fisher, M. M., Brenner, M., and Reddy, K. R. (1992). A simple, inexpensive piston corer for collecting undisturbed sediment/water interface profiles. J. Paleolimnol. 7, 157–161. doi: 10.1007/BF00196870
Florida LAKEWATCH (2020). Florida LAKEWATCH water chemistry field sampling and laboratory protocols. University of Florida: School of Forest Resources and Conservation/IFAS.
Fork, M. L., Karlsson, J., and Sponseller, R. A. (2020). Dissolved organic matter regulates nutrient limitation and growth of benthic algae in northern lakes through interacting effects on nutrient and light availability. Limnol. Oceanogr. Lett. 5, 417–424. doi: 10.1002/lol2.10166
Fritz, S. C. (2008). Deciphering climatic history from lake sediments. J. Paleolimnol. 39, 5–16. doi: 10.1007/s10933-007-9134-x
Gaiser, E. E., Deyrup, N. D., Bachmann, R. W., Battoe, L. E., and Swain, H. M. (2009a). Effects of climate variability on transparency and thermal structure in subtropical, monomictic Lake Annie, Florida. Fundam. Appl. Limnol./Arch. für Hydrobiol. 175, 217–230. doi: 10.1127/1863-9135/2009/0175-0217
Gaiser, E. E., Deyrup, N. D., Bachmann, R. W., Battoe, L. E., and Swain, H. M. (2009b). Multidecadal climate oscillations detected in a transparency record from a subtropical Florida lake. Limnol. Oceanogr. 54, 2228–2232. doi: 10.4319/lo.2009.54.6.2228
Gray, S. T., Graumlich, L. J., Betancourt, J. L., and Pederson, G. T. (2004). A tree-ring based reconstruction of the Atlantic multidecadal oscillation since 1567 a.D. Geophys. Res. Lett. 31, 2–5. doi: 10.1029/2004GL019932
Grimm, E. C., Jacobson, G. L., Watts, W. A., Hansen, B. C. S., and Maasch, K. A. (1993). A 50,000-year record of climate oscillations from Florida and its temporal correlation with the Heinrich events. Science 261, 198–200. doi: 10.1126/science.261.5118.198
Grimm, E. C., Watts, W. A., Jacobson, G. L., Hansen, B. C. S., Almquist, H. R., and Dieffenbacher-Krall, A. C. (2006). Evidence for warm wet Heinrich events in Florida. Quat. Sci. Rev. 25, 2197–2211. doi: 10.1016/j.quascirev.2006.04.008
Gushulak, C. A. C., and Cumming, B. F. (2020). Diatom assemblages are controlled by light attenuation in oligotrophic and mesotrophic lakes in northern Ontario (Canada). J. Paleolimnol. 64, 419–433. doi: 10.1007/s10933-020-00146-w
Haaland, S., Hongve, D., Laudon, H., Riise, G., and Vogt, R. D. (2010). Quantifying the drivers of the increasing colored organic matter in boreal surface waters. Environ. Sci. Technol. 44, 2975–2980. doi: 10.1021/es903179j
Isles, P. D. F., Creed, I. F., Jonsson, A., and Bergström, A. K. (2021). Trade-offs between light and nutrient availability across gradients of dissolved organic carbon Lead to spatially and temporally variable responses of Lake phytoplankton biomass to Browning. Ecosystems 24, 1837–1852. doi: 10.1007/s10021-021-00619-7
Isles, P. D. F., Jonsson, A., Creed, I. F., and Bergström, A. K. (2020). Does browning affect the identity of limiting nutrients in lakes? Aquat. Sci. 82, 1–14. doi: 10.1007/s00027-020-00718-y
Juggins, S. (2007). C2 software for ecological and palaeoecological. data analysis and visualization (user guide version 1.5)”. In: Newcastle upon Tyne: Newcastle University 77. URL: https://www.staff.ncl.ac.uk/stephen.juggins/software/C2Home.htm.
Kelly, P. T., Solomon, C. T., Zwart, J. A., and Jones, S. E. (2018). A framework for understanding variation in pelagic gross primary production of Lake ecosystems. Ecosystems 21, 1364–1376. doi: 10.1007/s10021-018-0226-4
Kilham, S. S., Theriot, E. C., and Fritz, S. C. (1996). Linking planktonic diatoms and climate change in the large lakes of the Yellowstone ecosystem using resource theory. Limnol. Oceanogr. 41, 1052–1062. doi: 10.4319/lo.1996.41.5.1052
Kingston, J. C., and Birks, H. J. B. (1990). Dissolved organic carbon reconstructions from diatom assemblages in PIRLA Project Lakes, North America. Phil. Trans. Soc. Lond. 327, 279–288.
Knoll, L. B., Williamson, C. E., Pilla, R. M., Leach, T. H., Brentrup, J. A., and Fisher, T. J. (2018). Browning-related oxygen depletion in an oligotrophic lake. Inl. Waters 8, 255–263. doi: 10.1080/20442041.2018.1452355
Krishnaswamy, S., Lal, D., Martin, J. M., and Meybeck, M. (1971). Geochronology of lake sediments. Earth Planet. Sci. Lett. 11, 407–414. doi: 10.1016/0012-821X(71)90202-0
Kritzberg, E. S. (2017). Centennial-long trends of lake browning show major effect of afforestation. Limnol. Oceanogr. Lett. 2, 105–112. doi: 10.1002/lol2.10041
Kritzberg, E. S., Hasselquist, E. M., Škerlep, M., Löfgren, S., Olsson, O., Stadmark, J., et al. (2020). Browning of freshwaters: consequences to ecosystem services, underlying drivers, and potential mitigation measures. Ambio 49, 375–390. doi: 10.1007/s13280-019-01227-5
Laird, K. R., Fritz, S. C., Grimm, E. C., and Mueller, P. G. (1996). Century-scale paleoclimatic reconstruction from moon Lake, a closed-basin lake in the northern Great Plains. Limnol. Oceanogr. 41, 890–902. doi: 10.4319/lo.1996.41.5.0890
Lapierre, J. F., Collins, S. M., Oliver, S. K., Stanley, E. H., and Wagner, T. (2021). Inconsistent browning of northeastern U.S. lakes despite increased precipitation and recovery from acidification. Ecosphere 12. doi: 10.1002/ecs2.3415
Layne, J. N. (1979). Natural features of the Lake Annie tract, Highlands County, Florida. (Lake Placid, Florida: Archbold Biological Station).
Leech, D. M., Pollard, A. I., Labou, S. G., and Hampton, S. E. (2018). Fewer blue lakes and more murky lakes across the continental U.S.: implications for planktonic food webs. Limnol. Oceanogr. 63, 2661–2680. doi: 10.1002/lno.10967
Lohmann, K., Mignot, J., Langehaug, H. R., Jungclaus, J. H., Matei, D., Otterå, O. H., et al. (2015). Using simulations of the last millennium to understand climate variability seen in palaeo-observations: similar variation of Iceland – Scotland overflow strength and Atlantic multidecadal. Climate Past 11, 203–216. doi: 10.5194/cp-11-203-2015
Mann, M. E., Steinman, B. E., Brouillette, D. J., and Miller, S. K. (2021). Multidecadal climate oscillations during the past millennium driven by volcanic forcing Michael. Science 371, 1014–1019. doi: 10.1126/science.abc5810
Mann, M. E., Zhang, Z., Rutherford, S., Bradley, R. S., Hughes, M. K., Shindell, D., et al. (2009). Global signatures and dynamical origins of the little ice age and medieval climate anomaly. Science 326, 1256–1260. doi: 10.1126/science.1177303
Marquardt, G. C., Blanco, S., and Carlos, C. E. (2021). Is a rare diatom relevant for Brazilian reservoirs? Limnetica 40, 103–116. doi: 10.23818/limn.40.08
Meyer-Jacob, C., Michelutti, N., Paterson, A. M., Cumming, B. F., Keller, W., and Smol, J. P. (2019). The browning and re-browning of lakes: divergent lake-water organic carbon trends linked to acid deposition and climate change. Sci. Rep. 9, 16676–16610. doi: 10.1038/s41598-019-52912-0
Meyer-Jacob, C., Tolu, J., Bigler, C., Yang, H., and Bindler, R. (2015). Early land use and centennial scale changes in lake-water organic carbon prior to contemporary monitoring. Proc. Natl. Acad. Sci. U. S. A. 112, 6579–6584. doi: 10.1073/pnas.1501505112
Meyers, P. A. (1997). Organic geochemical proxies of paleoceanographic, paleolimnologic, and paleoclimatic processes. Org. Geochem. 27, 213–250. doi: 10.1016/S0146-6380(97)00049-1
Monteith, D. T., Stoddard, J. L., Evans, C. D., De Wit, H. A., Forsius, M., Høgåsen, T., et al. (2007). Dissolved organic carbon trends resulting from changes in atmospheric deposition chemistry. Nature 450, 537–540. doi: 10.1038/nature06316
Moore, G. W. K., Halfar, J., Majeed, H., Adey, W., and Kronz, A. (2017). Amplification of the Atlantic multidecadal oscillation associated with the onset of the industrial-era warming. Nat. Publ. Gr. 7:40861. doi: 10.1038/srep40861
Moses, C. S., Anderson, W. T., Saunders, C., and Sklar, F. (2013). Regional climate gradients in precipitation and temperature in response to climate teleconnections in the Greater Everglades ecosystem of South Florida. J. Paleolimnol. 49, 5–14. doi: 10.1007/s10933-012-9635-0
NOAA (2020a). El Niño/Southern Oscillation (ENSO). Available at: https://www.ncdc.noaa.gov/teleconnections/enso/ (Accessed January 2, 2020).
NOAA (2020b). Pacific Decadal Oscillation (PDO). Available at: https://www.ncdc.noaa.gov/teleconnections/pdo/ (Accessed January 2, 2020).
Oldfield, F., and Appleby, P. (1984). in Empirical testing of 210Pb-dating models for lake sediments. eds. E. Haworth and W. Lund (Minneapolis: University of Minnesota Press)
Olson, C. R., Solomon, C. T., and Jones, S. E. (2020). Shifting limitation of primary production: experimental support for a new model in lake ecosystems. Ecol. Lett. 23, 1800–1808. doi: 10.1111/ele.13606
Physical Sciences Laboratory (2020). Atlantic multidecadal oscillation (AMO). Available at: https://psl.noaa.gov/gcos_wgsp/Timeseries/AMO/ (Accessed January 2, 2020).
Pilla, R. M., Williamson, C. E., Zhang, J., Smyth, R. L., Lenters, J. D., Brentrup, J. A., et al. (2018). Browning-related decreases in water transparency Lead to long-term increases in surface water temperature and thermal stratification in two Small Lakes. J. Geophys. Res. Biogeosciences 123, 1651–1665. doi: 10.1029/2017JG004321
Qiao, H., Tian, Y. Q., Yu, Q., Carrick, H. J., Francek, M., and Li, J. (2017). Snowpack enhanced dissolved organic carbon export during a variety of hydrologic of events in an agricultural landscape, Midwestern USA. Agric. For. Meteorol. 246, 31–41. doi: 10.1016/j.agrformet.2017.06.002
Quillen, A. K., Gaiser, E. E., and Grimm, E. C. (2013). Diatom-based paleolimnological reconstruction of regional climate and local land-use change from a protected sinkhole lake in southern Florida, USA. J. Paleolimnol. 49, 15–30. doi: 10.1007/s10933-011-9558-1
Regier, P., Briceño, H., and Jaffé, R. (2016). Long-term environmental drivers of DOC fluxes: linkages between management, hydrology and climate in a subtropical coastal estuary. Estuar. Coast. Shelf Sci. 182, 112–122. doi: 10.1016/j.ecss.2016.09.017
Rosén, P., Cunningham, L., Vonk, J., and Karlsson, J. (2009). Effects of climate on organic carbon and the ratio of planktonic to benthic primary producers in a subarctic lake during the past 45 years. Limnol. Oceanogr. 54, 1723–1732. doi: 10.4319/lo.2009.54.5.1723
Rühland, K. M., Paterson, A. M., and Smol, J. P. (2015). Lake diatom responses to warming: reviewing the evidence. J. Paleolimnol. 54, 1–35. doi: 10.1007/s10933-015-9837-3
Sacks, L., Swancar, A., and Lee, T. M. (1998). Estimating ground-water exchange with lakes using water-budget and chemical mass-balance approaches for ten lakes in ridge areas of Polk and highlands counties, Florida. Water-Resources Investig. Rep. 98-4133, 47.
Saros, J. E., Stone, J. R., Pederson, G. T., Slemmons, K. E. H., Spanbauer, T., Schliep, A., et al. (2012). Climate-induced changes in lake ecosystem structure inferred from coupled neo- and paleoecological approaches. Ecology 93, 2155–2164. doi: 10.1890/11-2218.1
Schelske, C. L., Lowe, E. F., Battoe, L. E., Brenner, M., Coveney, M. F., and Kenney, W. F. (2005). Abrupt biological response to hydrologic and land-use changes in Lake Apopka, Florida, USA. Ambio 34, 192–198. doi: 10.1579/0044-7447-34.3.192
Schelske, C. L., Peplow, A., Brenner, M., and Spencer, C. N. (1994). Low-background gamma counting: applications for 210Pb dating of sediments. J. Paleolimnol. 10, 115–128. doi: 10.1007/BF00682508
Senar, O. E., Creed, I. F., and Trick, C. G. (2021). Lake browning may fuel phytoplankton biomass and trigger shifts in phytoplankton communities in temperate lakes. Aquat. Sci. 83, 1–15. doi: 10.1007/s00027-021-00780-0
Solomon, C. T., Jones, S. E., Weidel, B. C., Buffam, I., Fork, M. L., Karlsson, J., et al. (2015). Ecosystem consequences of changing inputs of terrestrial dissolved organic matter to lakes: current knowledge and future challenges. Ecosystems 18, 376–389. doi: 10.1007/s10021-015-9848-y
Solorzano, L., and Sharp, J. H. (1980). Determination of total dissolved phosphorus particulate phosphorus in natural water. Limnol. Oceanogr. 25, 751–754. doi: 10.4319/lo.1980.25.4.0751
Spaulding, S. A., Bishop, I. W., Edlund, M. B., Lee, S., Furey, P., Jovanovska, E., et al. (2019). Diatoms of North America. Available at: https://diatoms.org (Accessed January 2, 2019).
Stockwell, J. D., Doubek, J. P., Adrian, R., Anneville, O., Carey, C. C., Carvalho, L., et al. (2020). Storm impacts on phytoplankton community dynamics in lakes. Glob. Chang. Biol. 26, 2756–2784. doi: 10.1111/gcb.15033
Sullivan, K. L., Gaiser, E. E., and Swain, H. M. (2022). Dissolved organic carbon as a driver of seasonal and multiyear phytoplankton assembly oscillations in a subtropical monomictic lake. Limnol. Oceanogr. 67, S416–S429. doi: 10.1002/lno.12004
Svendsen, L., Hetzinger, S., Keenlyside, N., and Gao, Y. (2014). Marine-based multiproxy reconstruction of Atlantic multidecadal variability. Geophys. Res. Lett. 41, 1295–1300. doi: 10.1002/2013GL059076
Sweets, P. R. (1992). Diatom paleolimnological evidence for lake acidification in the trail ridge region of Florida. Water Air Soil Pollut. 65, 43–57. doi: 10.1007/BF00482748
Sweets, P. R., Bienert, R. W., Crisman, T. L., and Binford, M. W. (1990). Paleoecological investigations of recent lake acidification in northern Florida. J. Paleolimnol. 4, 103–137. doi: 10.1007/BF00226320
Symons, C. C., Schulhof, M. A., Cavalheri, H. B., and Shurin, J. B. (2019). Antagonistic effects of temperature and dissolved organic carbon on fish growth in California mountain lakes. Oecologia 189, 231–241. doi: 10.1007/s00442-018-4298-9
Torres, I. C., Inglett, P. W., Brenner, M., Kenney, W. F., and Reddy, K. R. (2012). Stable isotope (δ 13C and δ 15N) values of sediment organic matter in subtropical lakes of different trophic status. J. Paleolimnol. 47, 693–706. doi: 10.1007/s10933-012-9593-6
Turkia, J., Sandman, O., and Huttunen, P. (1998). Palaeolimnological evidence of forestry practices disturbing small lakes in Finland. Boreal Environ. Res. 3, 45–61.
Wessels, M., Mohaupt, K., Kümmerlin, R., and Lenhard, A. (1999). Reconstructing past eutrophication trends from diatoms and biogenic silica in the sediment and the pelagic zone of Lake Constance, Germany. J. Paleolimnol. 21, 171–192. doi: 10.1023/A:1008080922586
Whitmore, T. J. (1989). Florida diatom assemblages as indicators of trophic state and pH. Limnol. Oceanogr. 34, 882–895. doi: 10.4319/lo.1989.34.5.0882
Whitmore, T. J., Brenner, M., Kolasa, K. V., Kenney, W. F., Riedinger-Whitmore, M. A., Curtis, J. H., et al. (2006). Inadvertent alkalization of a Florida lake caused by increased ionic and nutrient loading to its watershed. J. Paleolimnol. 36, 353–370. doi: 10.1007/s10933-006-9000-2
Williamson, C. E. (2020). “Lake Management in a Browning World: beyond the holy grail of nutrients,” in NALMS Lakeline Spring, 6–10. https://www.nalms.org/product/lakeline-40-1-lake-browning/
Williamson, C. E., Saros, J. E., Vincent, W. F., and Smol, J. P. (2009). Lakes and reservoirs as sentinels, integrators, and regulators of climate change. Limnol. Oceanogr. 54, 2273–2282. doi: 10.4319/lo.2009.54.6_part_2.2273
Keywords: dissolved organic carbon, water transparency, Atlantic multidecadal oscillation, neolimnological approach, paleoecology and land-use history
Citation: Emery Boeck MA, Gaiser EE, Swain HM, Brenner M, Curtis JH and Kenney WF (2023) Cyclical browning in a subtropical lake inferred from diatom records. Front. Ecol. Evol. 11:1020024. doi: 10.3389/fevo.2023.1020024
Edited by:
Chris Schneider, University of Alberta, CanadaReviewed by:
Julie Wolin, Cleveland State University, United StatesHunter Carrick, Central Michigan University, United States
Copyright © 2023 Emery Boeck, Gaiser, Swain, Brenner, Curtis and Kenney. This is an open-access article distributed under the terms of the Creative Commons Attribution License (CC BY). The use, distribution or reproduction in other forums is permitted, provided the original author(s) and the copyright owner(s) are credited and that the original publication in this journal is cited, in accordance with accepted academic practice. No use, distribution or reproduction is permitted which does not comply with these terms.
*Correspondence: Meredith A. Emery Boeck, m.emeryboeck@gmail.com; Evelyn E. Gaiser, gaisere@fiu.edu