Experimental study on the response relationship between environmental DNA concentration and biomass of Schizothorax prenanti in still water
 Jianmin Zhang
 Ruiyu Ding
 Yurong Wang
 Jiating Wen
- State Key Laboratory of Hydraulics and Mountain River Engineering, Sichuan University, Chengdu, China
The superiority of the environmental DNA (eDNA) method for estimating the biomass of aquatic species has been demonstrated. However, the relationship between eDNA concentration and biomass is difficult to clarify under the influence of complex water flow and habitat conditions. It seriously restricts the popularization and application of the eDNA method in estimating aquatic biomass. In this paper, a typical fish species of rivers in southwest China, Schizothorax prenanti, was selected as the target species. Under standardized laboratory hydrostatic conditions, two environmental factors, water pH and water temperature were firstly determined through pre-experiments. Then we investigated the correlation between eDNA concentration and biomass under different body sizes and different body size compositions. The experimental results showed that water pH and the water temperature had a great influence on eDNA concentration. Therefore, the effects of these environmental factors need to be considered simultaneously when using eDNA concentration to estimate biomass. Under the premise of consistent environmental conditions, the biomass of Schizothorax prenanti was positively correlated with the eDNA concentration when the individual body size was the same. For each 1% increase in biomass of the fish, the eDNA concentration of adult (larger size) fish increased by 0.98%, while the eDNA concentration of juvenile (smaller size) fish increased by 1.38%. The smaller the size of individual fish, the greater the increase of eDNA concentration with biomass, and the increase of juvenile fish was about 1.4 times that the adult fish. When the biomass was the same but the body size composition was different, the higher the proportion of small body size individuals in the population, the higher the eDNA concentration. Special attention needs to be paid to the body size composition of the population to avoid the biomass estimation being lower than the actual value when the smaller size fish are dominant. The experimental results provide a strong basis for a more accurate estimation of aquatic biomass in reservoirs, lakes, and other still water areas by using the eDNA method.
Introduction
Environmental DNA (eDNA) refers to DNA noninvasively extracted from any environmental sample, such as water (Ficetola et al., 2008), sediments (Willerslev et al., 2003), or air (Longhi et al., 2009). It is thought to be derived from mixtures of feces (Martellini et al., 2005), skin cells (Ficetola et al., 2008), mucus (Merkes et al., 2014), and secretions (Bylemans et al., 2018) of organisms. As an innovative method, environmental DNA is increasingly used to investigate and monitor macroorganisms, especially aquatic species (Minamoto et al., 2011; Taberlet et al., 2012; Takahara et al., 2012; Ushio et al., 2017; Tsuji et al., 2019; Govindarajan et al., 2021). Traditional survey methods, such as electrofishing, netting, and snorkeling, are time-consuming and costly. The detection rate is low and may cause harm to the target species (Bohmann et al., 2014; Deiner et al., 2017; Kirtane et al., 2021). Studies have demonstrated that the eDNA method has a higher detection sensitivity than traditional aquatic species investigation methods (Dejean et al., 2012; Thomsen et al., 2012; Mahon et al., 2013; Krol et al., 2019; Afzali et al., 2020). It is less invasive and is especially useful for rare and endangered species (Fukumoto et al., 2015; Sigsgaard et al., 2015; Pfleger et al., 2016; Doi et al., 2017; Sakata et al., 2017; Mizumoto et al., 2020). The technique works even when animals are at low densities in the wild (Goldberg et al., 2011). It has been applied extensively for the detection of invasive and endangered species and for the estimation of biodiversity (Goldberg et al., 2013; Pilliod et al., 2014; Jane et al., 2015; Muha et al., 2017; Suarez-Menendez et al., 2020).
The study on estimation of abundance and biomass by the eDNA method is an important frontier of eDNA research (Spear et al., 2020). Previous studies have reported a positive correlation between eDNA concentration and species abundance/biomass (Takahara et al., 2012; Thomsen et al., 2012; Goldberg et al., 2013; Pilliod et al., 2013; Pont et al., 2018). In still water, Takahara et al. found that the concentration of eDNA was positively correlated with carp biomass in both aquaria and experimental ponds (Takahara et al., 2012). Under flowing water conditions, Pilliod et al. compared sampling results from traditional field methods with eDNA methods for two amphibians in 13 streams in central Idaho, United States. They found that eDNA concentration was positively related to field-measured density and biomass (Pilliod et al., 2013). A significant, positive relationship between snorkel-survey counts of the stream-dwelling fish Plecoglossus altivelis and eDNA concentration in the Saba River, Japan. was detected (Doi et al., 2017). Previous studies have shown that flowing water complicates the relationship between eDNA production, transport, and clearance. Nevertheless, a weak but positive relationship was still found between eDNA concentration, zebra mussels, and biophysical parameters (Shogren et al., 2019). The results of these and other recent studies (e.g., Tillotson et al., 2018; Itakura et al., 2019; McElroy et al., 2020) suggest that it is indeed possible to estimate the abundance of aquatic organisms using the eDNA method.
The positive relationships between eDNA concentration and fish biomass may be affected by the shedding and degradation rate of eDNA (Pilliod et al., 2013; Eichmiller et al., 2014; Lacoursiere-Roussel et al., 2016; Yamamoto et al., 2016; Jo et al., 2017). There are still many uncertainties regarding the shedding and degradation of DNA in the aquatic environment (Barnes and Turner, 2015; Civade et al., 2016; Jerde et al., 2016; Sassoubre et al., 2016; Shogren et al., 2016; Andruszkiewicz et al., 2017; Mathieu et al., 2020). Existing studies have shown that the degradation rate of eDNA may vary with water temperature (Tsuji et al., 2016; Jo et al., 2019) and water pH (Barnes et al., 2014; Tsuji et al., 2016) and other environmental factors. Therefore, before using the eDNA method to evaluate biomass, preliminary experiments were firstly conducted to explore how these environmental factors altered eDNA concentration, providing a reliable basis for subsequent experimental condition settings. Furthermore, the shedding rate of eDNA may change with the age and body size of organisms (Maruyama et al., 2014; Thalinger et al., 2021). However, few studies have systematically studied the relationship between biomass and eDNA concentration from the perspective of fish body size and body size composition of the fish population.
In this paper, two experiments were first conducted to clarify the effects of two environmental factors, water pH and water temperature, on eDNA concentration. Then, on the premise of consistent environmental conditions, we systematically studied the relationship between eDNA concentration and biomass in still water by changing the body size and body size composition of Schizothorax prenanti. It provides a scientific reference for improving the ability to accurately estimate biomass using the eDNA method in still water such as reservoirs and lakes.
Materials and methods
In this study, we take the Schizothorax prenanti as a typical fish representative, which is mainly distributed in the Jinsha River, Min River, and other rivers of the upper reaches of the Yangtze River in China. It is an important economic fish species in southwest China. Therefore, it is of great significance to monitor the biomass of this target fish species. However, it is difficult to investigate the biomass of Schizothorax prenanti in the wild, so it is necessary to explore the eDNA method to estimate the biomass of aquatic species in the river ecosystem.
The fish used in this experiment were obtained from an aquaculture institution in Chengdu, China. They were reared in laboratory aquariums. The aquariums were thoroughly rinsed and disinfected before the fish were placed. To avoid the introduction of target species DNA from pathways outside the aquarium water environment, no feeding was performed during the experiment. All experiments were approved by the ethics committee prior and performed in accordance with relevant institutional and national guidelines and regulations.
Experimental design and sampling
Effect of environmental conditions on environmental DNA
We conducted two experiments to explore the effect of water temperature and water pH on eDNA concentration. For the experimental treatment group with water temperature as an environmental variable, six equal volume water samples were collected from the aquarium in which the Schizothorax prenanti were reared. The water pH of these samples was set to six levels: pH 5, pH 6, pH 7, pH 7.6, pH 8, and pH 9. The water of all treatments was neutral when the experiment began; therefore, the treatment of water pH 7 was not manipulated. Acidic and alkaline treatments were achieved using sterile 1 M HCl or 0.5 M NaOH, respectively. We monitored pH levels to make sure they were stable throughout the experiment. For the experimental treatment group with water temperature as the environmental variable, six equal volume water samples were collected in the same way. The water temperature of these samples was set to six levels: 12°C, 23°C, 26°C, 29°C, 32°C, and 35°C. Each treatment temperature level was held in a separate growth chamber automated to maintain a constant temperature. For each experimental treatment, we collected 100 ml water samples at 0 h, 12 h, 24 h, 36 h, 48 h, and 60 h after the setting of environmental variables reached stability.
Relationship between biomass and environmental DNA
The experimental fish were reared in several aquariums with the same volume of water storage, and each aquarium was one experimental treatment. All experimental treatments were exposed to the same environmental conditions, where the water temperature was 23°C ± 0.2 and the water pH level was pH7.
To evaluate the correlation between eDNA concentration and fish biomass, we implemented four experiments. Experiments I and II investigated the correlation between biomass and eDNA concentration when fish were of the same body size in each treatment; Experiments III and IV investigated the variation of eDNA concentration under different body size compositions when biomass was the same in each treatment.
Four experimental treatments were set up in Experiment I, in which 1, 2, 3, and 4 adult fish with an individual weight of about 500 g were reared in four experimental aquariums, respectively. In Experiment II, six experimental treatments were set up, and 3, 4, 6, 8, 9, and 12 juvenile fish with an individual weight of about 20 g were reared in 6 experimental aquariums. In Experiment III, three experimental treatments were set, and the biomass of each experimental treatment was about 2,000 g/m3. There was one fish with an individual weight of about 1,000 g in Treatment 1; two fish with an individual weight of about 500 g in Treatment 2, and 46 fish with an individual weight of about 20 g in Treatment 3. In Experiment IV, three experimental treatments were also set, and the biomass of each treatment was about 4,000 g/m3. There were two fish with an individual weight of about 1,000 g in Treatment 1; two fish with an individual weight of about 500 g and one fish with an individual weight of about 1,000 g in Treatment 2. For Treatment 3, there was one fish with an individual weight of about 1,000 g, one fish with an individual weight of about 500 g, and 50 juvenile fish with an individual weight of about 20 g. The specific experimental conditions of each experimental treatment were presented in Table 1.
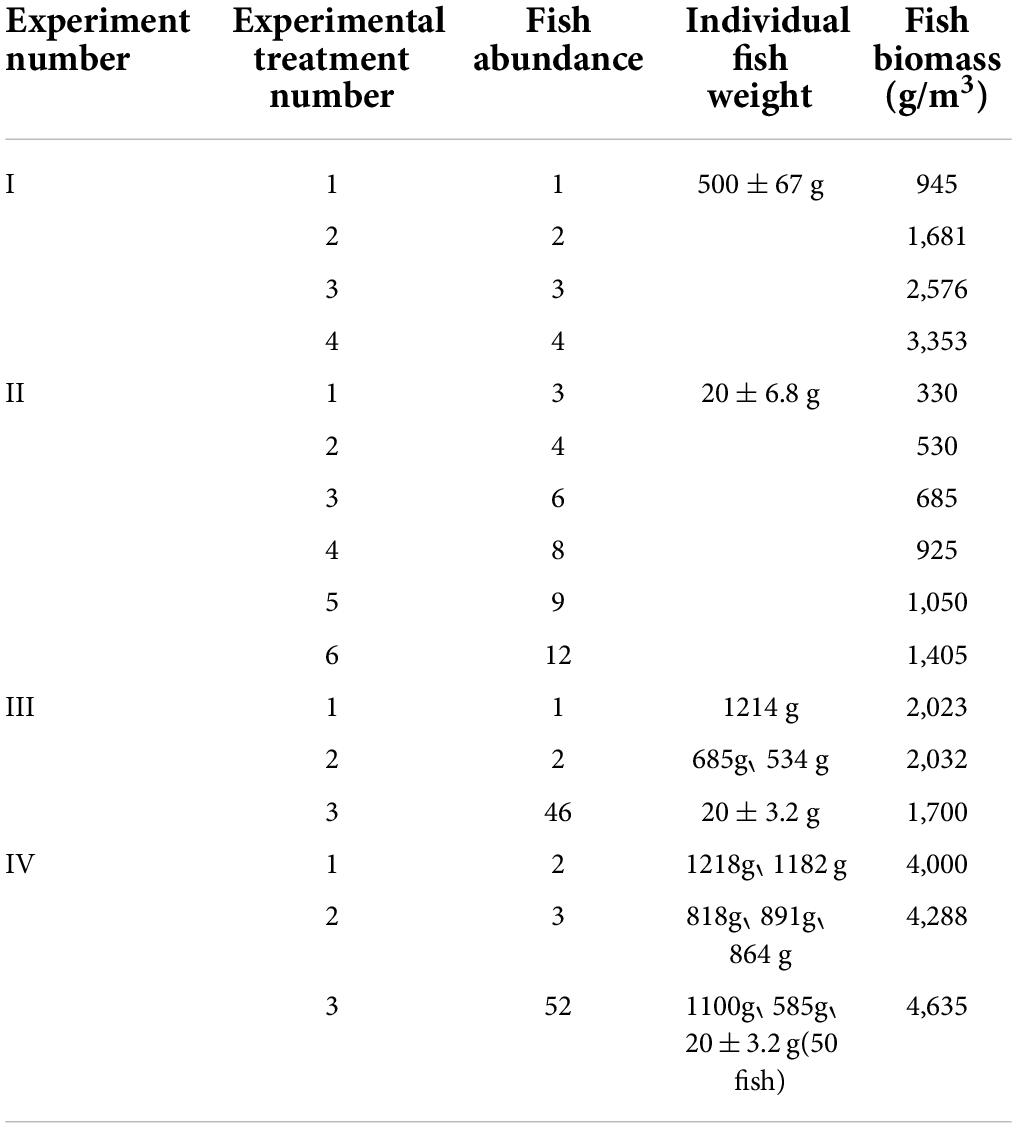
Table 1. Experimental conditions for each experimental treatment.
For each treatment, the fish were reared in the aquarium to adapt to the environment for 24 h before the experiment began. For all experimental treatments, 100 ml of water samples were collected at 48 h, 72 h, and 96 h since the start of the experiment.
DNA extraction and qPCR
All water samples were collected in the same way and filtered within half an hour after sampling using glass fiber filters with a pore size of 0.45 μm (Xingya Purification Materials Company, Shanghai, China). Deionized water was used as negative control. All filtration equipment (i.e., filter funnels and forceps) was sterilized using sodium hypochlorite and rinsed with deionized water Contaminants were strictly controlled. The filters were stored in sterile 2 ml tubes at −80°C until DNA extraction with the DNeasy Blood and Tissue Kit (Qiagen, Hilden, Germany).
The quantification of eDNA was performed using real-time quantitative PCR. Through design and screening, we identified the primers and probe for Schizothorax prenanti as follows: forward primer (5′-GAGTGCGGATTTGACCCAC-3′), reverse primer (5′-TAACCCCCCCTATTCTGCTCATTC-3′), and probe (5′- TCCGCCCGCCTACCATTTTCTCTCTA -3′). The primers are highly specific to the target species. Real-time quantitative PCR was performed in a 20 μl reaction for each sample. QuantiNova Probe PCR Master Mix (Qiagen, Hilden, Germany) was used following the manufacturer’s protocol. The mixture of the reagents was as follows: 10 μl of 2 × PCR master mix, 6 μl of RNase-free water, 0.8 μl of each primer, 0.4 μl probe, and 2 μl of extracted DNA solution. The qPCR thermal conditions were as follows: 2 min at 95°C, and 39 cycles of 5 s at 95°C and 10 s at 56°C. Quantitative real-time PCR (qPCR) was performed in triplicate, and the mean value was used during assays. PCR products of the target sequences were cloned into the plasmid, and a dilution series of the plasmid were amplified as standards in triplicate in all qPCR assays. Three wells of a no-template negative control were included in each qPCR plate and showed no amplification. The R2 values for the standard curves were ≥0.99 for all qPCR reactions. which met the requirements of the standard curve required for fluorescence absolute quantitative PCR. All samples were assayed in triplicate. Figure 1 outlines the experimental procedure from water sample collection to the eDNA concentration detection.
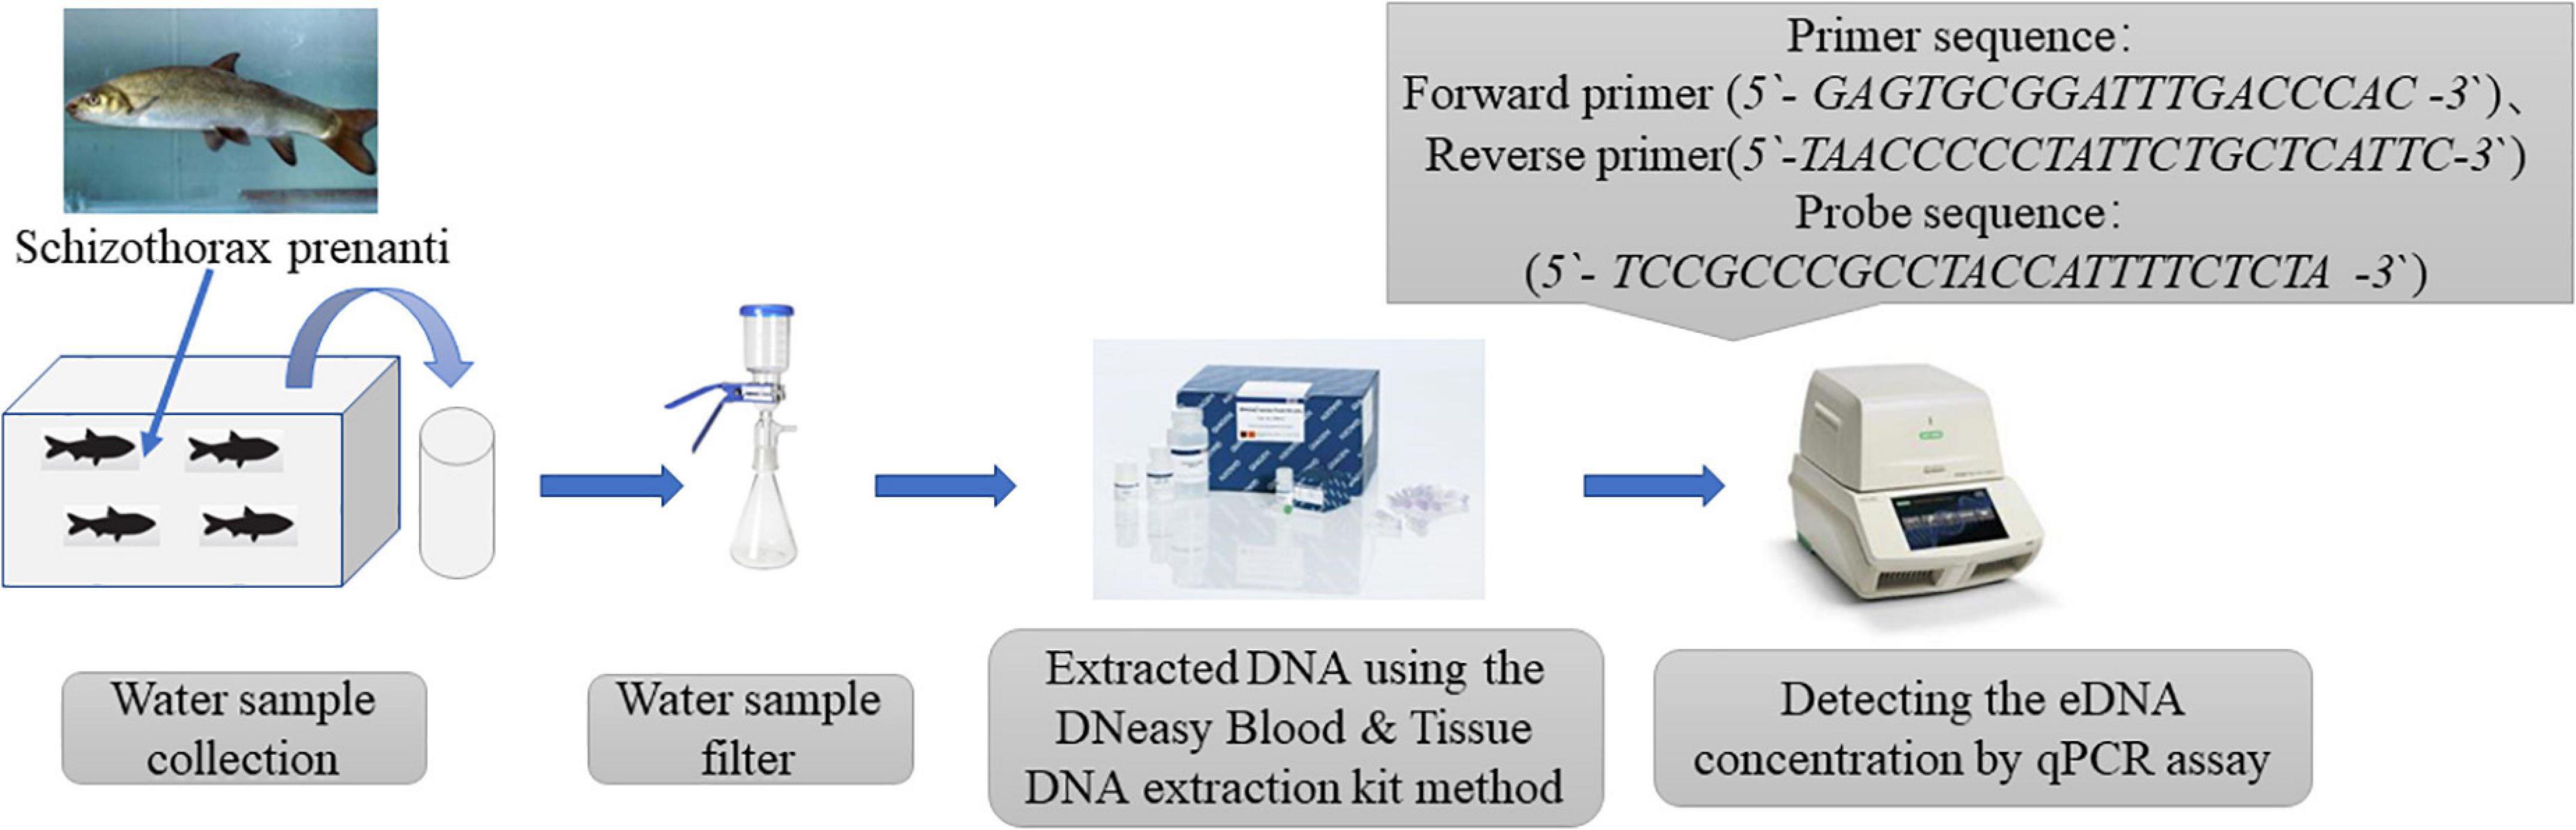
Figure 1. Flow chart of experimental operation.
Results
Experimental treatments of water pH and temperature
The eDNA concentration detected in the water samples decreased over time in all experimental treatments. The relative eDNA concentration (C/C0) of the water samples was obtained by dividing the eDNA concentration C at each time point t with their corresponding initial eDNA concentration C0 (at time t = 0). The trends of relative eDNA concentration over time for each water pH treatment were shown in Figure 2; the trends of relative eDNA concentration over time for each water temperature treatment were shown in Figure 3. The results showed that both water pH and water temperature had a significant influence on the change of eDNA concentration. Therefore, when conducting subsequent experimental studies on the correlation between biomass and environmental DNA, we must ensure that all experimental treatments were conducted under the same environmental conditions such as water pH and water temperature. The water pH and water temperature were monitored for each experimental treatment to eliminate the effects of environmental variables.
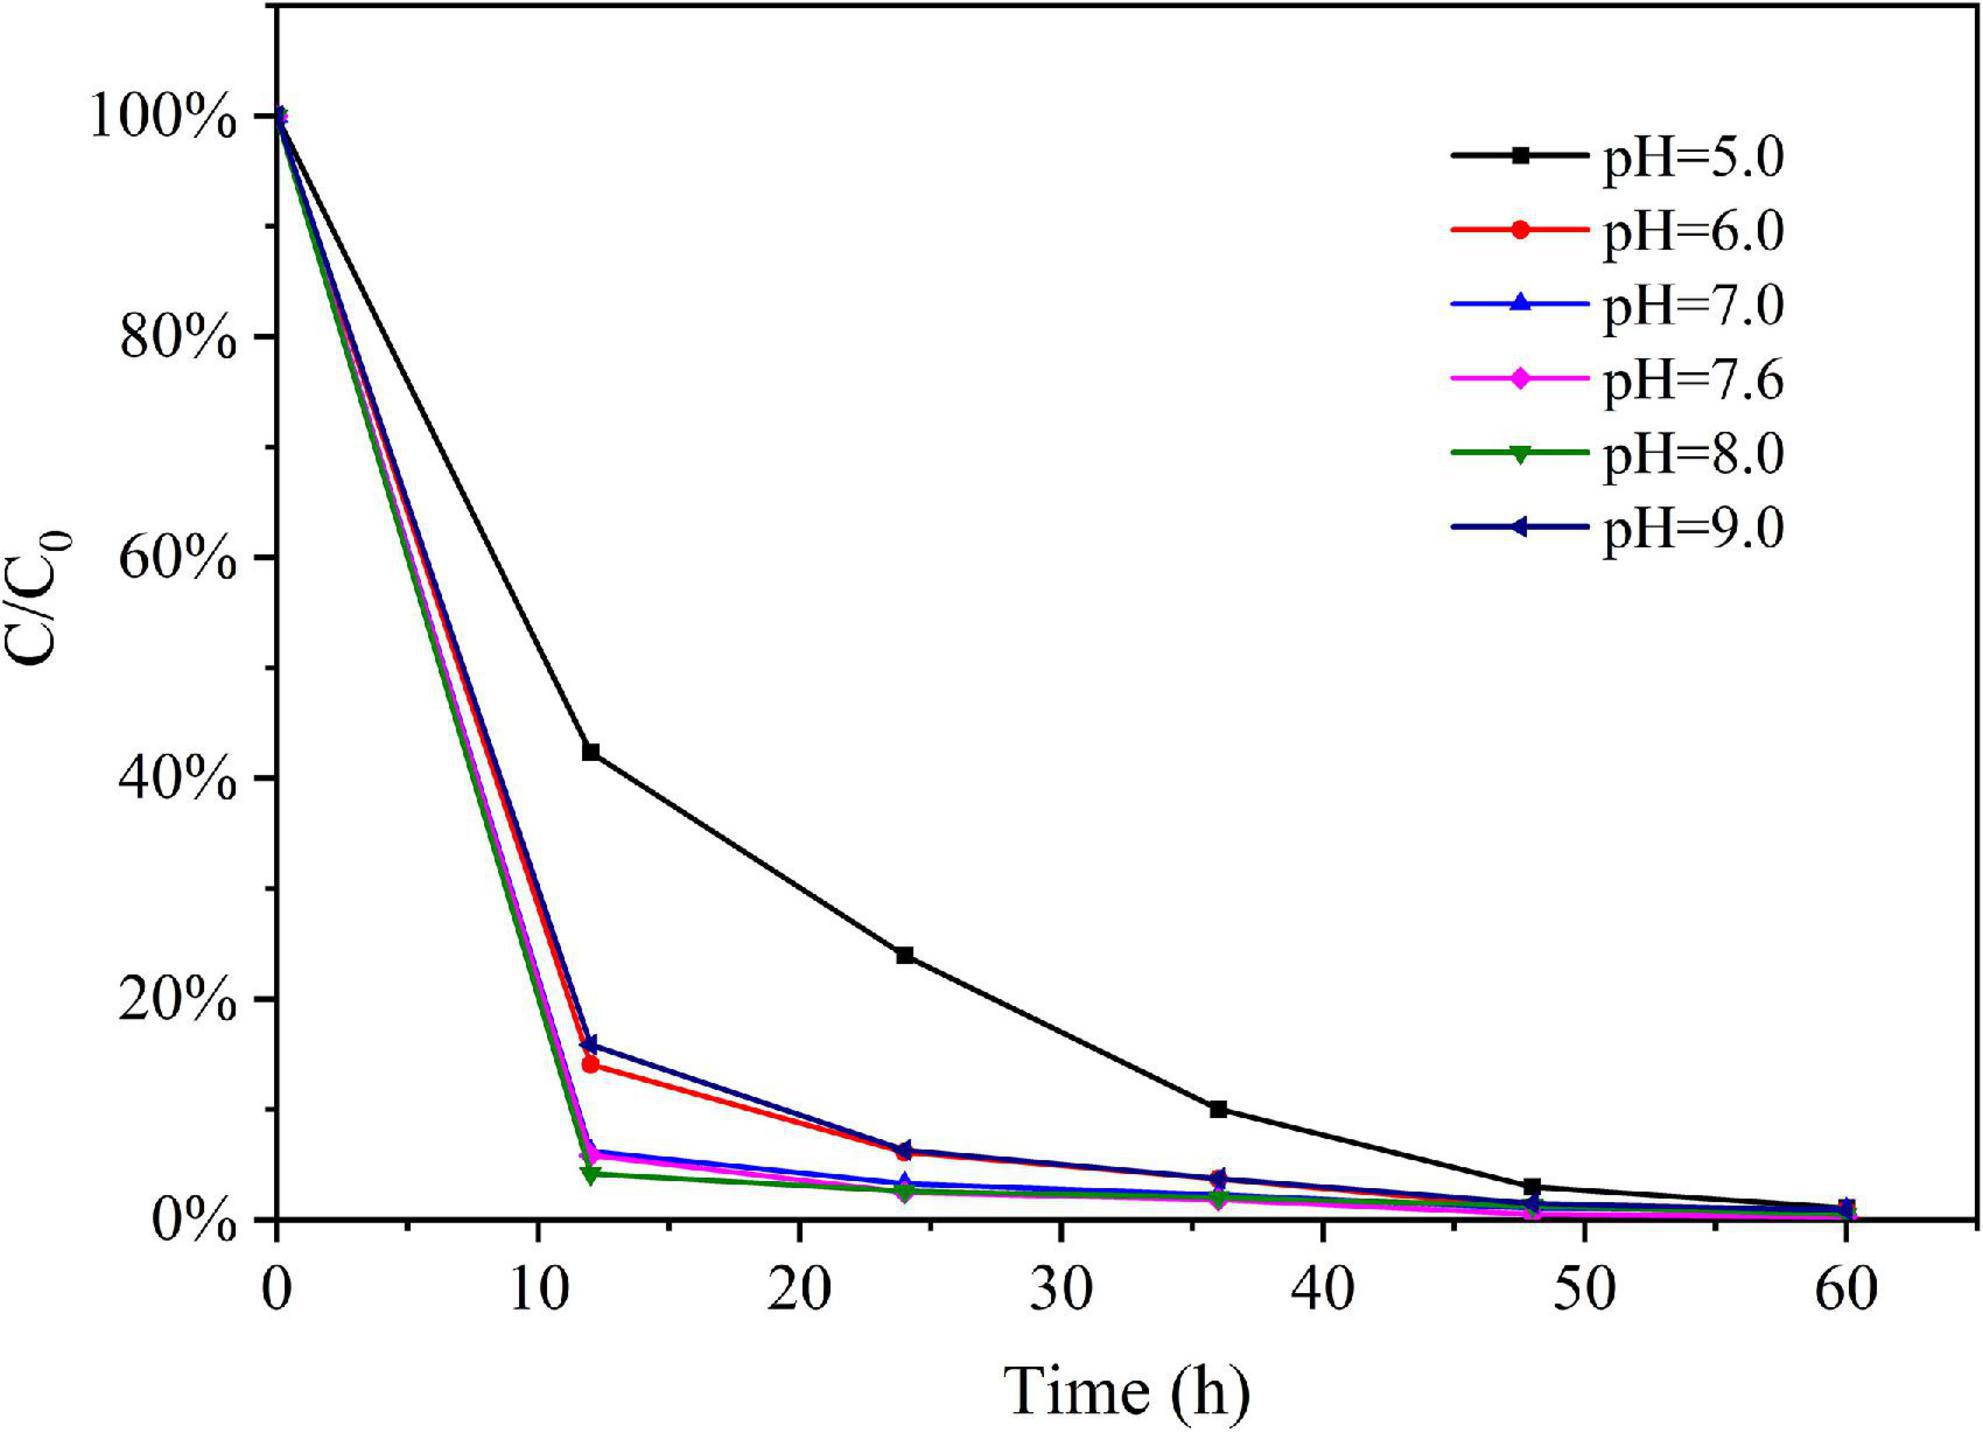
Figure 2. The variation trend of relative eDNA concentration under different water pH.
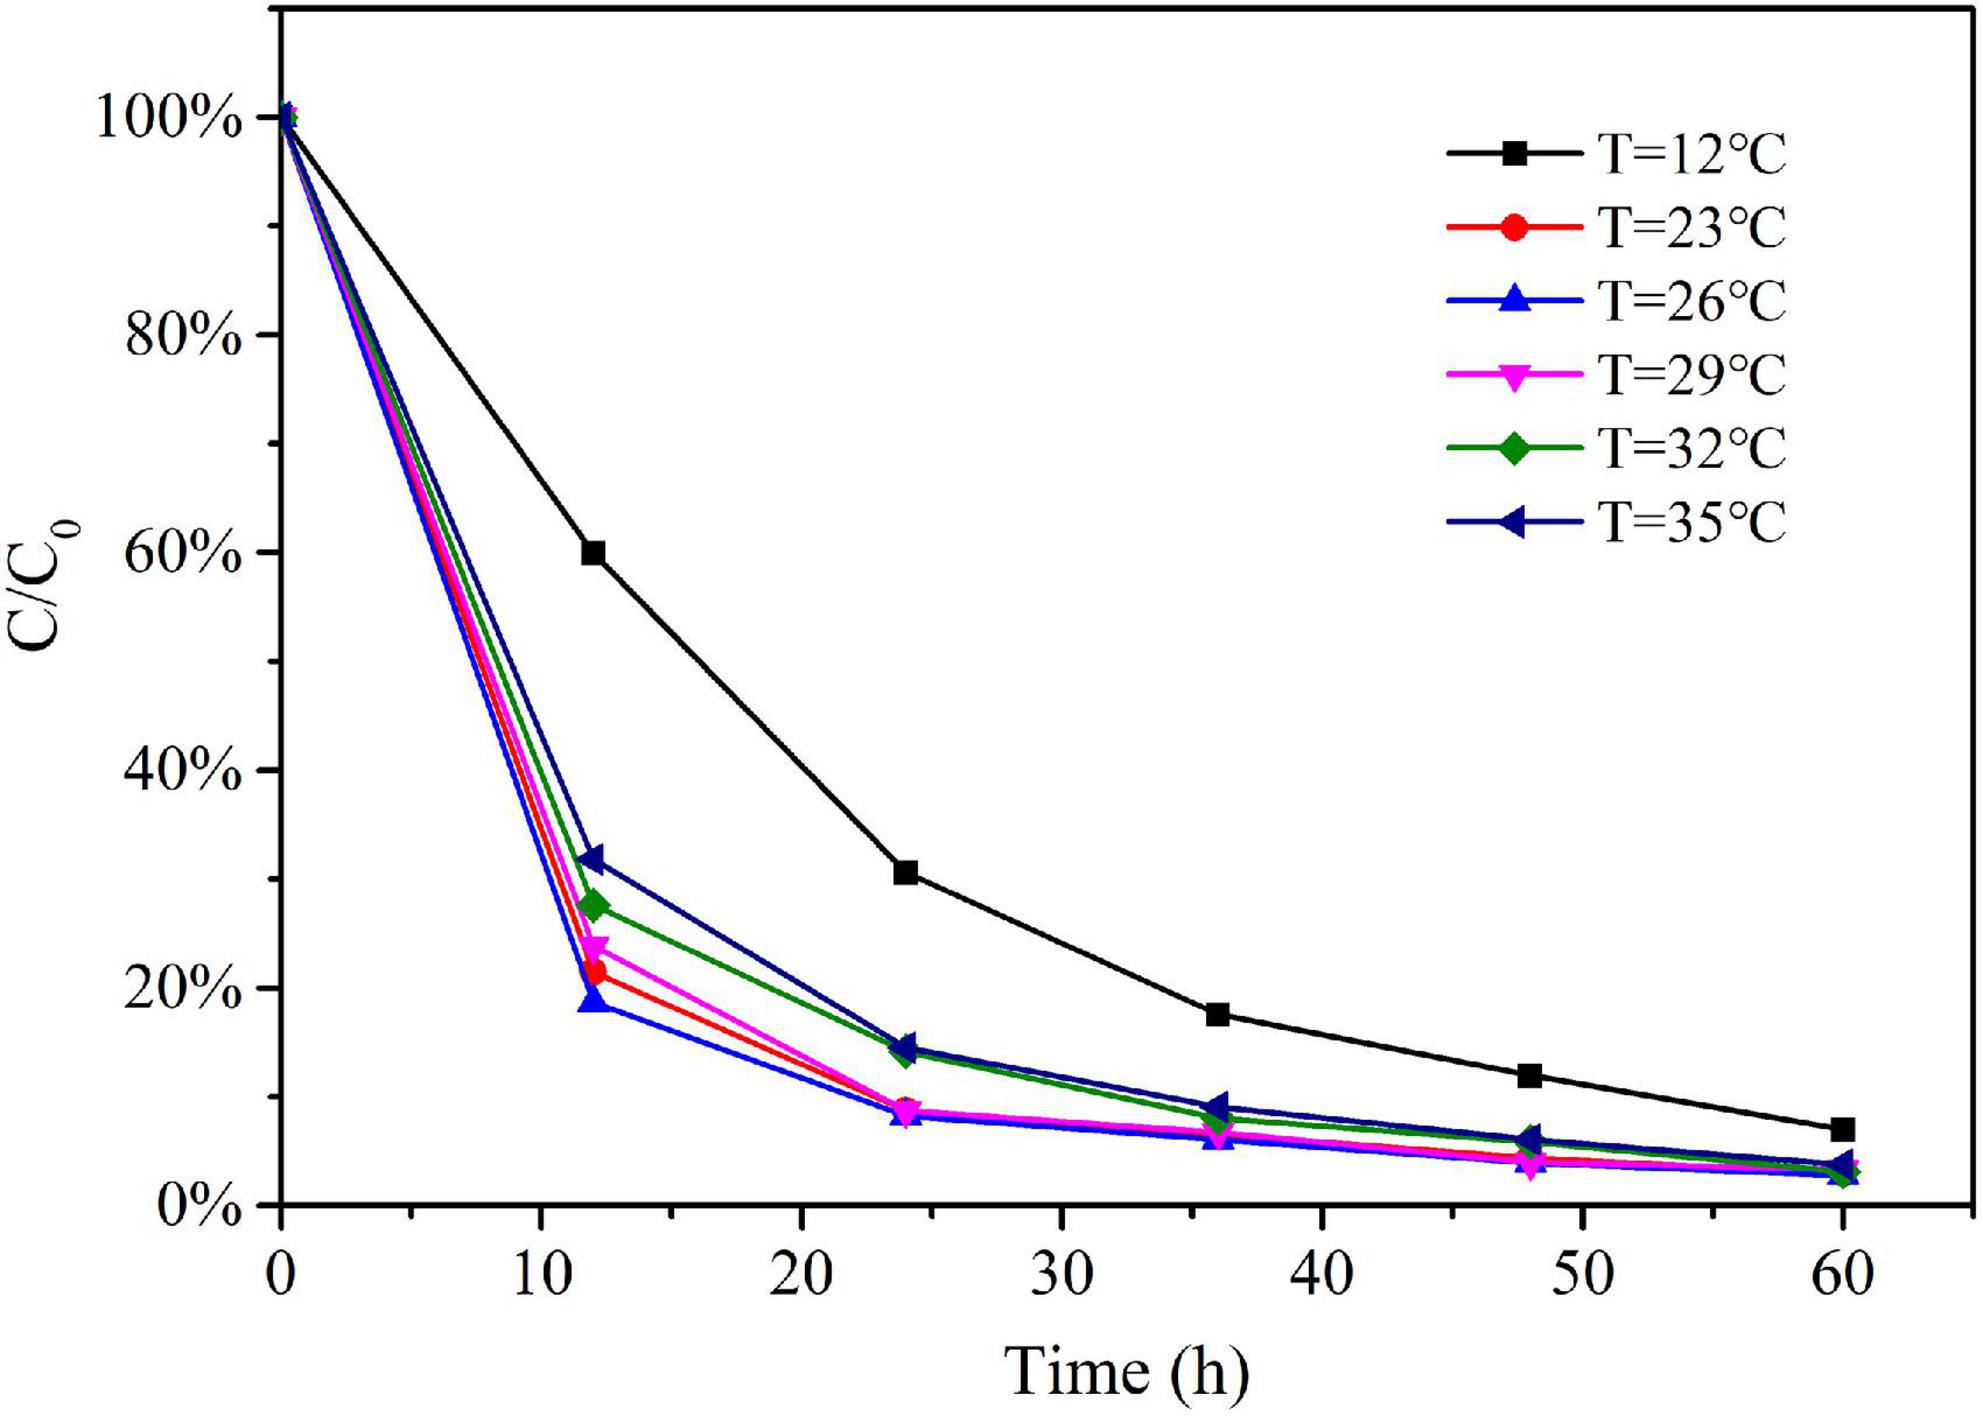
Figure 3. The variation trend of relative eDNA concentration under different water temperature.
Experimental treatments of the same fish body size
According to the detected eDNA concentration of water samples in each treatment of Experiment I, we obtained the relationship between the biomass and eDNA concentration of adult Schizothorax prenanti at different sampling times, as shown in Figure 4A. According to Experiment II, the relationship between the biomass and eDNA concentration of juvenile fish at different sampling time can be seen in Figure 4B.
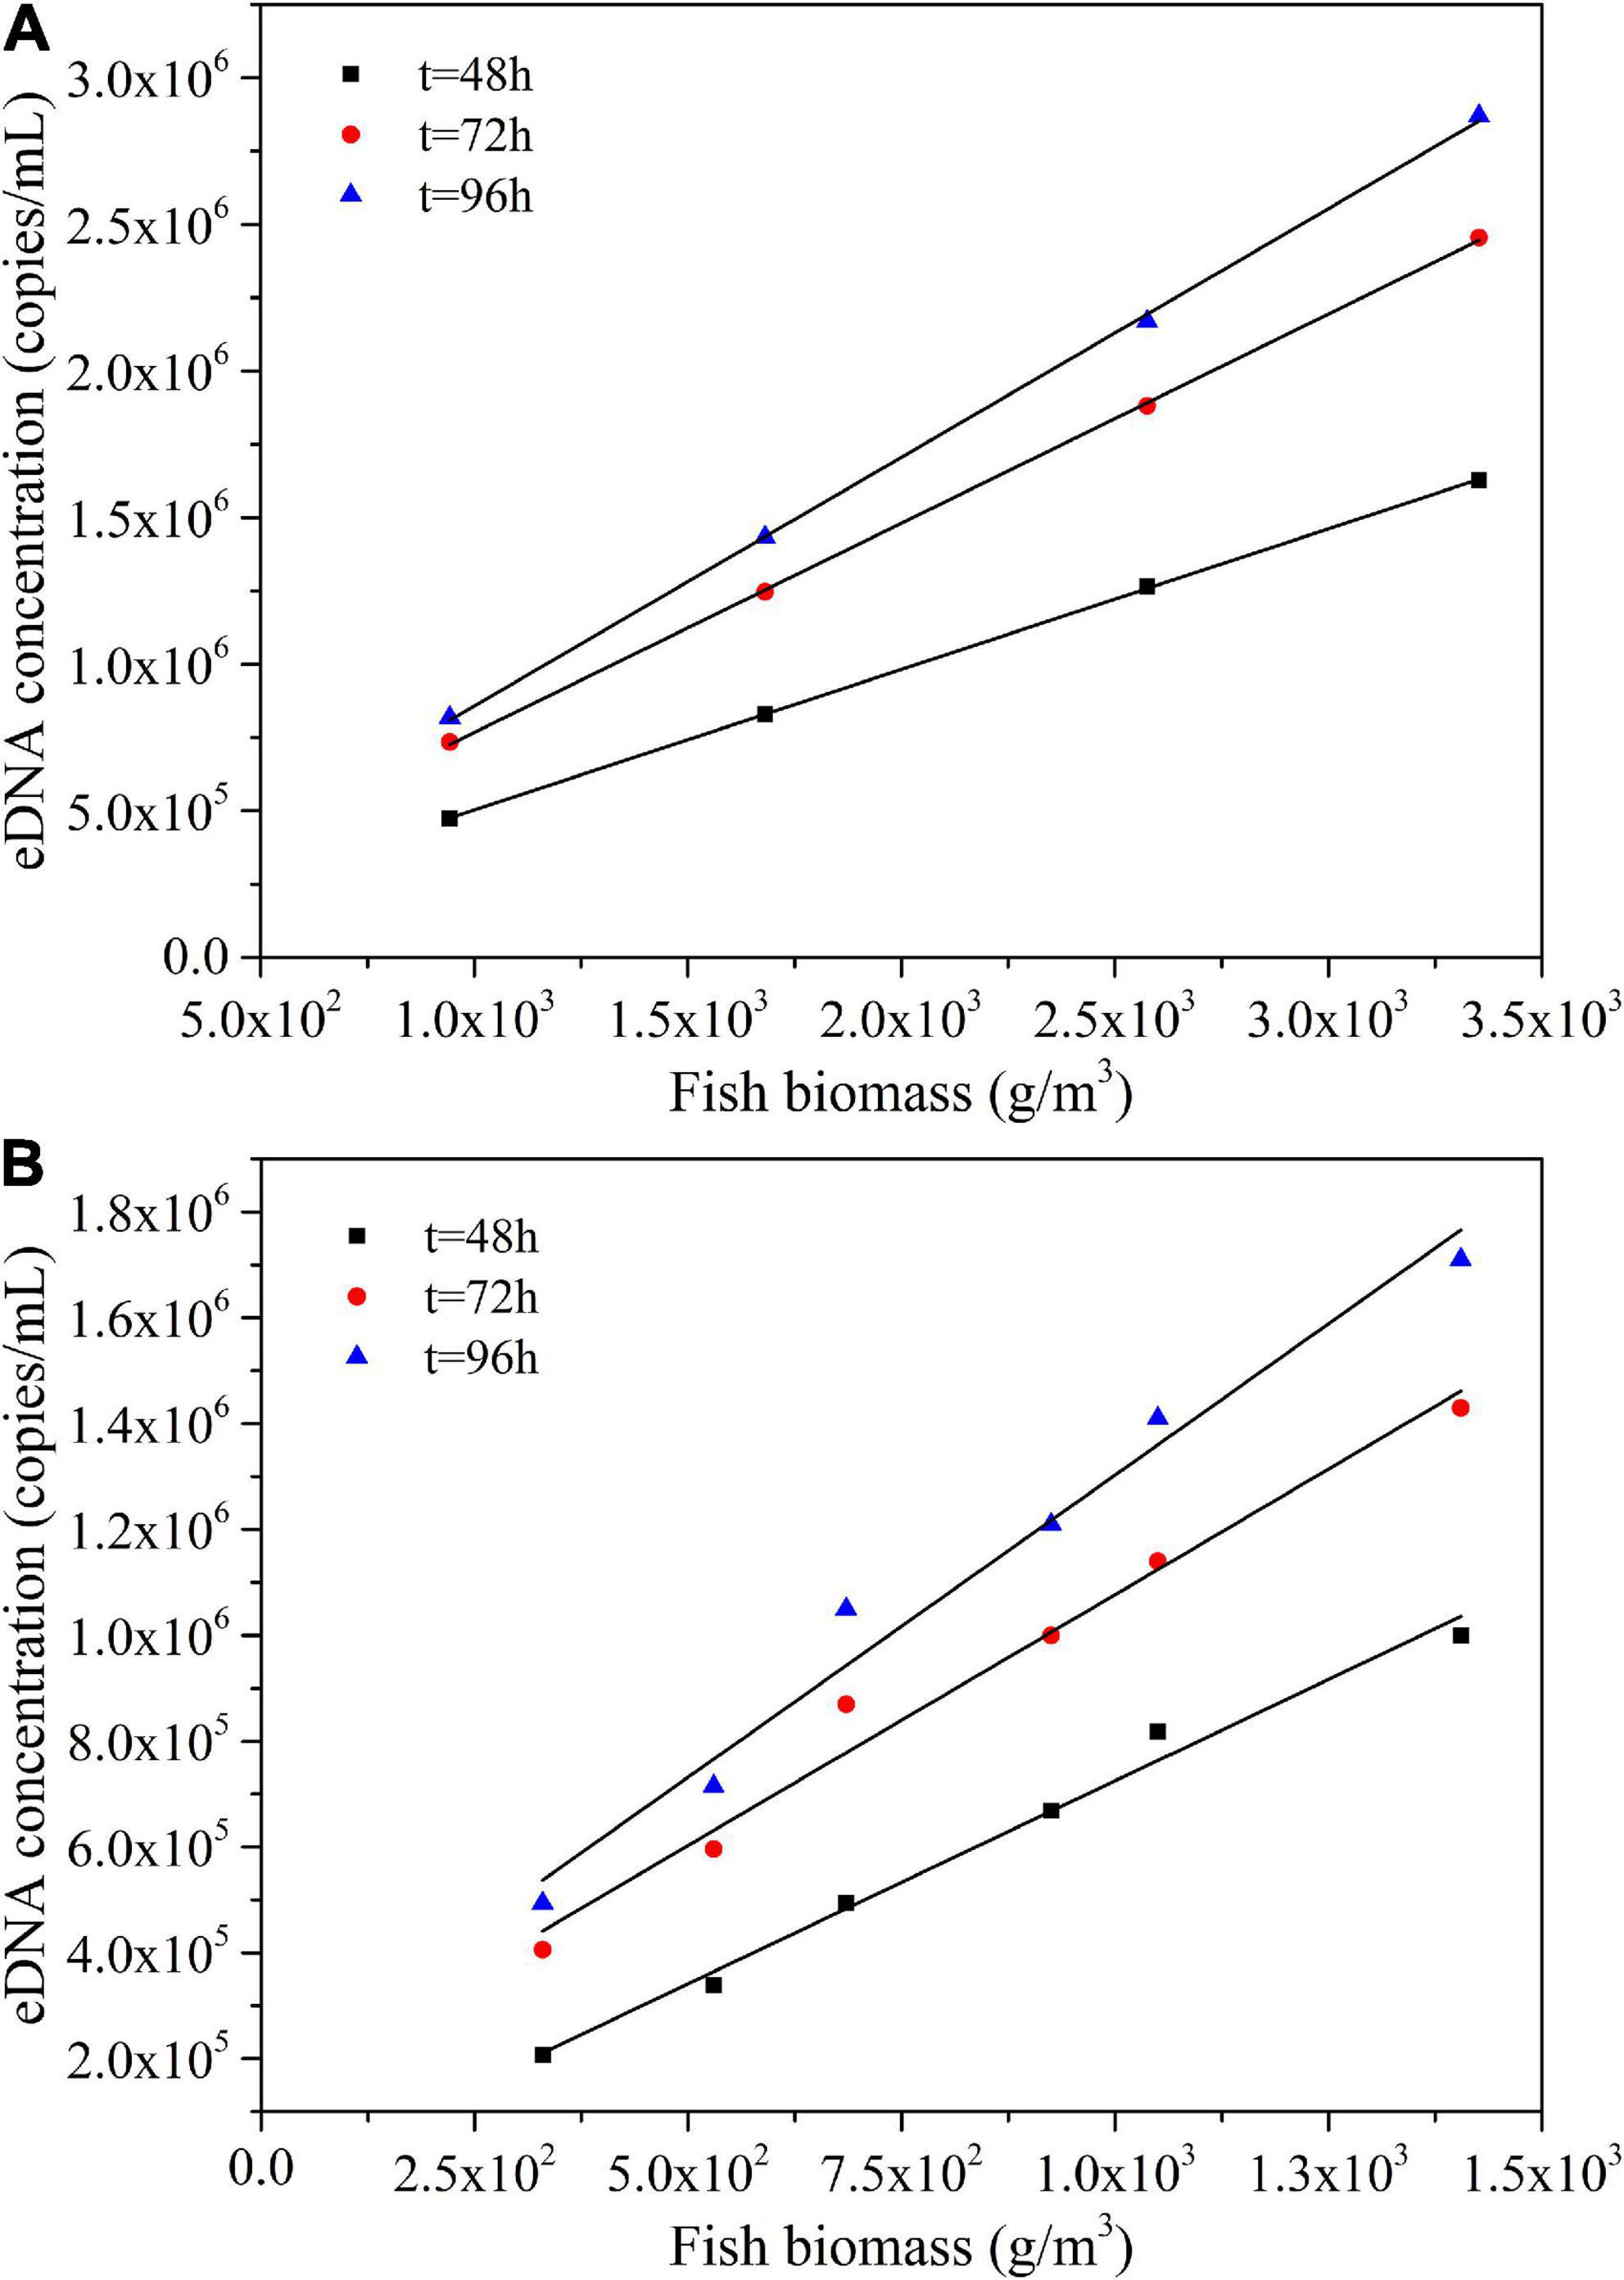
Figure 4. Relationship between biomass and eDNA concentration at different sampling time: (A) Adult fish experimental group. (B) Juvenile fish experimental group.
As shown in Figures 4A,B, at the same sampling time, there was a linear correlation between the biomass and eDNA concentration of Schizothorax prenanti in both adult and juvenile experimental groups. The larger the biomass (the number of individuals of fish), the higher the eDNA concentration, which presents a linear growth trend.
The biomass and corresponding eDNA concentration data for each of the above six experimental treatments were collected and further analyze. The biomass of each experimental treatment was linearly fitted to its corresponding eDNA concentration at different sampling time points, and the expression of the first-order function was as follows:
where C is the eDNA concentration; M is the biomass of each experimental treatment; a is the slope of the fitting line, i.e., △C/△M; b is the intercept. The coefficients a and b of the fitted first-order function are summarized in Table 2. As can be seen from Table 2, the later the sampling time is, the higher the slope of the fitting line is, regardless of the adult fish experimental group or the juvenile fish experimental group. That is, the greater the cumulative increase of eDNA concentration with biomass. This may be due to the increasing adaptation of Schizothorax prenanti to the aquarium environment over time. Therefore, their metabolic rate increases, and the rate of shedding eDNA into the water increases.
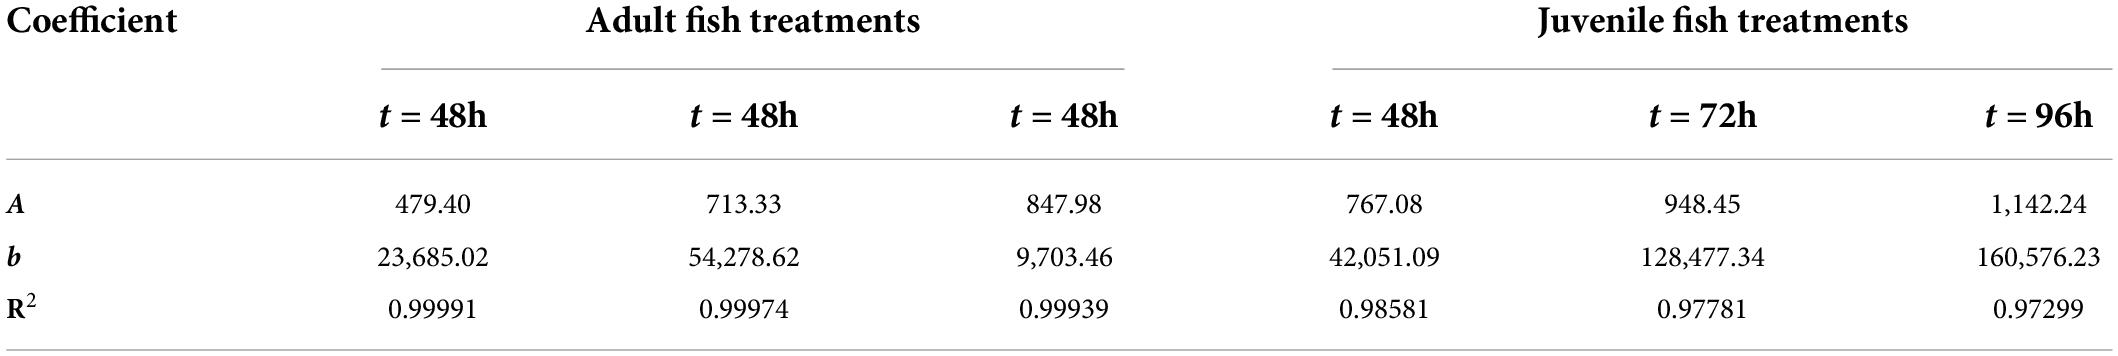
Table 2. Linear fitting function coefficients of biomass and eDNA concentration.
Experimental treatments of the same fish biomass
The biomass of each experimental treatment in Experiment III was about 2,000 g/m3, and the eDNA concentration detected in each experimental treatment in Experiment III at different sampling times were compared, as shown in Figure 5A. The eDNA concentration corresponding to per unit biomass (1 g/m3) of Schizothorax prenanti in each experimental treatment was calculated. Then the comparison of eDNA concentration corresponding to per unit biomass (1 g/m3) of Schizothorax prenanti was drawn, as shown in Figure 5B. The biomass of each experimental treatment in Experiment IV was about 4,000 g/m3. Similarly, the eDNA concentration detected in each experimental treatment in Experiment IV at different sampling times are shown in Figure 6A, and the corresponding eDNA concentration per unit biomass (1 g/m3) are plotted for comparison, see Figure 6B.
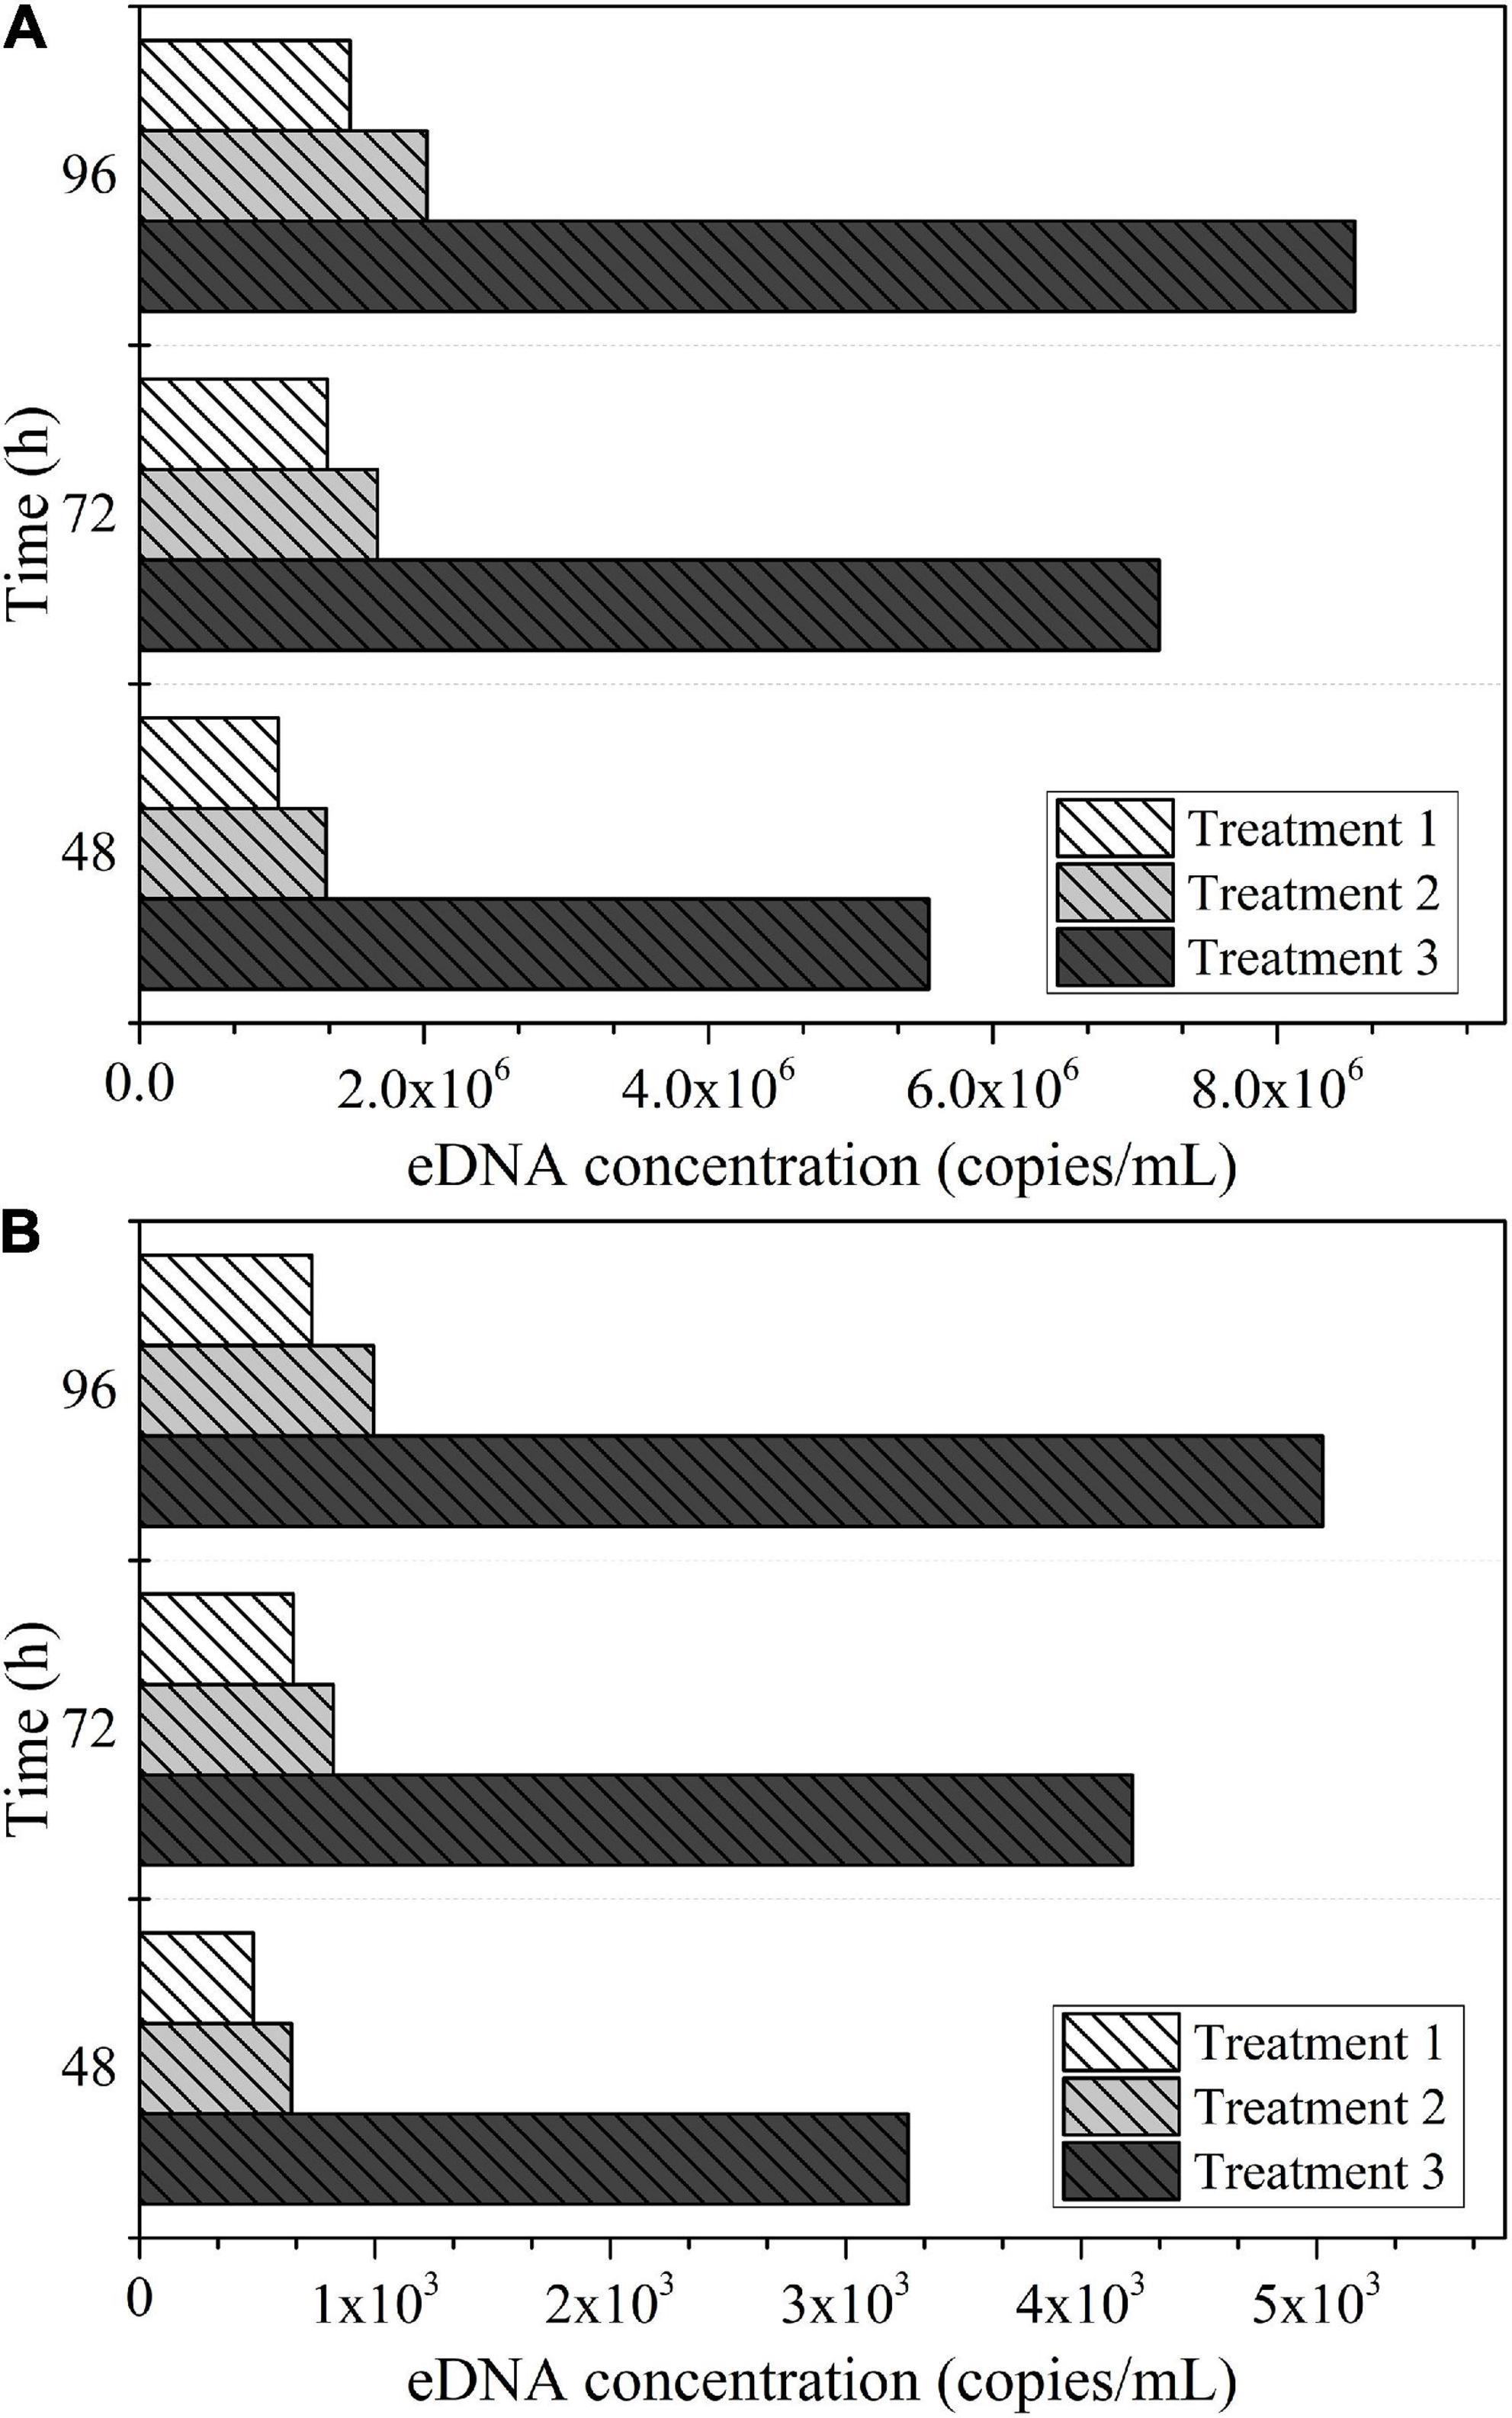
Figure 5. The eDNA concentration detected at different sampling times for each experimental treatment in Experiment III: (A) eDNA concentration corresponding to total biomass. (B) eDNA concentration corresponding to per unit biomass.
Figure 6. The eDNA concentration detected at different sampling times for each experimental treatment in Experiment IV: (A) eDNA concentration corresponding to total biomass. (B) eDNA concentration corresponding to per unit biomass.
Discussion
Experimental treatments of water pH and temperature
The concentration of environmental DNA decreased over time for all experimental treatments. This is due to the process of continuous degradation of eDNA in parallel with the fact that no more organisms continue to shed eDNA into the water after the water samples are collected from the aquarium. Based on our experimental data, it can be observed that the degradation of environmental DNA is very sharp in the initial stages. The consistency of degradation patterns across a range of environmental covariates provides evidence that the initial sharp decline in eDNA is common across a variety of systems and environmental conditions (Dejean et al., 2011; Thomsen et al., 2012; Barnes et al., 2014).
Figure 2 showed that the water pH level had a great influence on the eDNA degradation. The degradation rate was faster when the water pH is between 7.0 and 8.0. The reason for this phenomenon may be that the suitable water pH for the survival and reproduction of most microorganisms in the experimental water body and the suitable water pH for the extracellular enzyme to degrade eDNA were neutral and weakly alkaline; Strong acidic and strong alkaline conditions would inhibit the activities of microorganisms and enzymes, thus reducing the degradation rate of eDNA.
In this experiment, water temperature also had a great influence on the degradation of Schizothorax prenanti eDNA. According to Figure 3, it can be seen that the degradation rate is highest when water temperature is between 23°C and 29°C. The degradation rate at 12°C was much lower than that at 26°C, which was consistent with previous studies (Strickler et al., 2015). The reason for this phenomenon may be that the optimum temperature for the growth and reproduction of microorganisms in the experimental water and the suitable temperature for enzyme activities is between 23°C and 29°C. In the case of lower water temperature or higher water temperature, the activities of microorganisms and enzymes in the water are inhibited, thus reducing the eDNA degradation rate. That is, water temperature affects the degradation rate of eDNA by affecting the activities of microorganisms and enzymes.
In general, water pH and water temperature significantly affect the concentration of eDNA in an aquatic environment, mainly by altering the activity of microorganisms and enzymes that affect the degradation rate of eDNA. Therefore, when using eDNA methods to predict the biomass of aquatic species, the effects of environmental factors need to be considered simultaneously. For example, changes in water temperature in different seasons or differences in water pH in different watersheds may lead to different prediction results. The trends of environmental DNA of target species under different environmental conditions such as water pH and water temperature can be obtained in the laboratory before fieldwork, which facilitates comparisons between different rivers under different environmental conditions.
Experimental treatments of the same fish body size
The eDNA concentration of the juvenile fish experimental group and adult fish experimental group under different experimental conditions was compared and analyzed, as shown in Figure 7A. The dashed line is a linear fit of the mean eDNA concentration for each experimental treatment under different biomass conditions. It can be observed from the fitting line that the eDNA concentration of the juvenile fish group is higher than that of the corresponding adult fish experimental group under the same biomass level. Previous studies have pointed out that the shedding rate of environmental DNA may change with the age and body size of organisms (Maruyama et al., 2014). Therefore, we analyzed that this may be due to the higher activity intensity, higher metabolic rate, and greater rate of eDNA shedding in juvenile fish than in adult fish. Therefore, we analyzed that this may be due to the higher activity intensity and metabolic rate of juvenile fish than adult fish, with a larger eDNA shedding rate.
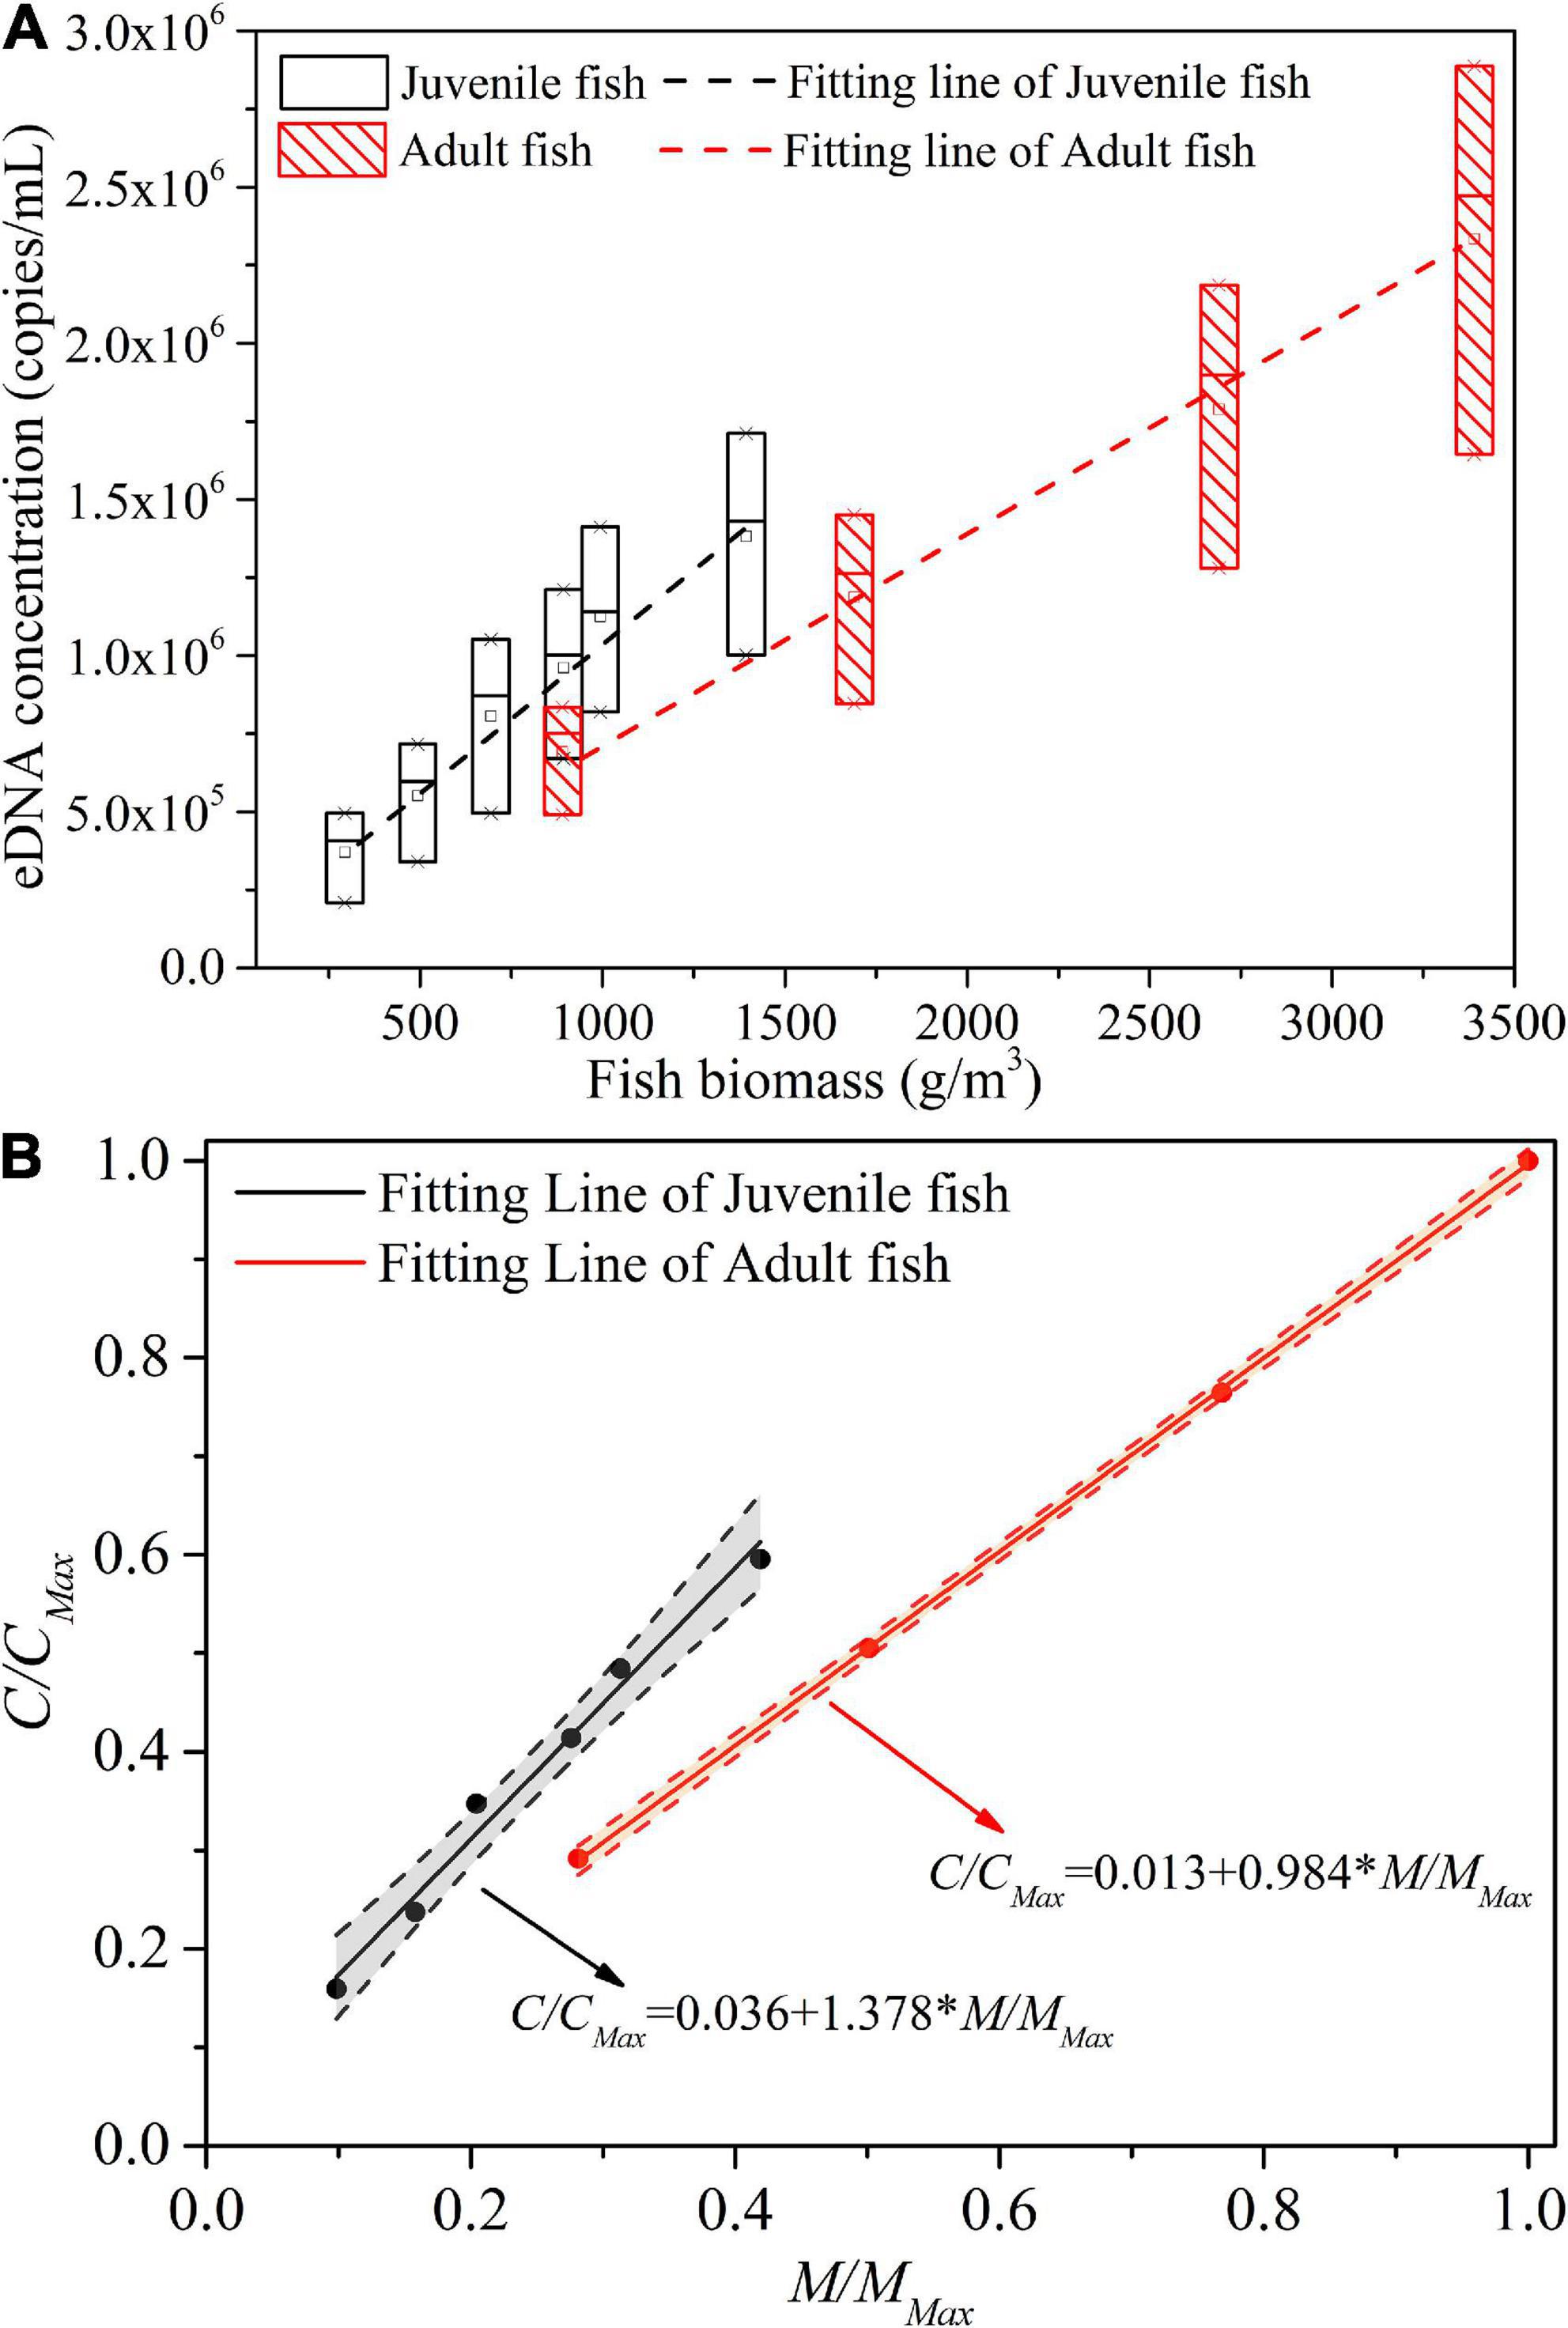
Figure 7. Comparison of the relationship between biomass and eDNA concentration in the adult and juvenile fish experimental groups: (A) Raw data; (B) Normalized data.
In the adult fish experimental group, for each increase of per unit biomass (1 g/m3), the eDNA concentration increased by about 680 copies/ml. In the juvenile fish experimental group, for each increase of 1 unit of biomass (1 g/m3), the corresponding eDNA concentration increased by about 953 copies/ml. In other words, the increase in eDNA concentration with biomass in the juvenile group was about 1.4 times higher than that in the adult group.
The two variables depicted in Figure 7A, biomass and eDNA concentration, were dimensionless and the results were shown in Figure 7B. MMax is the maximum biomass corresponding to all experimental treatments of Experiment I and II, and CMax is the mean value of eDNA concentration corresponding to MMax. From Figure 7B, we can obtain that for each 1% increase in biomass of the juvenile fish experimental group, the eDNA concentration increased by 1.38% accordingly; For each 1% increase in biomass in the adult fish experimental group, the eDNA concentration increased by 0.98% accordingly, i.e., the growth rate of the juvenile fish group is 0.4% higher than that in the adult fish group.
For the adult fish experimental group, the growth rate of biomass and the corresponding growth rate of eDNA concentration was almost equal. However, for the juvenile fish experimental group, the growth rate of biomass was slightly higher than the corresponding growth rate of eDNA concentration. Therefore, when we use the eDNA method to evaluate the change of biomass in still water, we can predict it according to the change rate of environmental DNA concentration, However, the effect of age/body size composition of biological populations on the predicted results cannot be ignored. If the proportion of juvenile fish in the population is greater, the rate of change in population biomass will be higher than the rate of change in eDNA concentration.
eDNA concentration corresponding to per unit biomass (1 g/m3) was calculated for all experimental samples of adult fish collected in Experiment I, and then statistical analysis was performed to obtain the bar graphs shown in Figure 8A. Each bar depicts the mean quantification value (with accompanying standard deviation) of the eDNA concentration corresponding to per unit biomass (1 g/m3) for the four experimental treatments at different sampling times. The eDNA concentration corresponding to per unit biomass (1 g/m3) was calculated for all juvenile fish experimental group samples collected in Experiment II, and the same statistical analysis of data was performed to obtain Figure 8B.
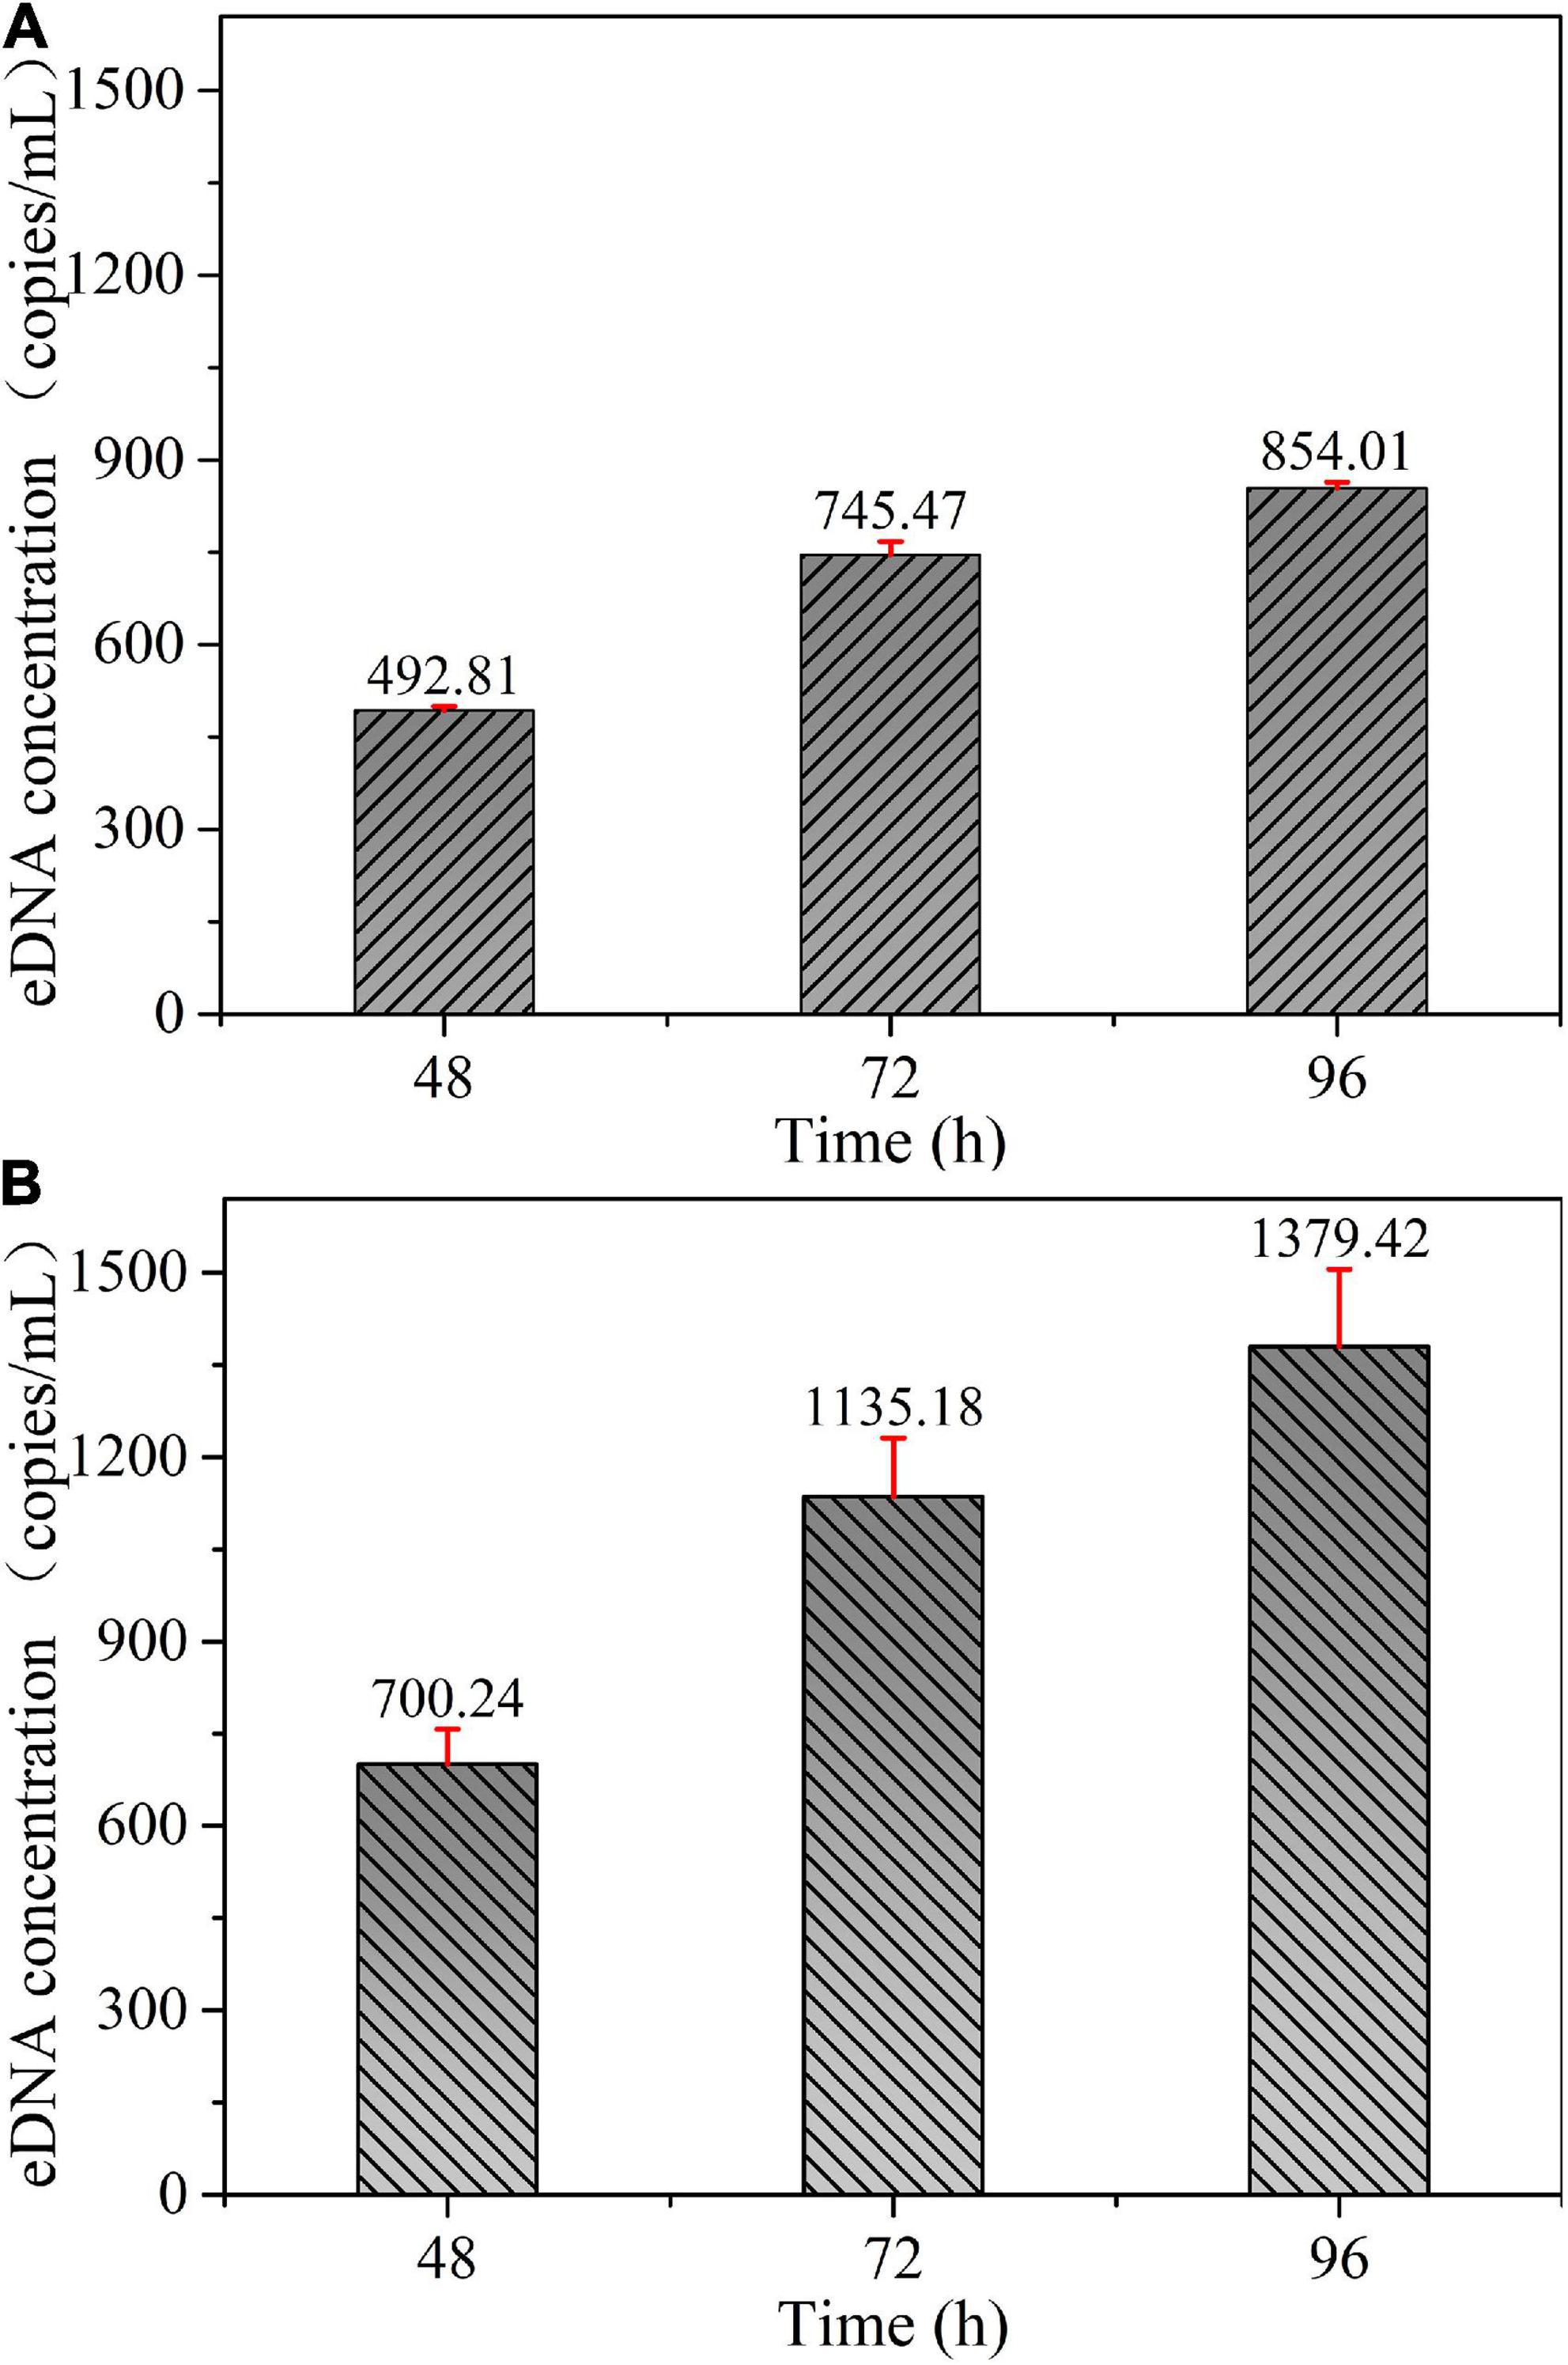
Figure 8. eDNA concentration corresponding to per unit biomass at different sampling times: (A) Adult fish experimental group. (B) Juvenile fish experimental group.
As can be seen in Figure 8, under the same sampling time conditions, the eDNA concentration released per unit of biomass was basically the same among different experimental treatments for both the adult and juvenile fish groups. The dispersion of the data was slightly higher in the juvenile group than in the adult group. The results showed that the eDNA release rate per unit of biomass was almost the same between the two experiments under the same body size condition. The number of individual fish had almost no effect on the eDNA release rate per unit of biomass.
Through the above two groups of experiments with the same individual body size of fish but different total biomass, we proved that when ignoring the complexity of the individual body size composition of fish populations in natural basins, the eDNA concentration increases with the increase of biomass. However, the environmental DNA concentration was influenced by the body size of the individuals. The smaller the body size of the individual fish, the greater the increase in eDNA concentration with increasing biomass. For the adult fish group, the growth rate of biomass is approximately equal to the corresponding growth rate of eDNA, while the juvenile fish group is slightly greater than the growth rate of eDNA. Therefore, when using the eDNA method to assess biomass changes in still waters, the influence of the body size composition of the biological population on the predictions cannot be ignored. If the proportion of fish with small body size in the population is larger, the rate of change in population biomass will be higher than the rate of change in eDNA concentration.
Experimental treatments of the same fish biomass
According to the experimental design of Experiment III, the proportion of juvenile fish (small body size fish) reared in Treatment 3 to the total population was much higher than that in the other two treatments. The setup between the three treatments in Experiment IV was the same as in Experiment III. As can be seen from Figures 5, 6, both for Experiment III and IV, the eDNA concentration and the eDNA concentration per unit biomass (1 g/m3) were significantly higher in Treatment 3 than in Treatments 1 and 2. It implies that under the same biomass conditions, the treatment with a larger proportion of juvenile fish to the total population, the higher the corresponding eDNA concentration. The patterns obtained from these two experiments were consistent, so the effect of accidental factors could be excluded.
The above two experiments compared the effect of different fish body size composition on eDNA concentration under the same total biomass condition. The experimental group with a higher proportion of small body size individuals proved to have greater eDNA concentrations than the experimental group with a higher proportion of large body size individuals. The reason may be that the metabolic rate and activity of small body size fish are significantly higher than those of large body size fish, resulting in a higher eDNA release rate and higher eDNA concentration in the same condition of biomass. Therefore, in actual natural river surveys, when assessing biomass by the eDNA method, it is advisable to investigate the population structure characteristics of the target fish in advance, and when the population is dominated by juveniles, quantitative eDNA concentration data should be carefully interpreted to avoid underestimation of biomass.
Conclusion
In this paper, we took Schizothorax prenanti as the target species. Firstly, the influence of water pH and water temperature on environmental DNA concentration was determined by pre-experiments. Under the premise of consistent experimental environmental conditions, we investigated the correlation between eDNA concentration and biomass under different conditions of body size and body size composition. The main results and conclusions are as follows.
(1). Water pH and water temperature significantly affect the concentration of environmental DNA in fish in aquatic environments, mainly by altering the activity of microorganisms and enzymes that affect the degradation rate of environmental DNA. Therefore, when using environmental DNA methods to predict the biomass of aquatic species, the effects of environmental factors need to be considered simultaneously. For example, changes in water temperature in different seasons or differences in water pH in different watersheds may lead to different prediction results.
(2). Under the same environmental conditions, there is a positive correlation between biomass and eDNA concentration when the body size of individual Schizothorax prenanti is uniform. The smaller the individual body size, the greater the increase of eDNA concentration with biomass. For the juvenile environmental group, the increase of eDNA concentration with biomass was about 1.4 times higher than that for the adult environmental group.
(3). The growth rate of biomass and the corresponding growth rate of eDNA concentration was approximately equal for the adult fish group. For each 1% increase in biomass, the corresponding growth rate of eDNA concentration for the juvenile fish group is 0.4% higher than that in the adult fish group. Therefore, when using the eDNA method to assess biomass changes in still water, the influence of the fish body size on the predicted results cannot be ignored. If the proportion of juvenile fish in the population is larger, the rate of change in population biomass will be higher than the rate of change in eDNA concentration.
(4). When the total biomass of Schizothorax prenanti was the same but with different body size compositions, the higher the proportion of small-sized individuals in the overall population, the greater the environmental DNA concentration. Therefore, the structural characteristics of the population should not be ignored when assessing biomass by environmental DNA methods.
In summary, when using environmental DNA methods to estimate the biomass of aquatic species in reservoirs, lakes, and other still water in actual river sections, the effects of factors such as water pH, water temperature, organism body size, and body size composition on eDNA concentration should be taken into account. If the proportion of small body size individuals in the population is high, it is important to avoid biomass assessment lower than the actual value. A model for estimating biomass through eDNA concentration should be established under the premise of combining environmental conditions and population characteristics, so that biomass estimation can be more accurate.
Data availability statement
The original contributions presented in this study are included in the article/supplementary material, further inquiries can be directed to the corresponding author/s.
Ethics statement
The animal study was reviewed and approved by Ethics Committee, College of Life Sciences, Sichuan University.
Author contributions
JZ and YW conceived and designed the experiments. RD and JW performed the experiments. JZ, YW, RD, and JW designed the methodology and conducted data analyses. RD and JW led the writing of the manuscript. All authors contributed to data interpretation, structuring of the manuscript, reviewed and edited the manuscript, and approved the final version for submission.
Funding
This research was supported by the National Natural Science Foundation of China (No. 52079082) and the Open Research Fund of State Key Laboratory of Simulation and Regulation of Water Cycle in River Basin, China Institute of Water Resources and Hydropower Research (No. IWHR-SKL-KF202107).
Conflict of interest
The authors declare that the research was conducted in the absence of any commercial or financial relationships that could be construed as a potential conflict of interest.
Publisher’s note
All claims expressed in this article are solely those of the authors and do not necessarily represent those of their affiliated organizations, or those of the publisher, the editors and the reviewers. Any product that may be evaluated in this article, or claim that may be made by its manufacturer, is not guaranteed or endorsed by the publisher.
References
Afzali, S. F., Bourdages, H., Laporte, M., Mérot, C., Normandeau, E., Audet, C., et al. (2020). Comparing environmental metabarcoding and trawling survey of demersal fish communities in the Gulf of St. Lawrence, Canada. Environ. DNA 3, 22–42. doi: 10.1002/edn3.111
Andruszkiewicz, E. A., Sassoubre, L. M., and Boehm, A. B. (2017). Persistence of marine fish environmental DNA and the influence of sunlight. PLoS One 12:e0185043. doi: 10.1371/journal.pone.0185043
Barnes, M. A., and Turner, C. R. (2015). The ecology of environmental DNA and implications for conservation genetics. Conservat. Genetics 17, 1–17. doi: 10.1007/s10592-015-0775-4
Barnes, M. A., Turner, C. R., Jerde, C. L., Renshaw, M. A., Chadderton, W. L., and Lodge, D. M. (2014). Environmental conditions influence eDNA persistence in aquatic systems. Environ. Sci. Technol. 48, 1819–1827. doi: 10.1021/es404734p
Bohmann, K., Evans, A., Gilbert, M. T. P., Carvalho, G. R., Creer, S., Knapp, M., et al. (2014). Erratum: environmental DNA for wildlife biology and biodiversity monitoring. Trends Ecol. Evol. 29, 358–367. doi: 10.1016/j.tree.2014.05.012
Bylemans, J., Furlan, E. M., Gleeson, D. M., Hardy, C. M., and Duncan, R. P. (2018). Does Size Matter? An experimental evaluation of the relative abundance and decay rates of aquatic environmental DNA. Environ. Sci. Technol. 52, 6408–6416. doi: 10.1021/acs.est.8b01071
Civade, R., Dejean, T., Valentini, A., Roset, N., Raymond, J. C., Bonin, A., et al. (2016). Spatial representativeness of environmental DNA metabarcoding signal for fish biodiversity assessment in a natural freshwater system. PLoS One 11:e0157366. doi: 10.1371/journal.pone.0157366
Deiner, K., Bik, H. M., Machler, E., Seymour, M., Lacoursiere-Roussel, A., Altermatt, F., et al. (2017). Environmental DNA metabarcoding: transforming how we survey animal and plant communities. Mol. Ecol. 26, 5872–5895. doi: 10.1111/mec.14350
Dejean, T., Valentini, A., Duparc, A., Pellier-Cuit, S., Pompanon, F., Taberlet, P., et al. (2011). Persistence of environmental DNA in freshwater ecosystems. PLoS One. 6:e23398. doi: 10.1371/journal.pone.0023398
Dejean, T., Valentini, A., Miquel, C., Taberlet, P., Bellemain, E., and Miaud, C. (2012). Improved detection of an alien invasive species through environmental DNA barcoding: the example of the American bullfrog Lithobates catesbeianus. J. Appl. Ecol. 49, 953–959. doi: 10.1111/j.1365-2664.2012.02171.x
Doi, H., Katano, I., Sakata, Y., Souma, R., Kosuge, T., Nagano, M., et al. (2017). Detection of an endangered aquatic heteropteran using environmental DNA in a wetland ecosystem. R. Soc. Open Sci. 4:170568. doi: 10.1098/rsos.170568
Eichmiller, J. J., Bajer, P. G., and Sorensen, P. W. (2014). The relationship between the distribution of common carp and their environmental DNA in a small lake. PLoS One 9:e112611. doi: 10.1371/journal.pone.0112611
Ficetola, G. F., Miaud, C., Pompanon, F., and Taberlet, P. (2008). Species detection using environmental DNA from water samples. Biol. Lett. 4, 423–425. doi: 10.1098/rsbl.2008.0118
Fukumoto, S., Ushimaru, A., Minamoto, T., and Crispo, E. (2015). A basin-scale application of environmental DNA assessment for rare endemic species and closely related exotic species in rivers: a case study of giant salamanders in Japan. J. Appl. Ecol. 52, 358–365. doi: 10.1111/1365-2664.12392
Goldberg, C. S., Pilliod, D. S., Arkle, R. S., and Waits, L. P. (2011). Molecular detection of vertebrates in stream water: a demonstration using Rocky Mountain tailed frogs and Idaho giant salamanders. PLoS One 6:e22746. doi: 10.1371/journal.pone.0022746
Goldberg, C. S., Sepulveda, A., Ray, A., Baumgardt, J., and Waits, L. P. (2013). Environmental DNA as a new method for early detection of New Zealand mudsnails (Potamopyrgus antipodarum). Freshw. Sci. 32, 792–800. doi: 10.1899/13-046.1
Govindarajan, A. F., Francolini, R. D., Jech, J. M., Lavery, A. C., Llopiz, J. K., Wiebe, P. H., et al. (2021). Exploring the use of environmental DNA (eDNA) to detect animal taxa in the mesopelagic zone. Front. Ecol. Evol. 9:574877. doi: 10.3389/fevo.2021.574877
Itakura, H., Wakiya, R., Yamamoto, S., Kaifu, K., Sato, T., and Minamoto, T. (2019). Environmental DNA analysis reveals the spatial distribution, abundance, and biomass of Japanese eels at the river-basin scale. Aquat. Conserv. Ecosyst. 29, 361–373. doi: 10.1002/aqc.3058
Jane, S. F., Wilcox, T. M., McKelvey, K. S., Young, M. K., Schwartz, M. K., Lowe, W. H., et al. (2015). Distance, flow and PCR inhibition: eDNA dynamics in two headwater streams. Mol. Ecol. Resour. 15, 216–227. doi: 10.1111/1755-0998.12285
Jerde, C. L., Olds, B. P., Shogren, A. J., Andruszkiewicz, E. A., Mahon, A. R., Bolster, D., et al. (2016). Influence of stream bottom substrate on retention and transport of vertebrate environmental DNA. Environ. Sci. Technol. 50, 8770–8779. doi: 10.1021/acs.est.6b01761
Jo, T., Murakami, H., Masuda, R., Sakata, M. K., Yamamoto, S., and Minamoto, T. (2017). Rapid degradation of longer DNA fragments enables the improved estimation of distribution and biomass using environmental DNA. Mol. Ecol. Resour. 17, e25–e33. doi: 10.1111/1755-0998.12685
Jo, T., Murakami, H., Yamamoto, S., Masuda, R., and Minamoto, T. (2019). Effect of water temperature and fish biomass on environmental DNA shedding, degradation, and size distribution. Ecol. Evol. 9, 1135–1146. doi: 10.1002/ece3.4802
Kirtane, A., Wieczorek, D., Noji, T., Baskin, L., Ober, C., Plosica, R., et al. (2021). Quantification of Environmental DNA (eDNA) shedding and decay rates for three commercially harvested fish species and comparison between eDNA detection and trawl catches. Environ. DNA 3, 1142–1155. doi: 10.1002/edn3.236
Krol, L., Van der Hoorn, B., Gorsich, E. E., Trimbos, K., Bodegom, P. M. V., and Schrama, M. (2019). How Does eDNA compare to traditional trapping? Detecting mosquito communities in south-african freshwater ponds. Front. Ecol. Evol. 7:260. doi: 10.3389/fevo.2019.00260
Lacoursiere-Roussel, A., Rosabal, M., and Bernatchez, L. (2016). Estimating fish abundance and biomass from eDNA concentrations: variability among capture methods and environmental conditions. Mol. Ecol. Resour. 16, 1401–1414. doi: 10.1111/1755-0998.12522
Longhi, S., Cristofori, A., Gatto, P., Cristofolini, F., Grando, M. S., and Gottardini, E. (2009). Biomolecular identification of allergenic pollen: a new perspective for aerobiological monitoring? Ann. Allergy Asthma Immunol. 103, 508–514. doi: 10.1016/s1081-1206(10)60268-2
Mahon, A. R., Jerde, C. L., Galaska, M., Bergner, J. L., Chadderton, W. L., Lodge, D. M., et al. (2013). Validation of eDNA surveillance sensitivity for detection of Asian carps in controlled and field experiments. PLoS One 8:e58316. doi: 10.1371/journal.pone.0058316
Martellini, A., Payment, P., and Villemur, R. (2005). Use of eukaryotic mitochondrial DNA to differentiate human, bovine, porcine and ovine sources in fecally contaminated surface water. Water Res. 39, 541–548. doi: 10.1016/j.watres.2004.11.012
Maruyama, A., Nakamura, K., Yamanaka, H., Kondoh, M., and Minamoto, T. (2014). The release rate of environmental DNA from juvenile and adult fish. PLoS One 9:e114639. doi: 10.1371/journal.pone.0114639
Mathieu, C., Hermans, S. M., Lear, G., Buckley, T. R., Lee, K. C., and Buckley, H. L. (2020). A systematic review of sources of variability and uncertainty in eDNA data for environmental monitoring. Front. Ecol. Evol. 8:135. doi: 10.3389/fevo.2020.00135
McElroy, M. E., Dressler, T. L., Titcomb, G. C., Wilson, E. A., Deiner, K., Dudley, T. L., et al. (2020). Calibrating environmental DNA metabarcoding to conventional surveys for measuring fish species richness. Front. Ecol. Evol. 8:276. doi: 10.3389/fevo.2020.00276
Merkes, C. M., McCalla, S. G., Jensen, N. R., Gaikowski, M. P., and Amberg, J. J. (2014). Persistence of DNA in carcasses, slime and avian feces may affect interpretation of environmental DNA data. PLoS One 9:e113346. doi: 10.1371/journal.pone.0113346
Minamoto, T., Yamanaka, H., Takahara, T., Honjo, M. N., and Kawabata, Z. I (2011). Surveillance of fish species composition using environmental DNA. Limnology 13, 193–197. doi: 10.1007/s10201-011-0362-4
Mizumoto, H., Mitsuzuka, T., and Araki, H. (2020). An environmental DNA survey on distribution of an endangered salmonid species, Parahucho perryi, in Hokkaido, Japan. Front. Ecol. Evol. 8:569425. doi: 10.3389/fevo.2020.569425
Muha, T. P., Rodríguez-Rey, M., Rolla, M., and Tricarico, E. (2017). Using environmental DNA to improve species distribution models for freshwater invaders. Front. Ecol. Evol. 5:158. doi: 10.3389/fevo.2017.00158
Pfleger, M. O., Rider, S. J., Johnston, C. E., and Janosik, A. M. (2016). Saving the doomed: using eDNA to aid in detection of rare sturgeon for conservation (Acipenseridae). Glob. Ecol. Conserv. 8, 99–107. doi: 10.1016/j.gecco.2016.08.008
Pilliod, D. S., Goldberg, C. S., Arkle, R. S., and Waits, L. P. (2013). Estimating occupancy and abundance of stream amphibians using environmental DNA from filtered water samples. Can. J. Fish. Aquat. Sci. 70, 1123–1130. doi: 10.1139/cjfas-2013-0047
Pilliod, D. S., Goldberg, C. S., Arkle, R. S., and Waits, L. P. (2014). Factors influencing detection of eDNA from a stream-dwelling amphibian. Mol. Ecol. Resour. 14, 109–116. doi: 10.1111/1755-0998.12159
Pont, D., Rocle, M., Valentini, A., Civade, R., Jean, P., Maire, A., et al. (2018). Environmental DNA reveals quantitative patterns of fish biodiversity in large rivers despite its downstream transportation. Sci. Rep. 8:10361. doi: 10.1038/s41598-018-28424-8
Sakata, M. K., Maki, N., Sugiyama, H., and Minamoto, T. (2017). Identifying a breeding habitat of a critically endangered fish, Acheilognathus typus, in a natural river in Japan. Naturwissenschaften 104:100. doi: 10.1007/s00114-017-1521-1
Sassoubre, L. M., Yamahara, K. M., Gardner, L. D., Block, B. A., and Boehm, A. B. (2016). Quantification of environmental DNA (eDNA) shedding and decay rates for three marine fish. Environ. Sci. Technol. 50, 10456–10464. doi: 10.1021/acs.est.6b03114
Shogren, A. J., Tank, J. L., Andruszkiewicz, E. A., Olds, B., Jerde, C., and Bolster, D. (2016). Modelling the transport of environmental DNA through a porous substrate using continuous flow-through column experiments. J. R. Soc. Interface 13:20160290. doi: 10.1098/rsif.2016.0290
Shogren, A. J., Tank, J. L., Egan, S. P., Bolster, D., and Riis, T. (2019). Riverine distribution of mussel environmental DNA reflects a balance among density, transport, and removal processes. Freshw. Biol. 64, 1467–1479. doi: 10.1111/fwb.13319
Sigsgaard, E. E., Carl, H., Møller, P. R., and Thomsen, P. F. (2015). Monitoring the near-extinct European weather loach in Denmark based on environmental DNA from water samples. Biol. Conserv. 183, 46–52. doi: 10.1016/j.biocon.2014.11.023
Spear, M. J., Embke, H. S., Krysan, P. J., and Vander Zanden, M. J. (2020). Application of eDNA as a tool for assessing fish population abundance. Environ. DNA 3, 83–91. doi: 10.1002/edn3.94
Strickler, K. M., Fremier, A. K., and Goldberg, C. S. (2015). Quantifying effects of UV-B, temperature, and pH on eDNA degradation in aquatic microcosms. Biol. Conserv. 183, 85–92. doi: 10.1016/j.biocon.2014.11.038
Suarez-Menendez, M., Planes, S., Garcia-Vazquez, E., and Ardura, A. (2020). Early alert of biological risk in a coastal lagoon through eDNA metabarcoding. Front. Ecol. Evol. 8:9. doi: 10.3389/fevo.2020.00009
Taberlet, P., Coissac, E., Pompanon, F., Brochmann, C., and Willerslev, E. (2012). Towards next-generation biodiversity assessment using DNA metabarcoding. Mol. Ecol. 21, 2045–2050. doi: 10.1111/j.1365-294X.2012.05470.x
Takahara, T., Minamoto, T., Yamanaka, H., Doi, H., and Kawabata, Z. (2012). Estimation of fish biomass using environmental DNA. PLoS One 7:e35868. doi: 10.1371/journal.pone.0035868
Thalinger, B., Rieder, A., Teuffenbach, A., Pütz, Y., Schwerte, T., Wanzenböck, J., et al. (2021). The effect of activity, energy use, and species identity on environmental DNA shedding of freshwater fish. Front. Ecol. Evol. 9:623718. doi: 10.3389/fevo.2021.623718
Thomsen, P. F., Kielgast, J., Iversen, L. L., Wiuf, C., Rasmussen, M., Gilbert, M. T., et al. (2012). Monitoring endangered freshwater biodiversity using environmental DNA. Mol. Ecol. 21, 2565–2573. doi: 10.1111/j.1365-294X.2011.05418.x
Tillotson, M. D., Kelly, R. P., Duda, J. J., Hoy, M., Kralj, J., and Quinn, T. P. (2018). Concentrations of environmental DNA (eDNA) reflect spawning salmon abundance at fine spatial and temporal scales. Biol. Conserv. 220, 1–11. doi: 10.1016/j.biocon.2018.01.030
Tsuji, S., Takahara, T., Doi, H., Shibata, N., and Yamanaka, H. (2019). The detection of aquatic macroorganisms using environmental DNA analysis—A review of methods for collection, extraction, and detection. Environ. DNA 1, 99–108. doi: 10.1002/edn3.21
Tsuji, S., Yamanaka, H., and Minamoto, T. (2016). Effects of water pH and proteinase K treatment on the yield of environmental DNA from water samples. Limnology 18, 1–7. doi: 10.1007/s10201-016-0483-x
Ushio, M., Murakami, H., Masuda, R., Sado, T., Miya, M., Sakurai, S., et al. (2017). Quantitative Monitoring of Multispecies Fish Environmental DNA using High-Throughput Sequencing. Cold Spring Harbor, NY: Cold Spring Harbor Laboratory, doi: 10.1101/113472
Willerslev, E., Hansen, A. J., Binladen, J., Brand, T. B., Gilbert, M. T., Shapiro, B., et al. (2003). Diverse plant and animal genetic records from Holocene and Pleistocene sediments. Science 300, 791–795. doi: 10.1126/science.1084114
Keywords: eDNA, biomass, body size, water pH, water temperature
Citation: Zhang J, Ding R, Wang Y and Wen J (2022) Experimental study on the response relationship between environmental DNA concentration and biomass of Schizothorax prenanti in still water. Front. Ecol. Evol. 10:972680. doi: 10.3389/fevo.2022.972680
Received: 18 June 2022; Accepted: 12 July 2022;
Published: 29 July 2022.
Edited by:
Chunhui Li, Beijing Normal University, ChinaReviewed by:
Wei Huang, China Institute of Water Resources and Hydropower Research, ChinaYusong Li, University of Nebraska-Lincoln, United States
Zhe Li, Chinese Academy of Sciences (CAS), China
Copyright © 2022 Zhang, Ding, Wang and Wen. This is an open-access article distributed under the terms of the Creative Commons Attribution License (CC BY). The use, distribution or reproduction in other forums is permitted, provided the original author(s) and the copyright owner(s) are credited and that the original publication in this journal is cited, in accordance with accepted academic practice. No use, distribution or reproduction is permitted which does not comply with these terms.
*Correspondence: Yurong Wang, wangyurong@scu.edu.cn