Spatial–temporal distribution measurement of input–output efficiency of the water–energy–food nexus of the Yangtze River Economic Belt, China
 Yikun Ni
 Yan Chen
- 1College of Economics and Management, Nanjing Forestry University, Nanjing, China
- 2Academy of Chinese Ecological Progress and Forestry Development Studies, Nanjing Forestry University, Nanjing, China
Water, energy, and food are important factors affecting people’s lives and socio-economic development, and their production and consumption processes are closely related, so it is necessary to do research on input–output efficiency as a whole. The research is conducive to promoting the effective utilization and rational allocation of relevant resources in the Yangtze River Economic Belt, thereby promoting sustainable development. This study calculates the input–output efficiency of the water–energy–food (WEF) nexus of 11 provincial administrative regions in the Yangtze River Economic Belt utilizing the DEA-BCC model. Then, new indicators called area expansion degree and the subsystem’s influence degree are proposed with the aid of the standard deviation ellipse model to analyze the characteristics and trends of spatial–temporal distribution of input–output efficiency. The standard deviation ellipse model starts from the basic spatial elements, including point, line, and surface, and is used to study the spatial distribution and trend change of efficiency according to the center of gravity and area. The shift of the center of gravity shows the direction of significant improvement in the effect of resource allocation, and the change of area shows the differences in the speed of efficiency improvement between regions and the future development trend. The results mainly indicate that the resource allocation in the middle and lower reaches of the Yangtze River Economic Belt is more reasonable than that in the upper reaches, and the efficiency distribution is obviously concentrated in the northeast direction. It is suggested that the provincial administrative regions in the upper reaches should optimize the industrial structure, the regions in the middle and lower reaches should improve the resource structure, and the flow of talents and technology of regions should be promoted.
Introduction
Water resources, energy, and food are important factors affecting people’s life and socioeconomic development. There are mutual influence and interdependence among the three. In 2011, the WEF (water–energy–food) nexus concept was summarized for the first time at the 2011 Nexus Conference, held in Bonn, Germany (Hoff, 2011; Endo et al., 2017). At this point, the research on the WEF nexus has entered a new stage. The Yangtze River Economic Belt covers 11 provincial administrative regions. The total area accounts for about 20% of China, and the GDP accounts for more than 45% of China. However, the ecological problems, including the degradation of the ecological function of the river basin, are still serious. Moreover, the contradiction between resources is becoming more and more severe due to the expanding population and the rapid development of industrialization (Liu et al., 2022), and the shortage of resources causes the bottleneck of regional sustainable development (The Central People’s Government of the People’s Republic of China, 2020). After the Bonn conference, the relevant strategies of a single resource have proved difficult to solve the existing problems and even to lead to serious consequences. Therefore, it is necessary to take WEF nexus as an object of research to study the input–output efficiency (White et al., 2018). The calculation of the input–output efficiency of the WEF nexus can analyze the overall impact of water resources, energy, and food consumption on the environment and economy from multiple perspectives. Under the condition of limited resources, improving the input–output efficiency of the WEF nexus of the Yangtze River Economic Belt plays an essential role in promoting regional sustainable development.
Currently, the research on the WEF nexus is emerging at home and abroad, and the scope and depth of research are increasing. More and more theoretical frameworks have been put forward, including the symbiosis framework of the WEF nexus based on symbiosis theory (Zhi et al., 2020; Chen and Chen, 2021), the comprehensive evaluation framework based on life cycle theory (LCA) (Lin et al., 2021), the coupled modeling approach based on agent (Magliocca, 2020), etc. In terms of spatial scale, the research mainly involves international (Belinskij, 2015), inter-provincial (Wang et al., 2021), county-level (Kulat et al., 2019), etc. As far as the research content is concerned, it mainly focuses on collaborative security, scenario simulation, efficiency evaluation, etc. In terms of collaborative security (Chen and Xu, 2021; Li et al., 2021), combined with the pressure-state-response (PSR) model and environment-economy-society (EES) collaborative model, the collaborative security evaluation system is constructed and the evaluation indexes are assigned with the use of the entropy weight method and critical method. Then the regional collaborative security index and grade division standard are calculated and evaluated by using fuzzy comprehensive evaluation method and random forest model. Regarding scenario simulation (Ravar et al., 2020; Susnik et al., 2021; Wen et al., 2022), through the construction of a complex relational network dominated by WEF and supplemented by social, economic, and eco-environment subsystems, the simulation research on different scenarios and policies is carried out with the use of system dynamics (SD) model. Efficiency evaluation is mainly about the coupling efficiency of the system and the production and utilization efficiency of resources. In terms of coupling efficiency (Sun et al., 2021), by optimizing and improving the data envelopment analysis (DEA) model and calculating the input–output efficiency of the three subsystems, respectively, the coupling efficiency of the WEF nexus is obtained. In terms of the production and utilization efficiency of resources (Zhang and Xu, 2019; Zheng et al., 2022), combined with the direct and indirect input between resources, the consumption of water resources, energy, and food or any two of them are, respectively, used as input variables and output variables to construct an efficiency index system and evaluate it.
The research methods involved in the efficiency evaluation of WEF nexus mainly focus on input–output analysis, spatial econometric models, and exploratory spatial data analysis (ESDA). The input–output model is a mathematical model of the economy that is often used to analyze the quantitative dependence between inputs and outputs in economic activities (Wiedmann, 2009). Zheng et al. (2019) used the model to comprehensively assess agricultural production efficiency and quantified the optimal inputs of agricultural resources. Maia and Pereira (2021) quantitatively evaluated WEF nexus in Brazil’s food and beverage industry using a multiregional input–output table, DEA, and the Malmquist index. Spatial econometric models are often used to analyze interactions between regions (Yuan et al., 2022). Qin and Tong (2021) measured the WEF coupling efficiency and analyzed its spatial and temporal changes and driving factors with kernel density estimation and spatial econometric models. ESDA is often used to reveal spatially variable relationships between study subjects (Tu, 2011). By analyzing the spatial correlation of the coupling coordination degree of the WEF nexus, Zhao and Liu (2022) concluded that the spatial self-correlation of the coupling coordination degree of the prefecture-level cities in the Yellow River Basin was weakened in 2015. Sun et al. (2021) measured the global Moran’s I index value of coupling efficiency and found a positive correlation between efficiency and spatial distribution of provinces and cities in China.
The research on the efficiency evaluation of the Yangtze River Economic Belt mainly focuses on ecological efficiency, green innovation efficiency, resource utilization efficiency, etc. In terms of ecological efficiency (Xu et al., 2021), an optimal weighted cross-evaluation efficiency (OWCE) model based on data standardization is proposed to analyze the causes of differences in ecological efficiency in different regions. Regarding green innovation efficiency (Xu et al., 2020; Hou et al., 2021), research further elaborates the coordination relationship between green innovation and high-tech and environmental protection. Regarding resource utilization efficiency, research mainly focuses on the utilization efficiency of water resources (Ding et al., 2019; Xu and Liang, 2020) and energy (Chen, 2020; Yu and Ling, 2020) and uses the Tobit model to identify key influencing factors.
It is found that the existing research on the WEF nexus has achieved rich results, and the relevant theoretical framework and model are relatively mature. The research on the utilization of resources of the Yangtze River Economic Belt also has gradually transferred from qualitative to quantitative. There are mainly two aspects to be further studied in relevant fields: (1) The research method for the spatial distribution and trend of WEF nexus efficiency is relatively simple, and the research from the point, line, and surface of basic spatial elements is lacking. (2) The research on the input–output efficiency of the WEF nexus of the Yangtze River Economic Belt needs to be enriched.
On the one hand, the distribution of water resources, energy, and food in the Yangtze River Economic Belt is uneven. On the other hand, there are great differences in the level of economic and social development among regions. Therefore, this study takes the WEF nexus of the Yangtze River Economic Belt as the research object and calculates and analyzes the input–output efficiency of the WEF nexus of 11 provincial administrative regions in the Yangtze River Economic Belt using the DEA-BCC model. Then, the study analyzes the transfer of the center of gravity of efficiency with the standard deviational ellipse model from the perspective of basic spatial elements including point, line, and surface. At the same time, from the time and space dimensions with two new indicators, the study evaluates and analyzes the change characteristics and trend of input–output efficiency of the WEF nexus of the Yangtze River Economic Belt and the influence degree of subsystems on the transfer of the center of gravity of nexus from 2011 to 2019. The innovation of this study mainly lies in (1) This study combines the standard deviation ellipse model to judge the development and change trend of resource allocation efficiency with the help of center of gravity migration and area change trend from the perspective of basic spatial elements. (2) Two new indicators called area expansion degree and subsystem’s influence degree are proposed, which further enrich the research content from the spatial perspective and provide new ideas for the related research of efficiency evaluation. The study aims to make up for the deficiencies in the spatial distribution analysis of the WEF nexus and the input–output efficiency of resources of the Yangtze River Economic Belt and provide policy suggestions that can effectively improve the input–output efficiency of the WEF nexus of the Yangtze River Economic Belt, to promote the sustainable development of the region.
Materials and methods
Study area
The Yangtze River Economic Belt covers 11 provincial administrative regions (nine provinces and two directly administered municipalities), including Shanghai, Jiangsu, Zhejiang, and Anhui in the upper reaches of the Yangtze River, Jiangxi, Hubei, and Hunan in the middle reaches of the Yangtze River, and Chongqing, Sichuan, Guizhou, and Yunnan in the lower reaches of the Yangtze River (Figure 1). Since the review and adoption of the Outline of Yangtze River Economic Belt Development Plan in 2016, the regional economy has maintained steady growth, and people’s living standards have significantly improved. However, in recent years, the problems of ecological environment, industrial structure optimization, and regional development balance (Yuan et al., 2022) have become increasingly serious. In terms of water resources, compared with other regions in China, that of the Yangtze River Economic Belt is much richer, and the per capita water occupancy volume is about 2144 m3 (Kong et al., 2021). While, issues of uneven distribution of water resources, increasingly serious water pollution, and low water efficiency have become acute. In terms of energy, the Yangtze River economy is rich in mineral and hydropower resources. Regarding food, the Yangtze River Economic Belt has superior agricultural natural conditions and fertile soil. It carries over 30% of the total grain output with one-fifth of the land area (Qin and Tong, 2021). With the continuous advancement of urbanization, the pressure on water resources, energy, and food is increasing. The Yangtze River Economic Belt connects the eastern, middle, and western areas of China. Since the reform and opening up, with its unique geographical advantages, the Yangtze River Economic Belt has become one of the regions with a great strategic role in China (The Central People’s Government of the People’s Republic of China, 2014). Analyzing the input–output efficiency of the WEF nexus of the Yangtze River Economic Belt is of great significance in improving the efficiency of regional resource utilization and promoting regional sustainable development.
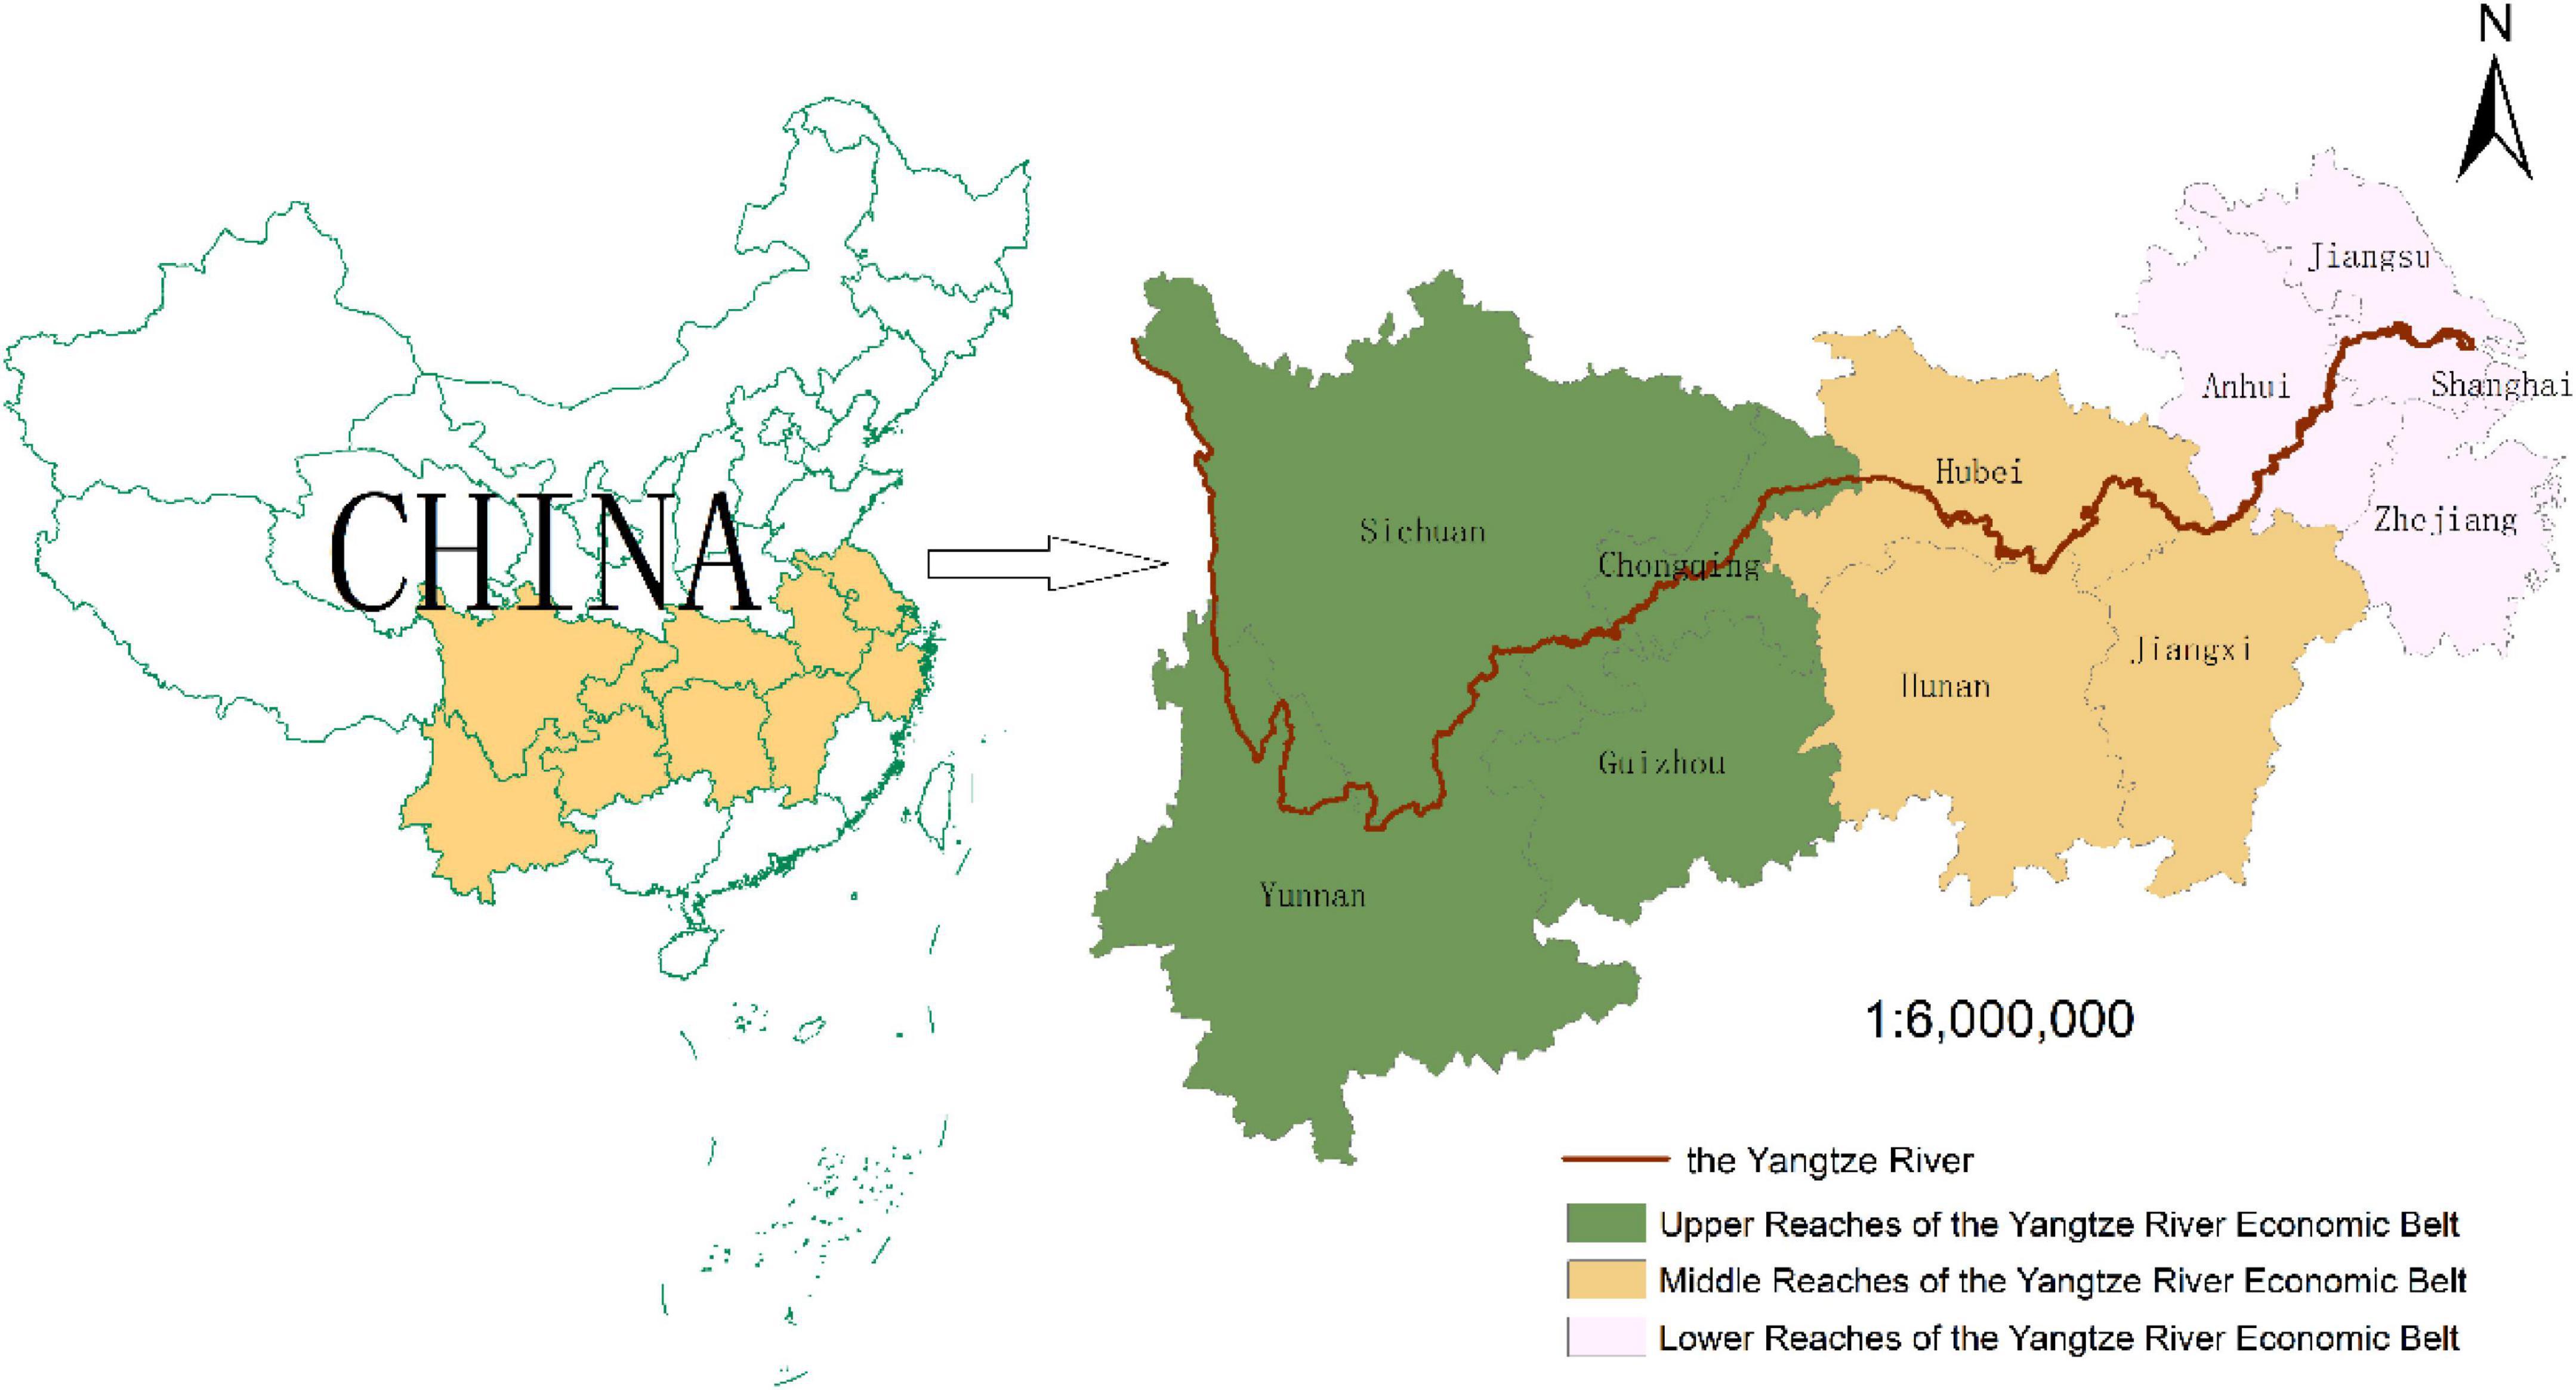
Figure 1. Study area.
Data envelopment analysis-BCC model
Data envelopment analysis was first proposed by American operational researchers A. Charnes and W. W. Cooper (Charnes et al., 1978). It is a non-parametric method that can evaluate efficiency. The basic principle of the DEA method is to control the input or output of the decision-making unit (DMU) unchanged, construct the effective frontier utilizing the linear programming method, and determine the relative effectiveness by observing the distance between the projection of DMU and the frontier (Ma et al., 2021). Compared with linear programming and other methods that can only deal with a single output, the DEA method can deal with multi-output situations. Meanwhile, the method has significant advantages in calculating input–output efficiency because it does not need dimensional data or the assignment of indexes.
The DEA model is mainly divided into the CCR and BCC models according to the two assumptions of constant and variable return to scale. Both models are input propensity. The CCR model assumes that input and output need to change in a uniform proportion. For complex reality, the condition of constant return to scale is too limited. The BCC model is expanded based on the CCR model. The assumption condition is reset to variable return to scale, making the model more in line with the actual situation. The WEF nexus is more suitable for the DEA-BCC model as a variable scale return system. Therefore, this study adopts this model, takes the WEF nexus of the Yangtze River Economic Belt as the research object, sets 11 provincial administrative regions as DMUj (j = 1, 2,…, 11), and calculates the input–output efficiency of the WEF nexus of each provincial administrative region from 2011 to 2019. The DEA-BCC model follows formula (1) (Li et al., 2016).
where θ is the effective value of each provincial administrative region, and the input-inclined model seeks to minimize the input when the output is constant (Li et al., 2016), so the objective function is the minimum value of θ, xj (j = 1, 2…, n) represents the input amount of a certain factor in the jth region, λj is the weight coefficient, s− is the output slack variable, s+ is the input slack variable.
Standard deviational ellipse model
The standard deviational ellipse model is used to analyze the spatial distribution characteristics of the input–output efficiency of the WEF nexus of the Yangtze River Economic Belt. By describing the deviational of point distribution, it can effectively display the spatial dispersion of point sets (Wong and Jay, 2008). In this model, the center of gravity, major and minor axes, are taken as the basic elements to define and describe the spatial characteristics of the research object. The semi-major axis is used to represent the direction of data distribution, and the semi-minor axis represents the range of data distribution. The economic meaning of the model is that it can judge the development and change trend of resource allocation efficiency with the aid of the transfer of the center of gravity and area variation. Through the transfer track of the standard deviation ellipse center, that is, the center of gravity of efficiency, we can find out the direction in which the effect of resource allocation gets improvement significantly. The area of the ellipse and its changes show the difference in the growth rate of regional efficiency and future development trend. The increase in the area of the ellipse means that the provincial administrative regions outside the ellipse have a noticeable pulling effect on the input–output efficiency than the regions inside the ellipse, and the efficiency shows an expanding trend. On the contrary, it indicates a centralized trend. By calculating the spatial characteristics of the standard deviational ellipse, the transfer and change of the center of gravity of efficiency and distribution range are obtained, and the input–output efficiency distribution of the WEF nexus of the Yangtze River Economic Belt is quantitatively analyzed from the multiple perspectives. The basic elements of the standard deviational ellipse are calculated as follows formula (2), (3), and (4) (Wong and Jay, 2008).
where () is the coordinates of the center of gravity of efficiency, (xi, yi) is the spatial location of the study area; wi is the weight which represents the input–output efficiency of each provincial administrative region in the study; i is each decision-making unit which represents each provincial administrative region; x and y represent the relative coordinates of each point from the center of the input–output efficiency; tanθ can get the Angle of distribution pattern; σx and σy are standard deviations along the X-axis and Y-axis, respectively (Lefever, 1926). The above calculation can be implemented with the use of ArcGIS10.7 software.
Based on the standard deviation ellipse model, the spatial characteristics of the input–output efficiency of the nexus are further analyzed through two indicators: WEF nexus’s efficiency area expansion degree and the subsystem’s influence degree on the transfer of nexus’s center of gravity. The former index is applied to calculate the ratio of the change of the standard deviation ellipse area to the area of the previous year or the base year (2011) so as to analyze the differences in the input–output efficiency of provincial administrative regions inside and outside the ellipse. With the use of Stata software, the latter index is applied to calculate the Spearman correlation coefficient of the transfer distance of the center of gravity between the nexus and the water resources, energy, and food subsystems to analyze the impact of the subsystem on the center of gravity migration of the WEF nexus.
Construction of index system
In the traditional model, the analysis of resources and environment efficiency tends to ignore the expected output, which makes the generated results deviation. One of the ways to deal with unexpected output in academia is to treat the unexpected output as input and then use the traditional DEA method for efficiency evaluation, which can effectively follow the principle that the smaller the input value is, the better the output value is.
As shown in Table 1, in terms of input variables, the research focus of this study is to explore the impact of consumption of the WEF nexus on social and economic development, so the consumption of water resources, energy, and food are taken as input variables. Output variables are divided into expected output and unexpected output variables. Sustainable development emphasizes and shoots for minimizing the impact on the ecological environment while developing vigorously. From the perspective of economic development, we choose GDP that promotes regional sustainable development as the expected output variable. From the perspective of environmental impact, we select waste gas, waste water, and general industrial solid waste that do harm to sustainable development as unexpected output variables. As the main body of regional development, the total population always directly or indirectly affects the consumption of resources and the generation of economic and environmental benefits. Therefore, in this study, the input and output variables are divided by the population of each provincial administrative region each year to reduce the randomness caused by population variables as much as possible.
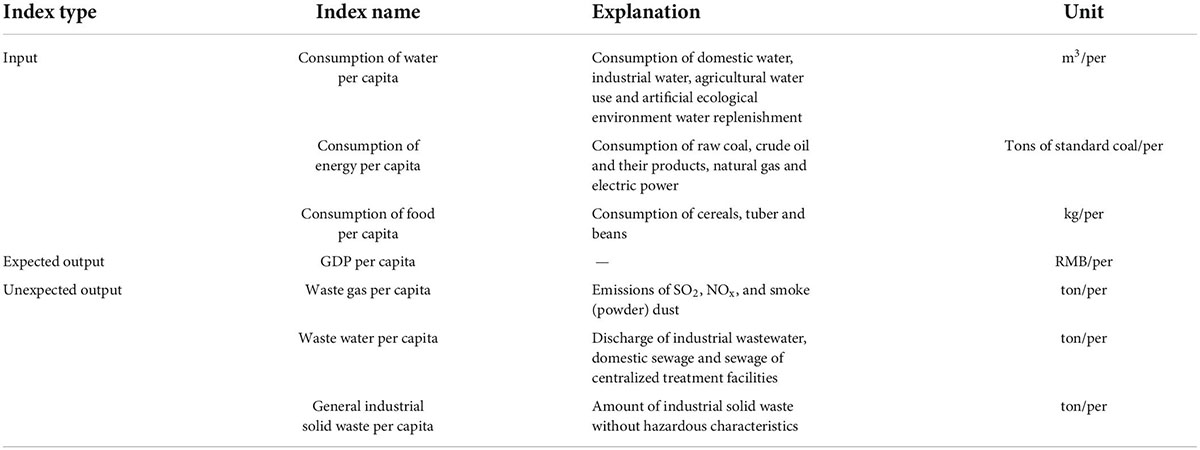
Table 1. Index system of input–output.
Data resource
The above data are mainly from Water Resources Bulletin, China Energy Statistical Yearbook, and China Statistical Yearbook from 2011 to 2019. For some missing data, the study refers to the statistical yearbook of each provincial administrative region and the interpolation method to complete. In order to eliminate the impact of inflation on the economy, the original data of GDP are processed to remove the impact of inflation and are converted into the 2011 constant price according to the price index.
Results and discussion
Using the DEA-BCC model and standard deviational ellipse model, the study concludes and analyzes the characteristics and changing trend of the temporal evolution and spatial distribution of input–output efficiency of the WEF nexus of the Yangtze River Economic Belt from 2011 to 2019.
Results of time evolution of input–output efficiency
Combined with formula (1), the input–output index is substituted into the DEA-BCC model, and DEAP2.1 software is used to calculate and evaluate the input–output efficiency of the WEF nexus of the Yangtze River Economic Belt. The results are shown in Table 2.
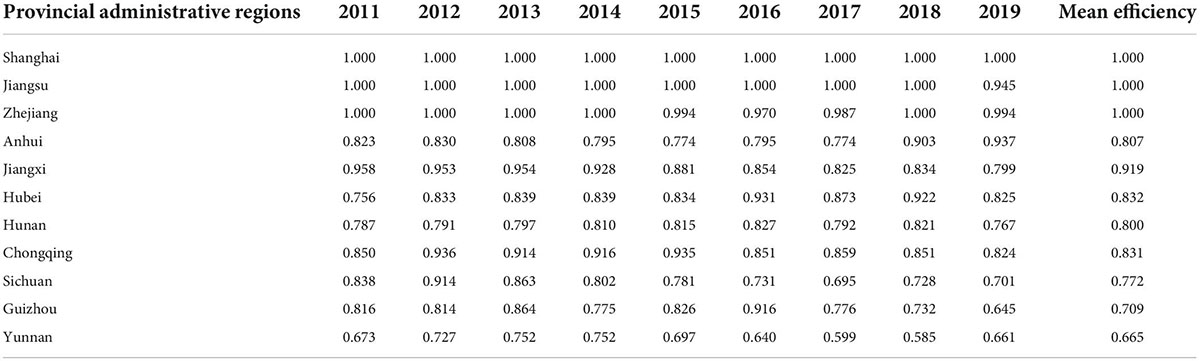
Table 2. Input–output efficiency of the WEF nexus of the Yangtze River Economic Belt.
It can be seen from Table 2 that Shanghai has always been in DEA valid state, Jiangsu and Zhejiang have basically reached the DEA valid state, and other provincial administrative regions have not reached DEA effective state. Averaging all the indexes, the mean efficiency of Jiangxi is between 0.9 and 1. The mean efficiency of Anhui, Hubei, Hunan, and Chongqing is between 0.8 and 0.9; the mean efficiency of Sichuan and Guizhou is between 0.7 and 0.8; the mean efficiency of Yunnan is less than 0.7.
Since the efficiency values generated by the DEA-BCC model are all relative efficiency values, it is not scientific to directly compare the efficiency of different years. Therefore, the input–output efficiency of the WEF nexus of all provincial administrative regions each year is ranked, and the 11 provincial administrative regions in the Yangtze River Economic Belt are classified according to the variation range of the ranking. The ranking changes in the input–output efficiency of the WEF nexus of each provincial administrative region over the past 9 years are analyzed, and the results are shown in Table 3.
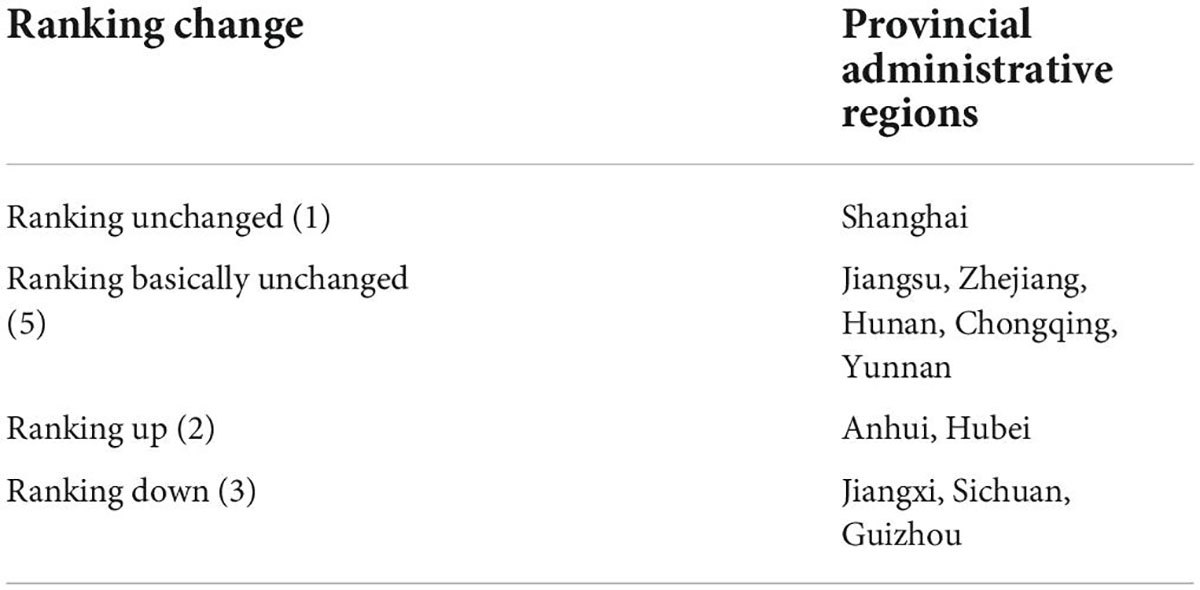
Table 3. Changes in the ranking of comprehensive efficiency of the Yangtze River Economic Belt from 2011 to 2019.
It can be seen from the Table 3, the number of provincial administrative regions whose ranking keeps unchanged is 1; the number of provincial administrative regions whose ranking keeps basically unchanged, which refers to the change of ranking in 2011 and 2019 within two places is 5; the number of provincial administrative regions whose ranking keeps rising is 2; the number of provincial administrative regions whose ranking keeps declining is 3.
The above results show that the utilization rate of relevant resources in Shanghai, Jiangsu, and Zhejiang has always maintained a high level which means that the resource allocation is relatively reasonable. The utilization rate of resources in Sichuan, Guizhou, and Yunnan is low, especially the resource allocation in Sichuan and Guizhou needs to be improved.
Results of spatial distribution of input–output efficiency
Using the standard deviational ellipse model, relevant data are put into formulas (2), (3), and (4). With the help of ArcGIS10.7 software, the spatial distribution characteristics of the input–output efficiency of the WEF nexus and each subsystem of the Yangtze River Economic Belt are calculated and analyzed.
Results of nexus’s center of gravity and transfer of efficiency
The distribution of input–output efficiency of the WEF nexus of the Yangtze River Economic Belt is shown in Figures 2, 3 and Table 4. The input–output efficiency will be further analyzed from the perspectives of distribution of standard deviational ellipse and the transfer of the center of gravity.
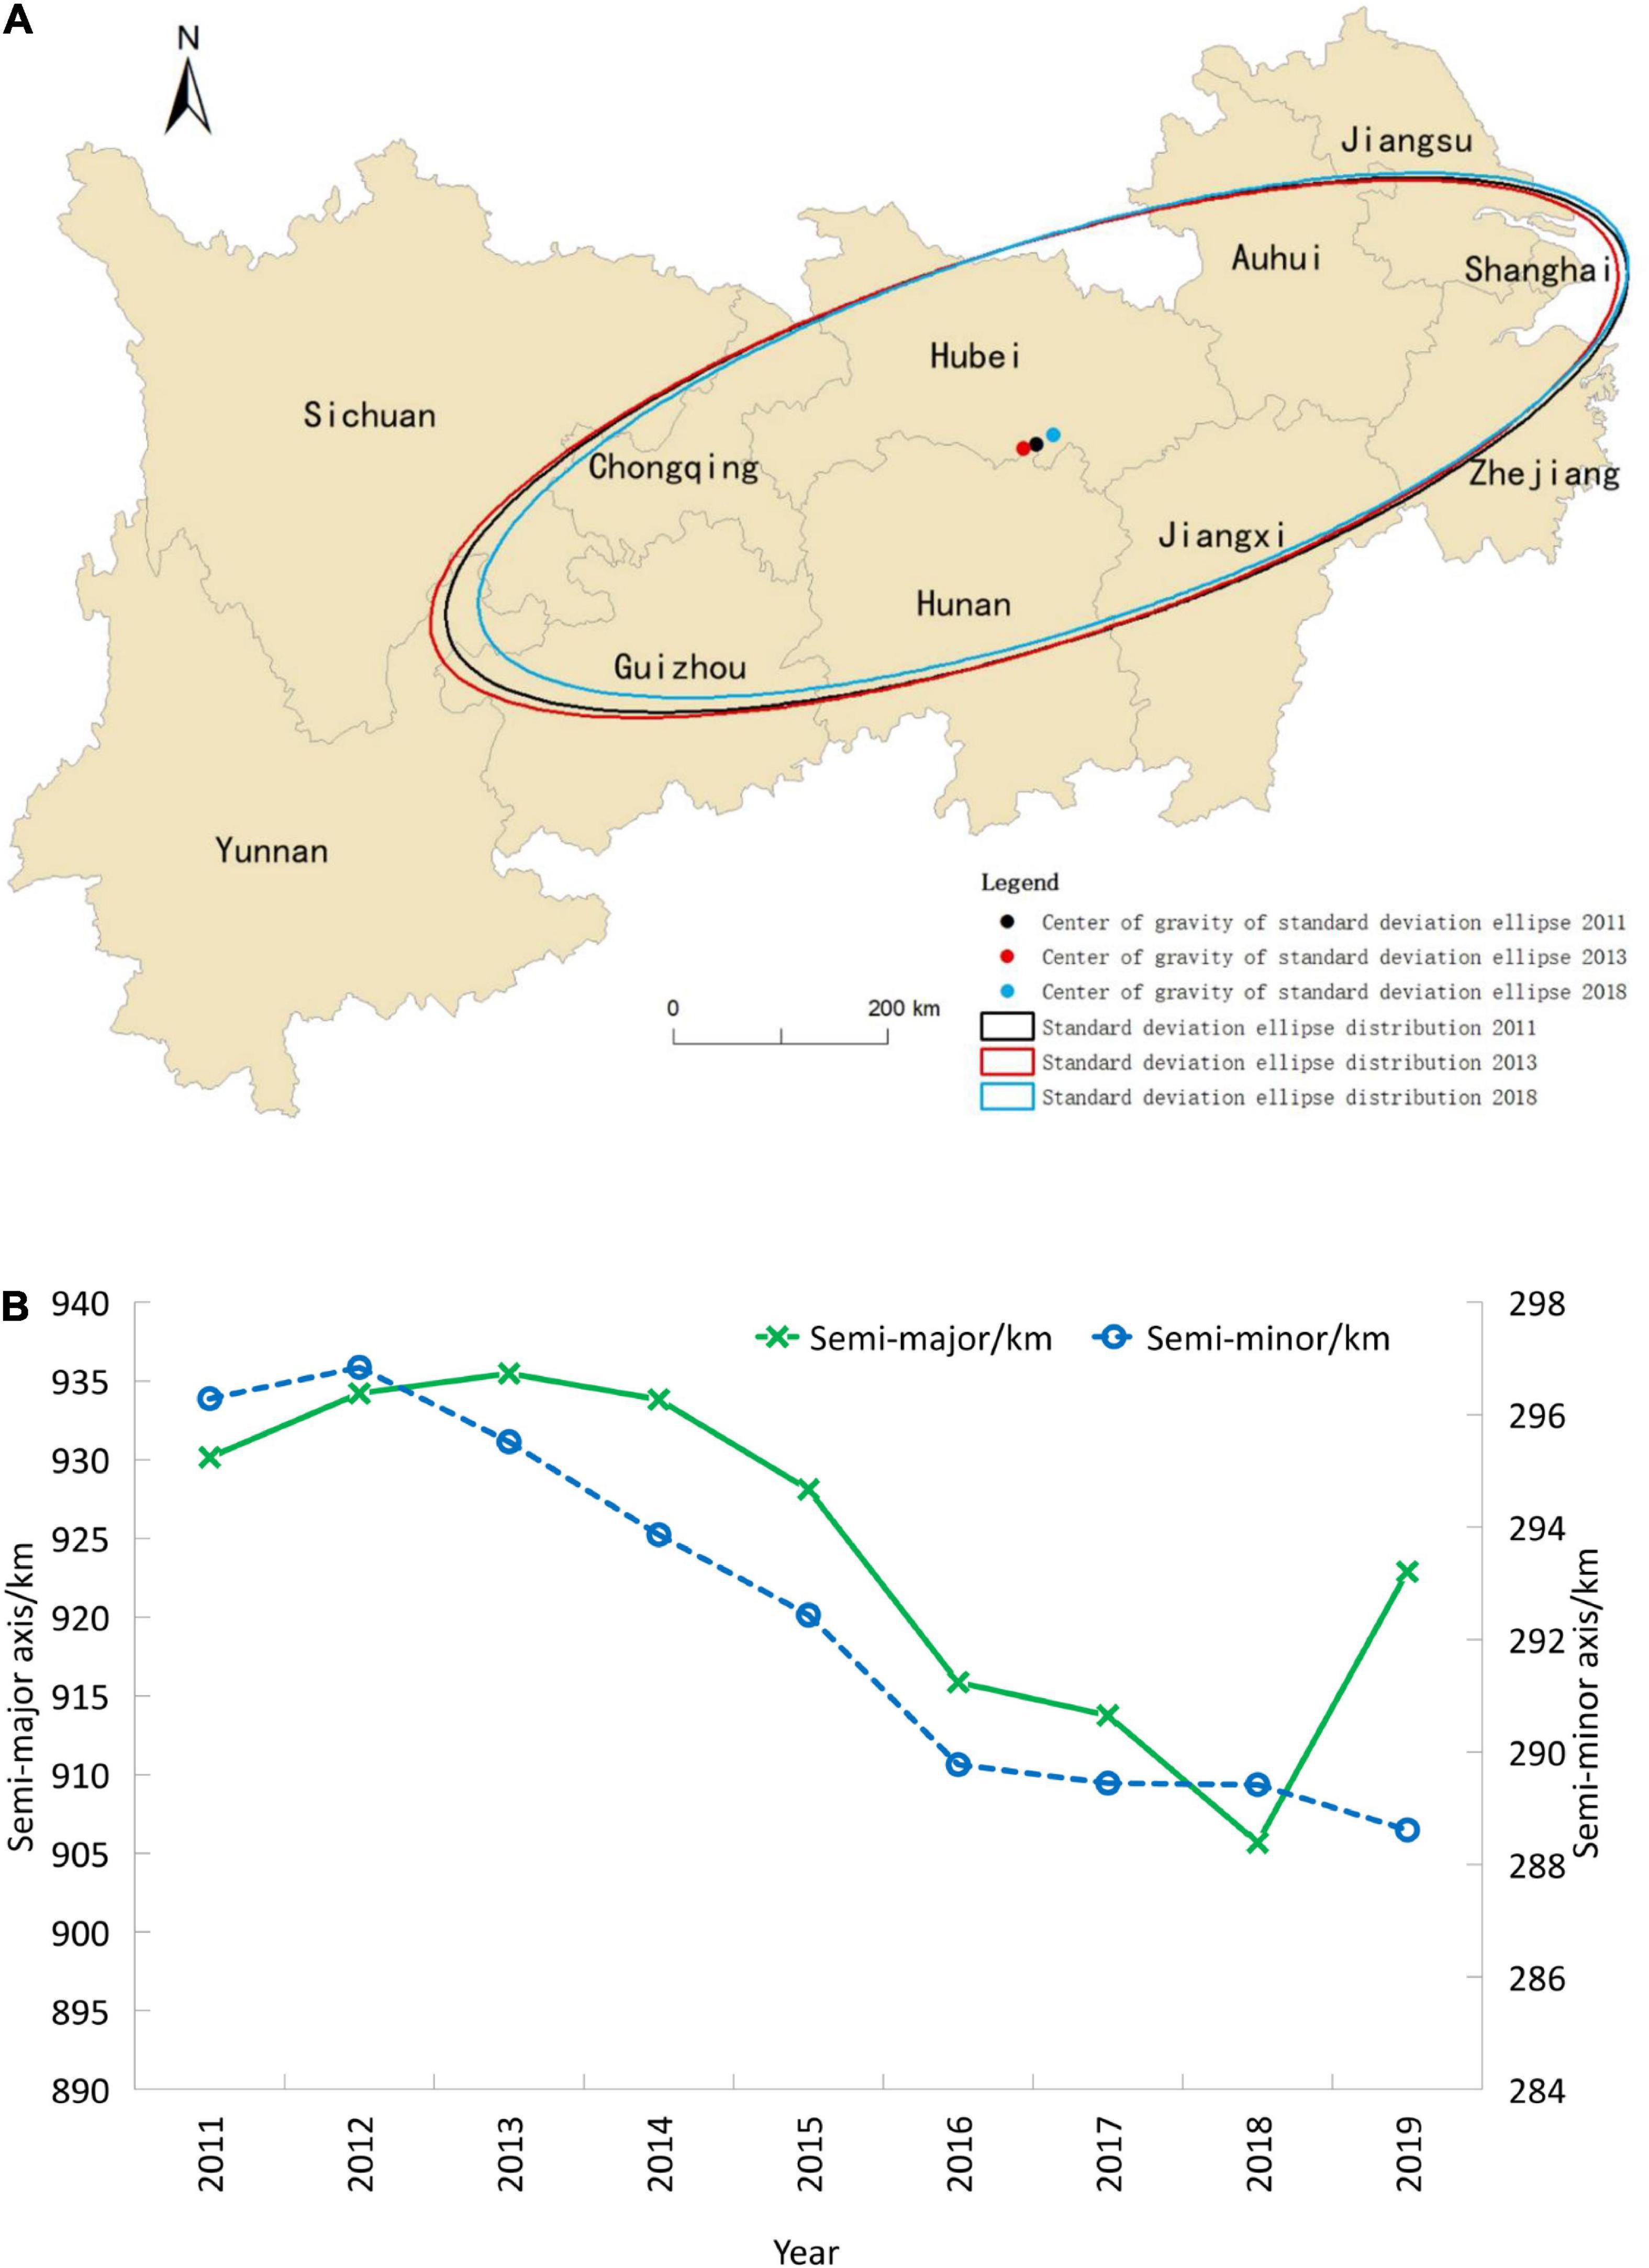
Figure 2. Distribution of standard deviational ellipse of input–output efficiency of WEF nexus. (A) Standard deviation ellipse distribution of 2011, 2013, and 2018. (B) Variation of semi-major and semi-minor axes of standard deviational ellipse from 2011 to 2019.
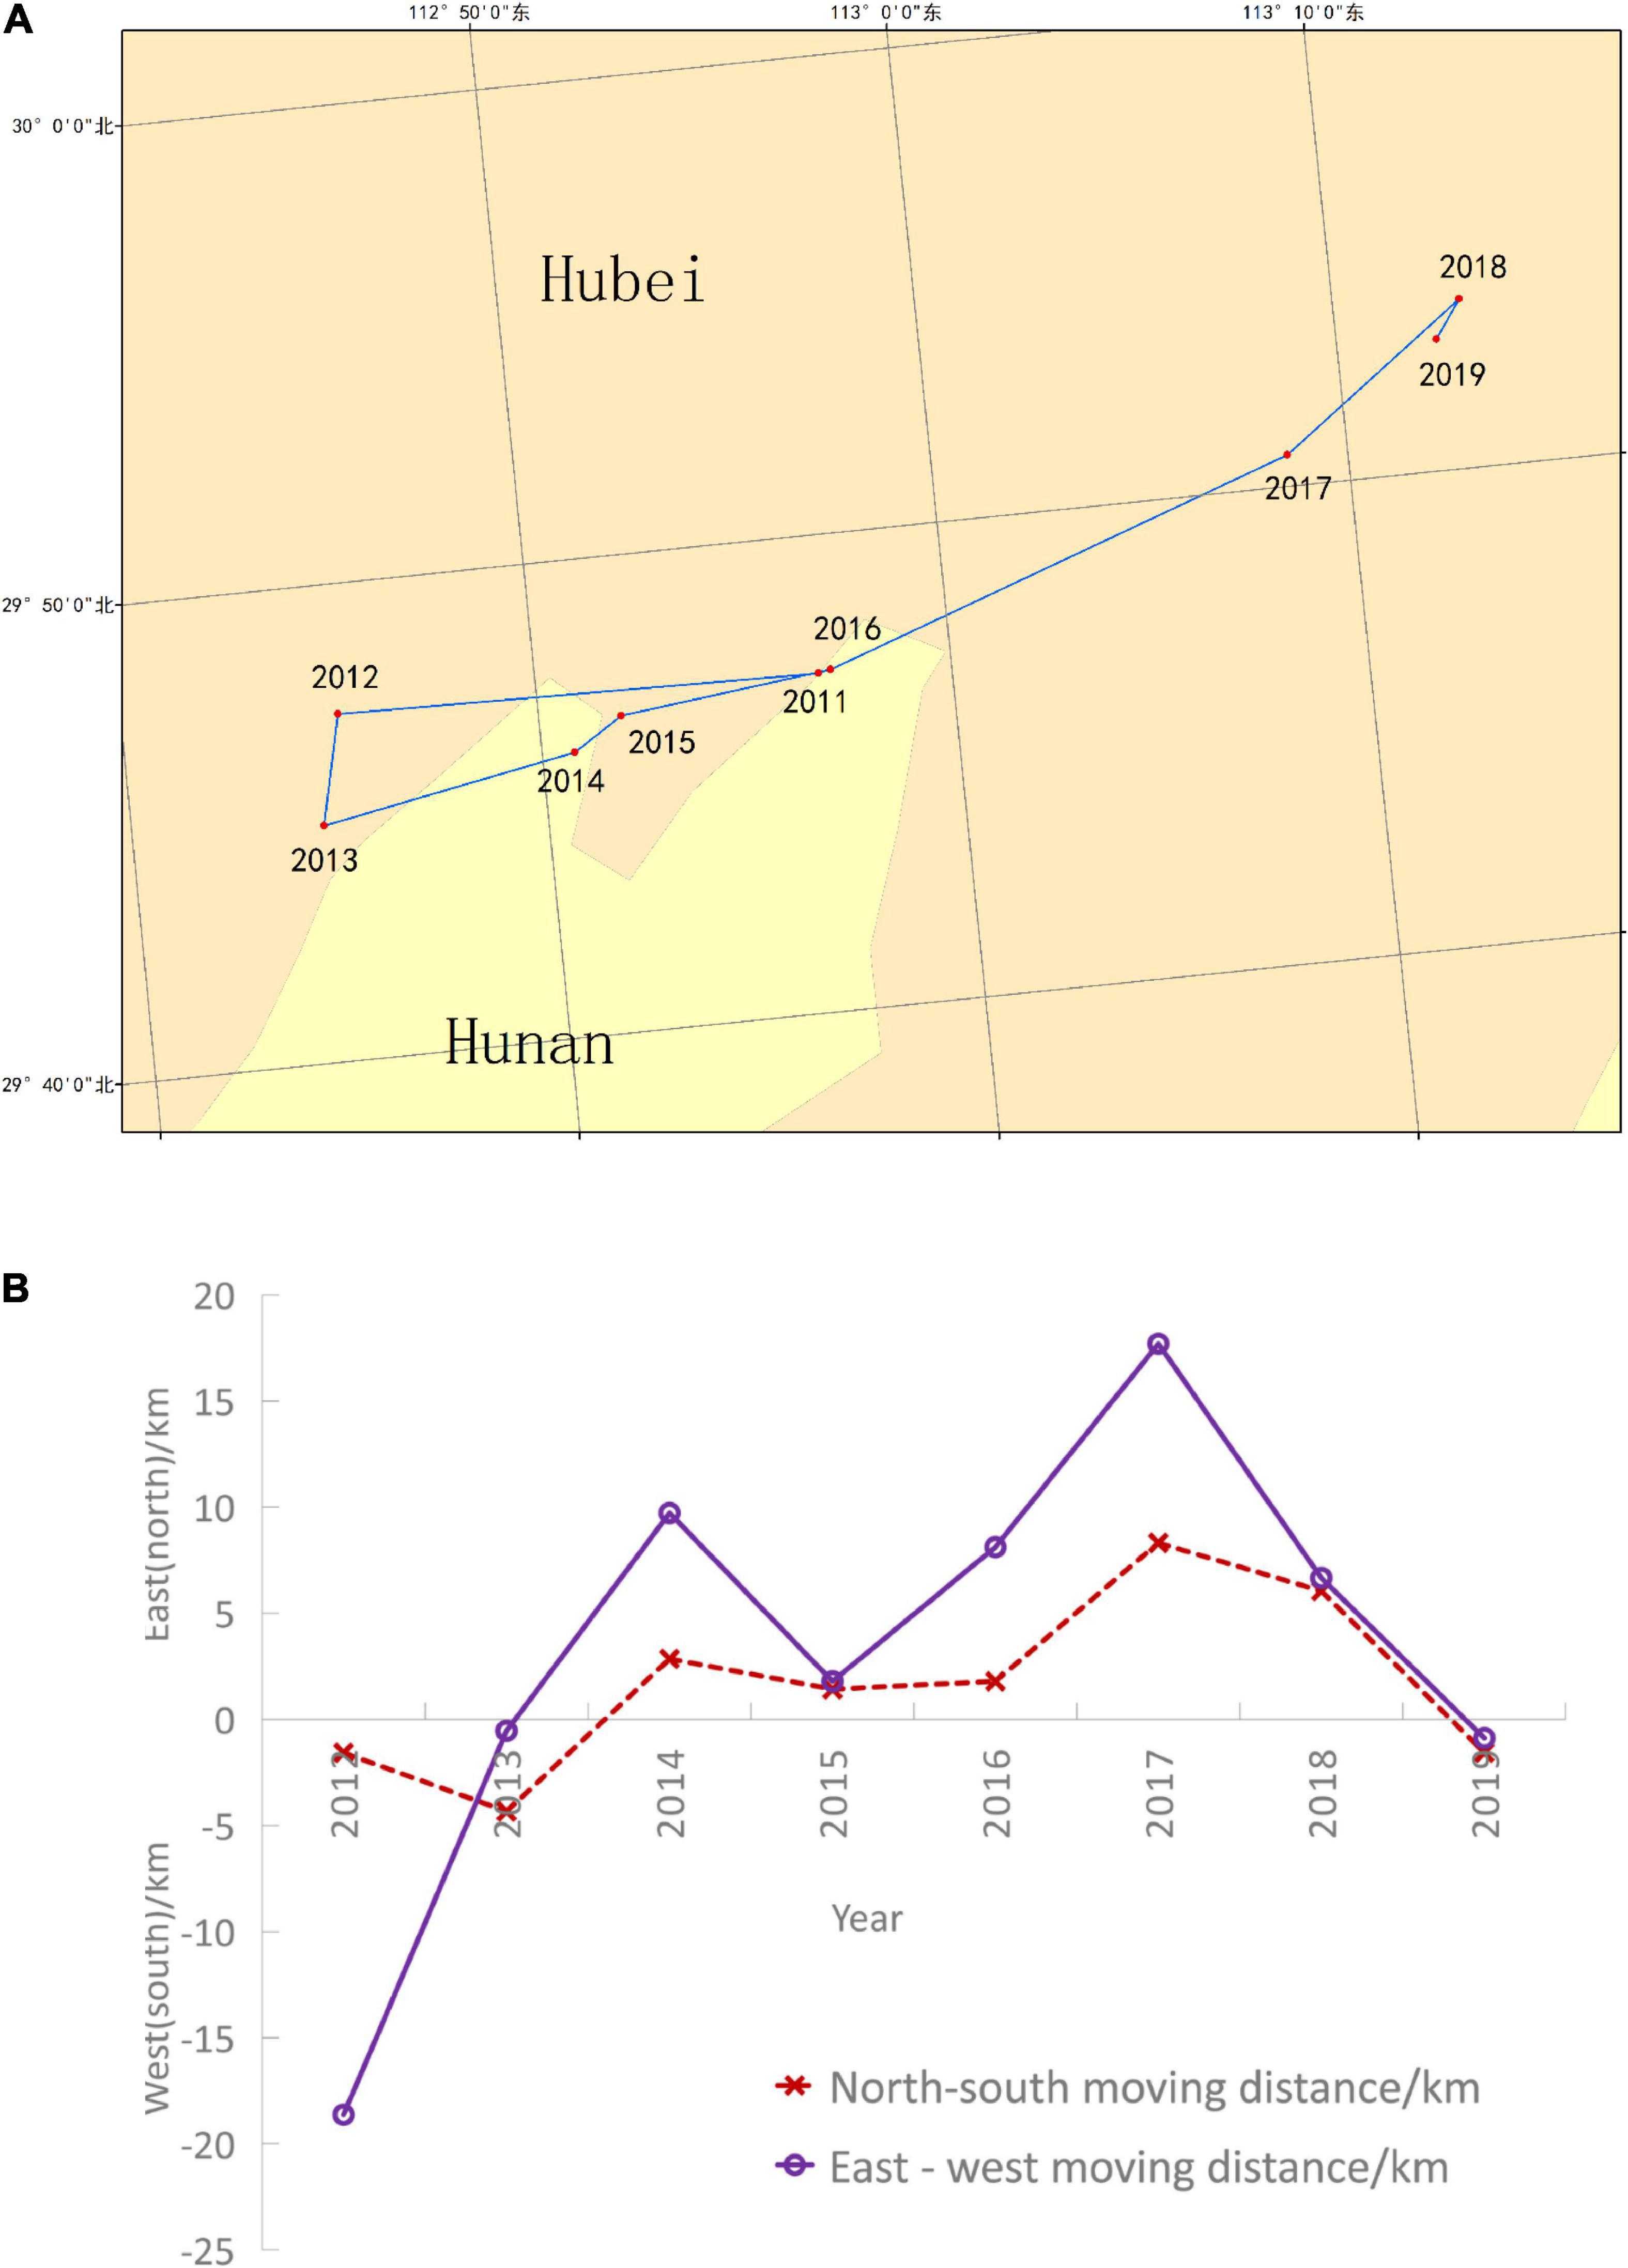
Figure 3. Transfer of the center of gravity of input–output efficiency of WEF nexus. (A) Transfer track of the center of gravity from 2011 to 2019. (B) Transfer distance of the center of gravity from 2011 to 2019.
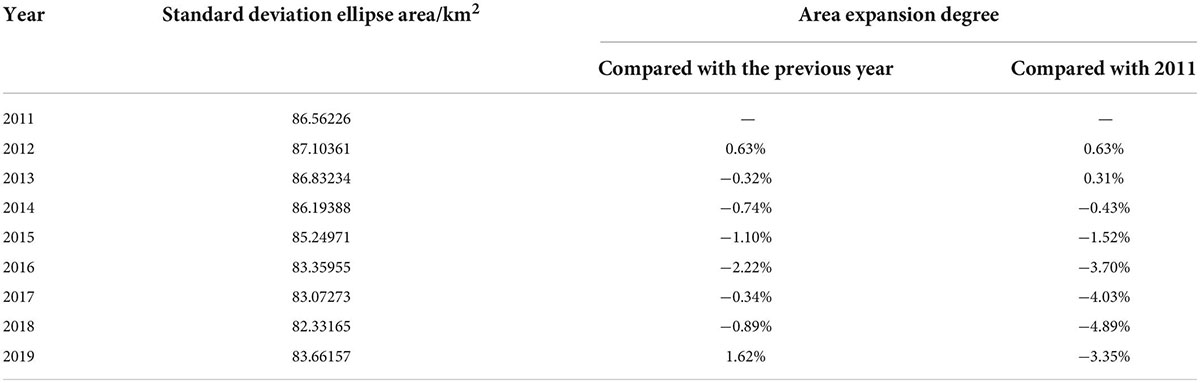
Table 4. WEF nexus’s efficiency area expansion degree of standard deviational ellipse of input–output efficiency from 2011 to 2019.
From the distribution of standard deviational ellipse (Figures 2A,B), the spatial evolution characteristics of input–output efficiency of the WEF nexus of the Yangtze River Economic Belt from 2011 to 2019 are apparent. The area of the standard deviational ellipse first increases and then decreases, which means that the efficiency distribution first enlarges and then shrinks and shows a general trend of shrinking. Specifically, the semi-major axis of the standard deviational ellipse of input–output efficiency increased gradually from 2011 to 2013 and from 2018 to 2019 and decreased gradually from 2013 to 2018, with an overall decrease of 7.27 km. The semi-minor axis increased from 2011 to 2012 and showed a downward trend of fluctuation from 2012 to 2019, with an overall decrease of 7.67 km.
From the transfer track and distance (Figures 3A,B), the center of gravity of input–output efficiency of the WEF nexus of the Yangtze River Economic Belt moved southwest from 2011 to 2013, northeast from 2013 to 2018, and southwest from 2018 to 2019. The center of gravity generally shows a trend of moving northeast. Specifically, the center of gravity of efficiency transferred 12.95 km to the north and 23.95 km to the east.
The above results show that the input–output efficiency of the WEF nexus of the provincial administrative regions inside and outside the ellipse is quite different. Meanwhile, the efficiency distribution generally indicates a trend of gathering to the northeast, which means that the input–output efficiency of the upper reaches of the Yangtze River Economic Belt is slower than that of the middle and lower reaches.
Results of subsystem’s center of gravity and transfer of efficiency
The distribution of input–output efficiency of water resources, energy, and food subsystems of the Yangtze River Economic Belt is shown in Figures 4, 5 and Table 5. The input–output efficiency will be further analyzed from the perspectives of distribution of standard deviational ellipse and the transfer of the center of gravity.
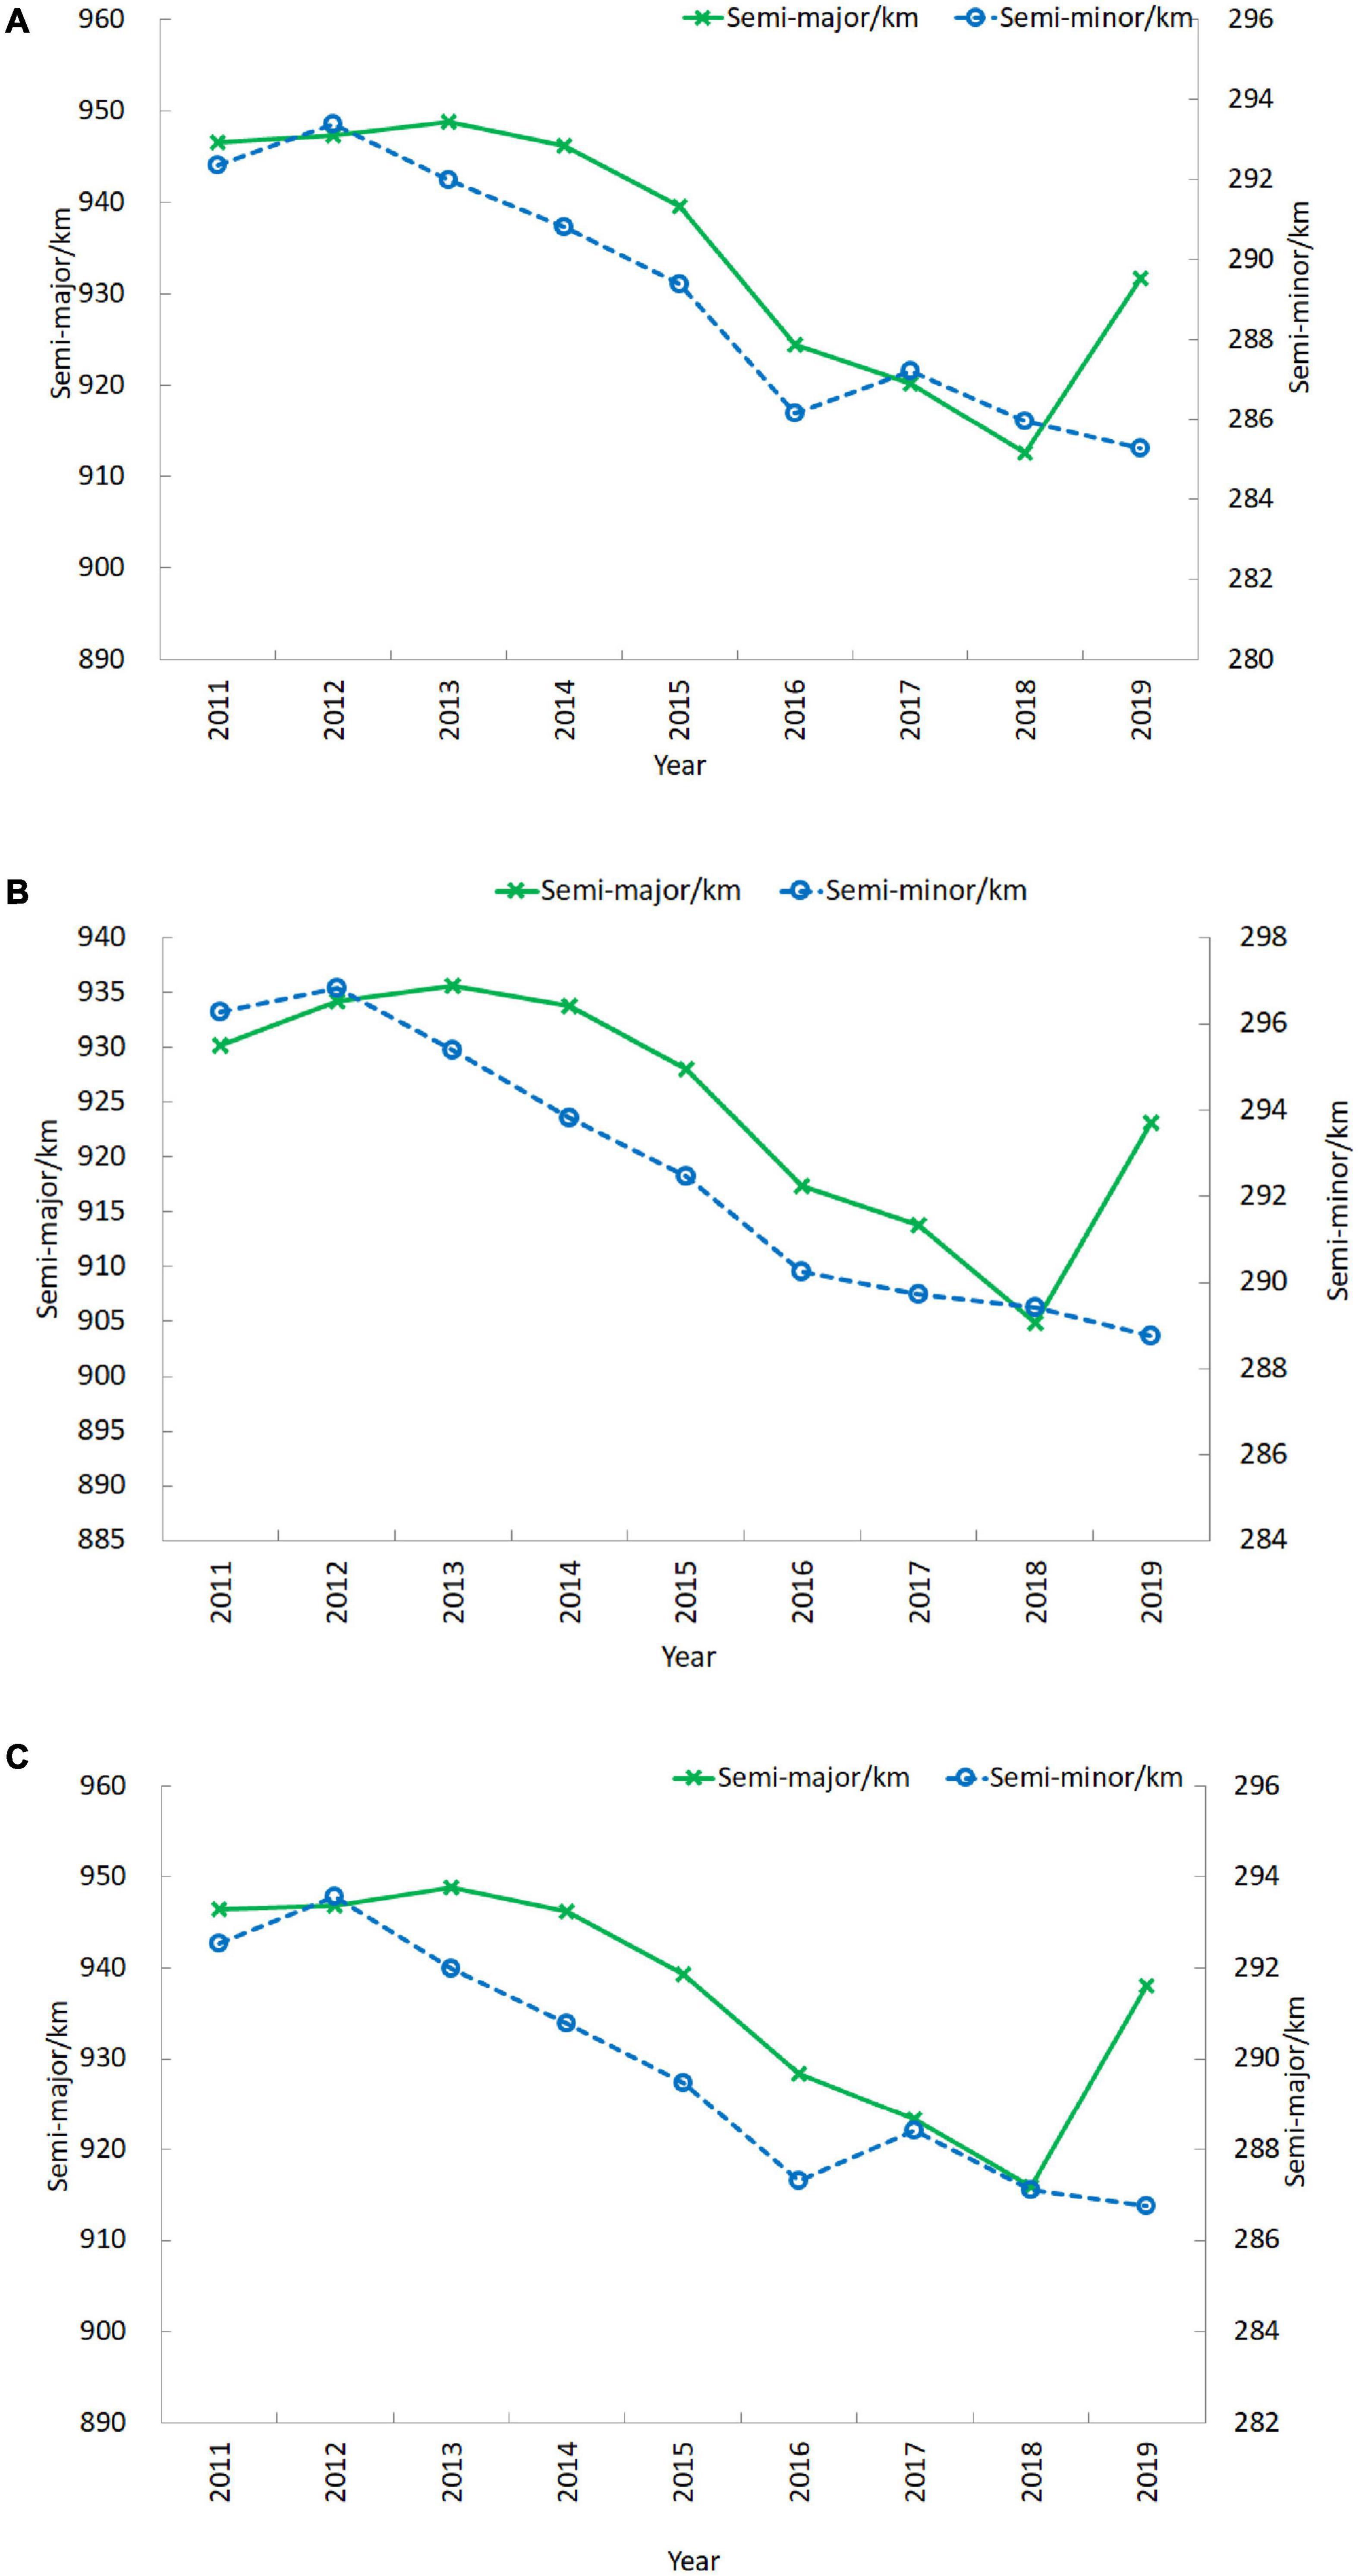
Figure 4. Variation of semi-major and semi-minor axes of subsystems’ standard deviational ellipse. (A) Water. (B) Energy. (C) Food.
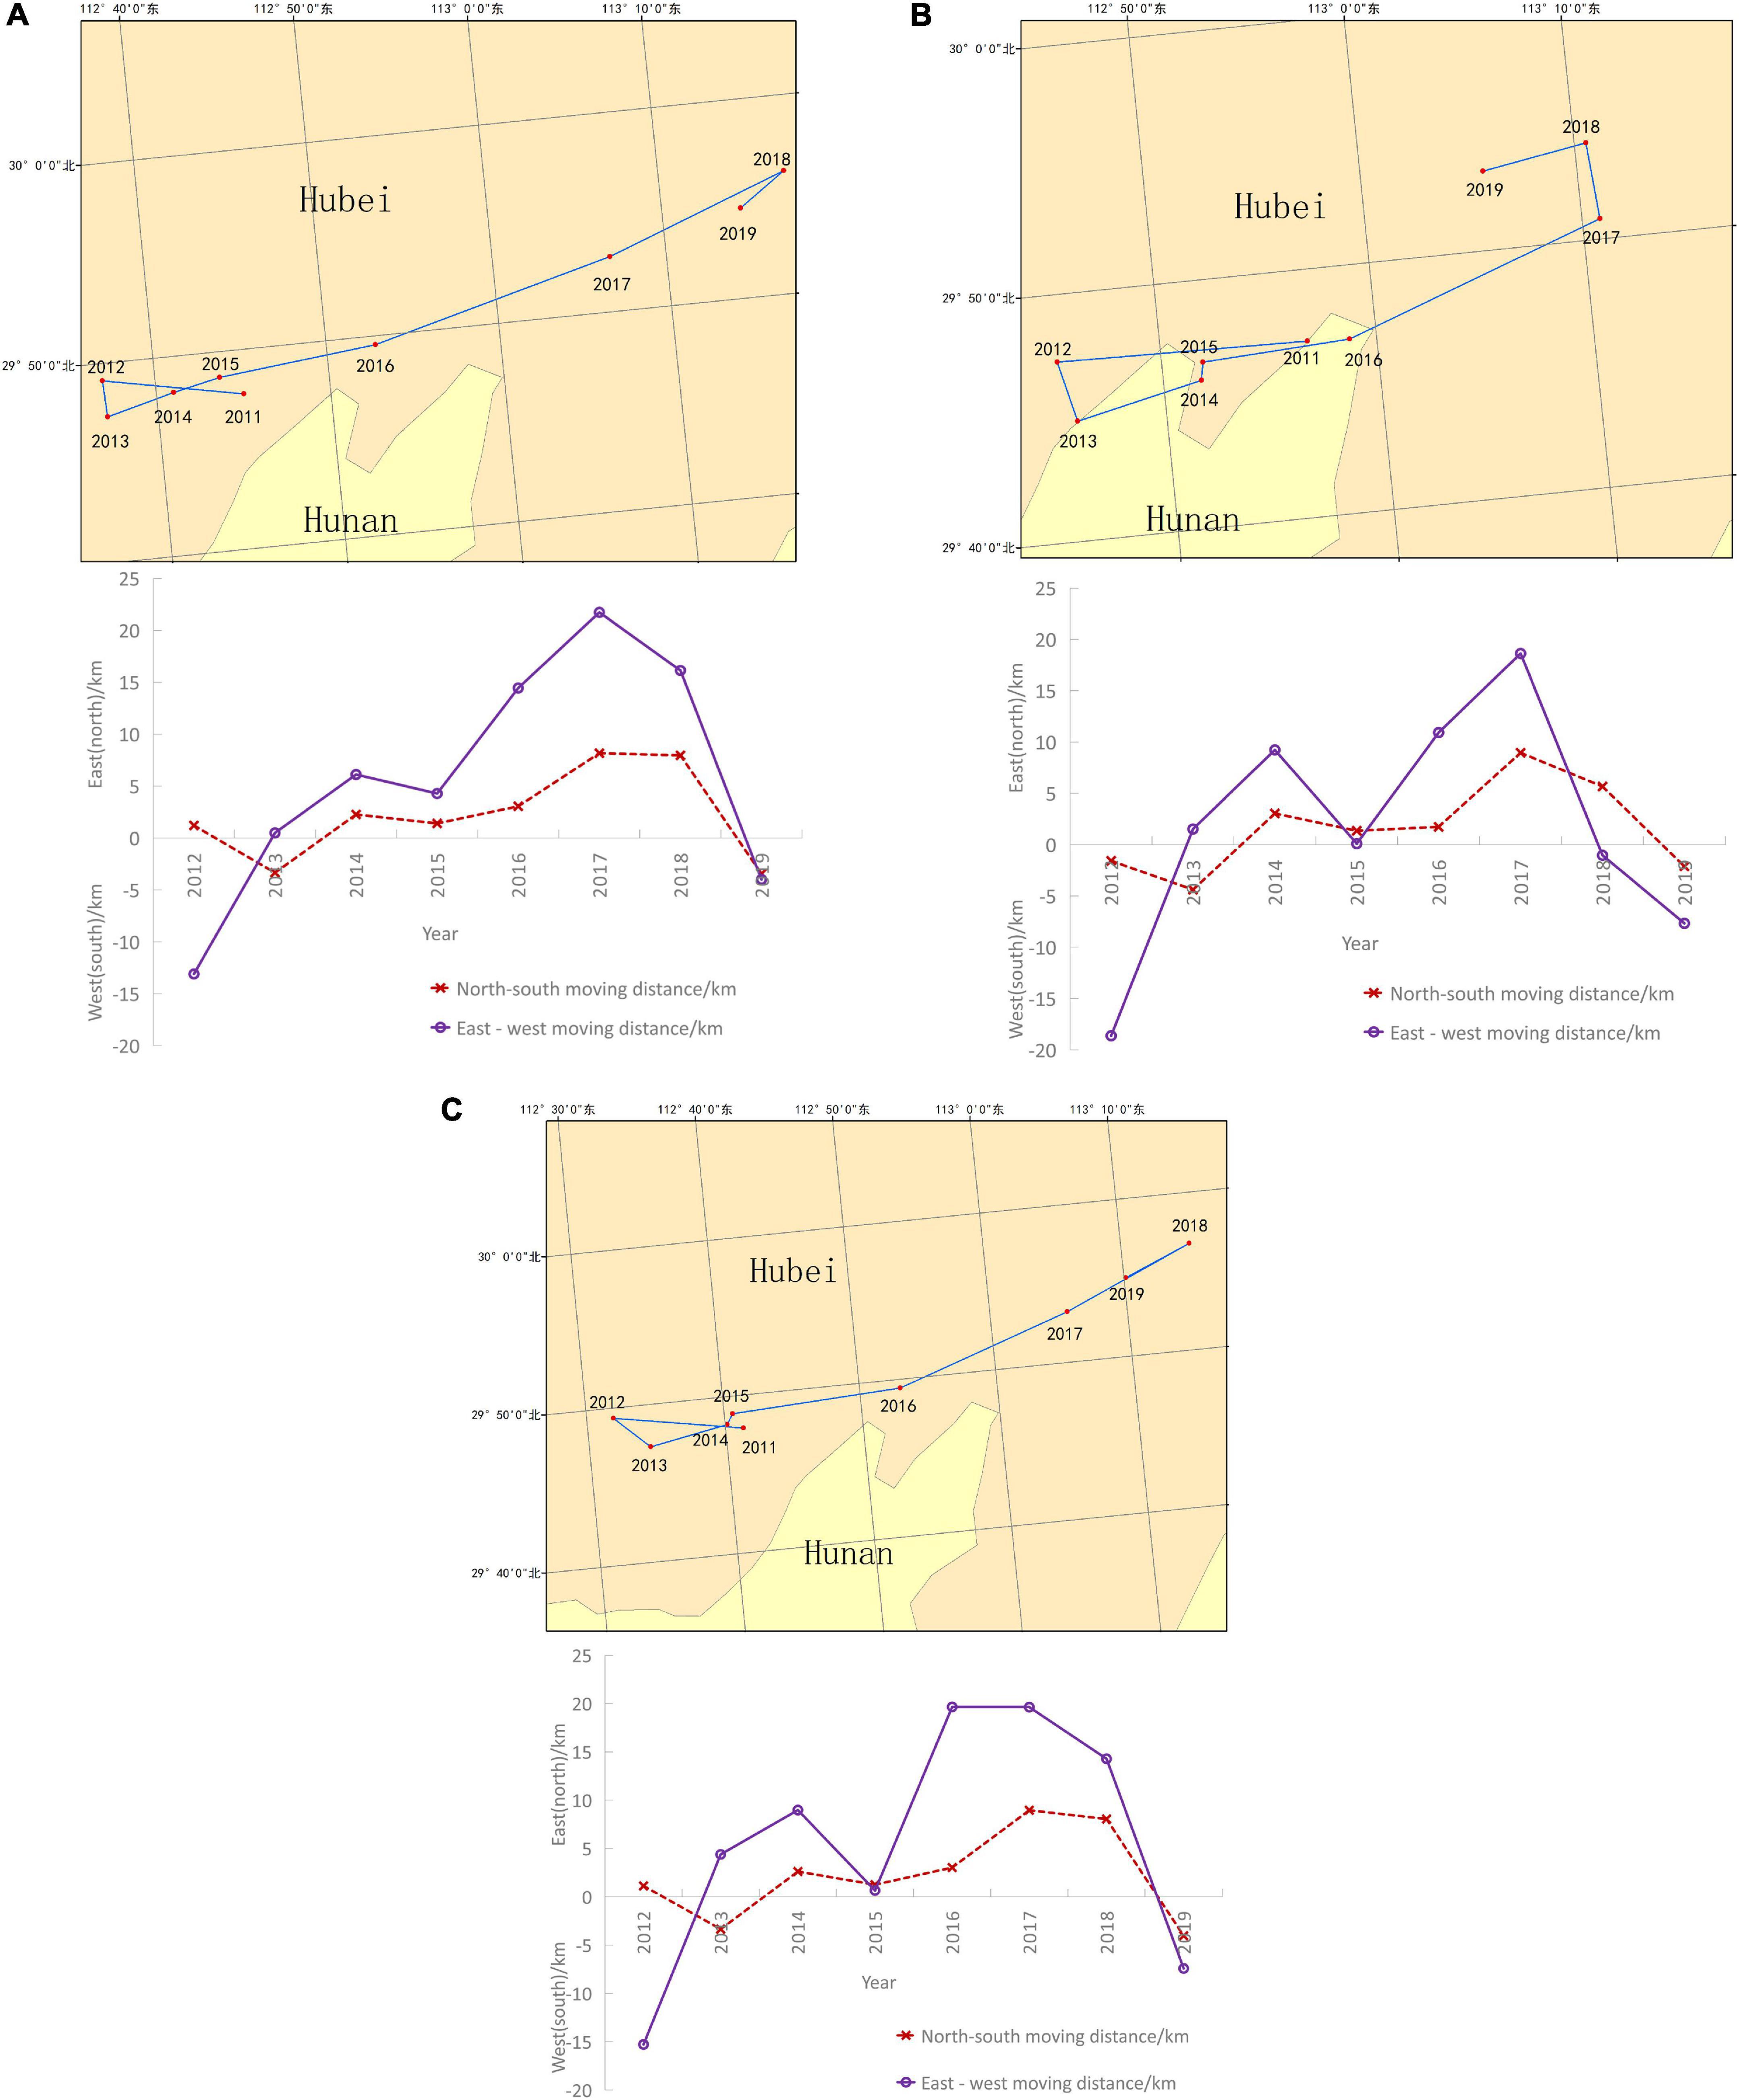
Figure 5. Transfer of the center of gravity of input–output efficiency of subsystems. (A) Water. (B) Energy. (C) Food.
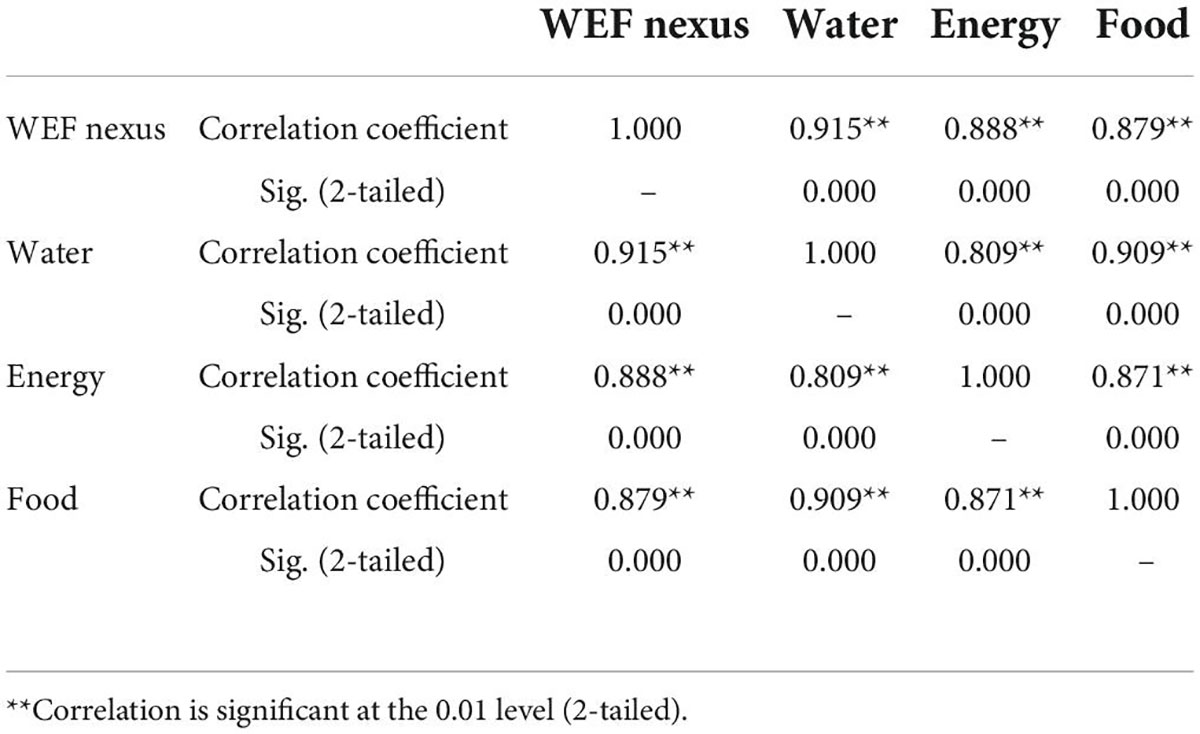
Table 5. Spearman correlation coefficient of transfer distance.
From the distribution of the standard deviational ellipse (Figures 4A,B), the area of the standard deviational ellipse of each subsystem of the Yangtze River Economic Belt shows a decreasing trend from 2011 to 2019. Specifically, the variation trends of the semi-major and semi-minor axes of each subsystem’s standard deviational ellipse of input–output efficiency are similar to that of the WEF nexus. The semi-major axis increased gradually from 2011 to 2013 and 2018 to 2019 and decreased gradually from 2013 to 2018. The semi-minor axis increased from 2011 to 2012 and showed an upward trend of fluctuation from 2012 to 2019. In general, the semi-major and semi-minor axes of the water resource subsystem decreased by 14.87 km and 7.08 km, respectively. The semi-major and semi-minor axes of the energy subsystem decreased by 7.03 km and 7.54 km, respectively. The semi-major and semi-minor axes decreased by 8.36 km and 5.78 km, respectively.
From the transfer of the center of gravity of input–output efficiency (Figure 5), each subsystem’s center of gravity of input–output efficiency moved southwest in 2011–2012, northeast in 2012–2018, and southwest in 2018–2019. In general, the total distance of the center of gravity moving to the north is greater than that moving to the south, the total distance moving to the east is greater than that moving to the west, and the total distance moving in the east-west direction is greater than that moving in the north-south direction. To be specific, the efficiency’s center of gravity of the water resource subsystem transfers 17.25 km to the north and 46.09 km to the east (Figure 5A). The efficiency center of gravity of the energy subsystem transfers 12.95 km to the north and 13.08 km to the east (Figure 5B). The efficiency center of gravity of the food subsystem transfers 17.67 km to the north and 44.91 km to the east (Figure 5C). From the Spearman correlation coefficient (Table 5), the water resources system has the most significant impact on the transfer distance of the center of gravity of the WEF nexus, followed by the energy system.
The above results show that the distribution of input–output efficiency of each subsystem also shows a trend of aggregation to the northeast. From the Spearman correlation coefficient (Table 5), the water resources system has the greatest impact on the transfer distance of the center of gravity of the WEF nexus, followed by the energy system.
Discussion
According to ranking changes in input–output efficiency and relative efficiency of 11 provincial administrative regions of the Yangtze River Economic Belt from 2011 to 2019, this study calculates the time evolution of input–output efficiency. The spatial variation of input–output efficiency is measured from the distribution and the transfer of the center of gravity. The distribution of efficiency values obtained in the study is similar to the results in the existing relevant literature. Huang et al. (2021) calculated the input–output efficiency of the WEF nexus in different regions of China. Among them, the regions involved in the Yangtze River Economic Belt also show a similar efficiency ranking and indicate the trend that the efficiency of eastern coastal areas is higher than that in the western inland areas of the Yangtze River Economic. Ge et al. (2022) concluded that the input–output efficiency of WEF nexus of Sichuan, Hubei, Hunan, and Jiangxi has decreased, which is basically consistent with the results of this study. Compared with the existing relevant literature, this study starts from the spatial elements, analyzes the spatial distribution and change trend of efficiency, and puts forward two new indicators to enrich the research content from the spatial perspective. The reasons will be analyzed from the perspectives of time evolution and spatial distribution.
Analysis of time evolution
In general, the input–output efficiency of the WEF nexus in the eastern coastal areas is higher than that in the western inland areas of the Yangtze River Economic Belt, indicating that the allocation of WEF resources in the eastern coastal area of the Yangtze River Economic Belt is more reasonable than that in the western inland areas of the Yangtze River Economic Belt. As can be seen from Tables 2, 3, the ranking of most provincial administrative regions with high comprehensive efficiency presents an upward trend (Anhui and Hubei) or always remain in the front (Shanghai, Jiangsu, Zhejiang, Hunan, and Chongqing), and these provincial administrative regions are basically located in the middle-lower reaches of the Yangtze River Economic Belt. However, the ranking of provincial administrative regions with low comprehensive efficiency shows no apparent upward trend (Yunnan) and even a downward trend (Sichuan and Guizhou). These provincial administrative regions are located in the upper reaches of the Yangtze River Economic Belt.
The reason is that the middle-lower reaches, especially the lower reaches of the Yangtze River, have unique natural conditions, that is, unique geographical transportation position, excellent terrain conditions, and climate. Although the natural resources of these regions are relatively scarce compared with those of the upper reaches, their high level of openness and technology has effectively improved the situation of insufficient resources. The input–output efficiency in the upper reaches of the Yangtze River is low or even declining, which is mainly limited by technological level and industrial structure. On the one hand, the backward technology makes efficient use of natural resources in these areas unable to be effectively utilized and transformed. On the other hand, the single industrial structure focusing on heavy industry, which results in high-energy consumption and high emission in production (Gu and Xie, 2022), intensifies the generation of unexpected output. At the same time, it shows that the single policy on water resources, energy, and food has not brought an obvious positive impact to these areas in recent years.
Analysis of spatial distribution
The center of gravity of efficiency of the WEF nexus of the Yangtze River Economic Belt focused to the southwest from 2011 to 2013 benefited from the western development strategy. Since the implementation of the western development strategy, the economic development of the western region has been significantly improved. In 2012, 22 national key projects started in the western region, with a total investment of 577.8 billion Yuan. In 2007, The 11th Five Year Plan of Western Development (The State Council Information Office of the People’s Republic of China, 2007) pointed out that the economic growth mode should be changed through scientific and technological innovation, structural adjustment, and layout improvement, so as to promote more scientific and sustainable development of the western region. In 2012, The 12th Five Year Plan of Western Development (The Central People’s Government of the People’s Republic of China, 2012) pointed out that the development concept should be changed to focus on the quality and efficiency of development. The economic foundation of western China is weaker than that of eastern China. In order to pursue rapid economic growth in the early stage, ecological benefits were ignored, which also made the comprehensive efficiency of western China have a large space for improvement. Therefore, the promulgation of plans has played a significant role in improvement.
After 2013, the semi-major axis, semi-minor axis, and the area of standard deviational ellipse all decreased, and the center of gravity transferred to the northeast, indicating that the input–output efficiency shows a trend of aggregation to the northeast. The reason lies in the effectiveness of Guidance on Promoting the Development of the Yangtze River Economic Belt by Relying on the Golden Waterway issued in 2014 (The Central People’s Government of the People’s Republic of China, 2014) and Outline of Yangtze River Economic Belt Development Plan issued in 2016 (The Central People’s Government of the People’s Republic of China, 2016). The layout of the Yangtze River Economic Belt is based on the idea of “ecological priority, river basin interaction, and intensive development.” The middle-lower reaches of the Yangtze River, with better economy and infrastructure, have obvious advantages over the upper reaches in terms of industrial transformation, technological upgrading, and environmental protection measures. And most of the megacities and megacities, including Shanghai, Nanjing, and Hangzhou, are located in the middle-lower reaches of the Yangtze River.
The decrease of the semi-major and semi-minor axes of the standard deviation ellipse of the efficiency of the WEF nexus and subsystems of the Yangtze River Economic Belt shows that the concentration trend of input–output efficiency is strengthened in the northeast–southwest direction, and the decrease of the area of the standard deviation ellipse shows that the pulling effect of provincial administrative regions in the ellipse on input–output efficiency is more obvious than that of provincial administrative regions outside the ellipse. Among them, the semi-major and semi-minor axes and area expansion degree of the standard deviation ellipse reached the minimum in 2018, indicating that the input–output efficiency difference between provincial administrative regions inside and outside the ellipse was the largest in 2018, and the trend of efficiency distribution gathering to the northeast was the most obvious. The reason is that the growth rate of input–output efficiency of the WEF nexus of Sichuan, Yunnan, and Guizhou is slower than that in other provincial administrative regions. Although the promulgation of relevant policies has improved the input–output efficiency of these provinces to a certain extent, the improvement speed of efficiency is restricted by technology, economy, industry, transportation, and market. These factors lead to the failure to maximize the positive effect of the supporting policies, and the phenomenon that the input–output efficiency of the three provinces lags behind other provincial administrative regions will continue in the short term.
The reason why the water resources subsystem has the greatest impact on the transfer of the center of gravity of the input–output efficiency of the nexus is that the spatial difference of per capita water resources consumption between provincial administrative regions is considerable, especially the spatial difference of industrial and agricultural water consumption. Taking 2018 as an example, the per capita water consumption of Jiangsu is about three times that of Chongqing, the per capita industrial water consumption of Jiangsu is about seven times that of Yunnan, and the per capita agricultural water consumption is about five times that of Shanghai. Generally speaking, in terms of per capita industrial water consumption, the lower reaches consume more; in terms of per capita agricultural water consumption, the middle reaches and Jiangsu are more prominent. The reason is that the lower reaches have a good industrial foundation and convenient transportation conditions, while the middle reaches mainly benefit from flat terrain and the rich river network. However, since the Implement the Strictest Water Resources Management System and Assessment Methods (The Central People’s Government of the People’s Republic of China, 2013) in 2013, the utilization of water resources has been effectively supervised. The per capita water resources consumption of 11 provincial administrative regions in the Yangtze River Economic Belt has an obvious downward trend, and the water resources consumption of each provincial administrative region is getting closer to the average value, and the spatial difference is gradually decreasing. Coupled with the optimization and adjustment of industrial structure and the promotion of efficient agriculture, the balance of industrial and agricultural water between provincial administrative regions has also been improved.
Policy and managerial implications
In conclusion, the upper reaches of the Yangtze River Economic Belt benefit from the support of national policies in the early stage, but with the promotion of high-quality development, the single industrial structure seriously hinders the sustainable development of the region. On the one hand, the migration of heavy industry to the upper reaches leads to a sharp rise in water resources and energy consumption, as well as the discharge of a large amount of waste water, waste gas, and industrial solid waste, which seriously affects the ecological benefits. On the other hand, backward technology prevents upstream regions from extending their resource advantages into economic and environmental benefits. All provincial administrative regions in the upper reaches should pay attention to the cultivation of talents and the development of new technologies and promote the input–output efficiency and high-quality development of the regional WEF nexus through the optimization of industrial structure. Although the input–output efficiency of the WEF nexus of the middle-lower reaches is higher than that in the upper reaches, continuous breakthroughs in ecological benefits still should be attached importance to. Provincial administrative regions in the middle-lower reaches of China should make rational use of talents and technological advantages, improve resource structure to reduce dependence on one-time energy, and promote the use of clean energy such as wind and solar power, so as to enhance sustainable development capacity.
The Yangtze River Economic Belt has a large span, and there is a big gap between provincial administrative regions regarding economic foundation and public facilities. Middle-lower reaches, especially lower reaches, should not only increase investment in their own scientific and technological progress and talent training but also promote the flow of talents and technology of other regions so as to improve the input–output efficiency of the whole area of the Yangtze River Economic Belt and form a virtuous cycle and maximize the benefits of economy and environment. In addition, relevant policies in recent years mainly focus on single resources, and there is an interactive relationship between the policies of different resources, which will reduce the action time and influence the degree of the policy. In order to improve the input–output efficiency of the whole region, the promulgation of relevant policies should focus on the WEF nexus from the perspective of sustainable development and regulate different resources reasonably from an overall perspective.
Conclusion
The study uses the DEA-BCC model to calculate the input–output efficiency of the WEF nexus of the Yangtze River Economic Belt from 2011 to 2019. Combined with the standard deviational ellipse model and indicators called WEF nexus’s efficiency area expansion degree and the subsystem’s influence degree on the transfer of nexus’s center of gravity, the study evaluates the temporal and spatial distribution of efficiency and puts forward corresponding policy suggestions according to the different characteristics of the region, which provides a scientific reference for the relevant resource strategy of the Yangtze River Economic Belt.
Through the above work, the main conclusions are as follows: (1) Efficiency shows a trend of high in the east and low in the west, high in the coast and low in the inland. From the comprehensive efficiency ranking of provincial administrative regions each year, the ranking of most provincial administrative regions remains unchanged or increased, and the ranking of Jiangxi, Sichuan, and Guizhou decreases. It shows that the input–output allocation of the WEF resources in the middle and lower reaches of the Yangtze River Economic Belt is more reasonable than that in the upper reaches. (2) The area and semi-major and semi-minor axes of the standard deviational ellipse of input–output efficiency of the WEF nexus and subsystems of the Yangtze River Economic Belt fluctuate, but the overall trend decreased as a whole and reached the minimum in 2018, indicating that the distribution range of efficiency has a trend of agglomeration. The center of gravity of the standard deviational ellipse generally moves to the northeast, and the degree of northward movement is less than that of eastward movement, indicating that with the promotion of high-quality development, the middle and lower reaches of the Yangtze River have obvious advantages over the upper reaches in terms of industrial transformation and technological upgrading. (3) The water resources subsystem has the most significant impact on the transfer of the center of gravity of efficiency of the WEF nexus, which is due to the large spatial difference in water resources consumption. Among them, the per capita industrial water consumption is more in the lower reaches, and the per capita agricultural water consumption is more in the middle reaches.
According to the above conclusions, in order to effectively improve the input–output efficiency of the WEF nexus of the Yangtze River Economic Belt and promote regional sustainable development, the upper reaches should start with training talents and developing technology to facilitate the optimization of industrial structure; the middle and lower reaches should make rational use of scientific and technological advantages to improve the utilization efficiency of natural resources, reduce the dependence on disposable energy and speed up the improvement of resource structure.
The characteristics and innovations of this study are mainly reflected in the following three points: (1) it is conducive to analyzing the impact of the correlation system on the economy and environment from an overall perspective and providing a new perspective for the regulation of three kinds of resource allocation by taking the WEF nexus as the main research object. (2) From the perspective of research and analysis, this study not only analyzes the time evolution of input–output efficiency but also concretizes the spatial distribution characteristics from the basic elements of space by using the standard deviation ellipse model to analyze the distribution changes of input and output efficiency and the transfer of the center of gravity. (3) From the content of research and analysis, to further enrich the research content from the spatial perspective, two new indicators called area expansion degree and subsystem’s influence degree are proposed. The application value of this study is that the growth rate of input–output efficiency and the implementation effect of relevant policies in each provincial administrative region can be judged by the elements such as the center of gravity, the area, and its degree of expansion of the standard deviation. The study intends to provide new ideas for future research, propose relevant suggestions, and better promote regional sustainable development.
The deficiency of this study mainly lies in the short time span. On the one hand, the data before 2011 have problems such as different statistical caliber and missing data. In addition, the concept of the “Yangtze River Economic Belt” was first put forward in 2014. On the other hand, the authoritative yearbook has not published the data after 2019, so the changing trend of input–output efficiency of the WEF nexus of the Yangtze River Economic Belt after 2019 cannot be determined, which needs further observation and analysis.
Data availability statement
The data analyzed in this study are subject to the following licenses/restrictions: Belong to Study Group Requirements. Requests to access these datasets should be directed to YC, sanchen007@njfu.edu.cn.
Author contributions
YC and YN contributed to the methodology, validation, investigation, writing—original draft preparation, review and editing, and funding acquisition. YC contributed to the conceptualization. YN contributed to the software and visualization. Both authors have read and approved the submitted version.
Funding
This study was supported by National Social Science Fund of China (Grant No. 21BGL181) to YC, Postgraduate Research & Practice Innovation Program of Jiangsu Province (Grant No. KYCX22_1035) to YN, and Humanities and Social Science Foundation of the Ministry of Education of China (Grant No. 20YJA630006) to YC.
Conflict of interest
The authors declare that the research was conducted in the absence of any commercial or financial relationships that could be construed as a potential conflict of interest.
Publisher’s note
All claims expressed in this article are solely those of the authors and do not necessarily represent those of their affiliated organizations, or those of the publisher, the editors and the reviewers. Any product that may be evaluated in this article, or claim that may be made by its manufacturer, is not guaranteed or endorsed by the publisher.
References
Belinskij, A. (2015). Water-energy-food nexus within the framework of international water law. Water 7, 5396–5415. doi: 10.3390/w7105396
Charnes, A., Cooper, W. W., and Rhodes, E. (1978). Measuring the efficiency of decision making units. Eur. J. Operat. Res. 2, 429–444. doi: 10.1016/0377-2217(78)90138-8
Chen, W. Z., and Chen, Y. (2021). Pre-warning measurement of water resources security in the yangtze river basin from the perspective of water-energy-food symbiosis. Water 13:475. doi: 10.3390/w13040475
Chen, X. (2020). Measurement and convergence analysis of total factor energy efficiency in yangtze river economic belt. Int. J. Sustain. Dev. Plann. 15, 611–618. doi: 10.18280/ijsdp.150503
Chen, Y., and Xu, L. F. (2021). Evaluation and scenario prediction of the water-energy-food system security in the yangtze river economic belt based on the RF-haken model. Water 13:695. doi: 10.3390/w13050695
Ding, X. H., Tang, N., and He, J. H. (2019). The threshold effect of environmental regulation, fdi agglomeration, and water utilization efficiency under “double control actions”-an empirical test based on yangtze river economic belt. Water 11:452. doi: 10.3390/w11030452
Endo, A., Tsurita, I., Burnett, K., and Orencio, P. M. (2017). A review of the current state of research on the water, energy, and food nexus. J. Hydrol. Region. Stud. 11, 20–30. doi: 10.1016/j.ejrh.2015.11.010
Ge, M., Yu, K., Ding, A., and Liu, G. (2022). Input-output efficiency of water-energy-food and its driving forces: spatial-temporal heterogeneity of yangtze river economic belt, China. Int. J. Environ. Res. Public Health 19:1340. doi: 10.3390/ijerph19031340
Gu, F. Y., and Xie, Y. (2022). The differential impacts of coercive pressure from environmental law and proactive environmental strategy on corporate environmental performance: the case study of a pulp and paper company. Corp. Soc. Responsibil. Environ. Manag. [Epub ahead of print]. doi: 10.1002/csr.2286
Hou, N., Zeng, Z., Zhu, Q. Y., Zhang, D. H., and Liu, W. W. (2021). Coordination relationship between green innovation efficiency and environmental protection: evidence from the yangtze river economic belt. Nat. Environ. Pollut. Technol. 20, 881–889. doi: 10.46488/NEPT.2021.V20I02.051
Huang, D., Shen, Z., Sun, C., and Li, G. (2021). Shifting from production-based to consumption-based nexus governance: evidence from an input-output analysis of the local water-energy-food nexus. Water Resour. Manag. 35, 1673–1688. doi: 10.1007/s11269-021-02797-4
Kong, Y., He, W. J., Yuan, L., Zhang, Z. F., Gao, X., Zhao, Y. E., et al. (2021). Decoupling economic growth from water consumption in the Yangtze River Economic Belt, China. Ecol. Indic. 123:107344. doi: 10.1016/j.ecolind.2021.107344
Kulat, M. I., Mohtar, R. H., and Olivera, F. (2019). Holistic water-energy-food nexus for guiding water resources planning: Matagorda County, Texas case. Front. Environ. Sci. 7:3. doi: 10.3389/fenvs.2019.00003
Lefever, D. W. (1926). Measuring geographic concentration by means of the standard deviational ellipse. Am. J. Sociol. 32, 88–94. doi: 10.1086/214027
Li, G. J., Huang, D. H., and Li, Y. L. (2016). China’s input-output efficiency of water-energy-food nexus based on the data envelopment analysis (DEA) model. Sustainability 8:927. doi: 10.3390/su8090927
Li, X., Liu, C. S., Wang, G. Q., Bao, Z. X., Diao, Y. F., and Liu, J. (2021). Evaluating the collaborative security of water-energy-food in china on the basis of symbiotic system theory. Water 13:1112. doi: 10.3390/w13081112
Lin, H. D., Borrion, A., da Fonseca-Zang, W. A., Zang, J. W., Leandro, W. M., and Campos, L. C. (2021). Life cycle assessment of a biogas system for cassava processing in Brazil to close the loop in the water-waste-energy-food nexus. J. Clean. Product. 299:124602. doi: 10.1016/j.jclepro.2021.126861
Liu, Y., Qu, Y., Cang, Y. D., and Ding, X. A. (2022). Ecological security assessment for megacities in the Yangtze River basin: applying improved emergy-ecological footprint and DEA-SBM model. Ecol. Indic. 134:108481. doi: 10.1016/j.ecolind.2021.108481
Ma, D. L., Zhang, F. T., Gao, L., Yang, G. M., Yang, Q., and An, Y. Z. (2021). Spatiotemporal dynamics of green total-factor water-use efficiency and its influencing factors in China. Chinese Geographical Sci. 31, 795–814. doi: 10.1007/s11769-021-1227-3
Magliocca, N. R. (2020). Agent-based modeling for integrating human behavior into the food-energy-water nexus. Land 9:519. doi: 10.3390/land9120519
Maia, R. G. T., and Pereira, A. O. (2021). Eco-Efficiency of the food and beverage industry from the perspective of sensitive indicators of the water-energy-food nexus. J. Clean. Product. 324:129283. doi: 10.1016/j.jclepro.2021.129283
Qin, T., and Tong, J. P. (2021). Spatiotemporal change of water-energy-food coupling efficiency and influencing factors in the yangtze river economic belt. Resour. Sci. 43, 2068–2080. doi: 10.18402/resci.2021.10.11
Ravar, Z., Zahraie, B., Sharifinejad, A., Gozini, H., and Jafari, S. (2020). System dynamics modeling for assessment of water-food-energy resources security and nexus in Gavkhuni basin in Iran. Ecol. Indic. 108:105682. doi: 10.1016/j.ecolind.2019.105682
Sun, C. Z., Yan, X. D., and Zhao, L. S. (2021). Coupling efficiency measurement and spatial correlation characteristic of water-energy-food nexus in China. Resour. Conserv. Recycl. 164:105151. doi: 10.1016/j.resconrec.2020.105151
Susnik, J., Masia, S., Indriksone, D., Bremere, I., and Vamvakeridou-Lydroudia, L. (2021). System dynamics modelling to explore the impacts of policies on the water-energy-food-land-climate nexus in Latvia. Sci. Total Environ. 775:145827. doi: 10.1016/j.scitotenv.2021.145827
The Central People’s Government of the People’s Republic of China (2012). Reply of the State Council on the 12th Five Year Plan for Western Development. Available online at: http://www.gov.cn/zwgk/2012-02/21/content_2072227.htm (accessed February 27, 2022).
The Central People’s Government of the People’s Republic of China (2013). Implement the Strictest Water Resources Management System and Assessment Methods. Available online at: http://www.gov.cn/zwgk/2013-01/06/content_2305762.htm (accessed May 3, 2022).
The Central People’s Government of the People’s Republic of China (2014). Guiding Opinions of the State Council on Relying on the Golden Waterway to Promote the Development of the Yangtze River Economic Belt. Available online at: http://www.gov.cn/zhengce/content/2014-09/25/content_9092.htm (accessed February 27, 2022).
The Central People’s Government of the People’s Republic of China (2016). Outline of Yangtze River Economic Belt Development Plan was officially issued. Available online at: http://www.gov.cn/xinwen/2016-09/12/content_5107501.htm (accessed February 27, 2022).
The Central People’s Government of the People’s Republic of China (2020). Xi Jinping Presided over a Symposium on Comprehensively Promoting the Development of the Yangtze River Economic Belt and Delivered an Important Speech. Available online at: http://www.gov.cn/xinwen/2020-11/15/content_5561711.htm (accessed February 27, 2022).
The State Council Information Office of the People’s Republic of China (2007). The 11th Five Year Plan of Western Development. Available online at: http://www.scio.gov.cn/m/xwfbh/xwbfbh/wqfbh/2007/0301/Document/324548/324548.htm (accessed February 27, 2022).
Tu, J. (2011). Spatially varying relationships between land use and water quality across an urbanization gradient explored by geographically weighted regression. Appl. Geogr. 31, 376–392. doi: 10.1016/j.apgeog.2010.08.001
Wang, M., Zhu, Y. F., Gong, S. W., and Ni, C. Y. (2021). Spatiotemporal differences and spatial convergence of the water-energy-food-ecology Nexus in Northwest China. Front. Energy Res. 9:665140. doi: 10.3389/fenrg.2021.665140
Wen, C. L., Dong, W. H., Zhang, Q. C., He, N. N., and Li, T. (2022). A system dynamics model to simulate the water-energy-food nexus of resource-based regions: a case study in Daqing City, China. Sci. Total Environ. 806:150497. doi: 10.1016/j.scitotenv.2021.150497
White, D. J., Hubacek, K., Feng, K., Sun, L., and Meng, B. (2018). The water-energy-food Nexus in East Asia: a tele-connected value chain analysis using inter-regional input-output analysis. Appl. Energy 210, 550–567. doi: 10.1016/j.apenergy.2017.05.159
Wiedmann, T. (2009). A review of recent multi-region input-output models used for consumption-based emission and resource accounting. Ecol. Econ. 69, 211–222. doi: 10.1016/j.ecolecon.2009.08.026
Wong, W. D., and Jay, L. (2008). Book Statistical Analysis of Geographic Information with ArcView Gis and ArcGis. Beijing: China Financial & Economic Publishing House.
Xu, S., Wu, T., and Zhang, Y. (2020). The spatial-temporal variation and convergence of green innovation efficiency in the Yangtze River Economic Belt in China. Environ. Sci. Pollut. Res. 27, 26868–26881. doi: 10.1007/s11356-020-08865-3
Xu, S. C., and Liang, H. (2020). Study of the utilization efficiency and its influencing factors of water resources in yangtze river economic belt. J. Phys. Conf. Ser. 1549:022017. doi: 10.1088/1742-6596/1549/2/022017
Xu, X., Pan, L. C., Ni, Q. H., and Yuan, Q. Q. (2021). Eco-efficiency evaluation model: a case study of the yangtze river economic belt. Environ. Monit. Assess. 193:457. doi: 10.1007/s10661-021-09228-2
Yu, H. L., and Ling, Y. J. (2020). Study on the measurement of provincial energy efficiency and its influencing factors in yangtze river economic belt under environmental constraints. Basic Clin. Pharmacol. Toxicol. 126, 230–230.
Yuan, L., Li, R. Y., He, W. J., Wu, X., Kong, Y., Degefu, D. M., et al. (2022). Coordination of the industrial-ecological economy in the Yangtze River Economic Belt, China. Front. Environ. Sci. 10:882221. doi: 10.3389/fenvs.2022.882221
Zhang, T. M., and Xu, Y. J. (2019). Evaluation on the efficiency of water-energy-food Nexus based on data envelopment analysis (DEA) and malmquist in different regions of China. Int. J. Comput. Intellig. Syst. 12, 1649–1659. doi: 10.2991/ijcis.d.191209.002
Zhao, L. S., and Liu, S. J. (2022). Coupling and spatial correlation of water-energy-food system of prefecture-level cities in the Yellow River Basin. J. Water Resour. Water Eng. 33, 1–10.
Zheng, D. F., An, Z. Y., Yan, C. L., and Rina, W. (2022). Spatial-temporal characteristics and influencing factors of food production efficiency based on WEF nexus in China. J. Clean. Product. 330:129921. doi: 10.1016/J.JCLEPRO.2021.129921
Zheng, J. Z., Wang, W. G., Chen, D., Cao, X. C., Xing, W. Q., Ding, Y. M., et al. (2019). Exploring the water-energy-food nexus from a perspective of agricultural production efficiency using a three-stage data envelopment analysis modelling evaluation method: a case study of the middle and lower reaches of the Yangtze River, China. Water Policy 21, 49–72. doi: 10.2166/wp.2018.184
Keywords: water–energy–food nexus, input–output efficiency, DEA-BCC, standard deviational ellipse, Yangtze River Economic Belt
Citation: Ni Y and Chen Y (2022) Spatial–temporal distribution measurement of input–output efficiency of the water–energy–food nexus of the Yangtze River Economic Belt, China. Front. Ecol. Evol. 10:944397. doi: 10.3389/fevo.2022.944397
Received: 15 May 2022; Accepted: 15 August 2022;
Published: 09 September 2022.
Edited by:
Amir Molajou, Iran University of Science and Technology, IranReviewed by:
Lu Lin, China University of Petroleum, ChinaElham Soleimanian, Iran University of Science and Technology, Iran
Chuanhao Wen, Yunnan University, China
Liang Yuan, China Three Gorges University, China
Copyright © 2022 Ni and Chen. This is an open-access article distributed under the terms of the Creative Commons Attribution License (CC BY). The use, distribution or reproduction in other forums is permitted, provided the original author(s) and the copyright owner(s) are credited and that the original publication in this journal is cited, in accordance with accepted academic practice. No use, distribution or reproduction is permitted which does not comply with these terms.
*Correspondence: Yan Chen, sanchen007@njfu.edu.cn