Prediction of wastewater treatment system based on deep learning
 Wei Lin
 Yu Hanyue
 Li Bin
- School of Management Science and Engineering, Dongbei University of Finance and Economics, Dalian, China
Introduction: In order to accurately model the IC reactor of the wastewater treatment system and efficiently control and adjust the water treatment process, this paper proposes a method to predict the operation effect of the IC reactor using an artificial neural network model. This paper takes the IC reactor section of a papermaking wastewater treatment plant as the research object, and predicts the COD value of its effluent through the neural network model established. The experimental results show that the simulation prediction value of BP neural network is basically consistent with the change trend of the actual value, and has a certain prediction ability. Among the 20 groups of sample data for simulation prediction, the prediction relative error value of 9 sample data pairs is less than 5%, that is, the prediction error of 45% sample data pairs is within 5%; The relative error value of 15 sample data pairs is less than 10%, that is, 75% of sample data pairs have a prediction error of less than 10%; The maximum relative error is 18.6%. Through the regression analysis of the real value and the predicted value, the correlation coefficient is 0.7431.
Conclusion: The BP neural network can capture the non-linear mapping relationship between the selected input factors and the output, and can predict the COD value of the effluent of IC reactor in advance.
Introduction
W With the continuous development of China’s economy, the total amount of sewage discharge across the country is increasing, reaching 69.9 billion tons in 2018, and the situation of water pollution is becoming increasingly severe. In this context, water pollution control and water resource recycling have become important solutions to solve water resource problems, and sewage treatment plants have played an important role in them: sewage after treatment can not only prevent environmental pollution, but also be recycled (such as irrigation water), and sludge generated in the treatment process can also be reused as crop fertilizer, Therefore, sewage treatment not only protects the environment but also improves resource utilization (Zhao et al., 2021). With the attention and substantial investment of the state, China’s sewage treatment industry is growing rapidly and rapidly. The sewage treatment rate has increased from 14.86% in 1991 to 95.49% in 2018. However, there are also many thorny problems, which can be summarized in two aspects: 1. Operation and management are difficult. The quality and quantity of influent water are not stable, and the daily operation of the sewage treatment plant can only be adjusted manually and passively according to the current water quality and quantity, but cannot be prepared in advance. This is due to the fact that traditionally, data management is mainly based on document records and paper forms, and it is difficult to use historical inflow data to provide timely data support and data analysis for operation management, expansion and reconstruction, thus making it difficult for the sewage plant to be in the best operating state. 2. Operation management relies on practical experience, which leads to extensive management mode, high operation cost and low degree of automation. Traditionally, the prediction of effluent quality depends on expert experience, which is a record of actual operation. It records whether specific influent water quality and resource allocation will cause the effluent quality to exceed the standard. However, the influent water quality is unstable and changes greatly, so it is easy to exceed the historical experience. Therefore, the prediction accuracy and robustness are low and lack of science. Due to the inaccurate prediction of the effluent quality, in practice, in order to ensure that the effluent quality reaches the standard, the sewage treatment plant often adopts extensive management. No matter what the incoming water quality is, excessive resources (such as excessive dosing and excessive air blowing) are allocated for pollutant treatment, resulting in resource waste and increased operating costs. Both the prediction of effluent quality and the allocation of resources in the sewage treatment process rely on human experience, resulting in high human costs. Moreover, the level of operation and management personnel is uneven and the mobility is large, which makes it difficult for the water plant to maintain a consistent level of operation and management. Figure 1 shows a wastewater advanced treatment system (Ma et al., 2021).
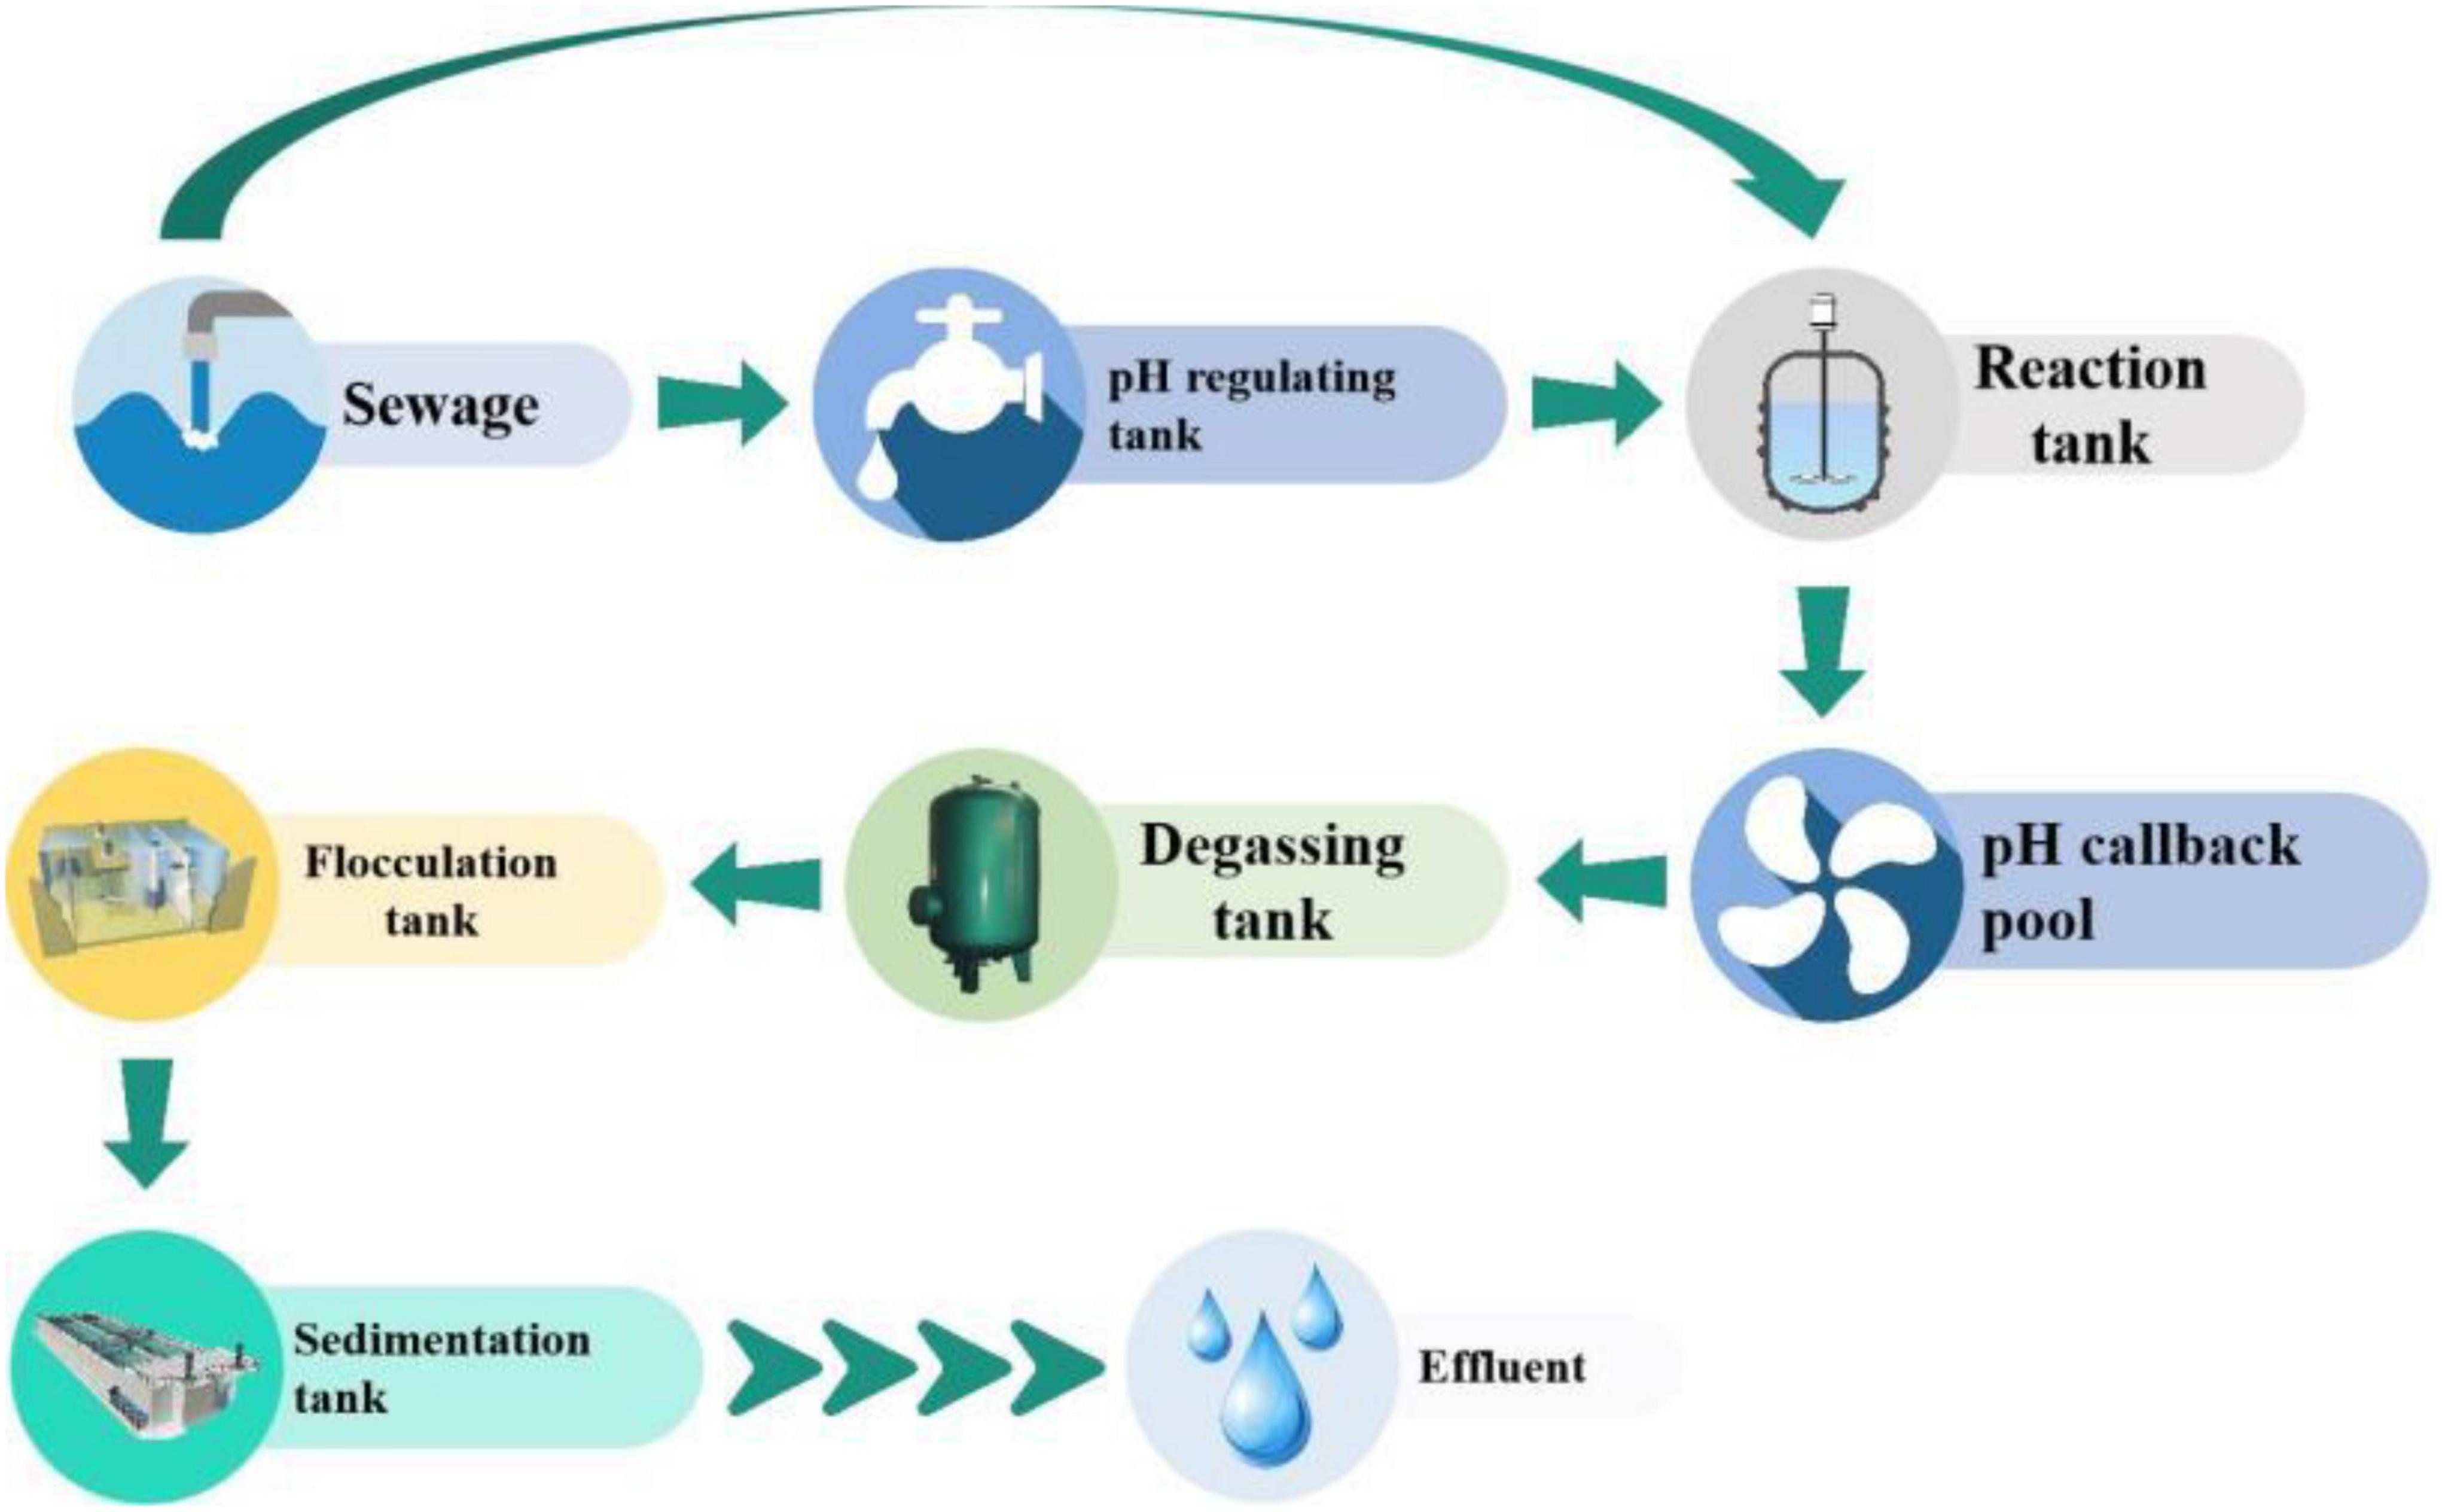
Figure 1. An advanced wastewater treatment system.
If the operation and management of sewage treatment plant as an environmental protection facility is poor, it may cause pollution and unnecessary energy consumption; If the operation cost is too high, it will cause negative benefits in business. Therefore, the above two problems restrict the sustainable development of the sewage treatment industry (Sun et al., 2021). In recent years, deep learning technology has made remarkable scientific research achievements in many fields, and its application in various fields has gradually become the accelerator and inevitable trend for the development of all walks of life. In this context, the operation and management of sewage treatment plants should be changed from the traditional extensive management mode to the information, automation and intelligent mode. Although the application of deep learning technology in many fields (such as character recognition and face recognition) has gradually developed, its application in sewage treatment is still in the exploratory research stage. The sewage treatment process will naturally generate a large number of historical influent water quality, effluent water quality, blower opening, chemical dosage (hereinafter referred to as dosage) and other operating data. However, the previous data management method mainly based on document records and paper forms makes it difficult to process and analyze large quantities of historical data. In recent years, sensor, database and server technologies have become more mature and their costs have declined. Existing sewage treatment plants have begun to use automatic methods to collect and manage data, which means that the application of deep learning technology has a data foundation.
Literature review
Since the 1970s, these countries have been committed to building urban sewage treatment plants, invested a lot of research in sewage treatment technology, accumulated rich experience in water treatment (Vian et al., 2020b). With the continuous improvement of sewage treatment level, in order to make the water quality reach a higher standard, developed countries have begun to improve the traditional sewage treatment process and research new technologies. A series of sewage treatment technologies, such as SBR, membrane adsorption filtration, biodegradation, and activated sludge, have been continuously applied to major sewage treatment plants. In 1971, Japan applied activated carbon technology to carry out systematic experiments in Kawasaki, Nagoya, and other regions, improving the sewage treatment capacity (Agm et al., 2020). In 1973, Sweden built several chemical treatment plants to treat sewage by chemical coagulation sedimentation, which provides an effective means to solve the problem of phosphorus removal from sewage. From the perspective of simplifying process, improving sewage treatment performance, or saving investment and freight, new aeration methods such as deep well aeration method and oxygen aeration method are attracting more and more attention. New sewage treatment processes such as oxidation ditch and biological rotary table are also constantly being developed and applied in practical production. After the sewage treatment technology has made great achievements and gained popularity, Western countries have turned their attention to the sewage treatment automatic control theory and advanced automatic control technology, invested a lot of money in the research and development of sewage treatment automatic process and equipment, successively developed various intelligent and environment-friendly sewage treatment automatic control instruments, improved the operation and detection of sewage treatment equipment, and effectively strengthened the management mode and process technology. Some advanced sewage treatment plants have gradually started to combine bus, communication and detection technologies. Through various instrument detection, computer data collection, upper computer monitoring and management, and using PLC to achieve unattended full-automatic process control. Newhart et al. (2021) and others developed a new disinfection model to accurately predict the performance of peracetic acid (PAA), which takes into account real-time changes in water quality. They used online and offline water quality data to train artificial neural networks and PAA at different positions before and after disinfection (Newhart et al., 2021). Du et al. (2020) others believed that compared with traditional activated sludge process, MBR has the advantages of good effluent quality, small floor area, low excess sludge yield and easy automatic control. Matheri et al. (2021) and others believed that model based on artificial intelligence has been widely verified in the operation and management of sewage treatment. They used the prediction model based on artificial intelligence, to study the relationship between COD and trace metals (Matheri et al., 2021).
The ultimate goal of sewage treatment is to make the effluent quality meet the standard. There are several effluent quality indicators in sewage treatment, which are important basis for evaluating whether the sewage treatment efficiency and discharge meet the standard. China has strict requirements on these effluent quality indicators.
Research methods
Test sample data
The test data comes from the operation data of wastewater treatment in a waste paper mill, and its anaerobic process is IC reactor. The designed wastewater treatment capacity of the plant is 200 m3/h (4800 m3/day) (Farhi et al., 2021; Mubarak et al., 2021). The IC reactor is a cylindrical steel structure with a diameter of 9.0 m, a height of 19.0 m and an effective volume of 1026.0 m3.
Selection of input factors
The neural network is a black box model, and the output results are determined by the input of the model. Therefore, the input factors of the model should first be able to stimulate the problem under study. In other words, the input of the model is the influencing factor of the problem under study. For a complex problem with multi factor coupling, the influencing factors are diverse, and even some factors are factors that have not been noticed in the current research process or can’t be described or verified even if they are noticed. There are scholars established a methane yield prediction model based on lignocellulosic biomass in the process of medium temperature solid anaerobic digestion (SS-AD) using artificial neural networks. Three neural network models were established in this paper. The first model did not make any choice based on the collected data, and took all variables as model inputs; The second model selects the important variables determined in the multiple linear regression as the model input; The third model uses variables that are easy to measure or control as model inputs. The results show that the prediction correlation coefficient (R2) value of model 1 is 0.528, which is not satisfactory. The reason is that too many input variables make the model over fit, and model 2 shows a good prediction effect. The prediction effect of Model 3 is between Model 1 and Model 2, and further experimental data are needed to optimize. In practical projects, it is impossible to input all the influencing factors into the model. Generally, the main factors that affect the output will be selected. Under the condition that the output prediction results are acceptable and can be used for engineering guidance, the fewer input factors selected is the better, and these factors can be directly observed or easily measured and obtained compared with the research problems. This paper is to predict the effluent COD value of IC reactor, so the factors affecting the effluent COD value should be recognized first.
IC reactor is a typical anaerobic reactor, which mainly conducts anaerobic biological reaction. Anaerobic biological reaction mainly depends on the anaerobic digestion of a variety of anaerobic or facultative microorganisms to degrade complex organics and produce biogas with recyclable value. Therefore, the factors affecting the COD value of IC reactor effluent can be studied from the perspective of affecting the anaerobic digestion process. In the above four stages, part of the products in the former stage are the substrates in the later stage, such as volatile fatty acids (VFA). The accumulation of these substances in the reactor affects the balance of the whole reactor. According to the current research, the main factors affecting the operation of IC reactor include water temperature, pH, influent flow, influent COD, influent VFA, etc.
1) Temperature
The influence of temperature on anaerobic reaction process is, on the one hand, the influence on microbial activity. Temperature will affect the activity of enzymes in microorganisms and then affect the growth rate of microorganisms themselves and the utilization rate of nutrients; On the other hand, temperature is an important influencing factor of chemical reaction kinetics parameters, which will affect the biochemical reaction speed in the reactor. The effect of temperature on the hydrolysis and acidification stages of the digestion process is not significant, because in the mixed population, there are always some bacteria that are most suitable within the relevant range, while the acetic acid and methane production stages can only be completed by certain specific microorganisms (acetic acid and methane bacteria), which are very sensitive to temperature changes.
2) pH
pH value not only affects the life activities of anaerobic organisms, but also affects the acid-base balance in the reaction system, thus affecting the biochemical reaction in the reactor (Park et al., 2020). The optimal pH value of methanogens is 6.8–7.2, and the pH value of acid bacteria is higher. The pH value of the anaerobic system is usually maintained between the limits of methanogenesis to prevent the dominant role of acid bacteria leading to the accumulation of VFA. More importantly, pH affects the buffer capacity of the reactor, neutralizes VFA accumulated anywhere in the reactor, so as to prevent the formation of local acid zones in the digestive system and ensure the acid-base balance in the reaction system.
3) Inflow flow
The influent flow will affect the hydraulic conditions and hydraulic retention time in the reactor, thus affecting the state of granular sludge and the sludge water mixing effect in the system, and ultimately affecting the effluent effect. The influent COD load and influent flow rate jointly reflect the volume load of the reactor and have a direct impact on the effluent COD value.
4) Volatile fatty acids
Volatile fatty acids is the intermediate product of anaerobic degradation process and the substrate of methanogenic series reaction. If the substrate is easy to hydrolyze, the acidification fermentation process is a fast process, and the growth rate of methanogens is slower than that of acidic substances. Therefore, excessive organic load will lead to the accumulation of VFA in the reactor. It is generally believed that VFA accumulation is the result of unbalanced digestion reaction. When VFA accumulation occurs in anaerobic system, methanogenic activity will be seriously inhibited, and sludge quality will deteriorate.
In the actual process, the reactor not only takes place in various biological reaction processes, but also takes place in various complex physical and chemical reactions. In addition to the above factors, the characteristics of sewage (mainly referring to the changes in sewage characteristics caused by different papermaking production processes and products), the size and structure of reactors, and the quality of operators will affect the effluent COD value of IC reactors. However, once these factors are determined in the project, their impact on the operation effect of reactors will be basically determined, which can be regarded as the internal characteristics of reactors.
To sum up, this paper intends to take factors such as water temperature, influent pH, influent flow, influent COD, and influent VFA as the input factors of the neural network (Liu et al., 2021). However, according to the field treatment of wastewater, the incoming water temperature received by IC reactor is relatively constant, basically between 33 and 36, and the field record value is an integer, which means that the temperature index has only a small fluctuation. Such data input model will affect the learning ability of the model. Therefore, according to the actual situation of the modeling object in this paper, the water temperature factor is not used as the model input. Therefore, the selected input factors are: influent pH, influent flow, influent COD and influent VFA; The output factor is the COD value of reactor effluent.
Requirements for sample data
When the network structure and algorithm are determined, the training samples become the decisive factor of the neural network mapping and generalization ability. However, some literature shows that it is not the more training samples, the better the network training effect and generalization ability, or even the more training samples, the network has learned and cannot converge. Therefore, from the perspective of network training sample set, training samples should have three elements: compactness, ergodicity and compatibility. Therefore, sample pretreatment is generally required.
Acquisition of sample data
The input factors selected in this paper are: influent flow, influent COD, influent pH and influent VFA; The output factor is COD value of reactor effluent. According to the field monitoring data, the IC reactor was sampled twice a day at about 9:00 a.m. and 16:00 p.m. respectively. Therefore, in this paper, the sampling data in the morning (influent flow, COD, pH, and VFA) and the sampling data in the afternoon (effluent COD) are combined to form a sample data pair, and the data of 3 months from August to October 2017 are collected, of which 4 days of individual indicators are not recorded, so 88 sample data pairs are obtained. Table 1 shows the range of indicators of IC reactor inlet and outlet water. Due to the large amount of data, Table 2 shows the sorting results of monitoring data in the first 20 days (Vian et al., 2020a).

Table 1. Index range of IC reactor inlet and outlet water.
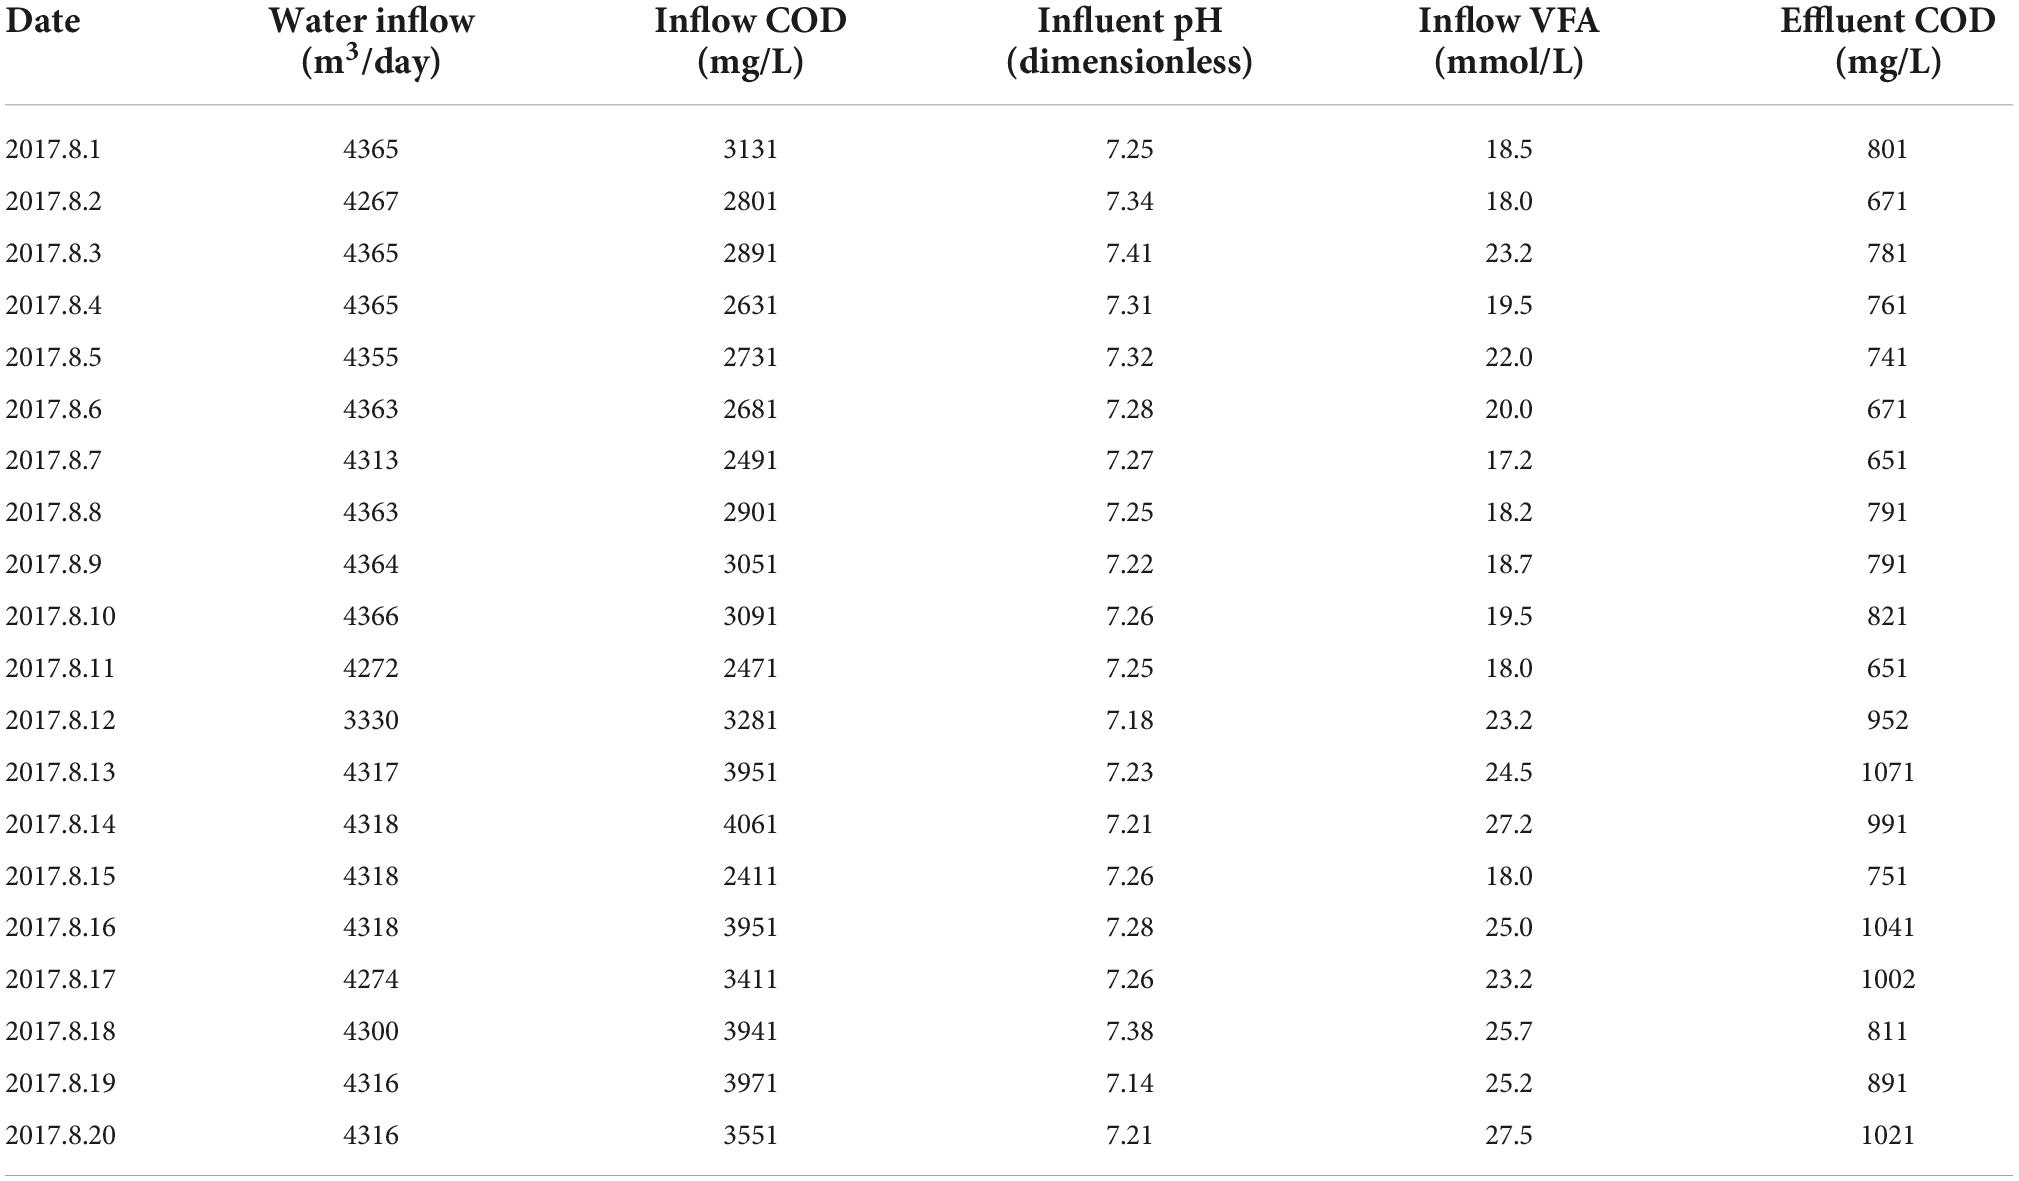
Table 2. Inlet and outlet water data of IC reactor.
Sample data pre-processing and analysis
1) Sample data pre-processing
Because the selected input factors have different units and orders of magnitude, if the original data is directly input into the neural network, the network will be “dominated” by factors with large values, and the internal links between the factors cannot be identified, so the establishment of the network model is meaningless. Therefore, in order to ensure the equal status of each factor before input, it is necessary to normalize the sample data, that is, let each input factor data take value in a unified interval. In this model establishment, the sample data is normalized according to the following formula, as shown in the following formula (1):
In the formula, xi, ximax, and ximin represent the first input data of an input factor and its maximum and minimum values, respectively, and E represents the i-th input data value after normalization. After normalization, the data of each input element will be distributed in the range of (0,1). Similarly, the output of the network should be normalized in the same way.
2) Principal component analysis of sample data
By analyzing the influence degree of each input variable, we can help identify the possible outliers in the sample set. Pareto diagram for principal component analysis is shown in Figure 2 (Megido et al., 2021).
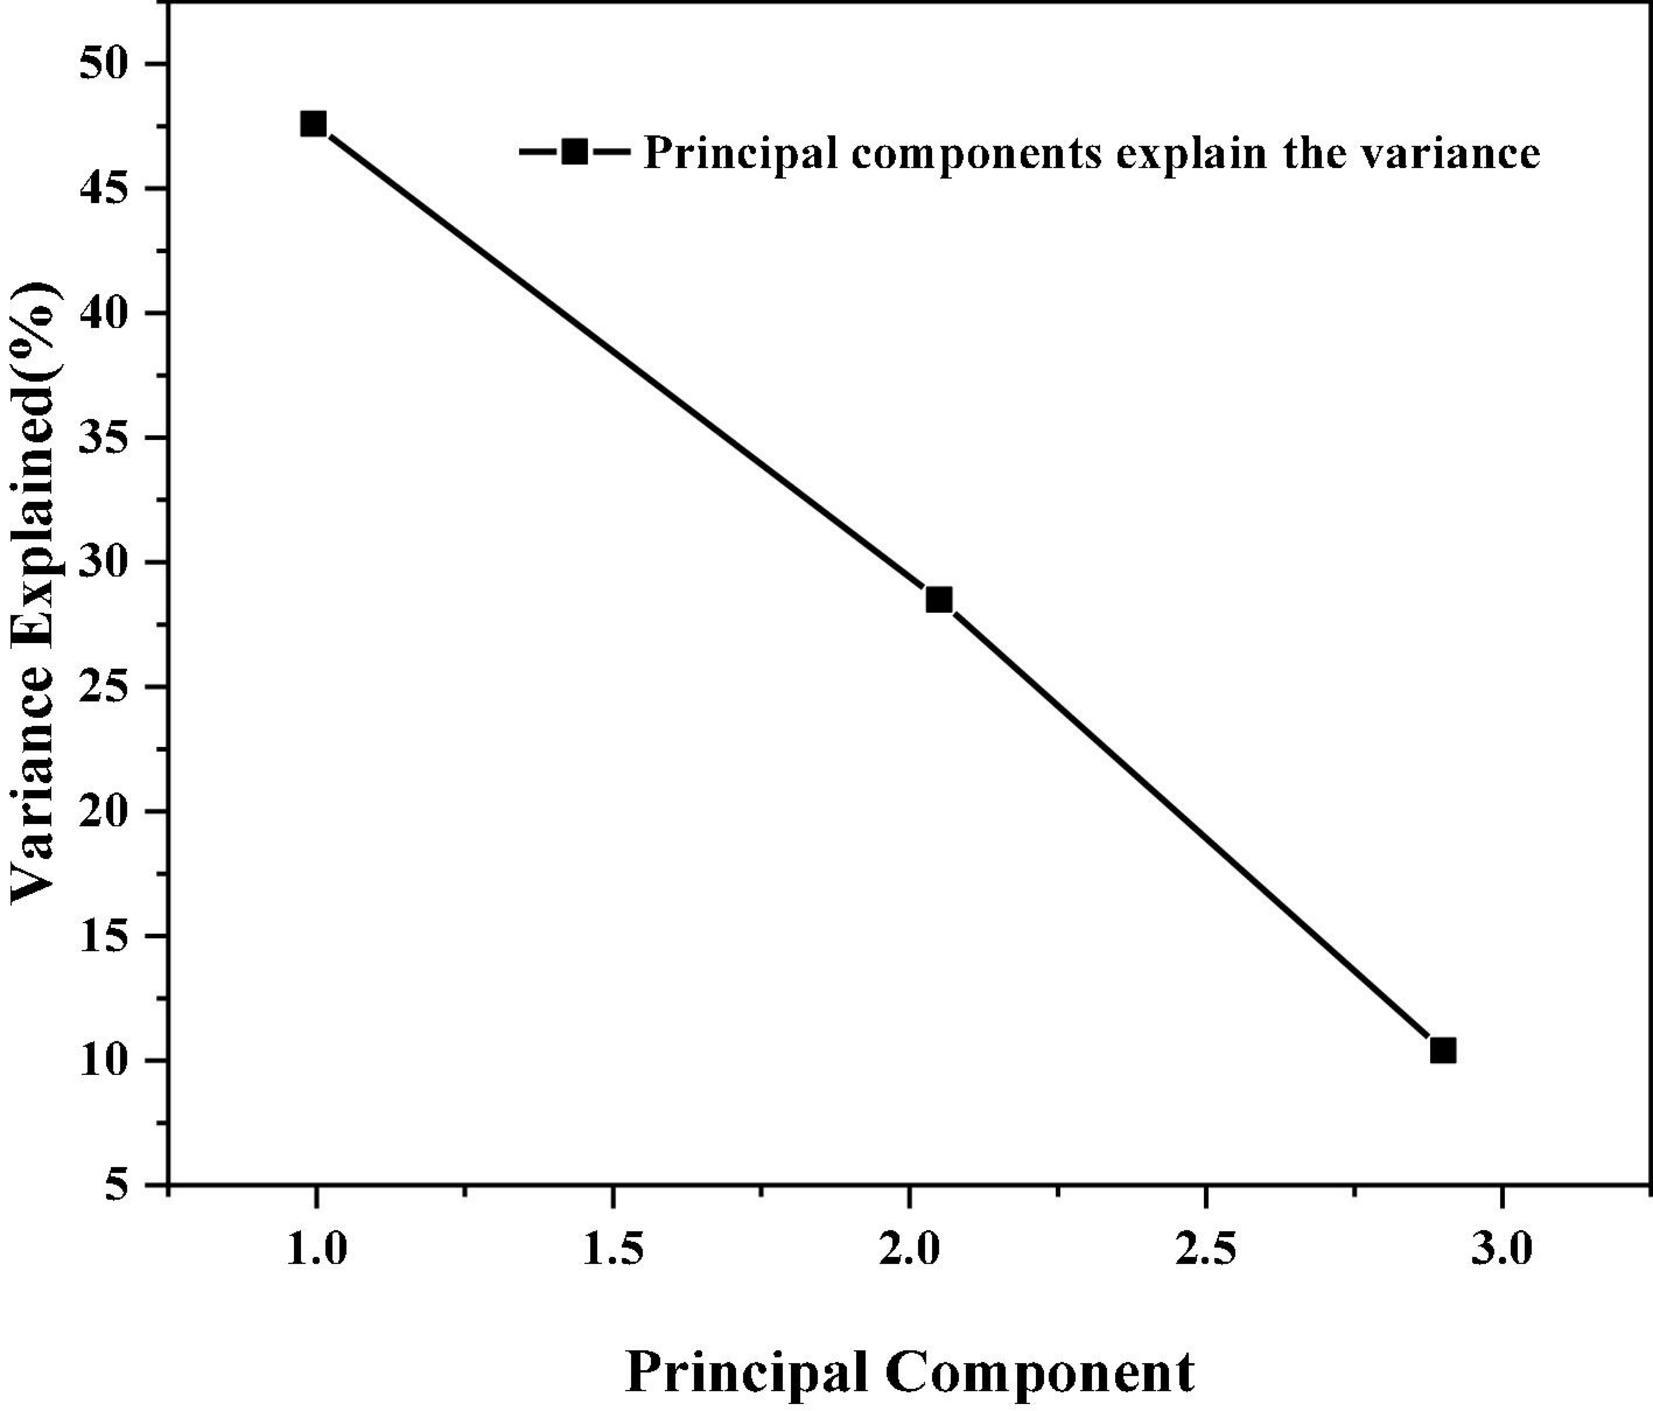
Figure 2. Pareto diagram of variance of principal component interpretation.
It can be seen from Figure 2 that the first three principal components account for more than 90% of the explained variance. Therefore, the possible outliers in the sample can be identified by analyzing the two-dimensional principal component background of the first three principal components. MATLAB programming is used to realize the distribution of sample data under the two-dimensional principal component background, and the return of the date corresponding to the specified point can be realized.
3) Cluster analysis of sample data
After removing the abnormal data, first calculate the Euclidean distance, Markov distance and absolute distance between each sample data after normalization, and then cluster the samples with the shortest distance method, the longest distance method, the center of gravity distance method and the average distance method, and calculate the cophentic correlation coefficient of the samples before and after clustering. The calculation results are shown in Table 3 below:
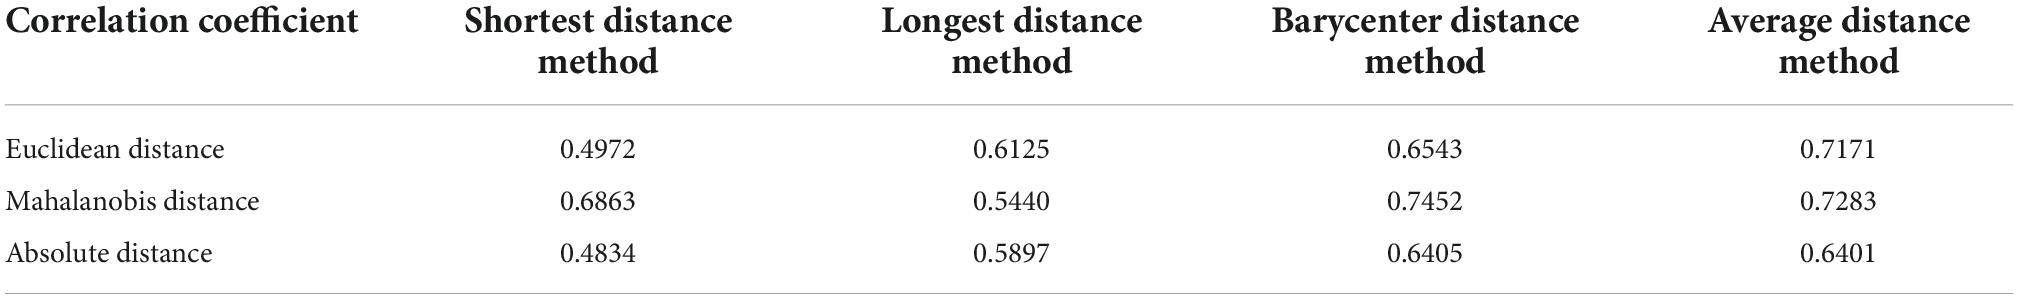
Table 3. Cophenetic correlation coefficient of neural network learning samples.
The cophentic correlation coefficient represents the degree of fitting between the data and the classification structure. The closer the size is to 1, the better the degree of fitting is. Therefore, Mahalanobis distance and barycenter distance are used to cluster the sample data, and a clustering tree is created. The 80 groups of data used for training and simulation have no significant deviation from the sample group.
Prediction model
There are many factors that affect the COD of effluent from papermaking wastewater treated by IC reactors. Each IC reactor has its own uniqueness due to its own structural design and different characteristics of the wastewater treated (Basinas et al., 2021). However, the data required for traditional reactor modeling is complex and difficult to measure. It is impossible to accurately express the complex non-linear mapping relationship between various factors and predict and control the operation effect of the reactor. This paper will use the advantages of artificial neural network to establish a BP neural network model for predicting the operation effect of IC reactor.
The essence of the prediction model of IC reactor operation effect based on BP neural network is that various factors that affect the IC reactor operation effect are used as input parameters to train the network, and use the self-learning ability of the network to constantly adjust the weight and threshold of the network, so that the output of the system is close to the actual monitoring value. The BP neural network model established in MATLAB2014 is as follows:
(1) The input layer is the factors that affect the operation of IC reactor. The input factors selected in this paper are, respectively, the influent flow, influent COD, influent VFA and influent pH, so the number of nodes in the input layer is 4.
(2) The number of hidden layers is one, and the number of nodes is P. Generally, P is obtained by experience or trial and error.
(3) The output layer is the measured effluent COD value of IC reactor, so the number of nodes in the output layer is 1.
Divide the processed data into two groups, one group is 60 sample pairs, which are used for the learning of BP network; Another group of 20 sample pairs is used for BP network simulation prediction.
Selection of learning parameters
At present, there is no perfect theoretical guidance for the selection of these parameters. In order to achieve the best prediction effect of the neural network, this paper uses trial calculation to determine the parameters. The basic idea is to adopt the fixed variable method, fix the value of some parameters while changing the value of another parameter, and select the one with the minimum average absolute error of the test sample as the optimal network.
The number of hidden layer nodes is tentatively determined to be 6, and the learning rate and learning error limit are changed in turn. Each case is run for 20 times, and the average value of the 5 operation results with the lowest average absolute error is calculated. The calculation results are shown in Tables 4–7 (Kang et al., 2020).
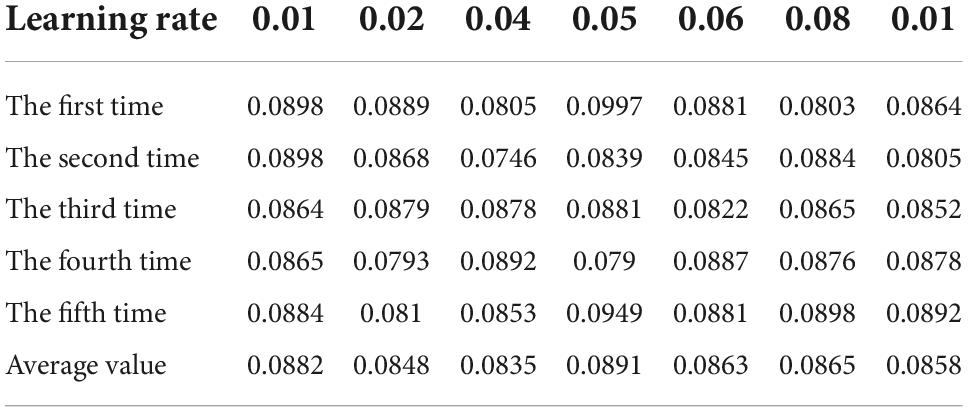
Table 4. Table of calculated average absolute error when the error limit is 0.1.
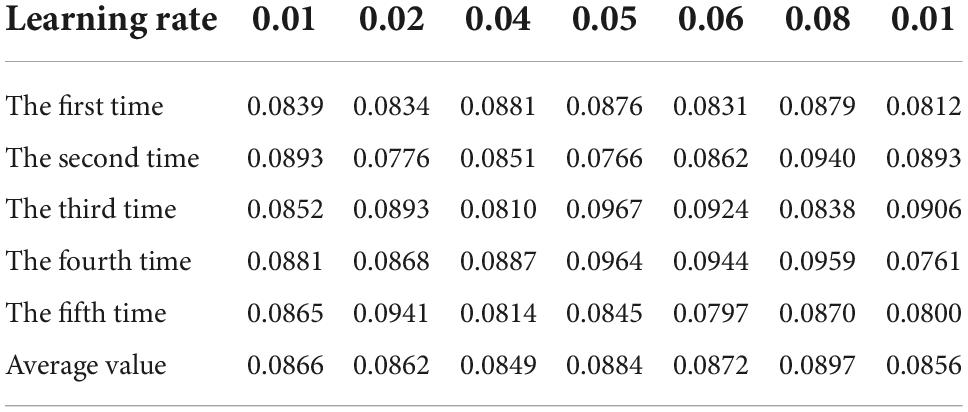
Table 5. Table of calculated average absolute error when the error limit is 0.05.
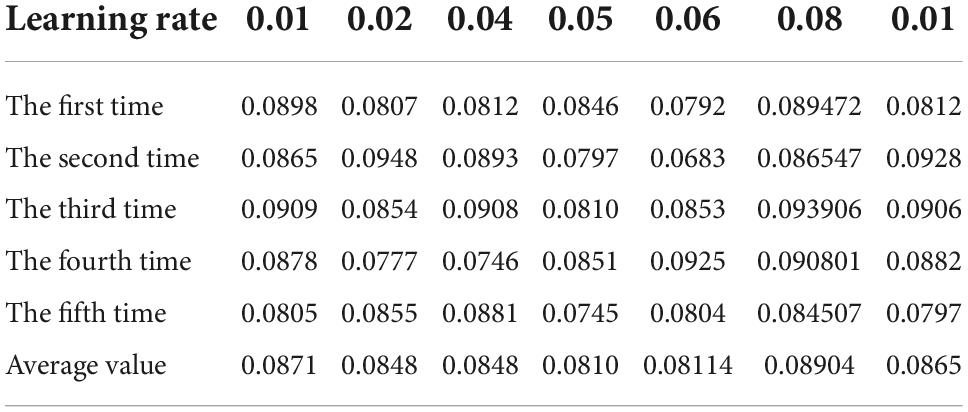
Table 6. Table of calculated average absolute error when the error limit is 0.02.
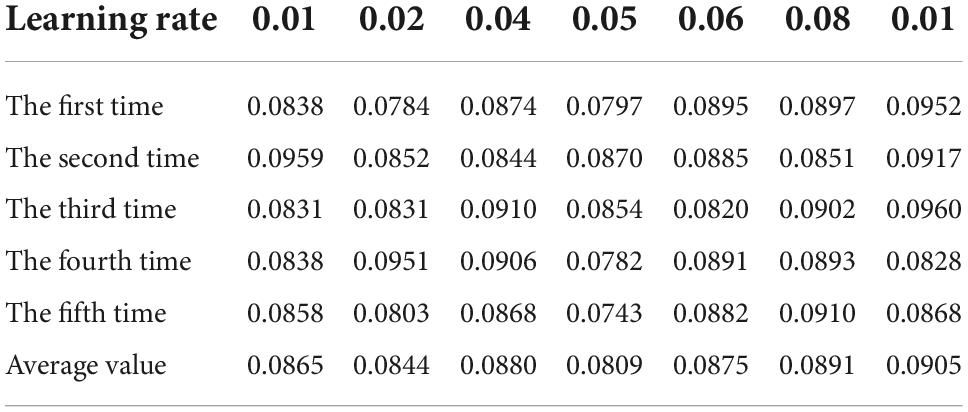
Table 7. Table of average absolute error calculated when the error limit is 0.01.
It can be seen from Tables 4–7 that when the learning rate is set to 0.05 and the learning error limit is set to 0.01, the average absolute error of calculation is the minimum, so it is set as the BP neural network calculation parameter (Anhad et al., 2021). Next, we will consider the optimal number of hidden layer nodes under the operating parameters. The program operation results are shown in Table 8.
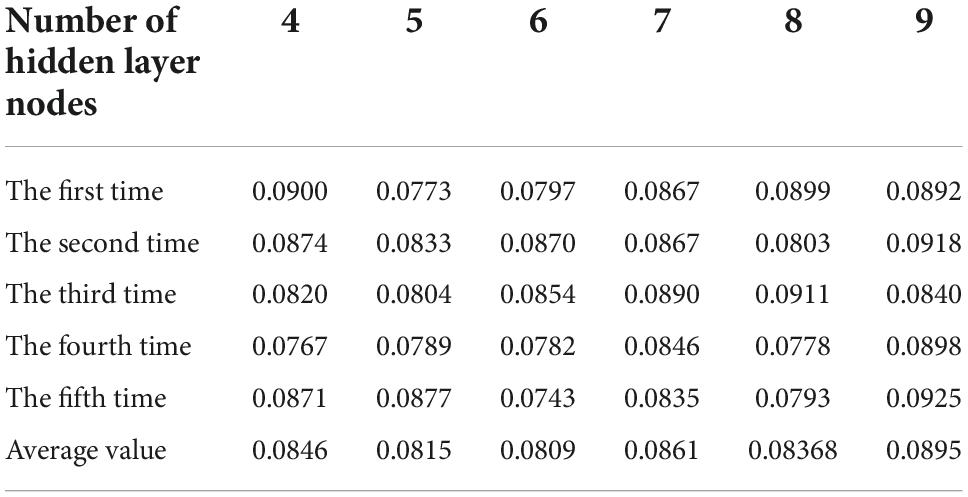
Table 8. Table of average absolute error in calculation of node number of different hidden layers.
It can be seen from Table 8 that when the number of hidden layer nodes is set to 6, the BP neural network established can obtain the best simulation prediction effect. Therefore, the model parameters are selected as follows: learning rate 0.05, learning error limit 0.01, and number of hidden layer nodes 6.
Result analysis
Analysis of prediction results
According to the determined model parameters, the established BP neural network was simulated and predicted for 20 times. With the prediction average absolute error as the main observation index, the five calculation results with the best prediction effect were recorded. See Table 9 for the operation effect.
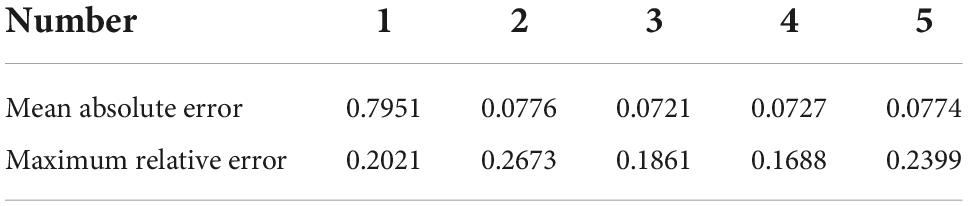
Table 9. Calculation results of BP network.
In the above five prediction results, the average absolute error of the third group is the smallest; The maximum relative error of the fourth group is the smallest. Generally, in practical projects, the evaluation of the model will focus on its average prediction effect, so this paper will analyze the operation results of the third group. The specific prediction results of 20 sample pairs are shown in Figures 3–5. The linear regression analysis between the real value and the predicted value is shown in Figure 6. The relative error value of the predicted data is shown in Table 10.
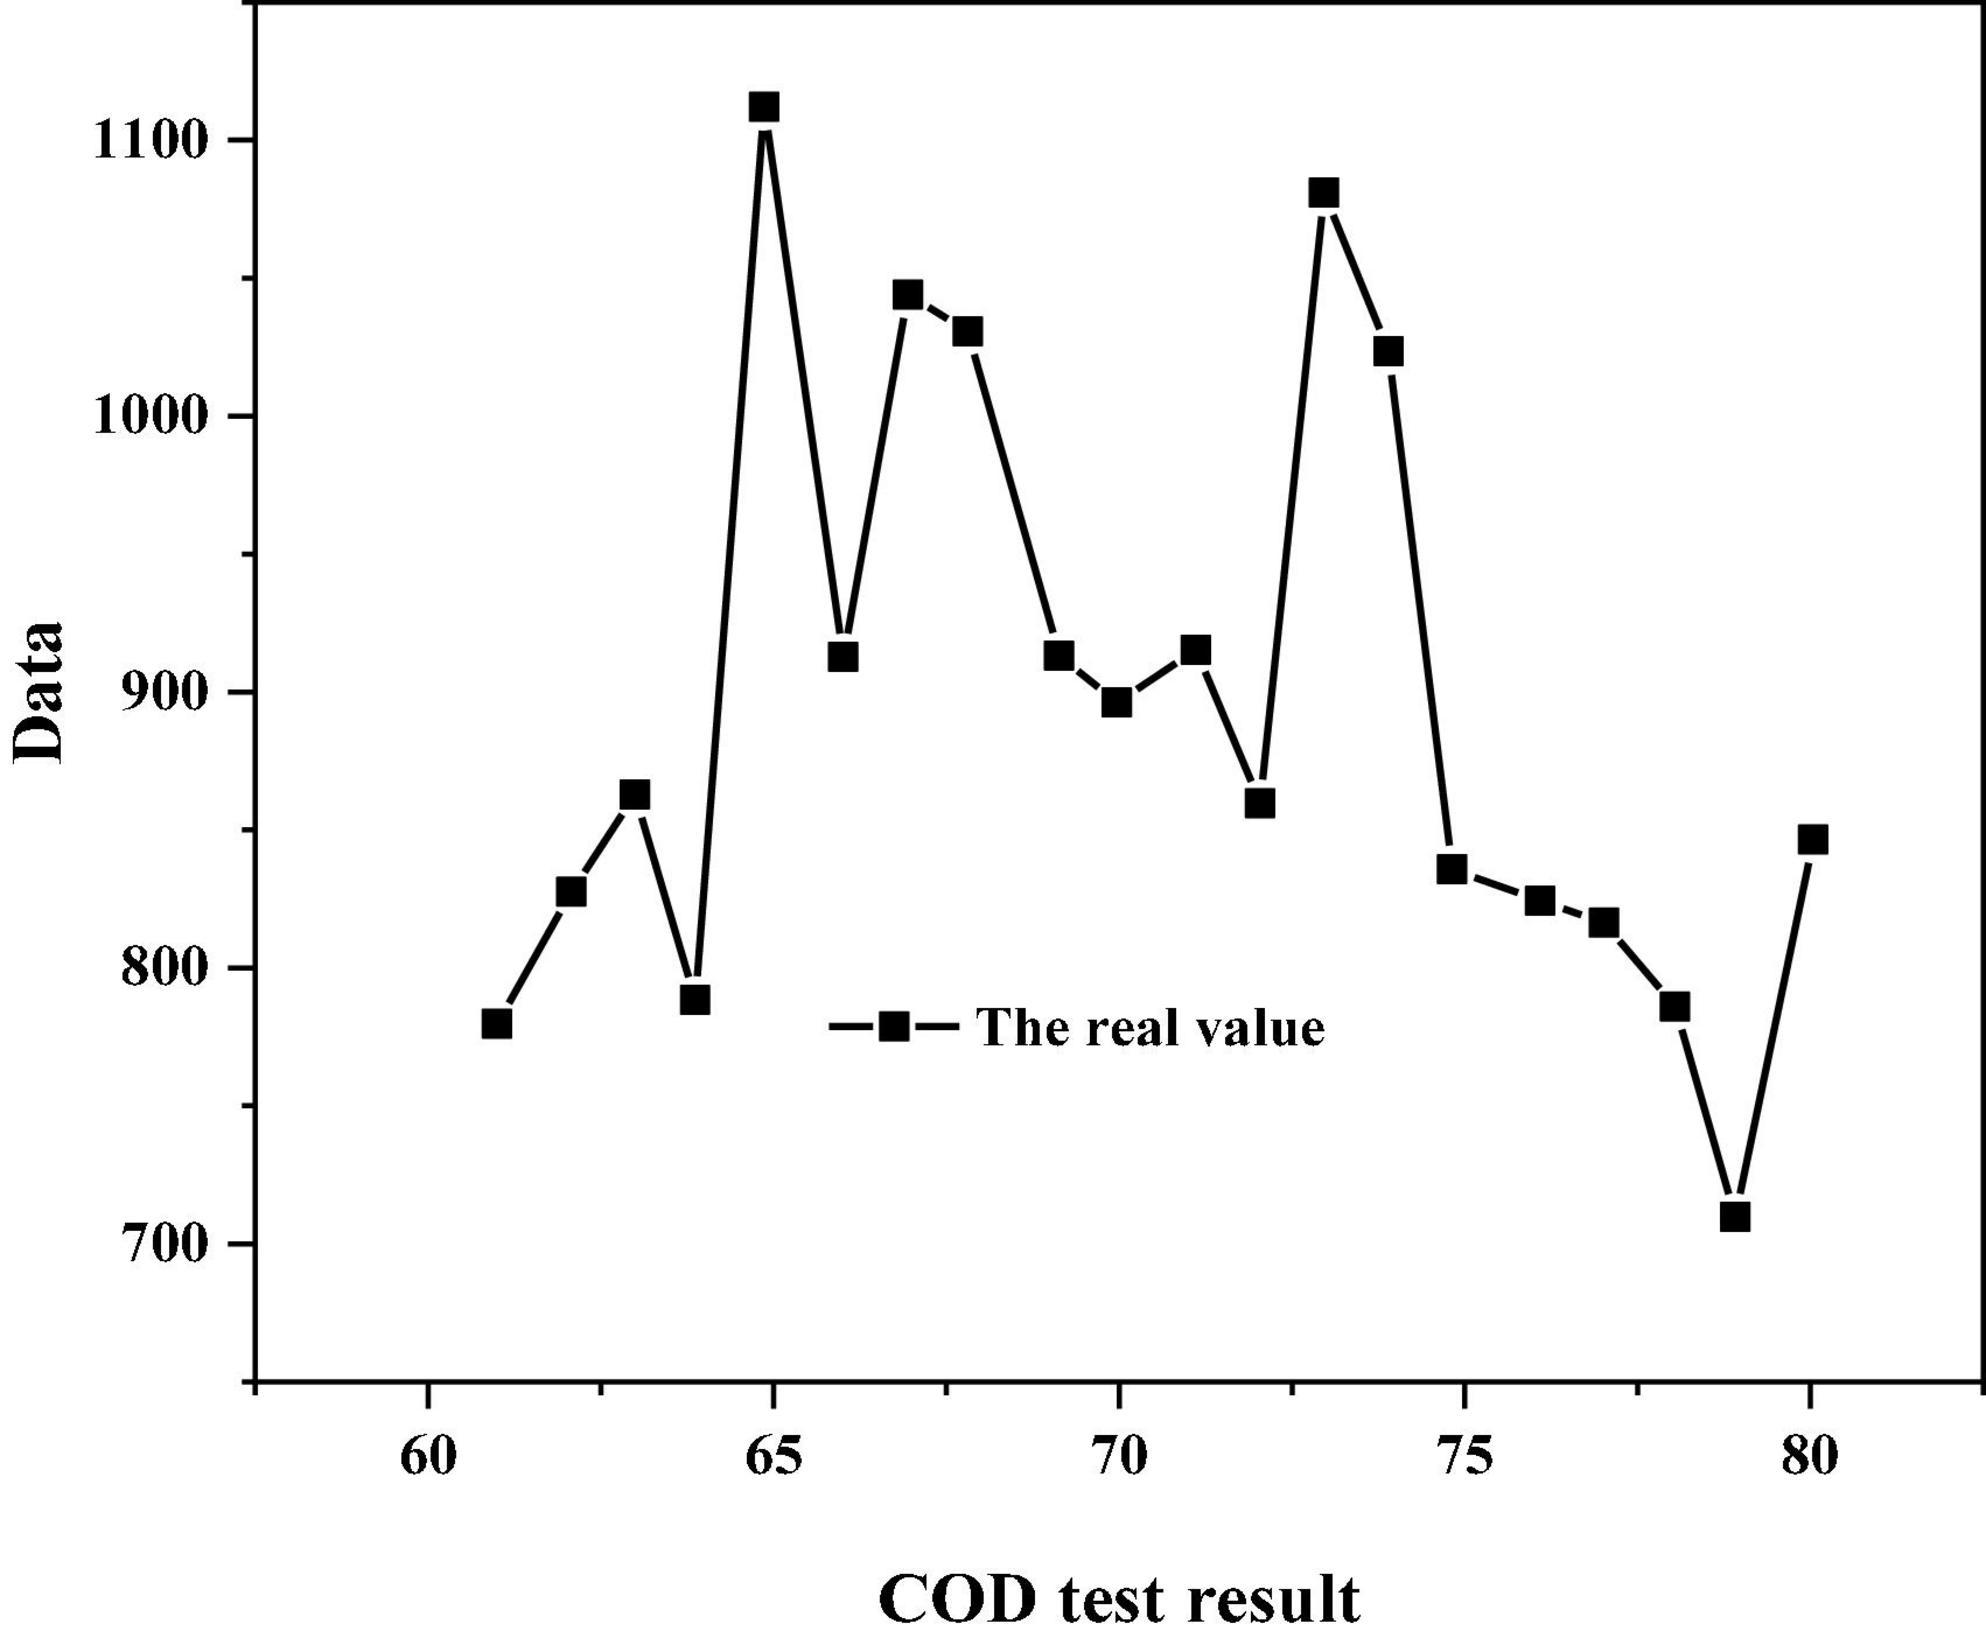
Figure 3. Real results of BP neural network simulation.
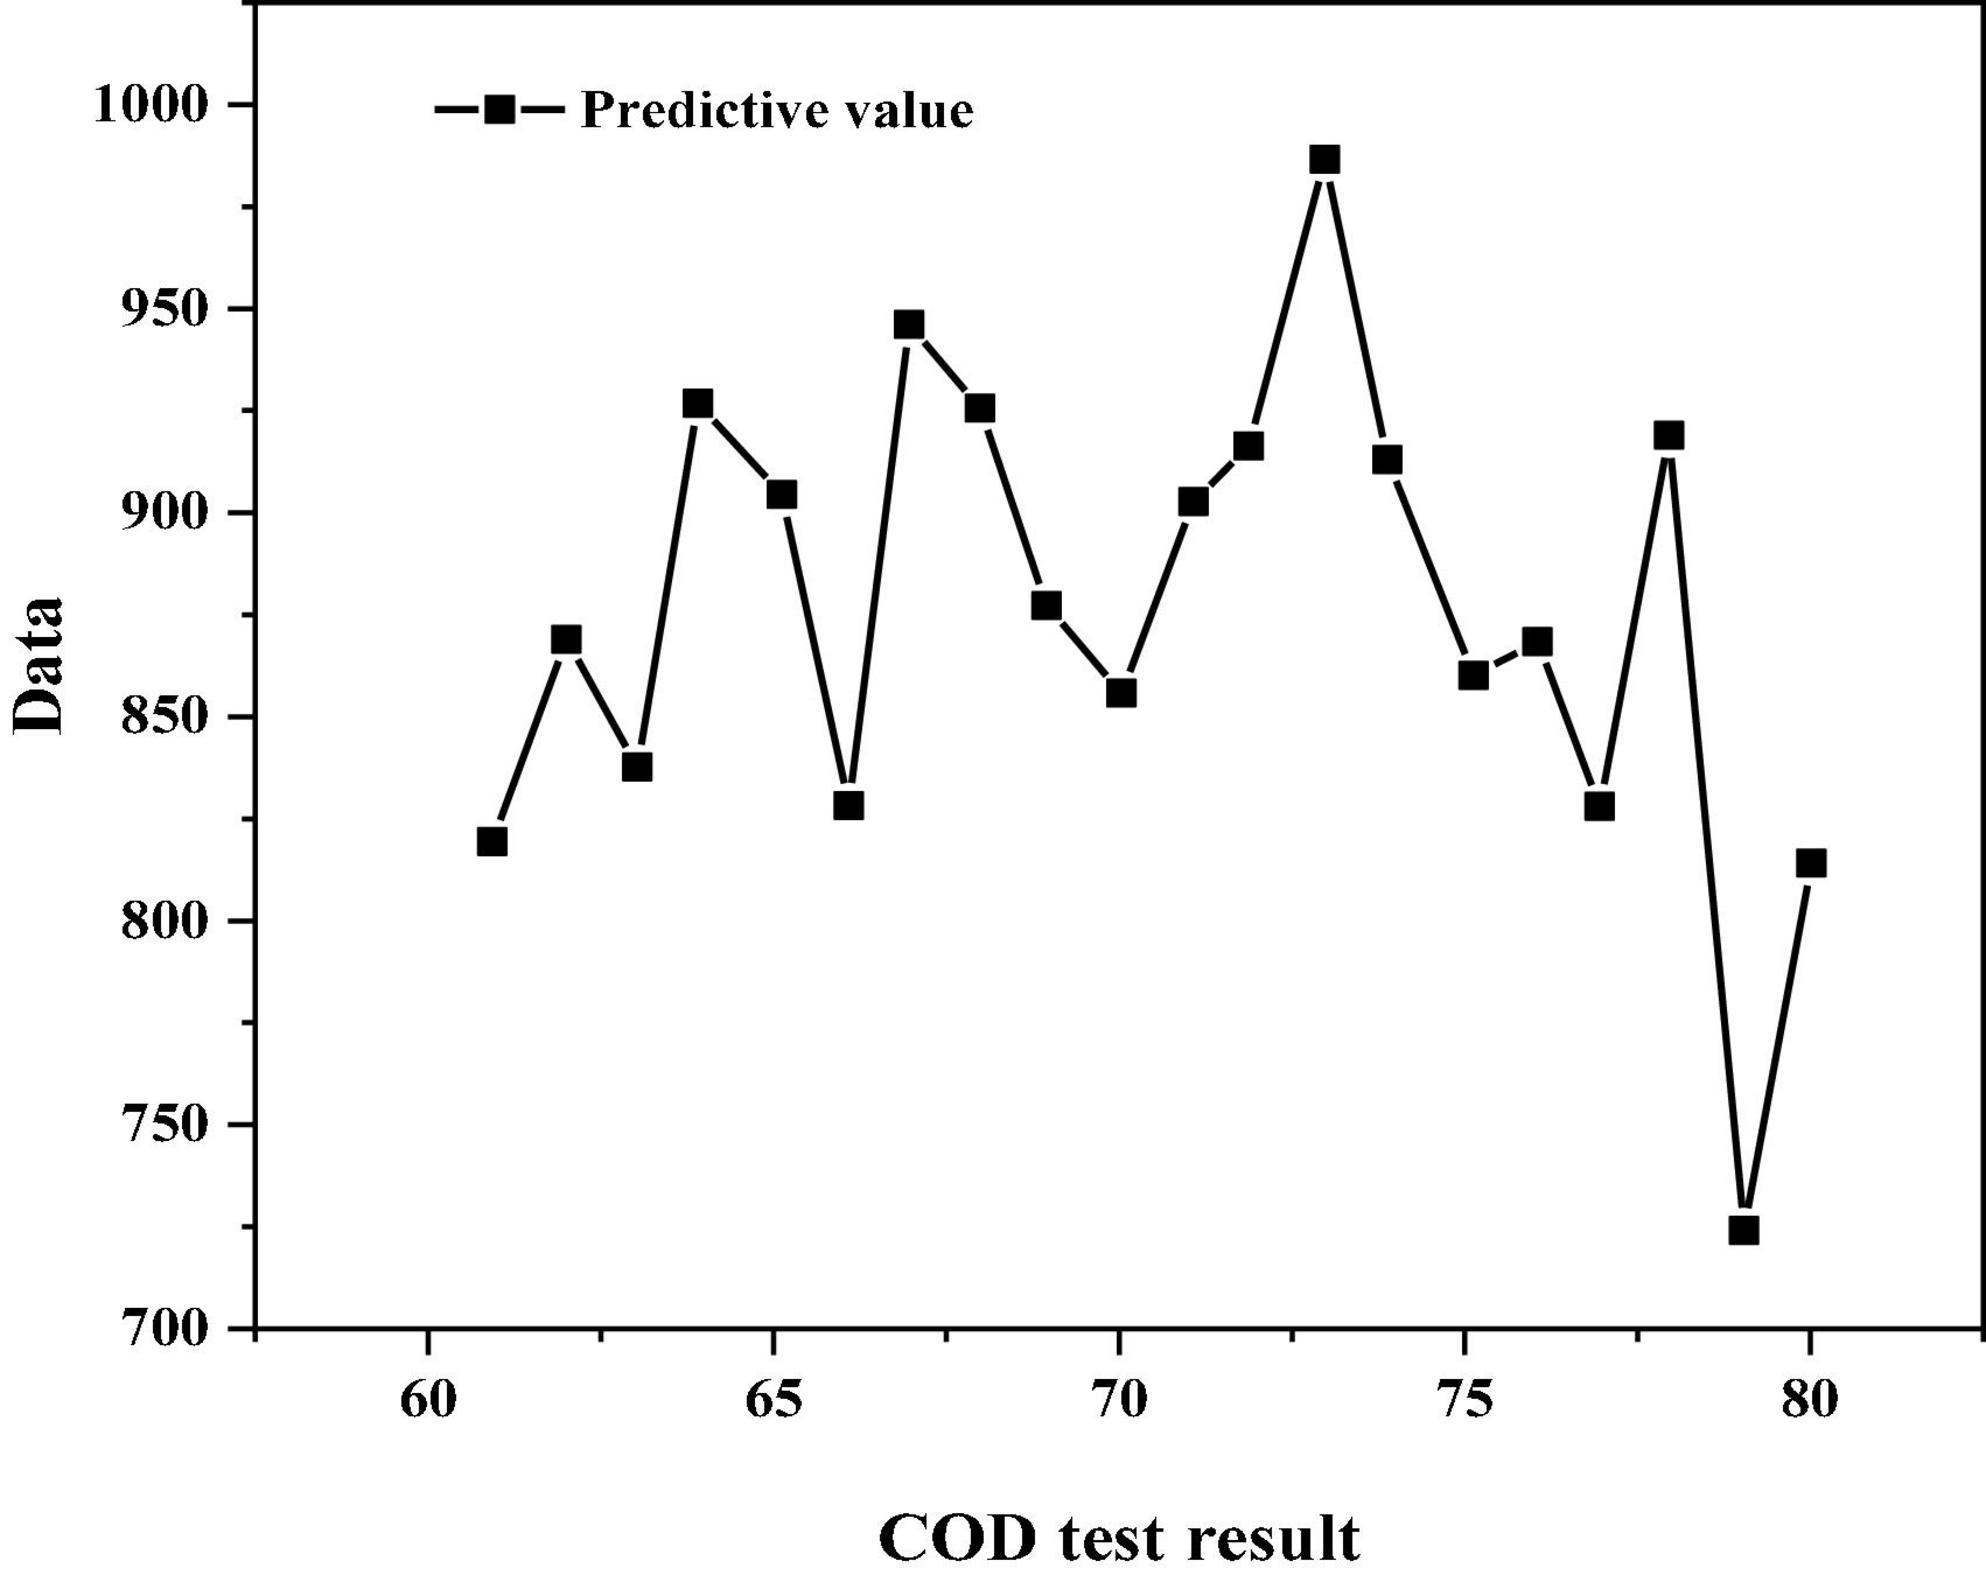
Figure 4. BP neural network simulation prediction results.
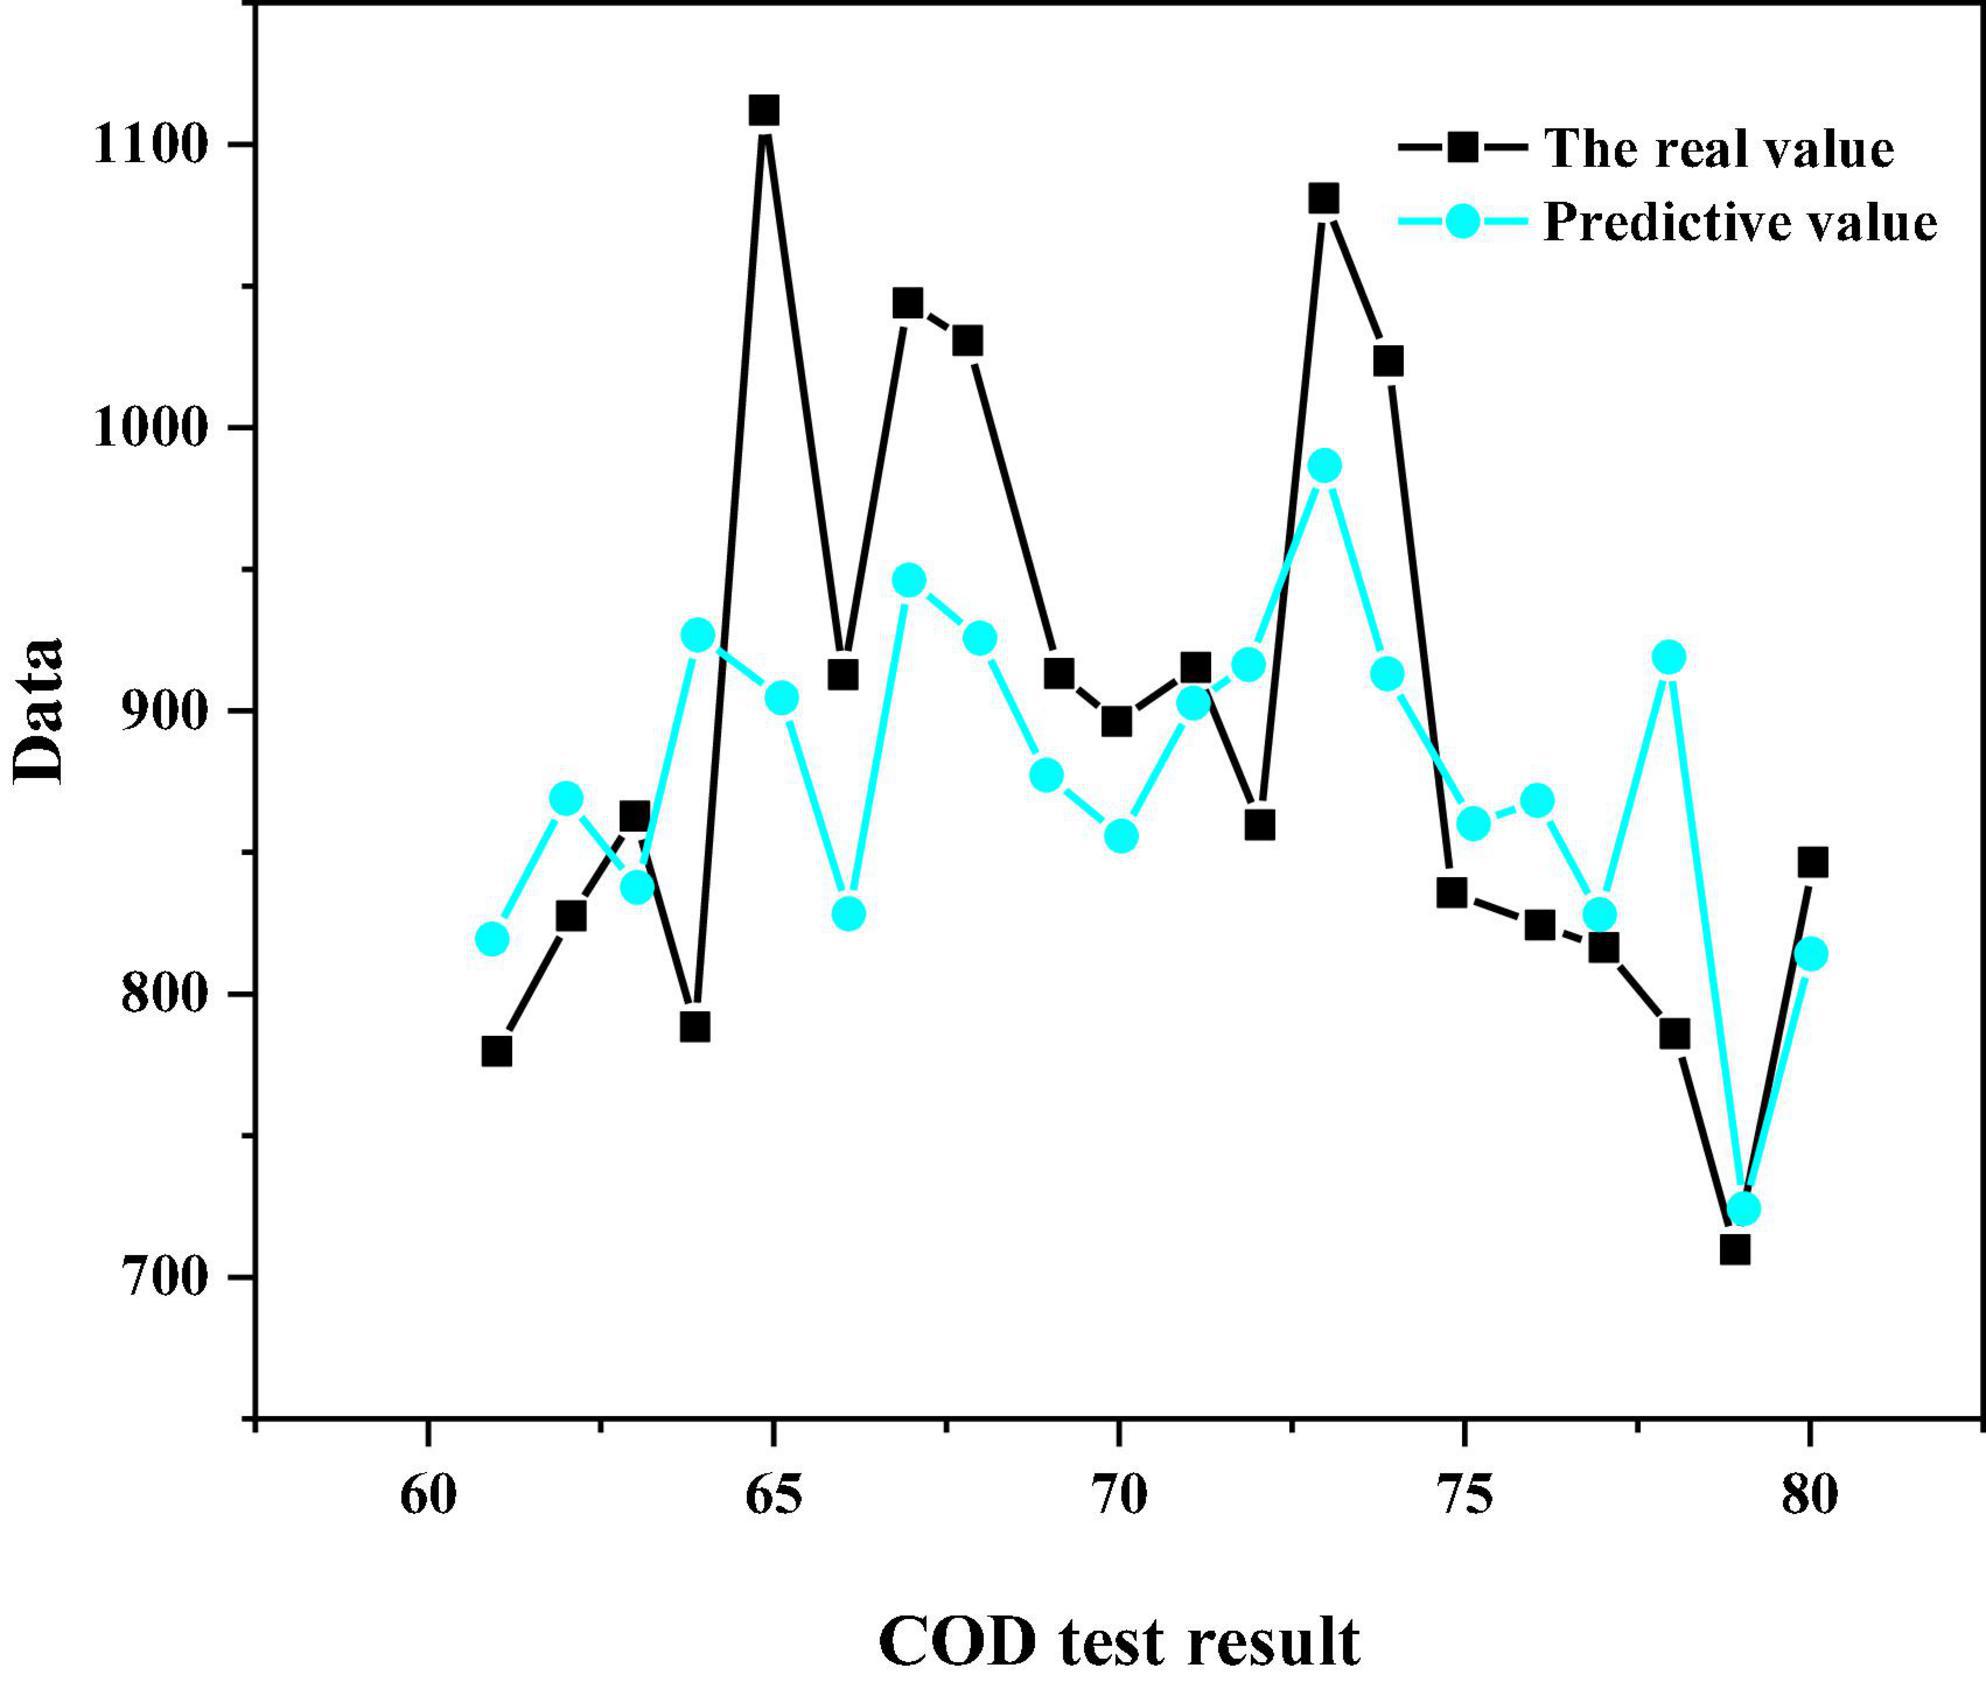
Figure 5. Comparison of BP neural network simulation results.
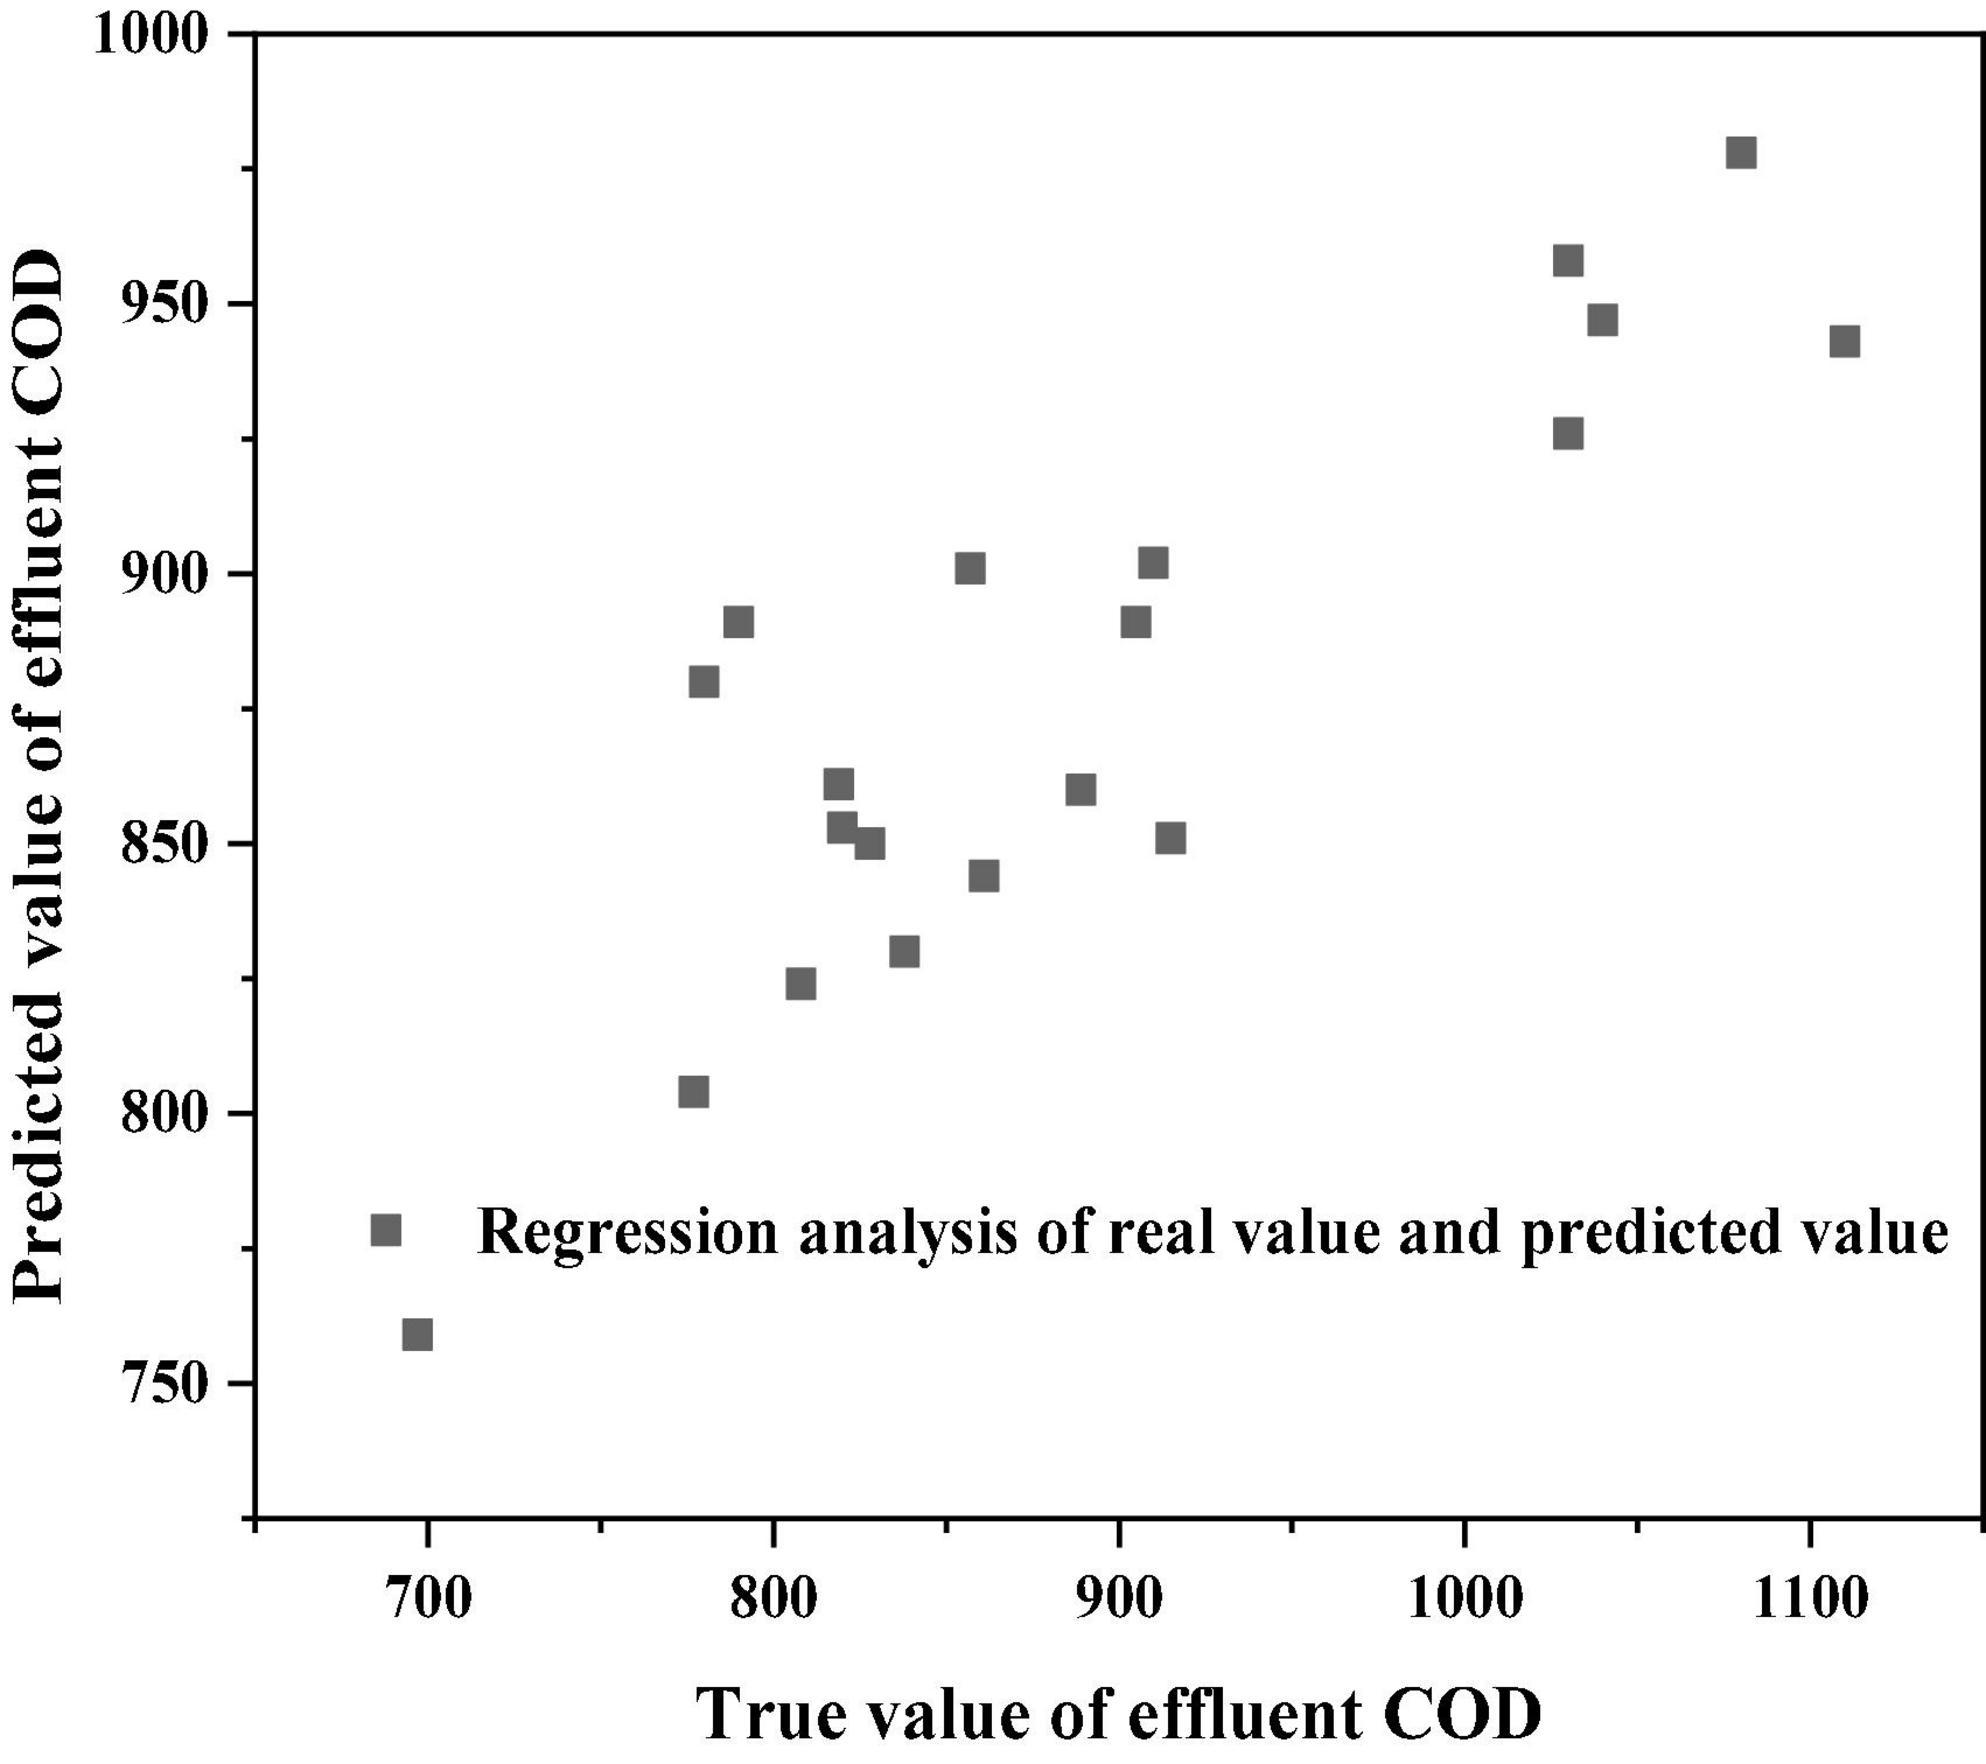
Figure 6. Regression analysis of real value and predicted value.
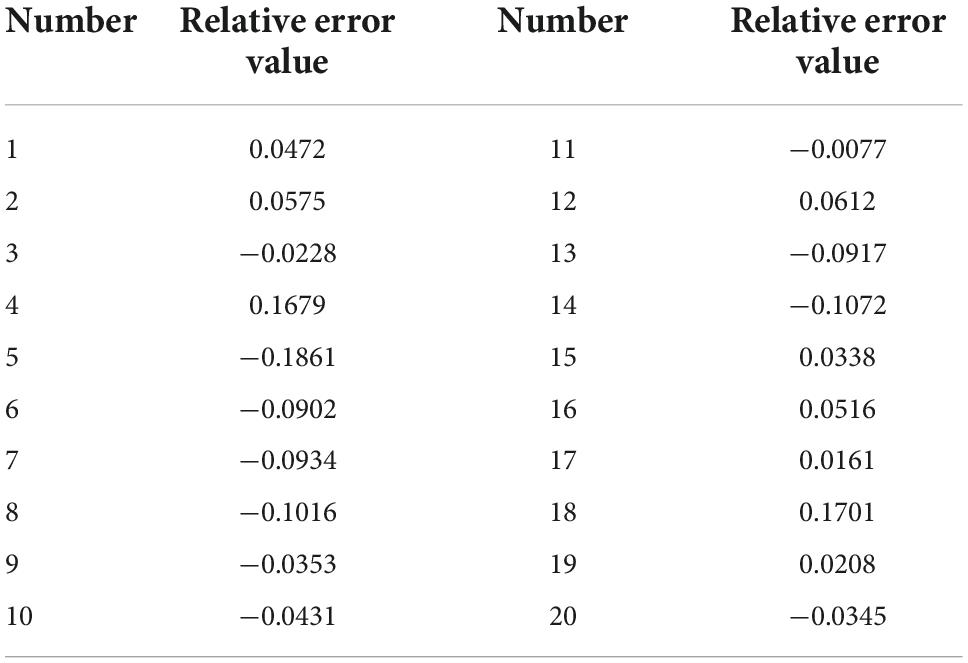
Table 10. Relative error of BP neural network simulation prediction.
It can be seen from Figures 3–5 that the simulation prediction value of BP neural network is basically consistent with the change trend of the actual value, which indicates that the established BP network can learn the internal non-linear mapping relationship between the influent indicators and the effluent COD value of the IC reactor, and has a certain prediction ability (Ren et al., 2020; Wu et al., 2021). It can be seen from Table 10 that among the 20 groups of sample data for simulation prediction, 9 groups of sample data pairs have prediction relative error values lower than 5%, that is, 45% of the sample data pairs have prediction errors within 5%; The relative error value of 15 sample data pairs is less than 10%, that is, 75% of sample data pairs have a prediction error of less than 10%; The maximum relative error is 18.6%.
To sum up, the BP neural network can learn the non-linear mapping relationship between the selected input factors and the output; The effluent effect of IC reactor can be effectively predicted in advance (Wang et al., 2021).
Conclusion
The application of artificial neural network to the prediction of COD value of IC reactor effluent in advance is helpful to provide a directional and principled scheme and basis for the operator to adjust the reactor and set the subsequent process conditions. In this chapter, appropriate input factors are selected according to the site conditions of the plant; Then, according to the sample data requirements, we have normalized the obtained sample data and eliminated the abnormal data; Finally, in MATLAB2014, this paper established an advanced prediction model for COD value of IC reactor effluent based on BP neural network, determined the learning rate, learning error limit and number of hidden layer nodes of BP neural network by using experience and trial and error methods, and analyzed the prediction results. The results show that the BP neural network can capture the non-linear mapping between the selected input factors and the output, and can predict the COD value of the effluent of IC reactor in advance; It also indicates that the selected input factors are reasonable.
Data availability statement
The original contributions presented in this study are included in the article/supplementary material, further inquiries can be directed to the corresponding author.
Author contributions
WL: data analysis and writing. YH: writing—reviewing and editing, manuscript review, and intellectual concept of the manuscript. LB: methodology. All authors contributed to the article and approved the submitted version.
Conflict of interest
The authors declare that the research was conducted in the absence of any commercial or financial relationships that could be construed as a potential conflict of interest.
Publisher’s note
All claims expressed in this article are solely those of the authors and do not necessarily represent those of their affiliated organizations, or those of the publisher, the editors and the reviewers. Any product that may be evaluated in this article, or claim that may be made by its manufacturer, is not guaranteed or endorsed by the publisher.
References
Agm, A., Claa, B., Tut, A., Lccl, A., Jrf, A., Ddl, B., et al. (2020). Biohydrogen and biomethane production from cassava wastewater in a two-stage anaerobic sequencing batch biofilm reactor. Int. J. Hydrog. Energy 45, 5165–5174.
Anhad, N., Gavand, A., Auti, M., Ishware, A., and Dewalkar, S. (2021). Development of soft computing model for design and analysis of wastewater treatment system. Int. J. Inf. Technol. 3, 1190–1203.
Basinas, P., Rusín, J., and Chamrádová, K. (2021). Dry anaerobic digestion of the fine particle fraction of mechanically-sorted organic fraction of municipal solid waste in laboratory and pilot reactor. Waste Manag. 136, 83–92. doi: 10.1016/j.wasman.2021.09.041
Du, X., Shi, Y., Jegatheesan, V., and Haq, I. U. (2020). A review on the mechanism, impacts and control methods of membrane fouling in mbr system. Membranes 10:24. doi: 10.3390/membranes10020024
Farhi, N., Kohen, E., Mamane, H., and Shavitt, Y. (2021). Prediction of wastewater treatment quality using lstm neural network. Environ. Technol. Innov. 23:101632. doi: 10.1016/j.envres.2022.113054
Kang, J. H., Song, J. H., Yoo, S. S., Lee, B. J., and Ji, H. W. (2020). Prediction of odor concentration emitted from wastewater treatment plant using an artificial neural network (ann). Atmosphere 11:784. doi: 10.3390/atmos11080784
Liu, R., Lin, Y., Ye, X., Hu, J., Xu, G., and Li, Y. (2021). Improved hydrogen production from pharmaceutical intermediate wastewater in an anaerobic maifanite-immobilized sludge reactor. RSC Adv. 11, 33714–33722. doi: 10.1039/d1ra02522h
Ma, Y., Li, L., Yin, Z., Chai, A., and Bi, Z. (2021). Research and application of network status prediction based on bp neural network for intelligent production line. Procedia Comput. Sci. 183, 189–196. doi: 10.1016/j.procs.2021.02.049
Matheri, A. N., Ntuli, F., Ngila, J. C., Seodigeng, T., and Zvinowanda, C. (2021). Performance prediction of trace metals and cod in wastewater treatment using artificial neural network. Comput. Chem. Eng. 149:107308. doi: 10.1016/j.compchemeng.2021.107308
Megido, L., Negral, L., Fernández-Nava, Y., Suárez-Pea, B., and Maraón, E. (2021). Impact of organic loading rate and reactor design on thermophilic anaerobic digestion of mixed supermarket waste. Waste Manag. 123, 52–59. doi: 10.1016/j.wasman.2021.01.012
Mubarak, A. S., Esmaili, P., Ameen, Z. S., Abdulkadir, R. A., and Ozsoz, M. (2021). Metro-environmental data approach for the prediction of chemical oxygen demand in new nicosia wastewater treatment plant. Desalin. Water Treat. 221, 31–40.
Newhart, K. B., Goldman-Torres, J. E., Freedman, D. E., Wisdom, K. B., Hering, A. S., and Cath, T. Y. (2021). Prediction of peracetic acid disinfection performance for secondary municipal wastewater treatment using artificial neural networks. ACS ESAndT Water 1, 328–338.
Park, J. G., Heo, T. Y., Kwon, H. J., Shi, W. Q., and Jun, H. B. (2020). Effects of voltage supply on the methane production rates and pathways in an anaerobic digestion reactor using different electron donors. Int. J. Hydrog. Energy 45, 9459–9468.
Ren, Q., Wang, X., Li, W., Wei, Y., and An, D. (2020). Research of dissolved oxygen prediction in recirculating aquaculture systems based on deep belief network. Aquacul. Eng. 90:102085. doi: 10.1016/j.aquaeng.2020.102085
Sun, C., Sheng, T., Li, L., and Yang, L. (2021). Biohydrogen production from traditional chinese medicine wastewater in anaerobic packed bed reactor system. RSC Adv. 11, 5601–5608. doi: 10.1039/d0ra09290h
Vian, J., Vigueras-Carmona, S. E., Velasco-Perez, A., Sánchez-Sánchez, K. B., and Puebla, H. (2020b). Hydrodynamics of a modified up-flow anaerobic sludge blanket reactor treating organic fraction of municipal solids waste. Int. J. Chem. Reactor Eng. 18, 755–760. doi: 10.1515/ijcre-2020-0024
Vian, J., Vigueras-Carmona, S. E., Velasco-Pé, A., and Puebla, H. C. (2020a). A novel up-flow anaerobic sludge blanket solid-state reactor for the treatment of fruit and vegetable waste. Environ. Eng. Sci. 37, 373–381. doi: 10.1089/ees.2019.0369
Wang, G., Jia, Q., Qiao, J., Bi, J., and Zhou, M. (2021). Deep learning-based model predictive control for continuous stirred-tank reactor system. IEEE Trans. Neural Network. Learn. Syst. 32, 3643–3652. doi: 10.1109/TNNLS.2020.3015869
Wu, X., Han, H., and Qiao, J. (2021). Data-driven intelligent warning method for membrane fouling. IEEE Trans. Neural Network. Learn. Syst. 12:691. doi: 10.1109/TNNLS.2020.3041293
Keywords: BP neural network, IC reactor, COD, deep learning, wastewater treatment system
Citation: Lin W, Hanyue Y and Bin L (2022) Prediction of wastewater treatment system based on deep learning. Front. Ecol. Evol. 10:1064555. doi: 10.3389/fevo.2022.1064555
Received: 08 October 2022; Accepted: 24 October 2022;
Published: 11 November 2022.
Edited by:
Hamzeh Ghorbani, Islamic Azad University, IranReviewed by:
Meysam Rajabi, Birjand University of Technology, IranSahar Lajmorak, Institute for Advanced Studies in Basic Sciences (IASBS), Iran
Copyright © 2022 Lin, Hanyue and Bin. This is an open-access article distributed under the terms of the Creative Commons Attribution License (CC BY). The use, distribution or reproduction in other forums is permitted, provided the original author(s) and the copyright owner(s) are credited and that the original publication in this journal is cited, in accordance with accepted academic practice. No use, distribution or reproduction is permitted which does not comply with these terms.
*Correspondence: Yu Hanyue, 1706250309@xy.dlpu.edu.cn