Constructing ecological security pattern based on spatio-temporal evaluation of ecosystem services and ecological health in Chengdu, Southwest China
 Bo Zhong
 Shuang Wu
 Ning Wu
 Geng Sun
 Chunmei He3
  Huai Chen
- 1China-Croatia “Belt and Road” Joint Laboratory on Biodiversity and Ecosystem Services, CAS Key Laboratory of Mountain Ecological Restoration and Bioresource Utilization and Ecological Restoration and Biodiversity Conservation Key Laboratory of Sichuan Province, Chengdu Institute of Biology, Chinese Academy of Sciences, Chengdu, China
- 2Built Environment, University of Washington, Seattle, WA, United States
- 3Chengdu Nature Reserve and Wildlife Protection Center, Chengdu, China
Introduction: With the acceleration of urbanization, human population and built surface in urban areas have increased rapidly, triggering numerous environmental problems. Identification of ecological security pattern (ESP) can be helpful to optimize the interaction and relationship between ecological conservation and socioeconomic development in a given region. In this study, taking Chengdu City as an example, a methodology was used to analyze the city’s ESP.
Methodology: Ecological sources were identified based on their ecological security values, which were derived from the spatio-temporal evaluation of ecosystem services and ecological health. The ecological resistance surface was revised with nighttime light index. Linkage Mapper combined with circuit theory was used to extracted ecological corridors and key ecological nodes.
Results:: The results showed that the mean values of ecological security in Chengdu City presented a downward and then upward trend from 2000 to 2018. In 2018, the ESP in Chengdu City was formed by 140 ecological sources with the total area of 8,819.78 km2, 302 ecological corridors with the area of 456.91 km2, as well as 61 pinch-points and 17 barrier points. The ecological sources in Chengdu City were mainly distributed in or nearby Longmen Mountain and Longquan Mountain, two flanks of the Chengdu Plain, and connected each other with hundreds of ecological corridors. Most of ecological sources and corridors were composited of forests in mountainous areas and linpan units (wooded lots) in rural plain areas. On the contrary, pinch-points and barrier points were mainly distributed in the districts nearby the metropolitan urban center.
Conclusion: Finally, this study proposed that constructing ESP must adopt a dynamic and holistic approach in considering the change of restoring ecosystems, shift of urban demands for ecosystem services and transformation of urban-rural land use/cover. Restoring and managing corridors sustainably are important for improving the ecological connectivity of all over ecological sources in a city, all of which together, if functioning well, could further support the realization of sustainable urbanization.
1 Introduction
In the last few decades, continuous urbanization and industrialization as well as human activities have led to an obvious pressure on biodiversity and ecosystem services, triggering environmental problems (Yang Y. et al., 2022), such as habitat fragmentation, biodiversity loss, and air or water pollution (Peng et al., 2018; IPBES, 2019; Xie et al., 2022). Recently, how to maintain the stability of regional ecosystems, integrate rural and urban ecosystems, and jointly achieve the sustainable prosperity of metropolitan areas, has become a global issue that attracted more and more attentions (Alberti, 2008; Kroll et al., 2012; Wolf, 2012; Li J. W. et al., 2023). Ecological security pattern (ESP) was recognized as an important countermeasure and a basic path to achieve regional ecological security and sustainable development (Kang et al., 2021). Generally speaking, ESP essentially refers to clarifying the mutual feedback between landscape patterns and ecological processes, and identifying spatially those important landscape patches where contained species, habitats and ecosystem functioning (Peng et al., 2018; Huang et al., 2020; Li WJ. et al., 2023). Originated from landscape planning methods (Kang et al., 2021), although ESP is similar to environmental network and green infrastructure that contribute to regional ecological conservation (Huang et al., 2020; Jie et al., 2023), it is more comprehensive and effective from the perspective of spatial architecture (Peng et al., 2018). Presently, the study framework of ESP has been formed including the identification of ecological sources as well as the extraction of ecological corridors by establishing resistance surface (Peng et al., 2019).
Ecological sources are usually large-size landscape patches that contain rich biodiversity and play an important role in sustaining ecosystem structure and functioning (Kang et al., 2021). In urban planning, effectively protecting urban ecological sources contributes to maintaining urban biodiversity (Xie et al., 2022), enhancing the stability and resilience of urban ecosystems (Wu et al., 2020), and improving the quality of life for city residents (Wu et al., 2021). Thus, the identification of ecological sources is the first and most fundamental step in constructing urban’s ESP which should be carefully designed (Zhang et al., 2017). Initially, most studies on metropolitan system identified ecological sources through simply extracting nature reserves, forests, green spaces, water bodies or scenic spots, which was supposed to ignore their disturbed status by human activities sometimes (Kang et al., 2021). Lately, some studies considered ecosystem services, ecological risk and/or sensitivity while assessing ecological sources (Lin et al., 2017; Yang Y. et al., 2022). Recently, a number of scholars suggested that it is necessary to integrate ecosystem health into assessment framework (Peng et al., 2015; Kang et al., 2018). The reason is that ecological source is able to not only provide diverse ecosystem services, but also contribute to maintaining ecosystem health (Kang et al., 2018). What is more, as people consciously protect and restore ecosystems in urban and rural areas, the quality of landscape patches could be continuously improved, and thus those restored or restoring lands should also be considered as potential sources in the future.
As one of indicators of ecological connectivity in a landscape (Tian et al., 2023), ecological corridors represent critical carriers in maintaining flows of materials and energy between ecological sources, which are normally extracted through the establishment of resistance surface and the simulation of species migration process (Huang et al., 2020). The resistance surface reflects the difficulty of species migration, which is considered to be the prerequisite for extracting ecological corridors accurately (Kang et al., 2021). While discussing resistance surface, many scholars preferred to consider land cover/use and topographic conditions such as slope and elevation (Su et al., 2021), but they underestimated the impacts of human activities on resistance surface (Kang et al., 2021). Lately, some studies modified the assessment framework with the indicators of human activity such as nighttime light (Zhang et al., 2017; Shuai et al., 2023) or impervious surface (Huang et al., 2020). At present, the extraction of ecological corridors mainly used related spatial models such as minimum cumulative resistance (MCR) (Wang and Pan, 2019) and circuit theory (Peng et al., 2018; Li J. W. et al., 2023; Tang et al., 2023). Although MRC has been used widely in quickly extracting the optimal path of ecological flow, it cannot identify the migration path of species exactly, including the width of corridors and key nodes (Peng et al., 2018; Xu et al., 2019). Recently, with the Ohm’s Law being innovatively applied in studying ecological process, circuit theory has been used to simulate the path of random migration of biological species, which can effectively extract corridor width and identify key nodes for reconstructing ESP (Peng et al., 2018; Xu et al., 2019; Gao J. et al., 2021; Li WJ. et al., 2023; Tang et al., 2023).
Nowadays, the assessment and improvement of ESP has become an important approach for consolidating and enhancing ecological security of metropolitan areas (Li et al., 2019). As a fast-growing metropolis, Chengdu City is not only the capital city of Sichuan Province, but also the most importantly economic, commercial, cultural and transport hub in western China (Li, 2017). During the past decades especially after the 1990s, accelerated urbanization has caused drastic changes on land use/cover in Chengdu City which further raised the consideration or even concerns on regional ecological security and socio-ecological resilience in a long run (Schneider et al., 2005; Yang et al., 2011; Whiting et al., 2019). After the late 2000s, a national program, “Rural Revitalization,” was carried out in China as well as Chengdu City. While actively pursued agricultural modernization and promoted widespread physical transformation of rural lands for urban infrastructure and services, this program also emphasized the preservation of traditional lifestyle and rural landscape such as linpan (wooded lots) landscape in order to reduce the loss of cultivated land, provide public amenities to publics, and enhance the resilience of agricultural system across the region (Wu et al., 2020; Zhong et al., 2022). In 2018, a new program called “Park City Construction” initiated by Chengdu City government with the main aims at increasing green space, constructing ecological infrastructure and improving harmonious relationship between nature and people in both urban and rural areas (Yang Z. et al., 2022; Zhong et al., 2022). Considering these ongoing programs, in this study we take Chengdu City as an example to: (1) assesse the status and trend of ecological security from 2000 to 2018; (2) identify ecological sources as well as corridors and critical nodes; and (3) explore an optimization strategy for constructing a healthy and sustainable “Park City.” It is hoped that this study could be beneficial to the spatial planning of Chengdu City and sustain its urbanization in the future.
2 Methodology
2.1 Study area
Chengdu City is a metropolitan area located at an alluvial plain extending between Longmen Mountain in the west and Longquan Mountain in the east with the longitude of 102° 54′–104° 53′ E and latitude of 30° 05′–31° 26′ N (Figure 1). As a fast-growing national metropolis, it covers an area of 14,335 km2, among which the built-up area is 932 km2, about 6.5% of the total. In 2018, its population was about 14.76 million with 60.94% living in urban (Statistic Bureau of Chengdu and NBS Survey Office in Chengdu, 2020). The great Minjiang River and Tuojiang River, both of the main branches of the Yangtze River, together with their numerous fine tributaries, run across this plain, forming an expansive watershed with a very flat but partly hilly topography. The climate of this plain is typically subtropical with a mild temperature (annual mean temperature: 15.2°C–16.6°C) and rich rainfall (annual mean precipitation: 899–1,284 mm) almost all year round, providing ideal conditions for crop cultivation, fruit plantation and subtropical forests (Editorial Committee of Chengdu Annals, 2000). Flowing down from the Dujiangyan Irrigation System in the northwest, a World Cultural Heritage site of the UNESCO, the network of irrigation canals or channels supports the agricultural prosperity of this plain in last many centuries and is still irrigating a vast area of cultivated fields up to date. Given the advantages of heat and water conditions, most of the rural areas in Chengdu plain are covered by a specific agro-cultural landscape, called linpan landscape, an integrated ecosystem complex including linpan unit (rural settlements surrounded by tree or bamboo groves), farmlands (mainly paddy fields) and freshwater bodies (mainly ponds and hydraulic channels) (Wu et al., 2020).
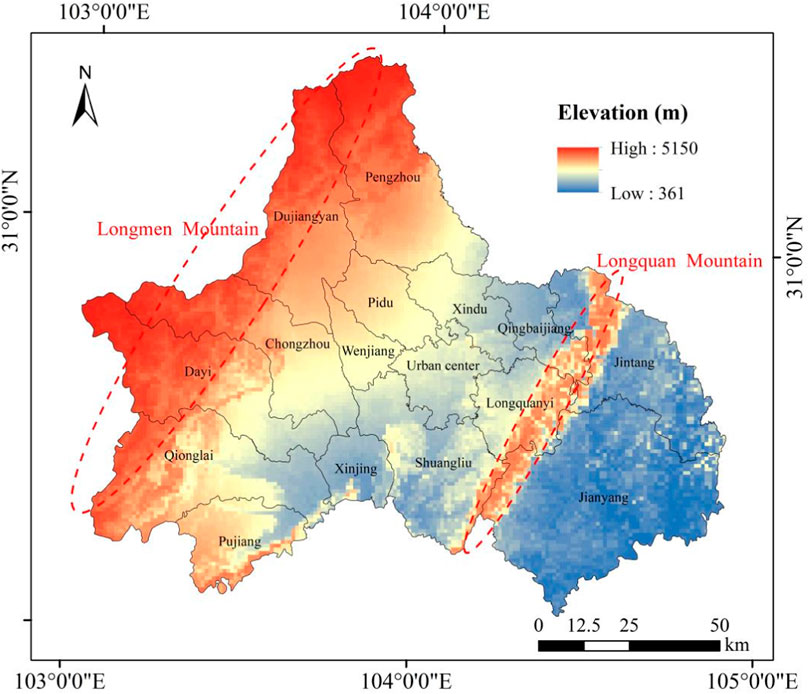
Figure 1. The location of the Chengdu City.
2.2 Data sources
Several datasets were used in this research, which were elaborated as follows. The land-use data with a spatial resolution of 30 m in 2000, 2010 and 2018 were obtained from the Resource and Environment Science and Data Center (China) (https://www.resdc.cn/). The spatial distribution data of linpan units were acquired from the visually spatial interpretation based on Landsat, Google, Spot and sentinel images, which accuracy is higher than 80%. The daily precipitation data were obtained from the China Meteorological Data Service Centre (http://data.cma.cn). The Yearly Net Primary Production data (MOD17A3 NPP raster data products) with 500 m*500 m resolution, 16-day Normalized Difference Vegetation Index data (MOD13Q1 NDVI raster data products) with 250 m*250 m resolution as well as Yearly Potential Evapotranspiration (MOD16A3 PET raster data products) with 500 m*500 m resolution were acquired from NASA MODIS (https://modis.gsfc.nasa.gov/). The Digital Elevation Model (DEM) with 30 m*30 m resolution was obtained from the Geospatial Data Cloud website (http://www.gscloud.cn/). The soil-type database was downloaded from the Harmonized World Soil Database (HWSD, http://www.fao.org/) at the scale of 1: 1,000,000. The nighttime light data with 130 m*130 m resolution (2018.10.15) were acquired from Luojia Number 1 Wuhan University (http://www.hbeos.org.cn/). The agricultural production data were abstracted from Chengdu Statistical Yearbook (http://cdstats.chengdu.gov.cn/). All of above data were reclassified utilizing the nearest neighbor method in GIS, and the grids of raster data were unified to be 30 m*30 m.
2.3 Framework for ecological security assessment
The ecological security of a city is closely related to the capacity of ecosystems inside to deliver services sustainably and to maintain a high-level status of ecosystem health (Peng et al., 2015; Kang et al., 2018). According to the research of Peng et al. (2015), the assessment of the Ecological Security Value (ESV) is based on a formula including two parts, which is modeled as follows:
Here, ESV is the regional Ecosystem Security Value; EHI is the Ecosystem Health Index; and ESI is the Ecosystem Services Index.
2.3.1 Assessment of ecosystem health index
In this study, we adopted the traditional framework for EHI assessment with the indicators of ecosystem vigor, organization, and resilience (Kang et al., 2018). The formula of EHI is as follows:
Here, EHI is the Ecosystem Health Index; EV, EO, and ER represent the vigor, organization and resilience of ecosystem respectively, the details of which are described as follows.
Ecosystem vigor is characterized by the metabolism or primary productivity of ecosystem. In this study, net primary production (NPP) was used for assessing ecosystem vigor, which had been demonstrated to be effective in previous studies on ecosystem metabolism (Tian and Qiao, 2014; Kang et al., 2018).
Ecosystem organization refers to the stability of ecosystem structure, which is determined by landscape patterns related to spatial heterogeneity and ecological connectivity (Peng et al., 2015; Kang et al., 2018). Generally speaking, landscape heterogeneity could be evaluated with several indicators such as Area-Weighted Mean Fractal Dimension Index (AWMPFD), Shannon’s Diversity Index (SHDI), and Modified Simpson’s Diversity Index (MSIDI). The higher these indexes’ values are, the more heterogeneous the landscape should be.
Ecological connectivity is determined by ecological corridors and important ecological patches (e.g., woodlands and water bodies). In this study we use Splitting Index (SPLIT) and Contagion Index (CONTAG) to quantify the overall ecological connectivity of landscape between patches (Pan and Wang, 2021). According to the previous studies (Peng et al., 2015; Kang et al., 2018; Pan and Wang, 2021), the weights of landscape heterogeneity and connectivity are 0.35, but the weight for the ecological connectivity between patches is assigned as 0.3. Although each index can be quantified with Fragstats software, in order to eliminate the impacts caused by different dimensions, the results of index assessment could be standardized for further calculation of ecosystem organization index, which formula is as follows:
Here, Pi is the standardized index of landscape index of type i; Xi is the value of landscape index of type i; Xmin and Xmax are the minimum and maximum values of landscape index of type i respectively; EO is the ecosystem organization of assessed unit; LH and LC are the landscape heterogeneity and landscape connectivity respectively; IC is the ecological connectivity of assessed patches; AWMPFD, SHDI, MSIDI, SPLIT1, and CONTAG are the Area-weighted Mean Fractal Dimension Index, Shannon’s Diversity Index, modified Simpson’s Diversity Index, Splitting Index, and Contagion Index of Entire Landscape, respectively; SPLIT2 and SPLIT3 are Splitting Index of forest and water body patches; CONNECT1 and CONNECT2 are the Area-weighted Mean Fractal Dimension Index of forest and water body patches.
Ecological resilience refers to the ability of an ecosystem or landscape to recover its original structure and function after being disturbed by natural and human interventions, which reflects the ability of an ecosystem or landscape to resist or adapt to external disturbances (Gunderson, 2000; Peng et al., 2015). Due to the change of land-use/cover playing an important role impacting on ecological resilience, we used different types of land-use/cover to calculate resilience coefficient (Kang et al., 2018; Pan and Wang, 2021), which was further modified based on the NDVI data. The formula is as follows:
Here, ER is the ecological resilience of spatial entities; NDVIi represents the NDVI value of the raster i; NDVImeanj is the average value of NDVI of land-use/cover type j where the raster i belongs to; RCi is the resilience coefficient of land-use/cover type i (Table 1).
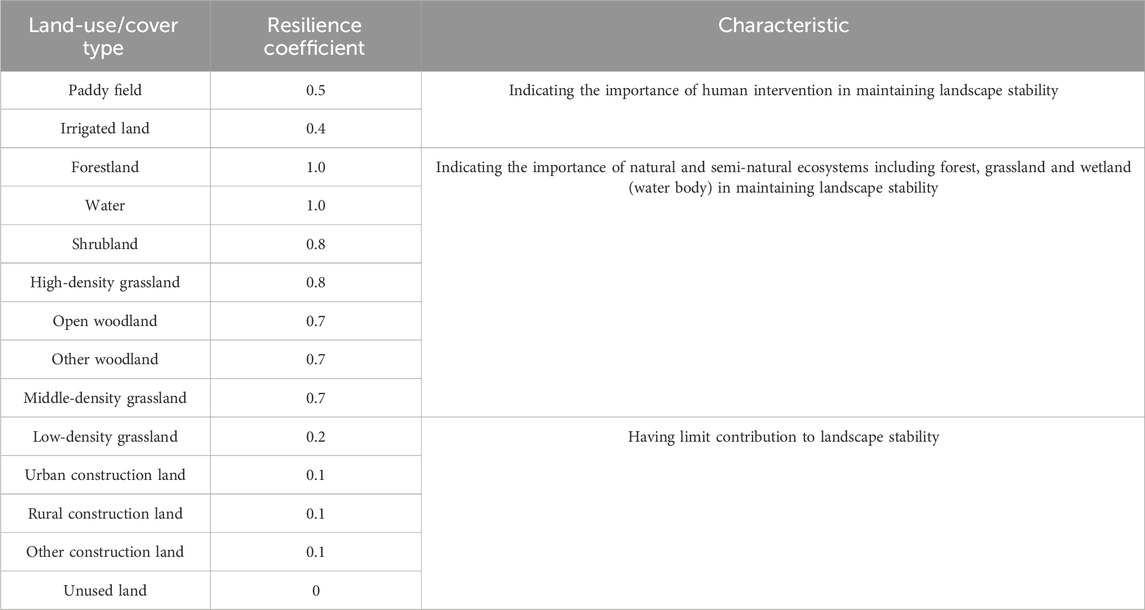
Table 1. Resilience coefficient of land use/cover types.
2.3.2 Assessment of ecosystem services index
Based on previous studies (Wu et al., 2020; Wu et al., 2021), five representative indicators (services) were selected for the calculation of Ecosystem Services Index (ESI), including food supply, water supply, habitat quality, soil conservation as well as carbon storage. Considering the uniform of five services due to the different dimensions, it is difficult to use them directly into the evaluation. Thus, it is necessary to standardize these values in line with the normalization method of landscape index mentioned above, and then calculate the indexes of five ecosystem services with following formula:
Here, Pi is the standardized index of ecosystem service of type i; Xi is the value of ecosystem service of type i; Xmin and Xmax are the minimum and maximum values of ecosystem service of type i respectively; ESI represents ecosystem service index; P1–5 is the normalized index of each ecosystem service; W1–5 is the weighted value of 1–5 service (adopting 0.2 as the average weight).
Food supply is an important provisioning service for agricultural ecosystem, which delivers grain, oilseeds, vegetables, meat, milk and aquatic products to rural and urban population. It was found that there is a significant linear relationship between NDVI and the yield of agricultural products including crops and animal products (Feng et al., 2014). In this study, based on agricultural production and land use/cover types in Chengdu City, the total outputs of grain, oilseeds, and vegetables were allocated into small grids according to the ratio between the grid NDVI value and the total NDVI value of cultivated lands. Given the importance of grasslands (mostly mowing pastures) in producing meat and milk, their outputs were also allocated into small grids according to the ratio between the grid NDVI value and the total NDVI value of grasslands. In Chengdu Plain, because aquatic products are mainly harvested from reservoirs and water ponds, the total output of aquatic products was evenly distributed to water bodies according to their areas. Thus, after calculating agricultural production with following formula, the spatial distribution of food provisioning service in Chengdu City could be obtained.
Here, Gi represents the agricultural production of raster i; Gsum1 is the total output of grain, oilseeds, vegetables, meat and milk; NDVIi is the normalized vegetation index of grid i; NDVIsum is the sum of NDVI values of cultivated lands and grasslands; Gsum2 is the total production of aquatic products; Si is the area of water bodies including reservoirs and ponds in grid i; and Ssum is the sum of the area of water bodies.
Water supply is one of the most important regulating services of ecosystems, which is also fundamental to many processes and functioning of ecosystems. In this study, water supply was evaluated with InVEST-Water Yield Model (https://www.naturalcapitalproject.org/invest/), which formula is as follows:
Here, WYxj is the amount of annual water supply from grid x; AETxj is the annually average evapotranspiration of grid x of land-use/cover type j; Px is the annual precipitation falling onto grid x; the ratio AETxj/Px is calculated based on the drying index, crop coefficient, potential evapotranspiration, and Z parameter (an empirical constant ranges from 1 to 30, sometimes referring to as “seasonality factor”), etc. More details about these calculations can be found in the user’s guide of InVEST Model (Sharp et al., 2016). Through repeatedly adjusting the Z parameter in the model, the calculated water supply could be as consistent as possible with the actual total water resources (Yang et al., 2020).
Habitat quality was calculated with the InVEST-Habitat Quality Model (Peng et al., 2018). Four factors considered in habitat quality assessment include: (1) the relative impact of each threat; (2) the relative sensitivity of each habitat (patch) to each threat; (3) the distance between habitats; and (4) the situation of habitats being legally protected (Su et al., 2021). The values of habitat quality range from 0 to 1, representing the habitat quality from the worst to the best. According to the InVEST user’s guide and previous studies (Lin et al., 2017; Su et al., 2021), six indicators including paddy, farmland, urban area, rural settlement, construction land and unused land as threats were used in assessing habitat quality.
Soil conservation was calculated with InVEST-Sediment Delivery Ratio Model, which is mainly based on the revised Universal Soil Loss Equation (RUSLE) (Peng et al., 2018; Tang et al., 2018; Pan and Wang, 2021). The formula is as follows:
Here, SC is the amount of annual soil conservation; R represents rainfall erosion calculated with the method proposed by Hu et al. (2014); K is the value of soil erodibility according to the method of Williams et al. (1983) and related soil data from HWSD; LS is the divisor of slope grade and length; C is vegetation coverage and crop management; and P is a factor indicating control measures on soil erosion. The factor of crop management and soil erosion control were collected from other related researches (Hu et al., 2014; Gao J. et al., 2021).
Carbon storage was calculated with InVEST-Carbon Storage Model. The total carbon storage in ecosystems was measured with the sum value of carbon in four carbon pools, including aboveground carbon pool, underground carbon pool, soil carbon pool, and dead organic carbon pool. Based on the relevant parameters of carbon density in Chengdu City reported by Zhang (2018), carbon storage was calculated with following formula.
Here, Ctotal is the total carbon storage; Cabove and Cbelow is aboveground and underground carbon storage; Csoil is soil carbon storage; and Cdead is dead organic carbon storage.
2.4 Identification of ecological security pattern
Ecological security pattern has a crucial role in maintaining the stability of structure and function of ecosystems through developing a network of ecological sources, corridors, and key nodes into an integrated socio-ecological system (Peng et al., 2018; Wang and Pan, 2019). Given the status of Chengdu City in 2018 as an example, this study aimed at assessing the ecological security pattern (ESP) based on the methods reported by previous researches (Kang et al., 2018; Peng et al., 2018). Three steps were included in this study: (1) identifying ecological sources through quantifying and mapping ESV (see Section 2.3), (2) structuring resistance surface with nighttime light data, and (3) extracting ecological corridors, key pinch-points as well as barrier points with circuit theory. The methodological framework used in this study was shown in following chart (Figure 2).
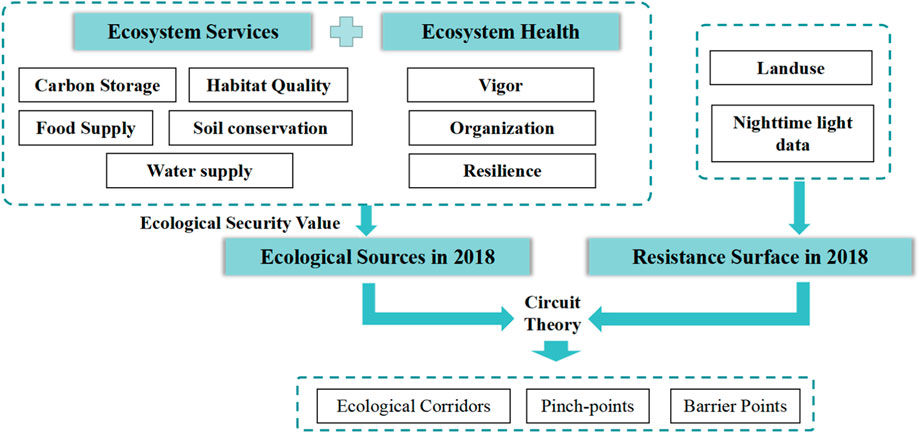
Figure 2. Methodological framework for identifying ecological security pattern.
2.4.1 Ecological sources
Based on the assessment method of ecosystem services and ecological health (see Section 2.3), the results of Chengdu’s ESV in 2000, 2010 and 2018 were obtained. Initially, the results of ESV of 2018 was divided into five grades with natural breaks (Peng et al., 2018), where the grade from 1 to 5 represents the importance level ranging from low to high. If the patches are graded 4 or 5, it indicates that these patches belong to stable ecological sources, characterized by rich biodiversity and playing a crucial role in sustaining ecosystem structure and function. Additonlly, with the implementation of ecological restoration and biodiversity conservation programs from 2000 to 2018, the ecological conditions of many areas in Chengdu City have been improved continuously. Those restored and restoring lands have become a kind of ecological sources or potential sources. Previous research has shown that the habitat heterogeneity within a city significantly improves with the expansion of green spaces and parks (Uchida et al., 2021), which is believed to contribute to maintaining high levels of biological species diversity (Gao Z. et al., 2021). Therefore, we identified several areas as potential ecological sources where the ESV had increased annually from 2000 to 2018 and ultimately exceeded the regional mean value of 2018. What is more, according to the analysis of actual situation, the patches with the area below 0.3 km2 were eliminated from the dataset of ecological sources (Wang and Pan, 2019). Finally, all of ecological sources in Chengdu City were identified, including two types: stable ecological sources and potential ecological sources.
2.4.2 Resistance surface
Different types of land-use/cover possess different levels of resistance to the flows of matter and energy, and thus in many studies the values of resistance surface were assigned based on land-use/cover types (Su et al., 2021). Furthermore, it was found that resistance coefficient increased with the intensity of human activities (Zhang et al., 2017). In term of the representative indicator of human activities, the nighttime light data of Chengdu City was chosen in this study to reflect the status of economic development as well as urbanization, which were considered as the major human interventions in a city (Peng et al., 2016; Xie et al., 2017). According to the previous study (Zhang et al., 2017), the basic resistance coefficients of different land-use/cover types were explained in Table 2, and the nighttime light data was introduced in this study for revising these resistance coefficients. The revised resistance coefficient was calculated with following formula.
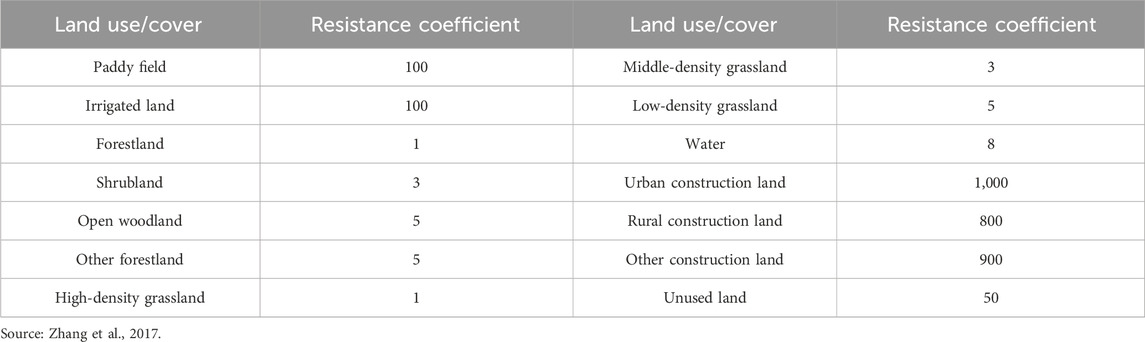
Table 2. The criteria of resistance value for different land-use/cover types.
Here, R’ is the revised resistance coefficient; (1+ TLIa) is the revising parameter of resistance coefficients of land-use/cover a; R is the basic resistance coefficient of land-use/cover type a; Li is the nighttime light data of grid i which belongs to land-use/cover type a; Lmin and Lmax are the minimum and maximum nighttime light indexes of land-use/cover type a respectively.
2.4.3 Ecological corridors, pinch-points and barrier points
Ecological corridors are the important channels of material, energy, and information exchange in an ecosystem or landscape, and can enhance ecological connectivity and then maintain ecosystem integrity (Wang and Pan, 2019; Huang et al., 2020; Zhang et al., 2021; Li J. W. et al., 2023; Tang et al., 2023). Generally, pinch-points and barrier points appear nearby ecological corridors. Pinch-points are those areas where ecological processes occur frequently and should not be removed or destroyed, while barrier points are the areas that hinder ecological processes and should be removed or restored (Lechner et al., 2015; Pierik et al., 2016). In this study, optimal corridors, pinch-points and barrier points were identified with Linkage Mapper of Geographic Information System (GIS) based on circuit theory model (http://www.circuitscape.org/linkagemapper). Sub-optimal corridors, additionally, including their range or width which was crucial to ecological process, were determined based on the cumulated resistance from 20,000 to 200,000 with an increment of 20,000 in Pinch-point Mapper model (Peng et al., 2018; Huang et al., 2020). Both optimal corridors and sub-optimal corridors together constitute the network of ecological corridors across the landscape of Chengdu City. Moreover, through grading the cumulative current based on natural breaks, pinch-points were identified (Huang et al., 2020). The searching radius of mobile window in Barrier Mapper tool of Linkage Mapper was 200 m (Gao Z. et al., 2021; Yang et al., 2021). More detailed explanations and descriptions about these models can be found in relevant publications (Lechner et al., 2015; Pierik et al., 2016; Peng et al., 2018).
3 Results
3.1 Temporal and spatial dynamics of ESV in Chengdu City
3.1.1 Ecosystem health
The ecosystem vigor (EV), organization (EO) and resilience (ER) of Chengdu City in 2000, 2010, and 2018 were shown in Figure 3. The ecosystem vigor showed a declining and then rising trend from 2000 to 2018. Briefly, the value range of EV in 2000, 2010, and 2018 fluctuated from 0 to 1,313.90 g m−2 a−1, 0–1,364.60 g m−2 a−1, and 0–1,418.60 g m−2 a−1, respectively. However, in term of the mean value of EV at three time points, it showed a generally increasing trend from 508.51 g m−2 a−1 in 2000 to 494.25 g m−2 a−1 in 2010 and then 605.65 g m−2 a−1 in 2018, indicating the progressive improvement of vegetation in the city. At the same period from 2000 to 2018 the EO and ER values were relatively stable. The range of EO values in 2000, 2010 and 2018 changed from 0.124 to 0.655, 0 to 0.694 and 0 to 0.650, with the average values being 0.251, 0.248 and 0.250, respectively. As for the ER value at three time points, it fluctuated from 0 to 1.753 in 2000, 0 to 1.827 in 2010, and 0 to 1.853 in 2018, but its mean values remained about 0.5, being 0.528, 0.513, and 0.506 respectively.
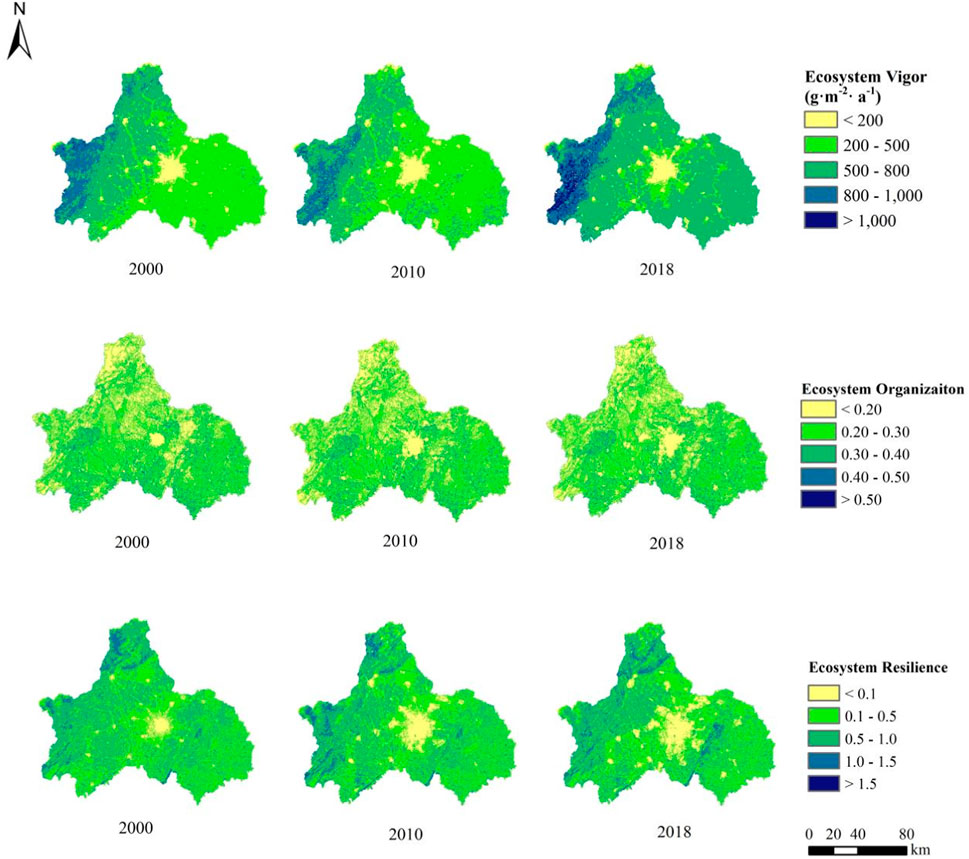
Figure 3. Spatial distributions of EV, EO, and ER values in 2000, 2010, and 2018 in Chengdu City.
Based on the evaluation of EV, EO and ER above mentioned, the spatial distribution of EHI was calculated (Figure 4). The fluctuation of EHI values in 2000, 2010, and 2018 were from 0 to 19.06, 0 to 21.35 and 0 to 22.19, respectively. It could be found in Figure 4 that the general trend of mean EHI value was similar to the EV, which decreased firstly from 8.20 in 2000 to 7.95 in 2010, and then increased to 8.56 in 2018. In view of the EHI in 2018, the areas with high values were found on both sides of Chengdu City plain, i.e., in and nearby Longmen Mountain in the west and Longquan Mountain in the middle-east. The low valued areas mainly occurred in the middle plain where the metropolitan urban center and its satellite towns were located.
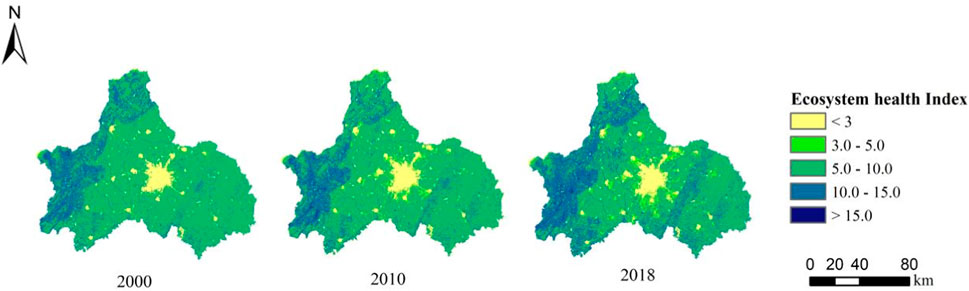
Figure 4. Spatial distribution of EHI value in 2000, 2010, and 2018 in Chengdu City.
3.1.2 Ecosystem services
The spatial distribution of water supply, food supply, habitat quality, carbon storage, and soil conservation were mapped in Figure 5. These five kinds of ecosystem services exhibited heterogeneous patterns temporally and spatially. Generally, water supply showed a continuously increasing trend, changing from 414.98 mm km−2 in 2000 to 686.85 mm km−2 in 2010, and then 985.61 mm km−2 in 2018. The areas with high water supply service were mainly distributed in the southwestern districts of Chengdu City, such as Pujiang City, Qionglai City, Dayi City, and Chongzhou City. During the same period, the total food supply decreased from 2000 to 2010 and then increased from 2010 to 2018. In average, the food supply in Chengdu City was 608.76 t km−2 in 2000, but in 2010 it declined to 522.58 t km−2 and then got to 643.64 t km−2 in 2018. The areas with high food supply were mainly distributed on both sides of Longquan Mountain, i.e., hilly and plain areas.
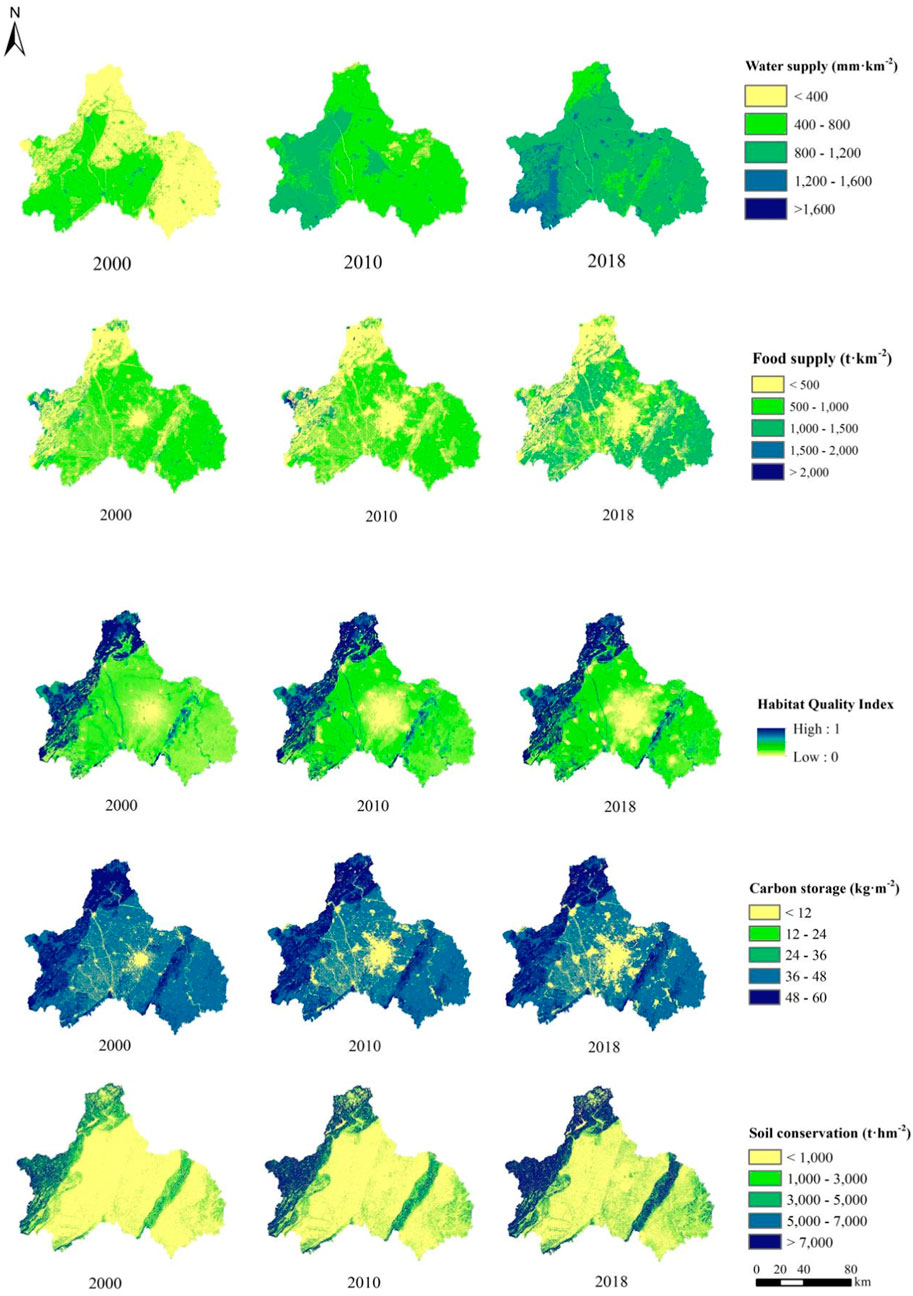
Figure 5. Spatial distributions of water supply, food supply, habitat quality, carbon storage and soil conservation services in 2000, 2010, and 2018 in Chengdu City.
The temporal changes of habitat quality, carbon storage and soil conservation had similar features from 2000 to 2018, showing a relatively stable trend, but the mean values of soil conservation increased sharply from 1855.88 t hm−2 in 2000–6,020.99 t hm−2 in 2018, indicating an increase of 2.24 times during the period of 18 years. In term of spatial patterns, the areas with high values of these three ecosystem services occurred in or nearby Longmen Mountain and Longquan Mountain, but low valued areas were found in the middle plain.
Integrating the evaluation of five ecosystem services into ESI model, the values of ESI varied in the ranges of 0.040–0.699 in 2000, 0.053–0.727 in 2010, and 0.042–0.771 in 2018, respectively. Their spatial distributions were mapped in Figure 6. As to the average values of ESI, it was 0.389 in 2000, but in 2010 it decreased a little bit to 0.384, and then quickly increased to 0.426 in 2018. Undoubtedly, the areas with high EHI values were also found in and nearby mountains where restoration programs had been implemented extensively in last few decades, but low valued areas were mainly distributed in the densely populated plain.
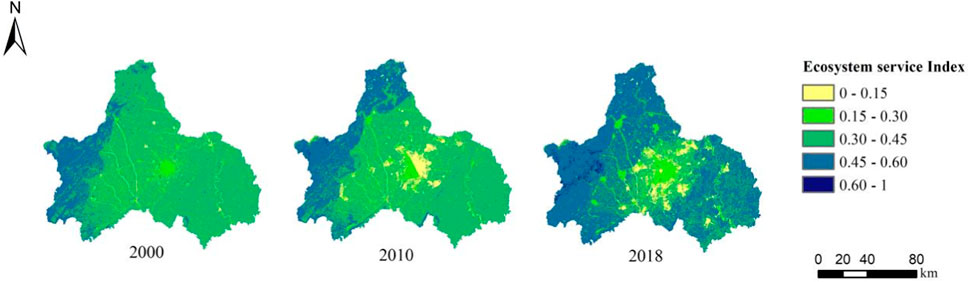
Figure 6. Spatial distribution of ESI in 2000, 2010, and 2018 in Chengdu City.
3.1.3 Ecological security
Combining the results of EHI and ESI mentioned above, ESV could be calculated accordingly (Figure 7). The values of ESV varied in the ranges of 0–3.237 in 2000, 0–3.449 in 2010 and 0–3.549 in 2018, respectively. In view of regional mean value, the ESV decreased from 1.741 in 2000 to 1.708 in 2010, and then increased to 1.869 in 2018. Considering the spatial pattern of ESV in Chengdu City, the high values of ESV occurred in mountainous areas, but the low values were also found in the circle around the metropolitan urban center, showing a similar feature to the change of ecosystem services.
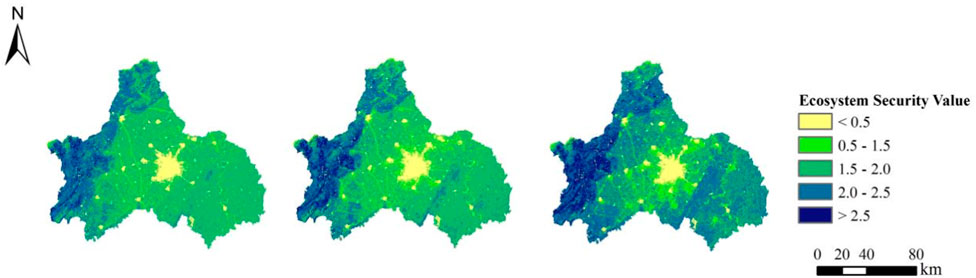
Figure 7. Spatial distribution of ESV in 2000, 2010, and 2018 in Chengdu City.
3.2 Spatial optimization of ESP
3.2.1 Recognition of ESP’s elements
3.2.1.1 Identification of ecological sources
Based on the natural breaks of the ESV in 2018, the areas (patches) with the grade of 4 to 5 (ESV>1.99) were designated as stable ecological sources. Meanwhile, considering the annual increase of the ESV from 2000 to 2018, the areas with the ESV above 1.869, the mean value of ESV in 2018, were regarded as potential ecological sources. Finally, 140 patches of ecological sources with an area of 8,819.78 km2 totally were identified, making up 61.52% of the studied territory, of which most were distributed in and nearby Longmen Mountain and Longquan Mountain (Figure 8A). Among these various ecological sources, the area of stable ecological sources was 7,924.83 km2, accounting to 89.85% of the total ecological source areas; but the area of potential ecological sources was 894.95 km2, making up only 10.15%.
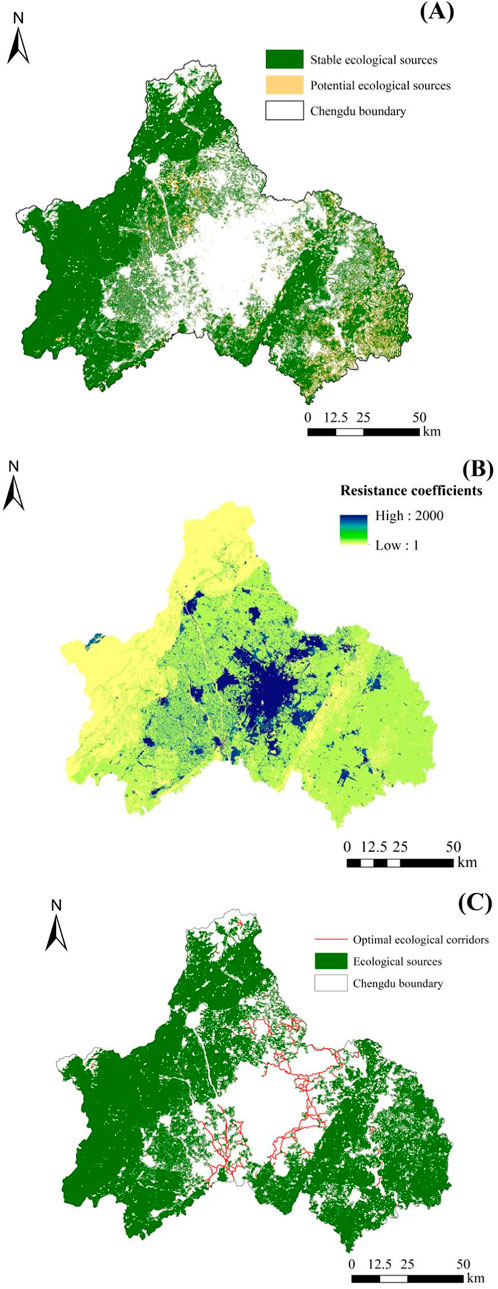
Figure 8. Ecosystem sources (A), resistance coefficients (B) and ecological corridors (C) in Chengdu City.
3.2.1.2 Identification of resistance surface and ecological corridors
According to the basic resistance value and the intensity of nighttime light, the distribution of modified resistance surface was mapped (Figure 8B). The average of modified resistance coefficients was 206.74, but the maximum and minimum values varied from 2000 to 1. In general, the resistance coefficients around the metropolitan urban center were higher than those in remote rural areas in particular of mountainous areas.
Ecological corridor is an important element of ESP, which is composed of striped areas with specific width and plays an important role in sustaining ecological processes and functioning. As shown in Figure 8C, there were 302 optimal corridors connecting hundreds of ecological sources in Chengdu City. The length of observed ecological corridors was 899.11 km in total. The distance in between ecological sources was 2.98 km in average, but it varied from 0 to 23.79 km. There were 186 corridors with the length of less than 2 km, accounting to 61.59% of the total number of optimal corridors, which implied most of the corridors were short.
3.2.1.3 Sub-optimal ecological corridors
With the setting of cumulative current higher than 0.01 and the increase of cumulative resistance from 20,000 to 200,000 (increments of 20,000), it was found that the corresponding areas of sub-optimal ecological corridors varied in each increment (Figure 9). Although the spatial distribution of these corridors remained unchanged, the total area increased firstly and then declined slightly with the increasing effects of threshold. The highest value occurred at the point when the cumulative resistance being 100,000 (Figure 10). The sub-optimal corridors identified in this study would be very important for the spatial planning of Park City in the future, which covered 456.91 km2 and accounted to 3.19% of the total area, including 61 pinch-points and 17 barrier points.

Figure 9. Areas of sub-optimal ecological corridors and distribution of cumulative resistance.
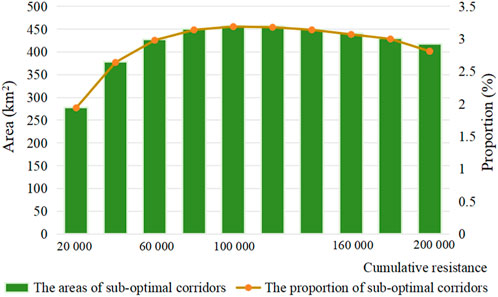
Figure 10. The areas and proportion of sub-optimal corridors.
3.2.2 Optimization strategy
On the whole, the ESP in Chengdu City was consisted of various ecological sources, mainly including forests, shrublands, grasslands, farmlands and water bodies, which were interconnected through ecological corridors. The total area of ecological sources was 8,819.78 km2, including 140 ecological sources, among which stable ecological sources made up 89.86% (7,924.83 km2), and potential ecological sources accounted to 10.15% (894.95 km2).The ecological corridors in Chengdu City, including 302 optimal corridors and sub-optimal corridors with the total length of 899.12 km and total area of 456.91 km2, contributed to the interconnection of ecological sources citywide.
In view of the spatial pattern of ESP in Chengdu City, three circles could be roughly divided, including: (1) ecologically stable area in outer circle, i.e., those areas in and nearby mountains; (2) ecologically sensitive area in middle circle, i.e., those rural areas in hilly and plain areas; and (3) ecologically vulnerable area in inner circle, i.e., urban center and surrounding satellite towns, which could be further elaborated as follows (Figure 11).
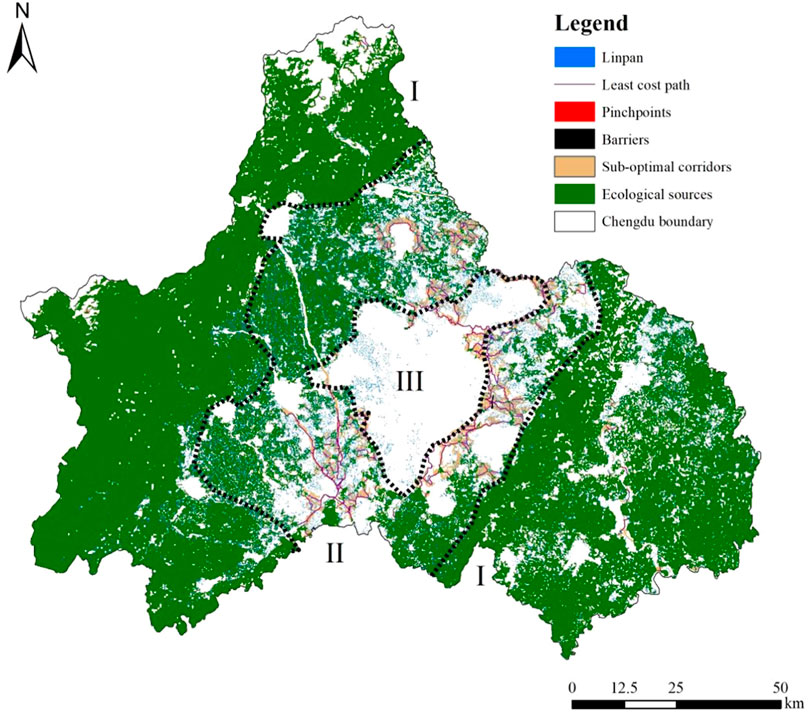
Figure 11. Spatial distribution of ecological security pattern and linpan units in Chengdu City. Note: (I) ecologically stable area, (II) ecologically sensitive area, and (III) ecologically vulnerable area.
3.2.2.1 Ecologically stable area
The areas with high-quality ESV were mainly distributed in two flanks of Chengdu plain, locating at Longmen Mountain in the west and Longquan Mountain in the east and their piedmonts. These areas were characterized by obviously vertical difference of topography and lush forests. Over 80% of the territory was identified as ecological sources, with numerous ecological corridors and pinch-points but without barrier points. In term of administrative districts, most of high-quality ESV were found in Pengzhou City, Dujiangyan City, Chongzhou City, Dayi City and Longquanyi City. The administrators of these administrative regions should formulate policies related to the protection and maintenance of ecological source, ecological corridors and pinch-points. In the north of Chengdu plain, such as Jintang district, the quality of ecological sources declined relatively due to the increase of population density, the intensification of industry, and the traditional transport hub connecting Chengdu with other urban to the north such as Deyang City, Mianyang City and even Xi’an City. If the socio-economic development of a region indeed requires occupying areas within the urban ecological security pattern, the priority should be to protect ecological pinch-points as much as possible. Additionally, careful consideration should be given to whether it is necessary to re-establish ecological source areas and construct ecological corridors to maintain regional ecological security.
3.2.2.2 Ecologically sensitive area
This area was located at the middle of Chengdu Plain with flat topography and very intensive agriculture. Due to the benefits of Dujiangyan Irrigation System, croplands were managed extensively and in a long history. The ecological sources here were mainly composed of linpan system which integrate rural residence, tree or bamboo groves, paddies and water bodies (e.g., hydraulic system and ponds) into a socio-ecological system and finally became the unique linpan landscape in the Chengdu Plain. The number of optimal and sub-optimal corridors was relatively higher than other areas in Chengdu City due to the reticulation of forested channels, ditches, roads and field paths. In additions, this area contained most of pinch-points, including 5 in Xinjin, 35 in Shuangliu and 18 in Xindu, as well as barrier points, including 2 in Pudu, 7 in Shuangliu and 8 in Longquanyi, all of which were priority nodes for ecological protection or restoration in the future.
3.2.2.3 Ecologically vulnerable area
This is an urbanized area, including urban center and neighboring districts such as Pidu, Wenjiang, and Shuangliu. In 2018, the average resistance coefficient here was very high, getting to the maximum of 2000 in several places. There were very few ecological sources and corridors, but a number of corridors could still be found in Xindu City due to the remained woodlands. Therefore, when planners and administrators of Xindu City undertake urban development and planning, they need to pay special attention to issues related to ecological source areas and ecological corridors. If urban development requires occupying or sacrificing ecological source areas and ecological corridors, new ecological sources and ecological corridors need to be simulated using 3S technology before planning the city’s development.
4 Discussion
With the rapid urbanization process in developing countries, urban areas are facing many environmental challenges in the process of expansion (Jie et al., 2023). It is thus necessary to integrate ecological conservation into urban planning for achieving sustainable development goals. While formulating development plan of a city, it is imperative for decision-makers to clarify important structure and process of ecosystems in urban and rural landscape, such as patches, corridors and nodes, which should be protected or restored for ESP construction (Zhang et al., 2021). Normally, large-scale forestlands, nature reserves and mountain wilderness are easily identified as ecological sources (Huang et al., 2020), but those corridors in particular of short corridors which can influence several ecological processes and functions of patches are always ignored by city planners. In comparison with traditional protection approach, constructing a holistic ESP in a city is more proactive in considering the integration of ecological sources and corridors into the spatial planning, which finally could be beneficial to the security and resilience of socio-ecological system at a regional scale (Yuan et al., 2022).
4.1 Constructing ESP in considering corridor width
A reasonable ESP of a given metropolitan area may comprise almost all of important ecological sources and corridors within its territory for the smooth flow and exchange of ecosystem services in and across the urban-rural continuum, which can minimize or absorb the adverse impacts of external disturbance and then enhance the resilient capacity of the region (Yu et al., 1996; Alberti, 2005; Elmqvist et al., 2013). Ecosystem services do not function alone, but interweave with each other and are strongly influenced by the ecological connectivity between patches. Without effective corridors or corridor network, the functions of hundreds or thousands ecological sources could not be really synergized. The spatial pattern of ecological corridors is determined by their components, ecological nodes as well as configuration. The width of a corridor has a direct impact on its functions (Zhang et al., 2021; Li WJ. et al., 2023; Tang et al., 2023). Previous studies in determining the width of corridors normally considered a narrow buffer belt along corridor sides, e.g., subjectively demarcating a 2 km wide belt on both sides of a corridor as the buffer zone (Zhang et al., 2021). This approach, although it was low expensive, was thought to be subjective or even arbitrary for determining how wide a corridor is or should be protected. Recently, a few of scholars applied circuit theory, which was originated from physics, to analyze the width of ecological corridors (Pierik et al., 2016; Peng et al., 2018; Li et al., 2019; Xu et al., 2019; Huang et al., 2020; Li J. W. et al., 2023; Tang et al., 2023). In this study, we used the cumulated resistance with changing thresholds to determine the width of corridors, which could be an example in testifying circuit theory. As showed in Figure 9, with the setting of empirical cumulative current higher than 0.01 (Peng et al., 2018; Huang et al., 2020) and the cumulated resistance of 100,000, the corresponding area of sub-optimal ecological corridors was identified, which was as high as 456.91 km2 in Chengdu City. These sub-optimal corridors are supplementary parts of the corridor network in Chengdu City and must be restored and integrated into spatial planning in the future. The integration of optimal and sub-optimal corridors, undoubtedly, would increase the efficiency and effectiveness of ecological connectivity in the region, and be beneficial further to the long-term maintenance of regional ecological integrity and security.
4.2 Constructing ESP with dynamic perspective
Ecological sources are very important with their continuous supplies of ecosystem services to both urban and rural residents. Although it is not so difficult to identify and structure the ESP of a city, maintaining and managing the efficient ESP over a long term is still a challenge. Recently, the construction of park city or garden city has been practiced in many countries (Yang Y. et al., 2022). With the increase of green spaces and their functions in a city year by year, these restored lands are becoming more and more new ecological sources or corridors, continuously optimizing the ESP of urban and rural landscape. Uchida et al. (2021) found that the habitat heterogeneity in a city had been improved effectively with the increase of green spaces and parks, which could further maintain the diversity and abundance of biological species at a high level (Gao Z. et al., 2021). Recently, due to the raised awareness of publics and decision makers on the importance of wetlands, for example, many water bodies in Chengdu City as well as in other cities of China have been restored as artificial wetlands or parks, which provide diverse habitats for aquatic plants and animals such as amphibians, birds and fish. All of these restoration efforts and achievements remind us that the ESP of a city is changeable. In this study, we identified not only stable ecological sources but also potential ecological sources where the ESV increased yearly due to the continuous endeavors in ecological protection or restoration. With this dynamic perspective, the restoring trend of ecological sources in Chengdu City has been considered in ESP construction. Moreover, ecosystem services are also changeable with the succession of biological communities and the change of human demands in urbanizing process. Thus, the assessment of ESP should be made once a few years with continuous monitoring inputs of ecological improvement and land cover/use change (Li et al., 2021; Zhao et al., 2021). In the future, more attentions could be paid to establish multi-scenario simulation in considering multiple factors of natural (e.g., climate change) and anthropogenic (e.g., urbanization) disturbances for better predicting the dynamic process of ESP and coupling economic development and ecological restoration. In this way, decision makers or landscape planners could make reasonable policies for optimizing landscape architecture of a park city (Kang et al., 2021).
4.3 Constructing ESP with holistic approach
Urban-rural continuum as a holistic system may reflect socio-economic transformations in the process of urbanization and then form a complicated web of connections (Xiao et al., 2016). The rapid urbanization in last few decades has transformed urban and rural landscape in China as well as Chengdu City, particularly influenced the ability of rural landscape to provide ecosystem services to city residents (Wu et al., 2020). Following the human-environment interactions between urban-rural interfaces having been reformed, the functionalities of both urban and rural areas in delivering ecosystem services must be reconsidered in constructing city ESP (Wolf, 2012; Wu et al., 2020). In view of the ongoing program Park City Construction in Chengdu City, more emphases have been given to the layout and restructure of green spaces in urban areas, which generally underestimates the importance of rural landscape in the whole ESP. In fact, vast rural lands dotted by woodlots (i.e., linpan units) dominate the ecologically sensitive area in the Chengdu Plain (see Figure 10), delivering affluent provisioning services as well as regulating and cultural services from croplands, woodlands and wetlands (Wu et al., 2020). With the ArcGIS 10.2 spatial analysis tool, in this study we identified 57,848 linpan units (85.92% of the total number) which were located within the distance of 200 m to ecological resources nearby, implying the close inter-dependency between rural inhabitants and nature. Hundreds and/or thousands of linpan units are networked as a holistic system, which connect ecological sources (e.g., forests, bamboo groves, reservoirs and water ponds) with diverse corridors, providing possible habitats or “step stones” for species migration, and supporting material flow and energy exchange between urban and rural ecosystems (Liu et al., 2017; Wu et al., 2020). Moreover, local farmers have their traditional knowledge and practices to apply agro-biodiversity and ecosystem services delivered from linpan system to adapt to changes or interventions (Zhong et al., 2022), which have contributed to the resilience of socio-ecological system in a long run. Therefore, local governments could explore the possibility of ensuring the long-term viability of linpan units and construct the city ESP in a holistic approach with the integration of restoring urban green space and preserving traditional rural landscape.
4.4 Improving methodology for ESP assessment
Although the importance of ESP in city planning has been understand progressively (Peng et al., 2015; Kang et al., 2018), the methodology should still be improved in the future. In this study, we identified ecological sources through assessing ecosystem services and ecosystem health, but only 5 services were used in the framework. As we know, the ecosystem services delivered from natural and semi-natural ecosystems in a city are numerous, including at least four categories (MA, 2005). Concerning the sustainable development goals of a city, other services should be considered in the assessment of ESP and the data gaps of ecological sources must be filled with fine tools. In order to establish ideal model, more attentions should be paid to reasonable framework with multiple key indicators (Li et al., 2021). And these indicators should be not only ecological, but also social, economic, and even cultural dimensions (Peng et al., 2015). Secondly, considering the importance of the width of ecological corridors in determining the function and process of ecosystems, the method for extracting corridor width could be improved further though coupling Ant Algorithm and Kernel Density Function (Zhao et al., 2021). According to Li et al. (2021), expert consultation could modify the result of quantitative assessment and enhance the assurance of corridor width (Li et al., 2021). Finally, with the progress of Park City Construction in Chengdu City, more and more greenways, border trees, forest belts and hairy water ways would be restored and preserved. These linear spaces could be used for multiple purposes in the future such as ecological corridor and citizen’s recreation. Now various techniques and methodologies have been developed to design effective ecological space (Teng et al., 2011), but their effectiveness in ecological connectivity and habitat linkage still needs to be assessed with actual cases (Tian et al., 2023).
5 Conclusion
With continuous urbanization in China as well as Chengdu City, natural habitats are under the influence of highly intensive interventions. The ESP of a city is fundamental to sustain socio-economic development through protecting and restoring ecological sources, which should be paid more attentions in spatial planning of a city in the future. In this study, we used an innovative method for identifying ecological sources in Chengdu City, combining the assessments of Ecological Security Value (ESV), ecosystem services, and ecosystem health. The ecological resistance surface was revised by nighttime light index successfully. Linkage Mapper combined with circuit theory was used to extract ecological corridors and key nodes for constructing and optimizing the ESP. The results showed that the ecological security of Chengdu City presented a declining trend from 2000 to 2010, and then rose from 2010 to 2018. In 2018, the ESP including 140 ecological sources with the total area of 8,819.78 km2, 302 ecological corridors with the area of 456.91 km2, as well as 61 pinch-points and 17 barriers. The ecological sources in Chengdu were mainly distributed in or nearby Longmen Mountain and Longquan Mountain, two flanks of the Chengdu Plain, and connected each other with hundreds of ecological corridors. In addition to forested lands in mountains and hills, linpan units (wooded lots), water bodies and agricultural fields across the rural landscape all together structured and consolidated the ESP of this city. The restored ecosystems including reforested lands, urban green spaces, and artificial wetlands supplemented more and more potential ecological sources and sub-optimal corridors to the structure of city’s ESP, which remind us that the assessment and construction of ESP must adopt a dynamic and holistic perspective.
Data availability statement
The original contributions presented in the study are included in the article/Supplementary material, further inquiries can be directed to the corresponding authors.
Author contributions
BZ: Investigation, Software, Visualization, Writing–original draft preparation. SW: Data curation, Investigation, Methodology, Software, Visualization, Writing–original draft preparation. NW: Conceptualization, Supervision, Validation, Writing–review and editing. GS: Conceptualization,, Writing–review and editing. CH: Data curation, Methodology, Software, Writing–original draft. LL: Investigation, Writing–review and editing. HC: Supervision, Validation, Writing–review and editing.
Funding
The author(s) declare that financial support was received for the research, authorship, and/or publication of this article. This work was supported by China Postdoctoral Science Foundation (2023M733439), the National Natural Science Foundation of China (32271676), Natural Science Foundation of Sichuan Province (2022NSFSC0984), and Sichuan Science and Technology Bureau Program (2022ZYD0122).
Conflict of interest
The authors declare that the research was conducted in the absence of any commercial or financial relationships that could be construed as a potential conflict of interest.
Publisher’s note
All claims expressed in this article are solely those of the authors and do not necessarily represent those of their affiliated organizations, or those of the publisher, the editors and the reviewers. Any product that may be evaluated in this article, or claim that may be made by its manufacturer, is not guaranteed or endorsed by the publisher.
References
Alberti, M. (2005). The effects of urban patterns on ecosystem function. Int. Regional Sci. Rev. 28, 168–192. doi:10.1177/0160017605275160
Alberti, M. (2008) Advances in urban ecology: integrating humans and ecological processes in urban ecosystems (No. 574.5268 A4). New York: Springer, 366.
Elmqvist, T., Fragkias, M., Goodness, J., Guneralp, B., Marcotullio, P. J., McDonald, R. I., et al. (2013) Urbanization, biodiversity and ecosystem services - challenges and opportunities: a global assessment. Dordrecht, Netherlands: Springer.
Feng, Z., Yang, L., and Yang, Y. (2014). Temporal and spatial distribution patterns of grain crops in the west liaohe river basin. J. Resour. Ecol. 5, 244–252. doi:10.5814/j.issn.1674-764X.2014.03.007
Gao, J., Du, F., Zuo, L., and Jiang, Y. (2021a). Integrating ecosystem services and rocky desertification into identification of karst ecological security pattern. Landsc. Ecol. 36, 2113–2133. doi:10.1007/s10980-020-01100-x
Gao, Z., Song, K., Pan, Y., Malkinson, D., Zhang, X. J., Jia, B., et al. (2021b). Drivers of spontaneous plant richness patterns in urban green space within a biodiversity hotspot. Urban Urban Gree 61, 127098. doi:10.1016/j.ufug.2021.127098
Gunderson, L. H. (2000). Ecological resilience - in theory and application. Annu. Rev. Ecol. Syst. 31, 425–439. doi:10.1146/annurev.ecolsys.31.1.425
Hu, S., Cao, M., Liu, Q., Zhang, T. Q., Qiu, H. J., Liu, W., et al. (2014). Comparative study on the soil conservation function of in VEST model under different perspectives. Geogr. Res. 33, 2393–2406. doi:10.11821/dlyj201412016
Huang, J., Hu, Y., and Zheng, F. (2020). Research on recognition and protection of ecological security patterns based on circuit theory: a case study of Jinan City. Environ. Sci. Pollut. Res. 27, 12414–12427. doi:10.1007/s11356-020-07764-x
IPBES (2019) Global assessment report on biodiversity and ecosystem services of the intergovernmental science-policy platform on biodiversity and ecosystem services. Bonn, Germany: IPBES secretariat, 1148.
Jie, Y., Xie, B. P., Wang, T. B., and Mak Mensah, E. (2023). Identification and optimization strategy of ecological security pattern in Maiji District of Gansu, China. Ecol. Indic. 157, 111309. doi:10.1016/j.ecolind.2023.111309
Kang, J., Zhang, X., Zhu, X., and Zhang, B. (2021). Ecological security pattern: a new idea for balancing regional development and ecological protection. A case study of the Jiaodong Peninsula, China. Glob. Ecol. Conserv. 26, e01472. doi:10.1016/j.gecco.2021.e01472
Kang, P., Chen, W., Hou, Y., and Li, Y. (2018). Linking ecosystem services and ecosystem health to ecological risk assessment: a case study of the Beijing-Tianjin-Hebei urban agglomeration. Sci. Total Environ. 636, 1442–1454. doi:10.1016/j.scitotenv.2018.04.427
Kroll, F., Müller, F., Haase, D., and Fohrer, N. (2012). Rural-urban gradient analysis of ecosystem services supply and demand dynamics. Land Use Policy 29, 521–535. doi:10.1016/j.landusepol.2011.07.008
Lechner, A. M., Harris, R. M. B., Doerr, V., Doerr, E., Drielsma, M., and Lefroy, E. C. (2015). From static connectivity modelling to scenario-based planning at local and regional scales. J. Nat. Conserv. 28, 78–88. doi:10.1016/j.jnc.2015.09.003
Li, J., Xu, J., and Chu, J. (2019). The construction of a regional ecological security pattern based on circuit theory. Sustainability 11, 6343. doi:10.3390/su11226343
Li, J. W., Dong, S. C., Li, Y., Wang, Y. S., Li, Z. H., and Wang, M. Y. (2023a). Environmental governance of transnational regions based on ecological security: the China-Mongolia-Russia Economic Corridor. J. Clean. Prod. 422, 138625. doi:10.1016/j.jclepro.2023.138625
Li, L. H. (2017). Balancing rural and urban development: applying coordinated urban-rural development (CURD) strategy to achieve sustainable urbanisation in China. Sustainability 9, 1948. doi:10.3390/su9111948
Li, S., Zhao, Y., Xiao, W., Yue, W., and Wu, T. (2021). Optimizing ecological security pattern in the coal resource-based city: a case study in Shuozhou City, China. Ecol. Indic. 130, 108026. doi:10.1016/j.ecolind.2021.108026
Li, W. J., Kang, J. W., and Wang, Y. (2023b). Spatiotemporal changes and driving forces of ecological security in the Chengdu-Chongqing urban agglomeration, China: quantification using health-services-risk framework. J. Clean. Prod. 389, 136135. doi:10.1016/j.jclepro.2023.136135
Lin, Y. P., Lin, W. C., Wang, Y. C., Lien, W. Y., Huang, T., Hsu, C. C., et al. (2017). Systematically designating conservation areas for protecting habitat quality and multiple ecosystem services. Environ. Modell. Softw. 90, 126–146. doi:10.1016/j.envsoft.2017.01.003
Liu, Q., Wang, Y. K., Guo, Y. M., and Peng, P. H. (2017). Research progress of linpan in Chengdu Plain. Chin. Agric. Sci. Bull. 33, 150–156. (in Chinese).
MA (Millennium Ecosystem Assessment) (2005) Ecosystem and human well-being: synthesis. Washington DC: Island Press.
Pan, J., and Wang, Y. (2021). Ecological security evaluation and ecological pattern optimization in Taolai River Basin based on CVOR and circuit theory. Acta Ecol. Sin. 41, 2582–2595. doi:10.5846/stxb202005111183
Peng, J., Chen, X., Liu, Y., Lü, H., and Hu, X. (2016). Spatial identification of multifunctional landscapes and associated influencing factors in the Beijing-Tianjin-Hebei region, China. Appl. Geogr. 74, 170–181. doi:10.1016/j.apgeog.2016.07.007
Peng, J., Liu, Y., Wu, J., Lv, H., and Hu, X. (2015). Linking ecosystem services and landscape patterns to assess urban ecosystem health: a case study in Shenzhen City, China. Landsc. Urban Plan. 143, 56–68. doi:10.1016/j.landurbplan.2015.06.007
Peng, J., Yang, Y., Liu, Y., Hu, Y., Du, Y., Meersmans, J., et al. (2018). Linking ecosystem services and circuit theory to identify ecological security patterns. Sci. Total Environ. 644, 781–790. doi:10.1016/j.scitotenv.2018.06.292
Peng, J., Zhao, S., Dong, J., Liu, Y., Meersmans, J., Li, H., et al. (2019). Applying ant colony algorithm to identify ecological security patterns in megacities. Environ. Modell. Softw. 117, 214–222. doi:10.1016/j.envsoft.2019.03.017
Pierik, M. E., Dell’Acqua, M., Confalonieri, R., Bocchi, S., and Gomarasca, S. (2016). Designing ecological corridors in a fragmented landscape: a fuzzy approach to circuit connectivity analysis. Ecol. Lett. 67, 807–820. doi:10.1016/j.ecolind.2016.03.032
Schneider, A., Seto, K. C., and Webster, D. R. (2005). Urban growth in Chengdu, Western China: application of remote sensing to assess planning and policy outcomes. Environ. Plan. B Plan. Des. 32, 323–345. doi:10.1068/b31142
Sharp, R., Tallis, H. T., Ricketts, T., Guerry, A. D., Wood, S. A., Chaplin-Kramer, R., et al. (2016). “InVEST +VERSION + user's guide,” in The natural capital project. Stanford university, university of Minnesota, the nature conservancy, and World wildlife fund. Available at: https://storage.googleapis.com/releases.naturalcapitalproject.org/invest-userguide/latest/index.html (Accessed April 12, 2023).
Shuai, N., Hu, Y. C., Gao, M. W., Guo, Z. L., and Bai, Y. P. (2023). Construction and optimization of ecological networks in karst regions based on multi-scale nesting: a case study in Guangxi Hechi, China. Ecol. Inf. 74, 101963. doi:10.1016/j.ecoinf.2022.101963
Su, X., Zhou, Y., and Li, Q. (2021). Designing ecological security patterns based on the framework of ecological quality and ecological sensitivity: a case study of jianghan plain, China. Int. J. Environ. Res. Public Health. 18, 8383. doi:10.3390/ijerph18168383
Tang, H., Peng, J., Jiang, H., Lin, Y. F., Dong, J. Q., Liu, M. L., et al. (2023). Spatial analysis enables priority selection in conservation practices for landscapes that need ecological security. J. Environ. Manage 345, 118888. doi:10.1016/j.jenvman.2023.118888
Tang, Z. L., Sun, G., Zhang, N. N., He, J., and Wu, N. (2018). Impacts of land-use and climate change on ecosystem service in eastern Tibetan plateau, China. Sustainability 10, 467. doi:10.3390/su10020467
Teng, M. J., Wu, C. G., Zhou, Z. X., Lord, E., and Zheng, Z. M. (2011). Multipurpose greenway planning for changing cities: a framework integrating priorities and a least-cost path model. Landsc. Urban Plan. 103, 1–14. doi:10.1016/j.landurbplan.2011.05.007
Tian, G., and Qiao, Z. (2014). Assessing the impact of the urbanization process on net primary productivity in China in 1989-2000. Environ. Pollut. 184, 320–326. doi:10.1016/j.envpol.2013.09.012
Tian, M. R., Gao, J. G., Song, G. B., and Feng, C. Y. (2023). Prioritizing ecological conservation strategies to enhance national ecological connectivity in China. Ecolo Indic. 150, 110273. doi:10.1016/j.ecolind.2023.110273
Uchida, K., Blakey, R. V., Burger, J. R., Cooper, D. S., Niesner, C. A., and Blumstein, D. T. (2021). Urban biodiversity and the importance of scale. Trends Ecol. Evol. 36, 123–131. doi:10.1016/j.tree.2020.10.011
Wang, Y., and Pan, J. (2019). Building ecological security patterns based on ecosystem services value reconstruction in an arid inland basin: a case study in Ganzhou District, NW China. J. Clean. Prod. 241, 118337. doi:10.1016/j.jclepro.2019.118337
Whiting, S. H., Abramson, D., Yuan, S., and Harrell, S. (2019). A long view of resilience in the Chengdu Plain, China. J. Asian Stud. 78, 257–284. doi:10.1017/S0021911819000111
Williams, J. R., Renard, K. G., and Dyke, P. T. (1983). EPIC: a new method for assessing erosion’s effect on soil productivity. J. Soil & Water Conservation 38, 381–383. doi:10.1016/0016-7061(83)90021-6
Wolf, K. L. (2012). “The changing importance of ecosystem services across the landscape gradient,” in Urban-rural interfaces-Linking people and nature (Madison, WI, USA: American Society of Agronomy), 127–146.
Wu, S., Wu, N., and Zhong, B. (2020). What ecosystem services flowing from linpan system-A cultural landscape in Chengdu Plain, southwest China. Sustainability 12, 4122. doi:10.3390/su12104122
Wu, S., Yang, H., Luo, P., Luo, C., Li, H., Liu, M., et al. (2021). The effects of the cooling efficiency of urban wetlands in an inland megacity: a case study of Chengdu, Southwest China. Build. Environ. 204, 108128–128. doi:10.1016/j.buildenv.2021.108128
Xiao, L. S., He, Z. C., Wang, Y., and Guo, Q. H. (2016). Understanding urban-rural linkages from an ecological perspective. Int. J. Sustain. Dev. World Ecol. 24, 37–43. doi:10.1080/13504509.2016.1157105
Xie, H., He, Y., and Xie, X. (2017). Exploring the factors influencing ecological land change for China’s Beijing-Tianjin-Hebei Region using big data. J. Clean. Prod. 142, 677–687. doi:10.1016/j.jclepro.2016.03.064
Xie, S. L., Marzluff, J. M., Su, Y. B., Wang, Y. Q., Meng, N., Wu, T., et al. (2022). The role of urban waterbodies in maintaining bird species diversity within built area of Beijing. Sci. Total Environ. 806, 150430. doi:10.1016/j.scitotenv.2021.150430
Xu, J., Fan, F., Liu, Y., Dong, J., and Chen, J. (2019). Construction of ecological security patterns in nature reserves based on ecosystem services and circuit theory: a case study in wenchuan, China. Int. J. Environ. Res. Public Health. 16, 3220. doi:10.3390/ijerph16173220
Yang, Q. J., Li, B., and Li, K. (2011). The rural landscape research in Chengdu's urban-rural intergration development. Procedia Eng. 21, 780–788. doi:10.1016/j.proeng.2011.11.2078
Yang, R., Bai, Z., and Shi, Z. (2021). Linking morphological spatial pattern analysis and circuit theory to identify ecological security pattern in the loess plateau: taking shuozhou city as an example. Land 10, 907. doi:10.3390/land10090907
Yang, X., Chen, R., Meadows, M. E., Ji, G., and Xu, J. (2020). Modelling water yield with the InVEST model in a data scarce region of northwest China. Water Supply 20, 1035–1045. doi:10.2166/ws.2020.026
Yang, Y., Feng, Z., Wu, K., and Lin, Q. (2022a). How to construct a coordinated ecological network at different levels: a case from Ningbo city, China. Ecol. Inf. 70, 101742. doi:10.1016/j.ecoinf.2022.101742
Yang, Z., Mao, P., He, Y. X., Ju, P. J., Huang, S. L., Feng, Y., et al. (2022b). Hot topics and research trends in park city based on a bibliometrics analysis. Chin. J. Appl. Environ. Biol. 28, 1084–1093. (in Chinese).
Yu, K. J. (1996). Security patterns and surface model in landscape ecological planning. Landsc. Urban Plan. 36, 1–17. doi:10.1016/S0169-2046(96)00331-3
Yuan, Y., Bai, Z., Zhang, J., and Xu, C. (2022). Increasing urban ecological resilience based on ecological security pattern: a case study in a resource-based city. Ecol. Eng. 175, 106486. doi:10.1016/j.ecoleng.2021.106486
Zhang, L., Peng, J., Liu, Y., and Wu, J. (2017). Coupling ecosystem services supply and human ecological demand to identify landscape ecological security pattern: a case study in Beijing-Tianjin-Hebei region, China. Urban Ecosyst. 20, 701–714. doi:10.1007/s11252-016-0629-y
Zhang, Y. (2018) Study on carbon emission effect in Chengdu plain area based on LUCC. Chengdu: Sichuan Normal University.
Zhang, Y. Z., Jiang, Z. Y., Li, Y. Y., Yang, Z. G., Wang, X. H., and Li, X. B. (2021). Construction and optimization of an urban ecological security pattern based on habitat quality assessment and the minimum cumulative resistance model in shenzhen city, China. Forests 12, 847. doi:10.3390/f12070847
Zhao, X., Yue, Q., Pei, J., Pu, J., Huang, P., and Wang, Q. (2021). Ecological security pattern construction in karst area based on ant algorithm. Int. J. Environ. Res. Public Health. 18, 6863. doi:10.3390/ijerph18136863
Keywords: ecosystem services, ecosystem health, ecological security pattern, ecological connectivity, circuit theory
Citation: Zhong B, Wu S, Wu N, Sun G, He C, Liu L and Chen H (2024) Constructing ecological security pattern based on spatio-temporal evaluation of ecosystem services and ecological health in Chengdu, Southwest China. Front. Environ. Sci. 12:1415301. doi: 10.3389/fenvs.2024.1415301
Received: 10 April 2024; Accepted: 09 May 2024;
Published: 05 June 2024.
Edited by:
Sérgio António Neves Lousada, University of Madeira, PortugalReviewed by:
Svitlana Delehan, Uzhhorod National University, UkraineLilei Zhou, Chongqing Jiaotong University, China
Raul Manuel Costa Alves, Camra Municipal de Machico, Portugal
Copyright © 2024 Zhong, Wu, Wu, Sun, He, Liu and Chen. This is an open-access article distributed under the terms of the Creative Commons Attribution License (CC BY). The use, distribution or reproduction in other forums is permitted, provided the original author(s) and the copyright owner(s) are credited and that the original publication in this journal is cited, in accordance with accepted academic practice. No use, distribution or reproduction is permitted which does not comply with these terms.
*Correspondence: Shuang Wu, shuangw1@outlook.com; Ning Wu, wuning@cib.ac.cn