Identifying favourable conditions for farm scale trafficability and grass growth using a combined Sentinel-2 and soil moisture deficit approach
 Rumia Basu
 Owen Fenton
 Eve Daly
 Patrick Tuohy
- 1VistaMilk SFI Research Centre, Teagasc, Moorepark, Fermoy, Ireland
- 2Earth and Ocean Sciences, College of Science and Engineering, Ryan Institute, University of Galway, Galway, Ireland
- 3Environmental Research Centre, Teagasc, Johnstown Castle, Wexford, Ireland
In Atlantic Europe, on poorly drained grasslands soils, compaction negatively affects soil health when trafficked in wet conditions, while optimum grass growth cannot be achieved in excessively dry conditions. In Ireland, daily soil moisture deficit (SMD) information is forecasted at regional scale for all soil drainage classes. Optimal paddock conditions can occur between trafficking (10 mm) and optimum grass growth (50 mm) SMD thresholds for an identified drainage class. The objective of this farm scale study is to improve the identification of optimum conditions in time and space by combining high resolution spatial soil moisture estimates with soil drainage class specific SMD data. For that purpose, Sentinel- 2 (S-2) data was used in a modified Optical Trapezoid Model (OPTRAM) to derive normalised surface soil moisture (nSSM) estimates at farm level. In-situ soil moisture sensors providing daily estimates of volumetric soil moisture were used for validation of OPTRAM with an RMSE of 0.05. Cumulative 7-day SMD prior to the date of each S-2 image was analysed for each year from 2017-2021 to select nSSM maps corresponding to negative, 0 or −0 and positive SMD. Results established a relationship between nSSM and SMD indicating optimal conditions changed spatially and temporally. The months of April, May, August and September always presented at least 35% of the farm area available for optimum management operations. Future refinement of this methodology utilising daily high resolution remote sensing data could provide near real-time information for farmers.
1 Introduction
Globally, grasslands are one of the major ecosystems, covering one-third of the earth’s landmass (Lemaire et al., 2011; Bengtsson et al., 2019). In Europe, permanent grasslands cover 34% of the agricultural area and provide a wide variety of ecosystem services (Habel et al., 2013; Schils and Milazzo, 2022). They are also diverse due to natural factors such as climate and soil, but also due to varying intensities of management practices resulting in gradients of fertilisation and grazing intensities (Blüthgen et al., 2012). Permanent grasslands in Europe have been the main source of livestock production and nutrient cycling on farms for centuries (Hejcman et al., 2013; Schils and Milazzo, 2022). Grass remains the cheapest source of high-quality feed for meat and dairy production (Schils and Milazzo, 2022).
In Atlantic Europe, excess of soil moisture is the main biophysical constraint to farm management (Schulte et al., 2012) and one of the main grassland soil threats is compaction induced by animals and machinery traffic, especially when the soil is excessively wet (Piwowarczyk et al., 2011; Newell-Price et al., 2013; Tuohy et al., 2015; Lepore et al., 2023). Over 90% of the agricultural land in Ireland consist of grasslands, pasture or hay which are an important source of feed for Irish livestock (Bondi et al., 2021). In Ireland, 56% of the livestock farms contain land classified as Less Favourable Area (areas that are difficult for cultivation because of natural factors such as steep slopes, soil productivity, etc.) (Schulte et al., 2012) and 30% of grasslands are on poorly drained soils (Teagasc, 2021b)
Soil moisture is commonly expressed in terms of soil moisture deficit (SMD), which is the amount of rainfall (mm) required to return the soil to field capacity (FC) i.e., the volume of water that can be present in the soil against gravity (“Met Éireann” n.d.). SMD is independent of pore space or rooting depth and can be used as a proxy for volumetric water (VW) content and requires fewer variables for measurement as compared to VW (Herbin et al., 2011; Schulte et al., 2012). In Ireland, Schulte et al. (2005) developed the hybrid SMD model for grassland capable of predicting daily SMD applicable to five soil drainage classes. At present, Met Éireann (National Meteorological Service) utilises this model and publishes daily SMD values across all soil drainage classes at regional scale. Daily SMD values can vary between −10 mm and 110 mm. For the farmer, this regional scale information can inform paddock scale decisions when the paddock soil drainage class is known. In terms of management decisions at −10 mm the soil is sub-optimal and saturated, between 10 and 50 mm the soil presents as optimal while drought like conditions are evident around 75 mm and the wilting point is reached at 110 mm (Schulte et al., 2012). The 10 mm and 50 mm thresholds are important from a farm management perspective and can be observed for any paddock of known drainage class. Although thresholds exist for SMD conditions related to soil and crop health, no such thresholds have been defined for soil moisture content.
Satellite remote sensing technology provides a mechanism to measure soil moisture at sub-field (100′s m2), sub-catchment (0.1–1 km2) and catchment (1–80 km2) scales. Many optical satellites such as Landsat, Sentinel-2 etc. offer high resolution data that has been used to estimate soil moisture (Q. Wang et al., 2020; West et al., 2018; Urban et al., 2018). High resolution microwave sensors such as Sentinel 1 have the added advantage of operating in all weather conditions and have been used to estimate high resolution soil moisture (Singh et al., 2020; Bhogapurapu et al., 2022; Chaudhary et al., 2022). Such technologies can help bridge the gap in existing decision support systems (e.g., hybrid SMD model coupled with farmer knowledge of paddock specific soil drainage class) by providing real or near real time spatial and temporal information to farmers about on-farm optimal operational conditions. However, both optical and radar satellites have limited penetration capabilities (Mohanty et al., 2017) and have been evaluated for soil moisture estimation at coarser spatial scales, especially with microwave sensors (S. Wang and Fu, 2023). Thus, they have restricted abilities at finer spatial and temporal scales, and therefore cannot be used for precision-agricultural applications (Babaeian et al., 2019). This is especially true for Ireland where persistent cloud cover is a reality.
The objective of the present study is to develop a methodology and application at high spatial resolution, whereby areas of a farm that are indicative of optimal/favourable trafficable and grass growth conditions can be identified both spatially and temporally. This is achieved by using a combination of daily SMD data which gives temporal information and Sentinel-2 derived normalised surface soil moisture (nSSM) which provides high resolution spatial information (10 m) on soil moisture conditions on the farm. The focus of the study is a dairy grassland farm in Ireland dominated by poorly drained heavy textured soils which tend to remain wet for very long periods especially after a rainfall event. Existing models for farm management are based on SMD thresholds alone and advisories for farm management in Ireland are based on these SMD thresholds (Eireann, 2023). Since SMD values do not have a spatial component/spatial information, any decision support tool based on SMD alone does not include spatial information crucial for decision making on the ground. To address this knowledge gap and to improve existing forecasts based on SMD estimates, this study uses optical satellite data from Sentinel-2 to estimate high-resolution normalised surface soil moisture (nSSM) using the Optical Trapezoid Model (OPTRAM) in conjunction with existing SMD based models. Estimates of nSSM are combined with an SMD model to define specific soil moisture thresholds for grass growth and trafficability on this farm to develop a decision support tool for farmers for designing targeted paddock-based management intervention. This study is aimed at developing soil moisture thresholds for defining favourable farm management conditions using a combined nSSM and SMD approach. The results are validated using in situ soil moisture data and through regular monitoring of farm conditions.
2 Materials and methods
2.1 Study area
The study farm (40 Ha) is located in Rossmore, Co. Tipperary (52° 36′N, 8° 01′W) and is part of the Teagasc Heavy Soils Programme (HSP) (Teagasc, 2021b). The farm mostly has a flat terrain and receives approximately 980 mm of rainfall annually. Annual grass production on this farm in 2022 was 13178 kg DM/Ha, being 11608 kg DM grazed and 1570 kg DM as silage conserved.
A soil survey at paddock scale was conducted on the farm in 2015, with every paddock assigned to a soil subgroup and associated drainage class in accordance with protocols developed for the Irish Soil Information System (ISIS) project The ISIS project was established in 2008 with the objective of constructing a national soil map at 1:25,000 scale to provide spatial and quantitative information about the soil type in Ireland. All the soils belong to one of the 11 soil Great Group and can be further classified into sub-groups (Simo et al., 2008; Environmental Protection Agency, 2014). Mapping of the soil type for each paddock on the farm was carried out using an auger and test pit survey. For every Ha, an auger bore was driven into the soil to a depth of 1 m and soil features such as colour, texture, mottling, etc. were recorded and soil type and drainage class (as shown in Figure 1B) assigned. Additionally, 3–4 soil pits, each at depth of 1–2 m were dug on the farm to further analyse the dominant soil type (Teagasc, 2021b). The dominant soil subgroup is Surface-Water Gley, which are wet, acidic soils and have gleying within 40 cm (Teagasc, 2014). The soil texture is mostly sandy loam and the paddocks are generally poorly drained (i.e., those that are saturated during a rainfall event and continue to hold excess water for multiple days after such events), except for paddocks 8,10, and 21 (Figure 1B) which are well drained (i.e., those that hold excess water during a rainfall event but not afterwards) (Schulte et al., 2015; Tuohy et al., 2018). Knowledge of the paddock drainage class enabled the correct SMD values to be assigned to each paddock.
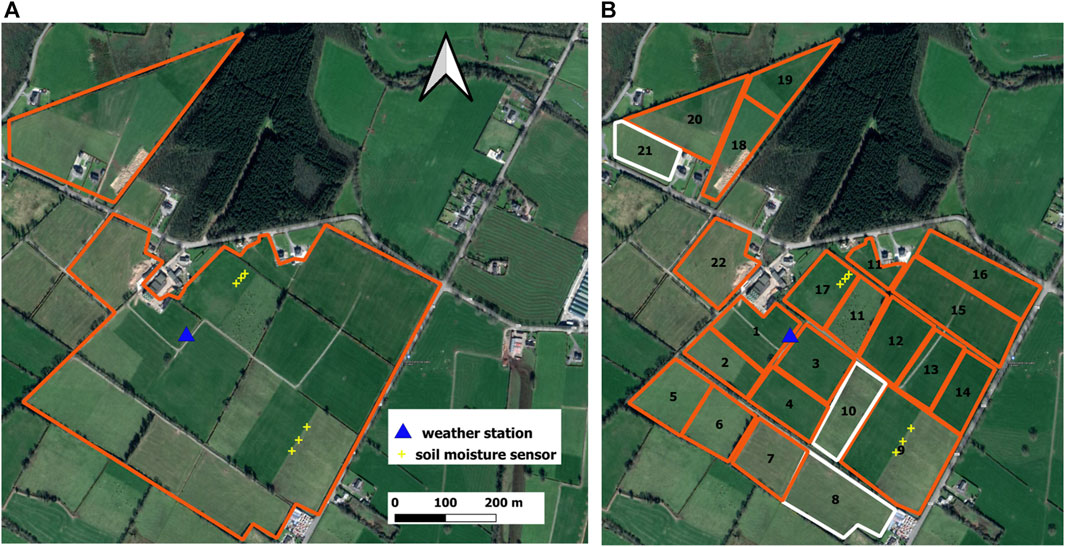
FIGURE 1. (A) Study area is within the orange polygon (B) paddock boundaries and paddock drainage class distribution in the study area, i.e., orange paddocks are poorly drained and white paddocks are well drained.
2.2 Satellite and in-situ data for estimation and validation of normalised surface soil moisture (nSSM)
Optical data from Sentinel-2 (S-2) is used in an Optical Trapezoid Model (OPTRAM) to estimate normalised surface soil moisture (nSSM) for the study area. The farm is equipped with in-situ soil moisture sensors, installed at a depth of 15 cm, providing daily estimates of volumetric soil moisture (VSM), based on soil resistivity and capacitance (Eireann, 2024), used for validation of OPTRAM. S-2 level 1 C product (ESA, 2013) was downloaded from the United States Geological Survey (USGS) Earth Explorer website (USGS Earth Explorer, 2024). The level 1C products comprise of ortho-rectified, Top of Atmosphere (TOA) reflectances, based on a UTM/WGS 84 projection reference system (Baillarin et al., 2012). The images were selected based on an initial visual interpretation of cloud cover and through an analysis of daily rainfall and Evapotranspiration (ET) data available from weather stations installed on the study area so as to ensure that the data represented all weather conditions for the study area, covering both wet and dry periods. A total of 30 S-2 images were downloaded from 2017-2021, that included cloudy and cloud-free data.
All the S-2 level 1C products were atmospherically corrected in QGIS using the Semi-automatic Classification Plugin and the Dark Object Subtraction (DOS) algorithm (Chavez, 1988; Gilmore et al., 2015). The cloudy Sentinel-2 data were masked using a cloud mask available with the Sentinel 1 C product as part of the quality information (Coluzzi et al., 2018).
2.3 OPTRAM
OPTRAM was developed to estimate soil moisture using satellite data. OPTRAM (Sadeghi et al., 2017) is an improvement over the Thermal-Optical Trapezoid Model (TOTRAM), which is one of the most popular approaches to mapping soil moisture using remote sensing. OPTRAM improved TOTRAM by replacing Land Surface Temperature (LST) in TOTRAM with the short wave infrared band as a measure of soil moisture, thereby, eliminating the need for calibration of each satellite observation since LST depends on parameters such as surface air temperature, wind speed and relative humidity. This modification makes OPTRAM suitable to be used even with those satellites that do not have a thermal band (Sadeghi et al., 2017). OPTRAM has been found to perform better than TOTRAM (Burdun et al., 2020) with the former reaching positive correlation values of upto 0.8 and the latter with low negative correlation values with water table depth. This model uses vegetation index (VI) and the Shortwave Transformed Infrared Reflectance (STR), calculated from short wave infrared (SWIR) band to map soil moisture in the STR-VI space., STR has been tested successfully for its sensitivity to soil moisture over vegetated surfaces, assuming a linear relationship between soil and vegetation water content. Though, originally developed over arid and semi-arid climatic conditions, in recent years, OPTRAM has been successfully applied over a variety of land cover including wetlands and peatlands (Burdun et al., 2020; Burdun et al., 2023; Mokhtari et al., 2023). Similarly, Basu et al., 2024 also applied OPTRAM to estimate soil moisture in the same study site as in this paper, which is also dominated by wet conditions.
Studies have shown that the VI-STR relation for high vegetation cover may be non-linear (Mananze and Pôças, 2019; Hassanpour et al., 2020) and that non-linear parametrization of OPTRAM lead to better accuracies in soil moisture estimates as compared to linear parametrization (Ambrosone et al., 2020). Following from such studies, this study also modified OPTRAM by using a non-linear double logistic function instead of a linear function to determine the wet and dry edges in the STR-VI space. In this study, S-2 band 12 (i.e., SWIR band centred at 2190 nm) has been used to compute STR. The normalised surface soil moisture (nSSM) for each pixel is calculated as a linear distance between the dry edge and the wet edge using Eq. (1) as:
where, X is the STR of the pixel for which nSSM is to be calculated, d is the STR on the dry edge curve and w is the STR on the wet edge curve. All other pixels would thus, have nSSM values between 0 and 1.
Additionally, another modification made to OPTRAM in this study is the use of the Enhanced Vegetation index (EVI) instead of the Normalised Difference Vegetation Index (NDVI) as used originally in OPTRAM. EVI has several advantages over NDVI especially with respect to saturation issues over vegetated lands, where its sensitivity decreases with increasing biomass (Rocha and Shaver, 2009; Antunes Daldegan et al., 2020; Ojha et al., 2021) and based on class separability, it has also been shown to be an optimum VI for studying Irish grassland using S-2 data (Saadeldin et al., 2022). nSSM maps for the farm were obtained at a spatial resolution of 10 m (Figure 2). The model has been validated using volumetric soil moisture data from in-situ soil moisture sensors installed on the farm. There are 6 in situ soil moisture sensors installed on the farm at a depth of 15 cm, providing daily estimates of volumetric soil moisture. An RMSE of 0.05 and an R2 of 0.4 was obtained between modelled nSSM and in situ volumetric soil moisture (Basu et al., 2024). The range of volumetric soil moisture is between 0.1 and 0.6 m3/m3.Further details about the methods and validation of OPTRAM used in this study area is available in Basu et al., 2024.
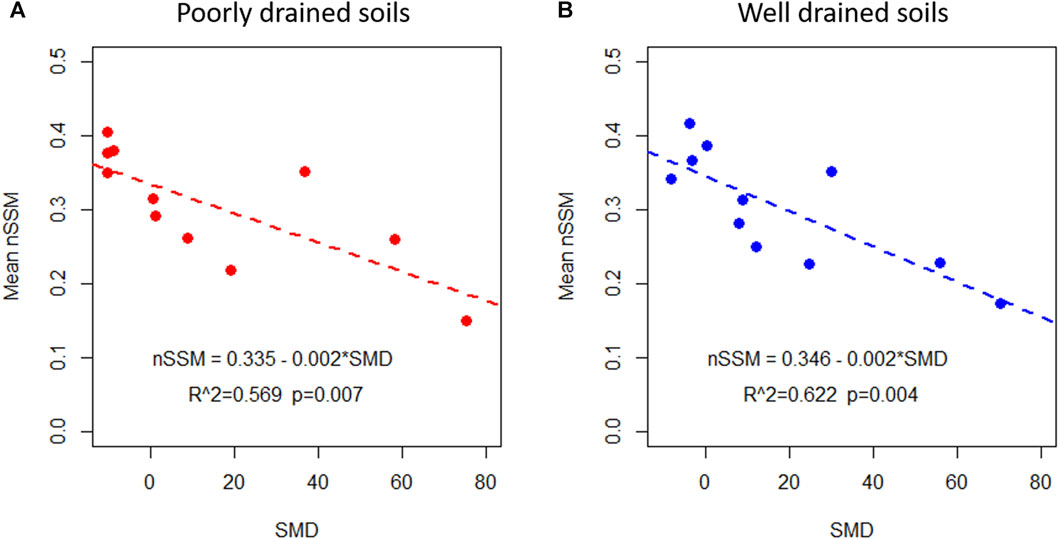
FIGURE 2. Linear regression between SMD and mean nSSM for (A) poorly drained and (B) well drained soils.
2.4 Soil moisture deficit (SMD)
SMD is calculated using the grassland hybrid model of Schulte et al. (2005, 2015) using site specific data from the meteorological weather station on the farm, i.e., daily max and min temperature, rainfall, wind speed and solar radiation. It is a water mass balance model that calculates SMD from a cumulative balance of rainfall, evapotranspiration and drainage using Eq. (2) as:
Where,
As paddocks on the farm are either poorly or well-drained (Figure 1B), the SMD model was run for these two drainage classes for the years 2017–2021, co-incident with the time period of S-2 data. The SMD time series for the farm represents temporal information where each value in the time series is a value/point in time and does not have a spatial component. SMD values in general can be interpreted as follows: negative SMD represents wet soils/wet conditions on the farm, 0 or nearly 0 SMD represents field capacity (FC) i.e., the maximum amount of water a soil can hold against gravity and positive SMD represents dry soil/dry conditions on the farm. More specifically, at an SMD of −10 mm, the soil is considered saturated, percolation commences at 0 mm, and the hydraulic conductivity increases from 0 SMD to a maximum value (soil saturation) which is specific to a drainage class (Schulte et al., 2005; 2012).
2.5 Development of optimal thresholds using nSSM and SMD
To develop a relationship between nSSM and SMD, firstly, a cumulative sum of 7-day SMD prior to the date of each S-2 image collected in the period from 2017 to 2021 was calculated. This helped in selecting specific S-2 dates from the time series which corresponded to negative, 0 and positive SMD values, covering the entire range of SMD conditions on the farm for the study period. 11 such S-2 images were finally selected out of the 30 available S-2 images that represented very wet to very dry conditions of soil moisture on the farm.To calculate a relationship between SMD and nSSM, two linear regression models were developed between mean nSSM for the 11 selected S-2 images for the farm and the corresponding SMD estimates on those 11 dates for poorly and well drained soils, respectively.This model was run using the lm function from the stats package in R (The R Foundation, 2018). The lm function uses an ordinary least squares (OLS) method for modelling the relationship between the dependent and independent variables. The mean nSSM was calculated as a spatial average of all the pixels on a particular day covering the farm. This enabled direct comparisons between the time series of SMD and mean nSSM.
As discussed previously, values in literature suggest that 10 mm and 50 mm are the thresholds that represent conditions of restricted trafficability on soils (Schulte et al., 2012; Vero et al., 2014) and grass growth, respectively (Teagasc, 2021a). Any SMD value between these two thresholds should be considered an optimum “window of opportunity” for both soil and crop. Therefore, SMD thresholds of 10 and 50 were applied to the each of the two regression models to arrive at corresponding nSSM thresholds of 0.235 and 0.315 respectively. Thus, three categories (i.e., <0.235, 0.235–0.315 and >0.315) of nSSM were obtained corresponding to “excessively dry,” “optimum” and “excessively wet” conditions respectively. Proportions of farm area falling under each of these nSSM categories were calculated. The middle category of nSSM (0.235–0.315) represents the optimum “window of opportunity” in terms of safe soil and crop utilisation on the farm and will be referred to as the “optimum” category in this study henceforth. The optimum nSSM category represents general favourable conditions for trafficability and grass growth in the study area. A flowchart of the methodology is presented in supplementary information.
The patterns of soil moisture in the optimum nSSM category as well as in the other categories are shown in Figure 3. These results have been validated using expert knowledge about the drainage and soil characteristics of the farm as well as by interaction with farmers. Since the farm is part of the Teagasc Heavy Soils Programme, there is complete access to and detailed knowledge about farm conditions and data such as SMD, weather, and farm management activities.These farms have been visited multiple times thorughout the year during the study period and have been visually assessed for soil moisture conditions during those times which confirm to their respective drainage classes at that time. This fine scale knowledge and data was used to validate the results.
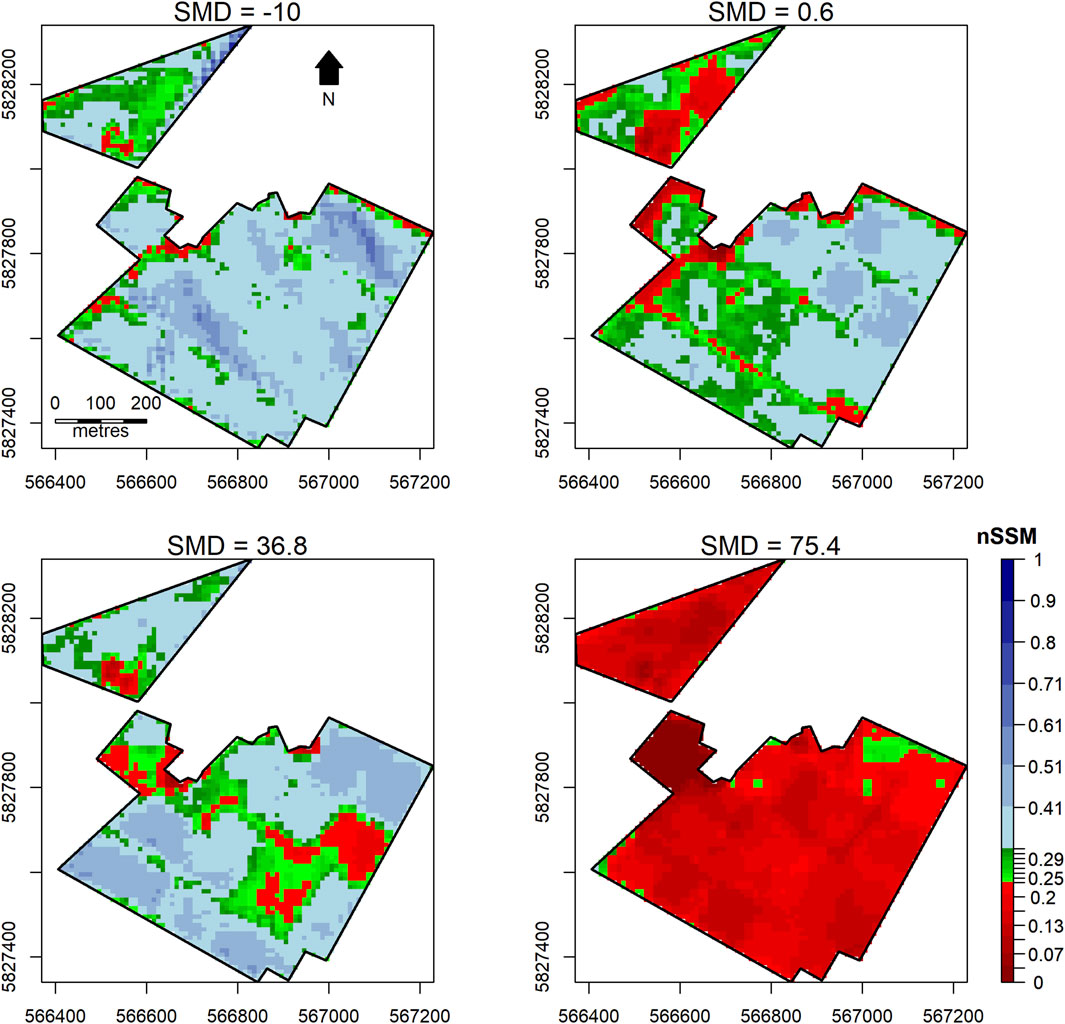
FIGURE 3. Example of nSSM maps for negative, −0, optimum category and positive SMD. Green regions represent soil in the “optimum” category, blue regions represent wetter than optimum conditions and red region represent drier than optimum conditions. Units of SMD are in mm.
2.6 Calculation of proportion of farm area within the optimum category at a daily time step
To examine the proportion of farm area within the optimum nSSM category, a piecewise linear regression function (from segmented package in R) (Muggeo, 2008) was fitted between the proportion of farm area in the optimum category of nSSM for the 11 selected S-2 images (as obtained in Section 2.5) and the corresponding SMD on these dates. Using this function, the proportion of farm area falling within the optimum category was predicted at daily time steps from the daily SMD estimates. The daily values were averaged into monthly values for the time series to identify trends of trafficability and grass growth for the farm across the time series (Figure 5).
3 Results
3.1 Optimal threshold range for nSSM
3.1.1 Regression between SMD and nSSM
Figures 2A, B show the linear regression models between mean nSSM of the 11 selected S-2 images and the corresponding SMD for both poorly and well drained soils, respectively. The slopes for both soil types is identical (0.002) and the intercept is similar with minimal difference. The co-efficient of regression is highly significant for both soil types. However, since most of the paddocks on the farm are poorly drained (Figure 1B), the regression model for the poorly drained soil type was finally selected for all subsequent analysis and this model was used to calculate thresholds for soil moisture regime based on SMD thresholds of 10 mm and 50 mm.
Three categories of nSSM values.i.e., “Excessively Dry” (<0.235), “Optimum” (0.235–0.315) and “Excessively Wet” (>0.315) were obtained from the regression model between mean nSSM and SMD. For each of these categories, the propotion of farm area falling within the partcicular category was calculated as shown in Table 1. The optimum category of nSSM (0.235–0.315) corresponding to SMD between 10mm and 50 mm represents the moisture range for optimum soil and crop conditions on the farm.
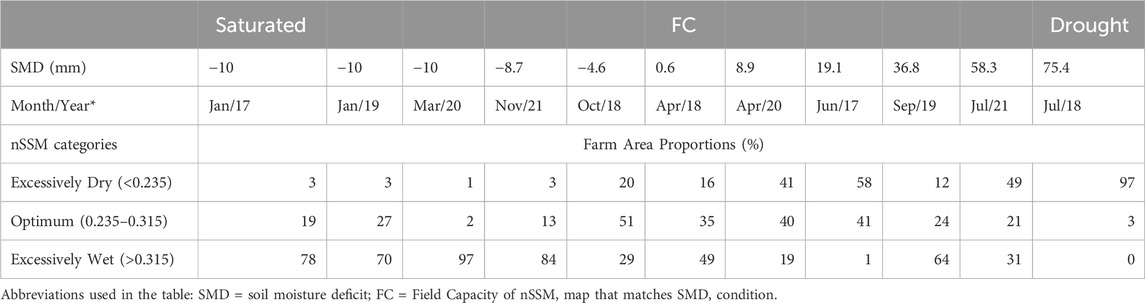
TABLE 1. SMD values and farm area proportions (%) within the identified nSSM categories.
3.2 Spatial and temporal patterns of nSSM on the farm
Examples. of nSSM maps for negative, −0, within the optimum range and maximum SMDs in the time series are shown in Figure 3. The maps show spatial variability of nSSM in the farm for different SMD conditions. It is important to note that this spatial variability is not paddock specific and shows a spatial continuum. The optimum category of nSSM (0.235–0.315), is coloured in low to high shades of green. As can be seen for the figure, this green region is spatially variable across the farm under different conditions of SMD and merges across paddocks. Blue areas on the farm represent wetter than the optimum condition and red areas correspond to drier than optimum conditions. Specifically, the soils in the blue regions on the farm would be susceptible to poaching/surface damage in case of trafficking by animals or machinery while those in the red region are mostly limited by grass growth potential with trafficability not being a key constraint (although compaction may remain a risk to soil health). It is interesting to note that even on the day of highest SMD (75.4 mm), which represents very dry conditions and in this case, almost a drought situation, there is still a small proportion of the farm where the soil moisture status is such that grass growth is not restricted. Similary, on a relatively wet day (SMD −10 mm), small patches of green and red areas can be seen. Most of the red regions on this image correspond to man-made features such as the fringes of the farm yard or farm roads, while the green regions represent soil within the optimum category. It is also important to understand that on the ground, the green region representing ideal soil conditions is not a rigid boundary and would merge with other classes of nSSM preceeding and following it.
3.3 Relationship between proportion of farm area in the optimum category and SMD
Figures 4A, B shows the piecewise regression between proportion of farm area in the optimum, and drier and wetter than optimum category of nSSM, repsectively, for the 11 selected S-2 images and the corresponding SMD on these dates. In the absence of a daily S-2 time series, this model was used for predicting daily farm area proportions in the optimum nSSM category. This ensured that the temporal scale of SMD and nSSM time series matches, necessary for identifying trends of trafficability and grass growth (Figure 5). The variability in scatter in Figure 4 is evident, with SMD values greater than 0 showing an almost linear relationship with optimum farm area proportions. We, however, retain all observations to not further limit the data points and also to avoid introducing any bias in the model. The model was able to explain 76% % (R2) of the observed variability. The residual standard error of the model was 9.125 on 7 degrees of freedom. The Cook’s distances were less than 1 and hence individual observations did not unduly influence the model fit.
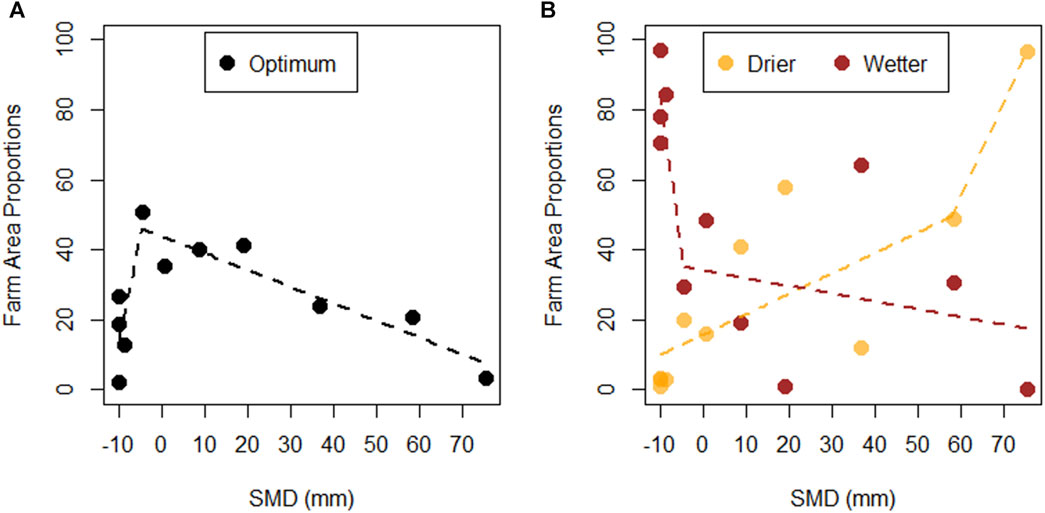
FIGURE 4. (A) Proportion of farm area in the optimum category of nSSM. (B) Proportion of farm area in the drier and wetter than optimum category. Note: Dashed lines are the piecewise regression model between the variables.
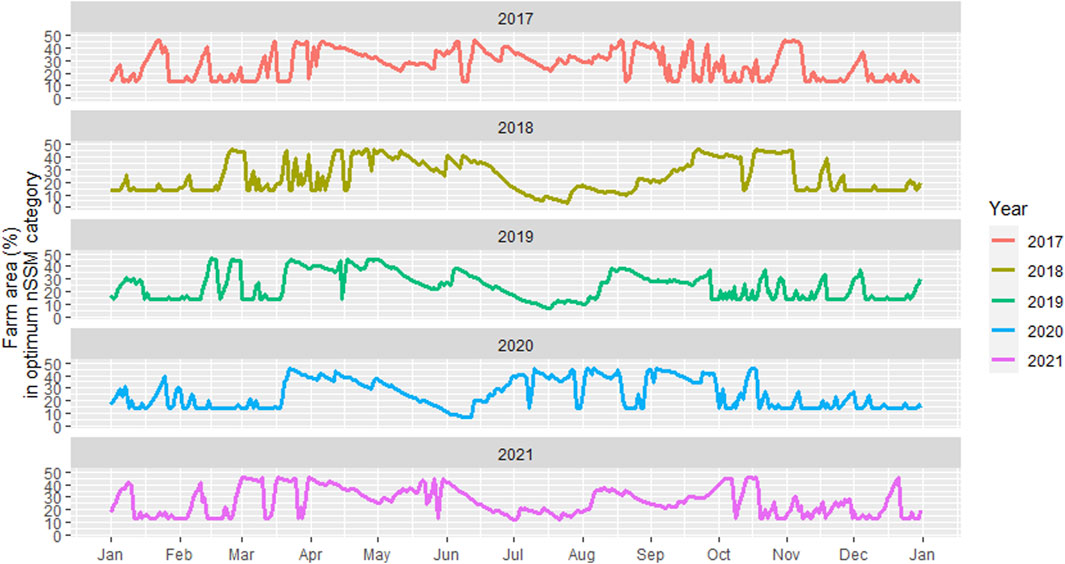
FIGURE 5. Daily estimates of farm area proportions (%) in the optimum nSSM category between 2017 and 2021, calculated using the piecewise regression function between nSSM and SMD.
Figure 5 shows the time series of the daily estimates of farm area proportions in the optimum nSSM category predicted using the second order polynomial function (Figure 4). This proportion ranges from 20% to 50% % during the study period. Generally, the proportion of area deemed optimum peaked between the months of April- October, with up to −50% of the farm area being within the optimum category of nSSM in these months across the study period. In other words, up to half of the farm would have been optimal for carrying out farm management operations safely for both soil and crop in this period. This proportion is relatively low for the year 2018 in these months (between 10% and 40% vs. −50%% in the other years) as expected since this was a year of extreme weather variability in Ireland when persistent rain in spring and early summer gave way to drought conditions by mid-summer. As such soil moisture conditions fluctuated towards the extremes more commonly than in other years.
Figures 6A, B show the monthly mean proportions of farm area in the optimum nSSM category for the time series for the months of January-June and July-December respectively. In the study period, the months April, May, August and September typically saw the best conditions where soil moisture was at an optimum level over a wider area and excessively wet or excessively dry conditions are avoided. In these months, approximately 35% of the farm area was in the optimum nSSM category at all times during the period of analysis. This percentage is slightly less for the year 2018, especially for August (Figure 6C) due to the extreme conditions as mentioned earlier. Typically, the months of October to March are limited by excessively wet conditions while June and July have seen severe moisture deficits. Increasing variability in climate and localised weather imposes extremes in the typical soil moisture regimes in a given year.
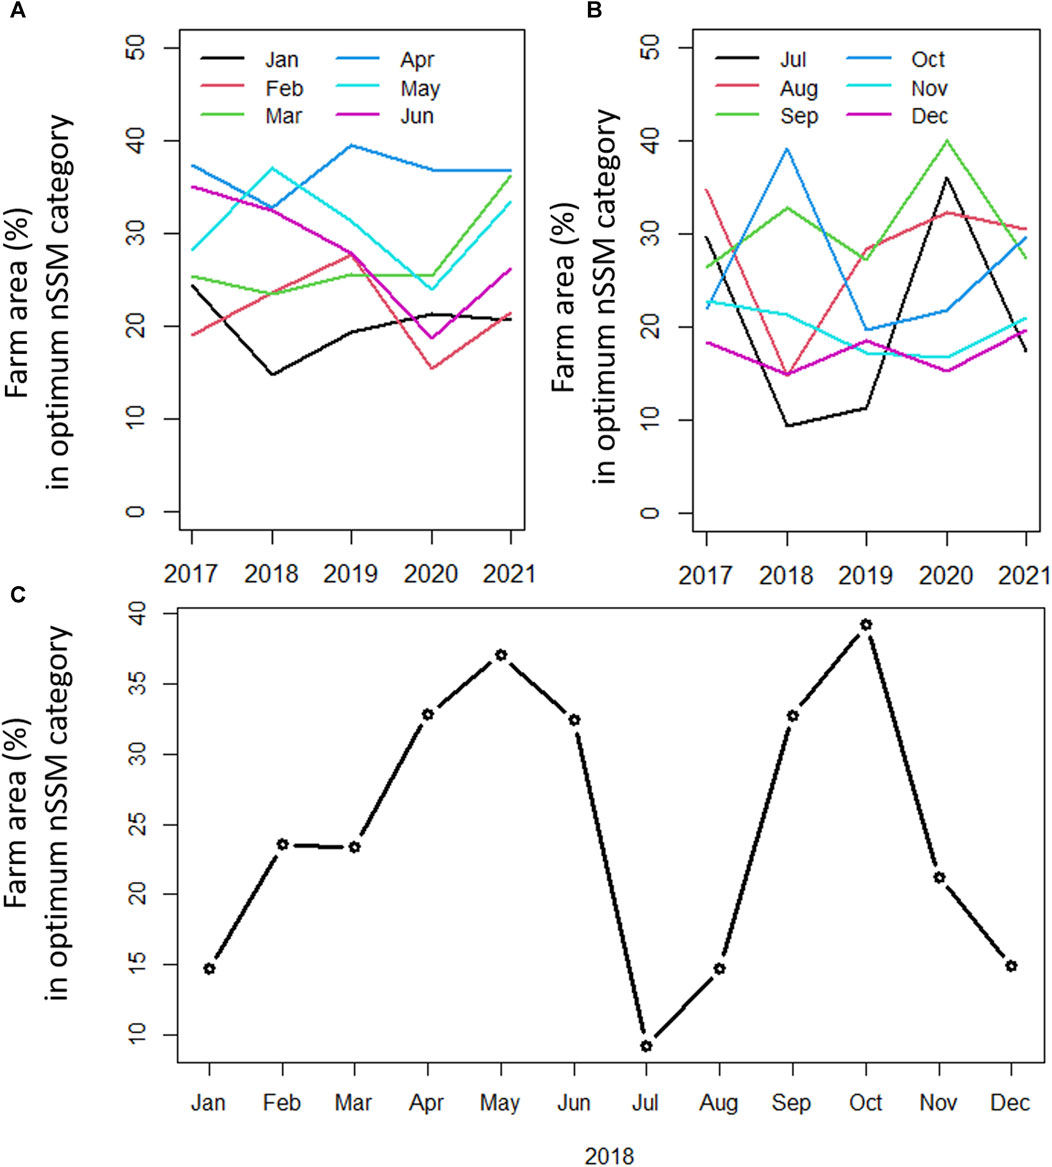
FIGURE 6. (A) Monthly mean proportions of farm area in the optimum nSSM category from January-June of the time-series, (B) Monthly mean proportions of farm area in the optimum nSSM category from July-December of the time-series (C) Monthly mean proportions of farm area in the optimum nSSM category for the year 2018.
4 Discussion
4.1 Overall advantage of using optimal nSSM thresholds ranges over SMD alone
SMD based decision support tools are valuable for aiding decision making, where the farmer has knowledge of the drainage class of individual paddocks. Examples of where the SMD tool was used include Piwowarczyk et al. (2011) who used this model to predict the risk of damage from animal grazing on grassland soils and Vero et al. (2014) used this model to determine SMD thresholds, incorporating it into a decision support tool for trafficability and slurry spreading on farms. This model has also been used to monitor nitrous oxide emissions from grassland sites in Ireland, showing that higher soil moisture on the day of fertiliser application tends to increase average annual emissions (Hawkins et al., 2007). Estimates of SMD obtained from this model has also been used to identify opportunity for spring application of slurry in Ireland (Lalor and Schulte, 2008). A study in Ireland confirmed the effectiveness of such a decision support system which when combined with farmers’ local knowledge about drainage conditions of paddocks on their farms helped in reducing nutrient losses and managing slurry spread so as to increase nutrient uptake by plants (Kerebel et al., 2013). However, as discussed previously, current decision support tools based on SMD alone have a temporal component only. This is a crucial knowledge gap because information on spatial variability of soil moisture conditions is also important for effective farm management. Figure 3 also confirms that on a particular day for a single value of SMD, the patterns in nSSM are not same and vary through the spatial extent of the farm. This means that it is prudent to use the SMD model within the current methodology and to combine it with soil moisture content information as shown in this study to produce the nSSM categorisation for optimal operational conditions, and produce both temporal and spatial information This new technique as proposed in this study moves beyond the physical boundaries of paddocks and displays data at a higher resolution in space and time, and would thus help in taking more informed decisions for farm management.
By including high resolution soil moisture data, this study showed that moisture regimes are not paddock specific. The national advisory in Ireland that generates valuable advice for safe farm management issues one set of rules/advice at a regional scale based on SMD values. However, Figure 3 shows that for a single value of SMD which is specific to a praticular drainge class, the soil moisture regime within the same drainage class also varies in space, and exhibits a continuum, i.e., not following paddock boundaries. Therefore, management decisions should also vary within a paddock depending on the soil conditions. Decision support systems based on SMD alone, though useful, may not always suffice because not all areas on the farm behave uniformally at a given day/time and can sometimes lead to under-utilisation of resources. This study shows that across the time-series, most of the years had around 50% of farm area with soil conditions that were at a lower risk of compaction as compared to very wet conditions. Thus, these areas could have been accessed safely, providing optimal management conditions. Using this improved decision support system which uses high resolution soil moisture estimates together with SMD data, farmers can ensure complete utilisation of farm resources, not having to restrict operations on the farm entirely. As shown in this study (Figure 3), even on driest days, farmers can identify certain parts of the farm that are optimum for grass growth and can, for example, design targeted fertiliser applications to those areas. Similarly, on a wet day (SMD = −10 mm), the green regions represent soil within the optimum category probably due to topographical features, which are at a higher elevation than the surroundings and slope to either sides. This would minimise usage of excessive chemical fertilisers, thereby reducing emissions from the farm, particularly with respect to chemical nitrogen (N) fertilisers. This has important implications for Ireland to meet the Government’s Climate Action plan that aims to reduce chemical N fertilisers. As other information is available on soil moisture through the use of remote sensing techniques this offers finer scale possibilities, i.e., moving away from paddock specific outcomes to those that may change for the same paddock over time and space. Increasing variability in climate and localised weather imposes extremes in the typical soil moisture regime in a given year. This offers challenges to standard farm management practices and results in increased volatility, which impose significant stresses on the farm system. Soil moisture data can help us understand recovery rates of farms to get back within the “optimum window of opportunity” after a stress event, such as a drought, as was the case in 2018. This information can also help improve existing decision support tools, such that, depending on recovery rates of different areas on farms, targeted actions could be taken for farm management and precison farming such as grazing management, fertiliser applications, etc. Farmers can adopt a number of strategies to cope with sub-optimal conditions, which at either extreme (wet or dry) require supplementary feed and additional labour. However, further support in decision making would ensure optimisation of management to increase overall system sustainability, efficiency and profitability. This is particularly important in light of efforts to mitigate the environmental impacts of agriculture in line with agreed targets and as weather extremes (saturated soils and drought) are likely to occur with greater frequency in coming years.This model would be most effective in designing precision agriculture strategies across the world.
4.2 Future research
The first step would be to test this improved decision support tool on other farms in Ireland, especially those dominated by poorly draining soils and then expand this methodology to similar farms across the world. The thresholds of nSSM obtained in this study could be tested on other farms of the Teagasc HSP sites to ascertain if the same moisture conditions are valid across the farms for trafficability and grass growth. Since, all HSP sites have similar soil and drainage characteristics, this would help improve the model if needed and make it more robust. A study similar to Kerebel et al. (2013) could be designed where farmers’ knowledge about drainage conditions on these farms could be used to validate the results from this tool. It would also be interesting to test “before and after” scenarios to understand if the farmers were able to utilise their farm resources more optimally after using this tool and not having to restrict operations on the farm during certain times of the year. It would be hugely beneficial if the farmers could practically use spatial maps as generated in Figure 3 to identify optimum areas on their farm for crop growth and trafficability. The next step in the development of this tool would be to use to use daily high-resolution images such that a daily high resolution trafficability and productivity map can be made available to farmers. This could be achieved using drones and would be especially helpful in countries like Ireland where persistent cloud cover makes it difficult to obtain long time series of optical remote sensing data. Daily images would help match the temporal scale of SMD data, ensuring better comparison between the two variables (SMD and nSSM) and would, thus, help improve the accuracy of the model. This is a subject of further research and could lead to the development of a predictive decision support tool for farmers not just in Ireland but across the world, especially in regions where targeted irrigation (precision agriculture) is essential for achieving food security. Additionally, this study acknowledges that even in Atlantic climates like Ireland, droughts are becoming a recurrent phenomenon (Antwi et al., 2022), which would result in soil compaction in dry soils. Thus, the model would have to be updated to account for such conditions and new thresholds might need to be defined for favourable trafficability and grass growth conditions. Along with trafficability, it would also be important to assess risk of compaction in soils even under trafficable conditions, with the help of available tools like (Terranimo, 2024) which helps assess soil compaction by agricultural vehicles, taking into account soil and vehicle properties such as clay content, tyre pressure, etc. Such decision support tools could be improved even further if local meteorological data is available for the farm representing accurate local weather conditions, improving predictions. To test this new decision support system, it would be important to test this model on a subset of farms to test different scenarios a) how well farmers local knowledge of their farms matches with the predictions from the existing SMD model with regards to accessibility of the farms b) if the predictions from the new model that also combines estimates of soil moisture with SMD can help in achieving higher productivity from their farms.
A major threat to soil quality on farms in Ireland is from traffcking by machinery and grazing by animals. Most of the damage happens in the form of short-term compaction of top soil or long-term depth compaction. Bondi et al. (2021) developed a national Soil Trafficking Intensity Index in Ireland for Compaction (STIC) which is a sum of compaction from machinery and grazing to identify which management regime poses more threat to soil structure and also the levels of such management intensities that “soil can cope with” based on soil conditions. In general, it was found that grazing management has much lower risk of soil compaction because though the pressure by animals is greater on soil as compared to machinery, the pressure is evenly distributed on the farm as opposed to localised pressure by heavy machinery. Farmers also thus follow grazing management regime in Ireland. However, for poorly drained soils as in this study, a closer investigation is required because such soils are in particular more imapcted by trafficking from both management operations. Combining this index with the proposed decision support tool could be especially valuable for managing soil and crop health on poorly drained soils. This could provide support to different stakeholders such as farmers, contractors and policymakers by providing high resolution spatial information on soil condition on farms to develop tailored management response within farms. Alternatively, since the reliability of STIC depends on field scale data, a high resolution soil moisture estimate could help improve this index.
5 Conclusion
This study presents one of the first attempts to assess optimised management capabilities at the farm level and is a proof of concept for improving existing decision support tools for farm management applications using estimates of both SMD and soil moisture regimes. This study focusses on a site dominated by “heavy” or wet soils, however, previous studies have shown that varying levels of compaction can occur across a range of moisture conditions, including dry soils (Keller et al., 2019). The validation of this study is based on expert knowledge about paddock soil and drainage conditions and continuous monitoring of the farms which gives information at very fine scales both spatially and temporally. While this study acknowledges the effectiveness of existing decision support systems, it also addresses the knowledge gap of a missing threshold for soil moisture regimes by developing an index for soil moisture for optimum trafficability and grass growth on farms, equivalent to SMD thresholds for same. This makes it more practically applicable on farms, given the limitations associated with a single value of used at farm scale. It is also essential to capture such differences to ensure complete utilisation of resources, where a part of the farm which is most susceptible to damage to soil or cannot support grass growth can be closed for activities, while some areas could still be used for crop production, etc. This decision support tool also highlights specific months where maximum usage of the farm can be made with minimum damage to the soil and optimal production conditions.
Data availability statement
The Sentinel-2 data used in this study are available from the USGS EarthExplorer https://earthexplorer.usgs.gov/. The in situ digital data may be available upon request to the corresponding author subject to restrictions.
Author contributions
RB: Conceptualization, Data curation, Formal Analysis, Investigation, Methodology, Software, Writing–original draft, Writing–review and editing. OF: Conceptualization, Data curation, Investigation, Methodology, Supervision, Writing–review and editing. ED: Data curation, Investigation, Methodology, Resources, Software, Supervision, Writing–review and editing. PT: Conceptualization, Data curation, Funding acquisition, Investigation, Methodology, Project administration, Supervision, Writing–review and editing.
Funding
The author(s) declare that financial support was received for the research, authorship, and/or publication of this article. This publication arises from research conducted with the financial support of Vista Milk SFI Research Centre, Teagasc, Science Foundation Ireland (SFI) and the Department of Agriculture, Food and Marine on behalf of the Government of Ireland under Grant Number (16/RC/3835).
Acknowledgments
The authors thank the farmers involved who provided land access, time and resources for the study.
Conflict of interest
The authors declare that the research was conducted in the absence of any commercial or financial relationships that could be construed as a potential conflict of interest.
Publisher’s note
All claims expressed in this article are solely those of the authors and do not necessarily represent those of their affiliated organizations, or those of the publisher, the editors and the reviewers. Any product that may be evaluated in this article, or claim that may be made by its manufacturer, is not guaranteed or endorsed by the publisher.
Supplementary material
The Supplementary Material for this article can be found online at: https://www.frontiersin.org/articles/10.3389/fenvs.2024.1331659/full#supplementary-material
References
Ambrosone, M., Matese, A., Filippo, S., Gennaro, Di, Gioli, B., Tudoroiu, M., et al. (2020). Retrieving soil moisture in rainfed and irrigated fields using sentinel-2 observations and a modified OPTRAM approach. Int. J. Appl. Earth Observation Geoinformation 89 (July), 102113. doi:10.1016/j.jag.2020.102113
Antunes Daldegan, G. M., Gonzalez, R., Noon, M., and Zvolef, A. I. (2020). Assessing the performance of NDVI, 2-band EVI and MSAVI vegetation indices for land degradation monitoring across variable biomass cover at global scale. - NASA/ADS. https://ui.adsabs.harvard.edu/abs/2020AGUFMSY0030008A/abstract.
Antwi, S. H., Rolston, A., Linnane, S., and Getty, D. (2022). Communicating water availability to improve awareness and implementation of water conservation: a study of the 2018 and 2020 drought events in the republic of Ireland. Sci. Total Environ. 807, 150865. doi:10.1016/j.scitotenv.2021.150865
Babaeian, E., Sidike, P., Newcomb, M. S., Maimaitijiang, M., White, S. A., Demieville, J., et al. (2019). A new optical remote sensing technique for high-resolution mapping of soil moisture. Front. Big Data 2, 37. doi:10.3389/fdata.2019.00037
Baillarin, S. J., Meygret, A., Dechoz, C., Petrucci, B., Lacherade, S., Tremas, T., et al. “Sentinel-2 level 1 products and image processing performances,” in Proceedings of the International Geoscience and Remote Sensing Symposium (IGARSS), Munich, Germany, July 2012, 7003–7006. doi:10.1109/IGARSS.2012.6351959
Basu, R., Daly, E., Brown, C., Shnel, A., and Tuohy, P. (2024). Temporal stability of grassland soil moisture utilising sentinel-2 satellites and sparse ground-based sensor networks. Remote Sens. 16 (2), 220. doi:10.3390/RS16020220
Bengtsson, J., Bullock, J. M., Egoh, B., Everson, C., Everson, T., O’Connor, T., et al. (2019). Grasslands—more important for ecosystem services than you might think. Ecosphere 10 (2), e02582. doi:10.1002/ecs2.2582
Bhogapurapu, N., Dey, S., Homayouni, S., Bhattacharya, A., and Rao, Y. S. (2022). Field-scale soil moisture estimation using sentinel-1 GRD SAR data. Adv. Space Res. 70 (12), 3845–3858. doi:10.1016/j.asr.2022.03.019
Blüthgen, N., Dormann, C. F., Prati, D., Klaus, V. H., Kleinebecker, T., Hölzel, N., et al. (2012). A quantitative index of land-use intensity in grasslands: integrating mowing, grazing and fertilization. Basic Appl. Ecol. 13 (3), 207–220. doi:10.1016/j.baae.2012.04.001
Bondi, G., O‘Sullivan, L., Fenton, O., Creamer, R., Marongiu, I., and DavidWall, P. (2021). Trafficking intensity index for soil compaction management in grasslands. Soil Use Manag. 37 (3), 504–518. doi:10.1111/sum.12586
Burdun, I., Bechtold, M., Aurela, M., De Lannoy, G., Desai, A. R., Humphreys, E., et al. (2023). Hidden becomes clear: optical remote sensing of vegetation reveals water table dynamics in northern peatlands. Remote Sens. Environ. 296, 113736. doi:10.1016/j.rse.2023.113736
Burdun, I., Bechtold, M., Sagris, V., Komisarenko, V., De Lannoy, G., and Mander, Ü. (2020). A comparison of three trapezoid models using optical and thermal satellite imagery for water table depth monitoring in Estonian bogs. Remote Sens. 12 (12), 1980. doi:10.3390/rs12121980
Burdun, I., Bechtold, M., Sagris, V., Lohila, A., Humphreys, E., Desai, A. R., et al. (2020). Satellite determination of peatland water table temporal dynamics by localizing representative pixels of A SWIR-based moisture index. Remote Sens. 12 (18), 2936. doi:10.3390/RS12182936
Chaudhary, S. K., PrashantSrivastava, K. D. K., Kumar, P., Prasad, R., Dharmendra, K. P., Das, A. K., et al. (2022). Machine learning algorithms for soil moisture estimation using sentinel-1: model development and implementation. Adv. Space Res. 69 (4), 1799–1812. doi:10.1016/J.ASR.2021.08.022
Chavez, P. S. (1988). An improved dark-object subtraction technique for atmospheric scattering correction of multispectral data. Remote Sens. Environ. 24 (3), 459–479. doi:10.1016/0034-4257(88)90019-3
Coluzzi, R., Imbrenda, V., Lanfredi, M., and Simoniello, T. (2018). A first assessment of the sentinel-2 level 1-C cloud mask product to support informed surface analyses. Remote Sens. Environ. 217 (November), 426–443. doi:10.1016/j.rse.2018.08.009
Eireann, M. (2023). Latest farming commentary - Met Éireann - the Irish meteorological service. https://www.met.ie/forecasts/farming.
Eireann, M. (2024). https://www.met.ie/climate/services/agri-meteorological-data.
Environmental Protection Agency (2014). Irish soil information system synthesis report. https://www.epa.ie/environment-and-you/Radon.
ESA (2013). User guides sentinel-2 MSI. https://sentinels.copernicus.eu/web/sentinel/user-guides/sentinel-2-msi/product-types/level-1c.
Gilmore, S., Saleem, A., and Dewan, A. (2015). Effectiveness of DOS (Dark-Object subtraction) method and water index techniques to map wetlands in a rapidly urbanising megacity with Landsat 8 data. CEUR Workshop Proc. 1323, 100–108.
Habel, J. C., Jürgen, D., Janišová, M., Török, P., Wellstein, C., and Wiezik, M. (2013). “European grassland ecosystems: threatened hotspots of biodiversity,” in Biodiversity and conservation (Kluwer Academic Publishers). Alphen aan den Rijn, Netherlands, doi:10.1007/s10531-013-0537-x
Hassanpour, R., Zarehaghi, D., Neyshabouri, M. R., Feizizadeh, B., and Rahmati, M. (2020). Modification on optical trapezoid model for accurate estimation of soil moisture content in a maize growing field. J. Appl. Remote Sens. 14 (03), 034519. doi:10.1117/1.jrs.14.034519
Hawkins, M. J., Hyde, B. P., Ryan, M., Schulte, R. P. O., and Connolly., J. (2007). An empirical model and scenario analysis of nitrous oxide emissions from a fertilised and grazed grassland site in Ireland. Nutrient Cycl. Agroecosyst. 79 (1), 93–101. doi:10.1007/s10705-007-9099-1
Hejcman, M., Hejcmanová, P., Pavlů, V., and Beneš, J. (2013). “Origin and history of grasslands in central Europe - a review,” in Grass and forage science (John Wiley and Sons, Ltd). Hoboken, NJ, USA, doi:10.1111/gfs.12066
Herbin, T., Hennessy, D., Richards, K. G., Piwowarczyk, A., Murphy, J. J., and Holden, N. M. (2011). The effects of dairy cow weight on selected soil physical properties indicative of compaction. Soil Use Manag. 27 (1), 36–44. doi:10.1111/j.1475-2743.2010.00309.x
Keller, T., Sandin, M., Colombi, T., Horn, R., and Dani, Or (2019). Historical increase in agricultural machinery weights enhanced soil stress levels and adversely affected soil functioning. Soil Tillage Res. 194, 104293. doi:10.1016/j.still.2019.104293
Kerebel, A., Cassidy, R., Jordan, P., and Holden, N. M. (2013). Farmer perception of suitable conditions for slurry application compared with decision support system recommendations. Agric. Syst. 120, 49–60. doi:10.1016/j.agsy.2013.05.007
Lalor, S. T. J., and Schulte, R. P. O. (2008). Low-ammonia-emission application methods can increase the opportunity for application of cattle slurry to grassland in spring in Ireland. Grass Forage Sci. 63 (4), 531–544. doi:10.1111/j.1365-2494.2008.00657.x
Lemaire, G., Hodgson, J., and Abad, C. (2011). “Grassland productivity and ecosystems services,” in Grassland productivity and ecosystems services. CABI, Hoboken, NJ, USA, doi:10.2989/10220119.2014.955878
Lepore, E., Schmidt, O., Fenton, O., Tracy, S., Bondi, G., and Wall, D. (2023). “Moisture limits for grassland soil to avoid structural damage due to machine trafficking,” https://meetingorganizer.copernicus.org/EGU23/EGU23-3137.html.
Mananze, S., and Pôças, I. (2019). Agricultural drought monitoring based on soil moisture derived from the optical trapezoid model in Mozambique. J. Appl. Remote Sens. 13 (02), 1. doi:10.1117/1.jrs.13.024519
Mohanty, B. P., Cosh, M. H., Lakshmi, V., and Montzka, C. (2017). Soil moisture remote sensing: state-of-the-science. Vadose Zone J. 16 (1), 1–9. doi:10.2136/vzj2016.10.0105
Mokhtari, A., Sadeghi, M., Afrasiabian, Y., and Kang, Yu (2023). OPTRAM-ET: a novel approach to remote sensing of actual evapotranspiration applied to sentinel-2 and landsat-8 observations. Remote Sens. Environ. 286, 113443. doi:10.1016/j.rse.2022.113443
Muggeo, V. M. R. (2008). Segmented: an R package to fit regression models with broken-line relationships. R. News 8 (1), 20–25.
Newell-Price, J. P., Whittingham, M. J., Chambers, B. J., and Peel, S. (2013). Visual soil evaluation in relation to measured soil physical properties in a survey of grassland soil compaction in england and wales. Soil Tillage Res. 127, 65–73. doi:10.1016/j.still.2012.03.003
Ojha, N., Merlin, O., Suere, C., and Escorihuela, M. J. (2021). Extending the spatio-temporal applicability of dispatch soil moisture downscaling algorithm: a study case using smap, modis and sentinel-3 data. Front. Environ. Sci. 9, 40. doi:10.3389/fenvs.2021.555216
Piwowarczyk, A., Giuliani, G., and Holden, N. M. (2011). Can soil moisture deficit Be used to forecast when soils are at high risk of damage owing to grazing animals? Soil Use Manag. 27 (2), 255–263. doi:10.1111/j.1475-2743.2011.00339.x
Rocha, A. V., and Shaver, G. R. (2009). Advantages of a two band EVI calculated from solar and photosynthetically active radiation fluxes. Agric. For. Meteorology 149 (9), 1560–1563. doi:10.1016/j.agrformet.2009.03.016
Saadeldin, M., O’Hara, R., Zimmermann, J., Brian Mac Namee, , and Green, S. (2022). Using deep learning to classify grassland management intensity in ground-level photographs for more automated production of satellite land use maps. Remote Sens. Appl. Soc. Environ. 26, 100741. doi:10.1016/j.rsase.2022.100741
Sadeghi, M., Babaeian, E., Tuller, M., and ScottJones, B. (2017). The optical trapezoid model: a novel approach to remote sensing of soil moisture applied to sentinel-2 and landsat-8 observations. Remote Sens. Environ. 198, 52–68. doi:10.1016/j.rse.2017.05.041
Schils, R. L. M., Conny, B., Rhymer, C. M., Francksen, R. M., Klaus, V. H., Abdalla, M., et al. (2022). Permanent grasslands in Europe: land use change and intensification decrease their multifunctionality. Agric. Ecosyst. Environ. 330, 107891. doi:10.1016/j.agee.2022.107891
Schulte, R. P. O., Diamond, J., Finkele, K., Holden, N. M., and Brereton, A. J. (2005). Predicting the soil moisture conditions of Irish grasslands. Ir. J. Agric. Food Res. 44 (1), 95–110.
Schulte, R. P. O., Fealy, R., Creamer, R. E., Towers, W., Harty, T., and Jones, R. J. A. (2012). “A review of the role of excess soil moisture conditions in constraining farm practices under atlantic conditions,” in Soil use and management (John Wiley and Sons, Ltd). Hoboken, NJ, USA, doi:10.1111/j.1475-2743.2012.00437.x
Schulte, R. P. O., Iolanda, S., Creamer, R. E., and Holden, N. M. (2015). A note on the hybrid soil moisture deficit model v2.0. Ir. J. Agric. Food Res. 54 (2), 128–131. doi:10.1515/ijafr-2015-0014
Simo, I., Creamer, R. E., Reidy, B., Jahns, G., Massey, P., Hamilton, B., et al. (2008). Irish soil information system. http://gis.teagasc.ie/soils/.
Singh, A., Gaurav, K., Kumar Meena, G., and Kumar, S. (2020). Estimation of soil moisture applying modified dubois model to sentinel-1; A regional study from Central India. Remote Sens. 12 (14), 2266. doi:10.3390/rs12142266
Teagasc, (2014). Soil associations. http://gis.teagasc.ie/soils/soilguide.php.
Teagasc, (2021a). Environment fertiliser advice under prolonged dry soil conditions - Teagasc | agriculture and food development authority. https://www.teagasc.ie/news--events/daily/environment/fertiliser-advice-under-prolonged-dry-soil-conditions.php.
Teagasc, (2021b). Moorepark dairy levy research update Teagasc heavy soils Programme – lessons learned - a guide to the key findings of the Teagasc heavy soils Programme to-date, https://www.teagasc.ie/media/website/animals/dairy/Heavy-Soils-Lessons-Learned.pdf,
Terranimo, (2024). https://terranimo.world/choose-a-region.
The R Foundation, (2018). R: the R project for statistical computing. https://www.r-project.org/.
Tuohy, P., Fenton, O., Holden, N. M., and Humphreys, J. (2015). The effects of treading by two breeds of dairy cow with different live weights on soil physical properties, poaching damage and herbage production on a poorly drained clay-loam soil. J. Agric. Sci. 153 (8), 1424–1436. doi:10.1017/S0021859614001099
Tuohy, P., Loughlin, D. P., and Fenton, O. (2018). The performance and behavior of land drainage systems and their impact on field scale Hydrology in an increasingly volatile climate. Agric. Water Manag. 210, 96–107. doi:10.1016/j.agwat.2018.07.033
Urban, M., Berger, C., Mudau, T. E., Heckel, K., Truckenbrodt, J., Victor, O. O., et al. (2018). Surface moisture and vegetation cover analysis for drought monitoring in the southern kruger national park using sentinel-1, sentinel-2, and landsat-8. Remote Sens. 10 (9), 1482. doi:10.3390/rs10091482
Usgs Earth Explorer, (2024). Earth explorer. https://earthexplorer.usgs.gov/.
Vero, S. E., Antille, D. L., Lalor, S. T. J., and Holden, N. M. (2014). Field evaluation of soil moisture deficit thresholds for limits to trafficability with slurry spreading equipment on grassland. Soil Use Manag. 30 (1), 69–77. doi:10.1111/sum.12093
Wang, Qi, Li, J., Jin, T., Chang, X., Zhu, Y., Li, Y., et al. (2020). Comparative analysis of landsat-8, sentinel-2, and GF-1 data for retrieving soil moisture over wheat farmlands. Remote Sens. 12 (17), 2708. doi:10.3390/RS12172708
Wang, S., and Fu, G. (2023). Modelling soil moisture using climate data and normalized difference vegetation index based on nine algorithms in alpine grasslands. Front. Environ. Sci. 11 (February), 1130448. doi:10.3389/fenvs.2023.1130448
Keywords: grassland, heavy soils, remote sensing, decision support, OPTRAM
Citation: Basu R, Fenton O, Daly E and Tuohy P (2024) Identifying favourable conditions for farm scale trafficability and grass growth using a combined Sentinel-2 and soil moisture deficit approach. Front. Environ. Sci. 12:1331659. doi: 10.3389/fenvs.2024.1331659
Received: 02 November 2023; Accepted: 08 February 2024;
Published: 27 February 2024.
Edited by:
Abel Ramoelo, University of Pretoria, South AfricaReviewed by:
Tuomas Mattila, Finnish Environment Institute (SYKE), FinlandVasilis Myrgiotis, UK Centre for Ecology and Hydrology (UKCEH), United Kingdom
Copyright © 2024 Basu, Fenton, Daly and Tuohy. This is an open-access article distributed under the terms of the Creative Commons Attribution License (CC BY). The use, distribution or reproduction in other forums is permitted, provided the original author(s) and the copyright owner(s) are credited and that the original publication in this journal is cited, in accordance with accepted academic practice. No use, distribution or reproduction is permitted which does not comply with these terms.
*Correspondence: Patrick Tuohy, patrick.tuohy@teagasc.ie