Influencing factors of different development stages of green food industry: a system dynamic model
 Xujun Zhai1
  Hong Lin
- 1New Huadu Business School, Minjiang University, Fuzhou, China
- 2College of Economics and Management, Heilongjiang Bayi Agricultural University, Daqing, China
- 3College of Economics and Management, Northeast Agricultural University, Harbin, China
- 4College of Marxism, Minjiang University, Fuzhou, China
The green food industry is important for China because it bears the additional expectation of promoting the rural economy Heilongjiang Province is a representative example, which is one of the main production bases of green food With this in mind, this paper takes Heilongjiang Province as an example to research the main influencing factor of the green food industry This article uses system dynamics methods to construct research models and uses mathematical models to calculate the industry lifecycle. Different from previous studies, this paper provides the life cycle of the industry and discusses the effects of influencing factors during the different periods The main conclusion includes: The stage before 2011 is the termination period, the stage from 2011 to 2019 is the growth period, and the stage after 2019 is the property period By the final time of the simulation, there are no signs of filtering; The enterprise scale is the main influencing factor that can make positive effects on the output value of the green food industry from the growth period, and others have no objective impact from beginning to end; Undesirably high level of financial investment will execute a negative effect for industrial development in the property period, at least in terms of output value.
1 Introduction
Nowadays, environmental problems have become increasingly prominent and pose a grave threat to human beings, and the issue of sustainable development is discussed widely. Green food attracts more and more attention for its restrictions on the use of fertilizers and pesticides to be environmentally sound (Cobb et al., 1999). Compared with traditional food, green food highlights the harmonious coexistence between humans and nature besides effectiveness and efficiency, which is often viewed as a superior system (Sofos, 2008).
Since 1990, the Chinese green food project has been launched for over 30 years, which forms a complete industrial system from base construction, and product development to marketing. According to data from the China Green Food Development Center, as of 2021, the number of certified units in China’s green food industry in the same year reached 10,492, an increase of 2,417 from 2020 and a year-on-year increase of 29.93%. The number of effective standard units in China’s green food industry reached 23,493, an increase of 4,172 compared to 2020, a year-on-year increase of 21.59%. In addition, the domestic sales of China’s green food industry fluctuated from 2011–2021, and continued to expand after 2016. In 2021, it reached 521.86 billion yuan, an increase of 142.9 billion yuan compared to 2020, a year-on-year increase of 2.82%. Compared with conventional agricultural production methods, the green food production model reduces the application of chemical nitrogen fertilizer by 39%, reduces pesticide use intensity by 60%, and increases soil organic matter content by 17.6%.
China is a largely agricultural country with a dominant rural population. Developing the green food industry not only protects the ecological environment and enhances food quality but also bears the additional expectation of prospering the rural economy and achieving rural revitalization (Lin et al., 2009). However, China’s current green food industry still has some shortcomings. For example, the output is insufficient to meet the market demand, especially in the international market; The industrial structure needs to be further optimized; The products that can be certified by Grade AA standards are not enough.
With this in mind, this paper aims to explore the main influencing factors of China’s green food industry. Foreign studies prefer to use organic food, and Chinese Grade AA green food is equivalent to organic food in the international market. This paper uses green food more in line with China’s situation. Previous studies widely adopt the econometric approach to process data and to find significant factors, this paper further divides the life cycle of the green food industry and analyzes the dynamic change of influencing factors based on the system dynamics model. That is, the effects of these factors will not be the same during the development process of the green food industry, and this paper not only finds them but also describe their change during different periods.
The remainder of this paper is as follows: Section 2 describes the development of China’s green food; Section 3 gives a comprehensive literature review; Section 4 introduces the methodology, model structure, and variable setting, and develops the simulation model; Section 4 details data resource, model validation, and the simulation result of scenario analysis; Section 5 provides the main discussion; Section 6 presents the conclusion and research limitations.
2 Green food industry in China
Since the 1980s, population growth and agricultural expansion bring serious environmental pollution, which causes challenges to China’s agricultural development. Under this circumstance, the government attaches more importance to green food due to its being pollution-free. Besides, consumers in China begin to show interest in food safety and quality with the improvement of living standards. Against this background, the Ministry of Agriculture (MOA) launched the Green Food Program in 1990 and established the China Green Food Development Center (CGFDC) in 1992. CGFDC always responds to the development and management of green food, until now, this authoritative administration has established a nationwide working network that is composed of 42 provincial and municipal branch agencies, 38 quality inspection stations, and 71 environmental monitoring branches (Lin et al., 2009). Since 1993, CGFDC has joined IFOAM, SGS (Switzerland), OMIC, and JONA (Japan), and it builds business relations with over 90 countries and 500 international agencies.
Green food is defined as “unpolluted, safe, high grade and nutritious food that is produced in line with the principle of sustainable development and is certified to use the green food logo” (Liu, 1998). In China, one food that can be identified as green food needs at least two necessary conditions: Firstly, this food must come from the production areas of green food after strict environmental monitoring; Secondly, this food must have a quality traceability system from farm to table. Thus, this food can use the green food logo, which is a registered trademark protected by the Trademark Law of the People’s Republic of China and under the unified supervision of CGFDC.
Since 1996, green food is furtherly classified into Grade A and Grade AA in China, and the latter completely prohibits the use of all chemical synthetic compositions and adopts organic production methods, which are formulated based on standards of IFOAM and other international agencies. Chinese Grade AA green food is equivalent to organic food in the international market. This graded certification system aims to encourage farmers to reduce chemical input to meet international standards.
Generally, in 2002, the Ministry of Science and Technology highlighted food safety as an important area of sustainable development. In 2003, MOA released an Action Plan for Pollution-free Food and predicted all the edible agricultural produce would be no-polluted within 8–10 years. More than 20 provinces have issued a series of policies to promote the further development of the green food industry.
Although China’s green food industry has developed rapidly over the past several decades, there are still some problems that need to solve. Over the past 10 years, although the consumption demand for green food grows steadily, the frequent outbreak of food safety incidents made the urgent need for accelerating industrial development. China is a big power of green food rather than a great power. For example, most Chinese green food products cannot be identified by Grade AA and be accepted by the international market, and they are primary or primarily processed items with low technology content and value-added, as well as domestic consumers do not have a strong desire to buy green food.
Based on model development and simulation, this paper tries to describe the life cycle of the green food industry, and find the influencing factor through the causal link. Besides, this paper furtherly analyzes the change of factors’ effects in different phases, to provide evidence for policy formulation.
3 Literature review
Consumer demand and policy are always recognized as the two most important factors affecting the green food industry, and their effects have been verified by previous studies (Hsu et al., 2016; O'Mahony and Lobo, 2017).
As for consumer demand, previous studies have several influencing factors, including income and price (Bryla, 2015; Aschemann-Witzel and Zielke, 2017), label (Grankvist et al., 2007; Kuhl et al., 2017), certification (Garcia-Yi, 2015), environmental awareness (Cheung et al., 2015), and self-health consciousness (Hai et al., 2013). The most of research method is bibliometric analysis. For example, KIM et al. (2018) applied a multi-layer model to research the characteristics of American organic food consumers from 2010 to 2014; Bryla (2015) shows the various aspects, such as distribution channel and pricing level, of the organic food industry through the statistical analysis; Nasir and Karakaya (2014) identified factors that can promote the purchase of organic food through the data fitting by adding control variables.
As for policy, its regulation can affect industrial development, especially improve public trust in consumption (Geall and Ely, 2019). For example, Marshall (2000) analyzed the structure and technology of the organic food industry to illustrate the effect of policy; Larsson et al. (2013a) compared and summarized a few cases, which revealed the role of government in determining the development direction of the organic food industry; Lau et al. (2020) discussed the relationship between government supervision and industrial development based on game theory; Duguleană et al. (2018) evaluated the policy effect in European organic food industry through principal component analysis and multiple regression.
As for the influencing factors of the green food industry, existing research mostly adopts theoretical analysis or empirical testing to conduct research. From the external environment, market, technology, government participation, and policies are important influencing factors (Larsson et al., 2013b; Huang et al., 2017). From an internal perspective, cognition, price, household population structure, income, health awareness, knowledge, education level, consumer preferences, and organic labels are important influencing factors (Singh and Verma, 2017; Wang C. et al., 2019; Liang and Lim, 2020). For example, Sun et al. (2021) conducted a study on the influencing factors of China’s green food industry using a geographically weighted model and found that regional economy, natural resource conditions, and environmental quality greatly affect the concentration of the green food industry.
This paper finds some gaps to fill through the literature review. Firstly, most industries show a cyclical development path (Brenner and Dorner, 2017), but few studies consider this point when they find the main influencing factors. More specifically, does one factor can make an effect on the green food industry during its whole life cycle? Or does this factor’s effect remains or changes? Besides, bibliometric analysis is hard to reveal the inner feedback and future trend of the green food industry.
Thus, this paper combined the Logistic model and System Dynamics model to find the main influencing factors of the green food industry and to observe the change of their effect during different stages. In the end, this paper focuses on the effect of financial investment, which is always recognized as a remarkable factor.
4 Model development
System dynamics was first proposed by Forrester J. W., which aimed to reveal the internal mechanism of a complex network to optimize its structure. The system dynamics approach mainly adopts the casual feedback loop and the stock-flow diagram to analyze and solve problems, and it is already widely applied to research various systems (Forrester, 1987), such as the urban system and social-economic system. The green food industry has obvious characteristics, including nonlinear change and dynamic interaction, and the literature review shows that previous studies have used the system dynamics model to find the notable factors of industry development. With this in mind, this paper uses this method to analyze the system behavior of the green food industry, especially in exploring the relationship between industrial development and financial investment from the perspective of the life cycle.
4.1 Causal feedback diagram
This paper divides the green food industry into two subsystems: the demand subsystem and the supply subsystem.
As for the demand subsystem, green food is featured as environment protection, healthy, and high quality. Thus, its price is higher than normal food, which requires the purchaser to have a better economic foundation. The improvement in income level will strengthen the awareness and ability to buy green food. This paper sets one casual feedback loop according to the above description, as shown in Figure 1: Number of orders→+Per-tax profit→+Number of the enterprises→+Number of stuff and workers→+Output of green food→+Output value→+GDP→+Per capital GDP→+Per capital disposable income→+Per capital consumption expenditure →+ Number of orders. The narrow refers to the material or information flow, and the plus sign refers to a positive correlation. This loop represents that the increase of green food orders can promote the GDP growth of one region, which in turn positively influences the income level of residents and their purchases of green food.
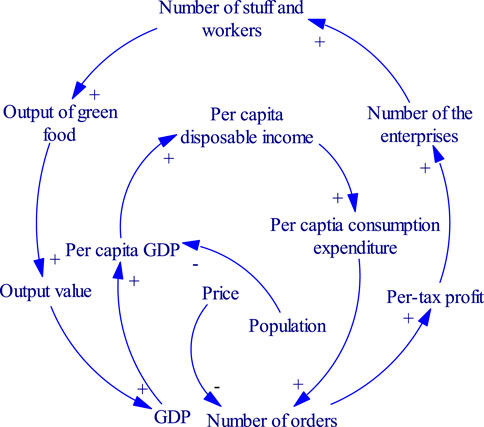
FIGURE 1. Demand subsystem of green food.
As for the supply subsystem, traditional agriculture and food processing produce serious environmental pollution, and green food produces a new idea of sustainability for healthy and environmentally friendly. From the perspective of inner structure, employee number, investment, and environmental quality monitoring can affect the output of green food, which furtherly exerts influence over the industry. Besides, more favorable policies will promote the development of industry and drive economic growth. Another essential element is research and development (R& D), and more expenditure will help improve the quality of green food, as well as form the core competence. Thus, this paper sets three casual loops (Figure 2), as described as follows: (i) Output value →+ GDP →+ Financial investment →+ Total investment→+ Output of green food →+ Output value; (ii) Output value →+ GDP →+ Financial expenditure on agriculture, forestry, and water conservancy →+ Amount of supervising area →+ Output of green food →+ Output value; (iii) Output value →+ GDP →+ Expenditure on R &D →+ Number of technicians →+ Output of green food →+ Output value.
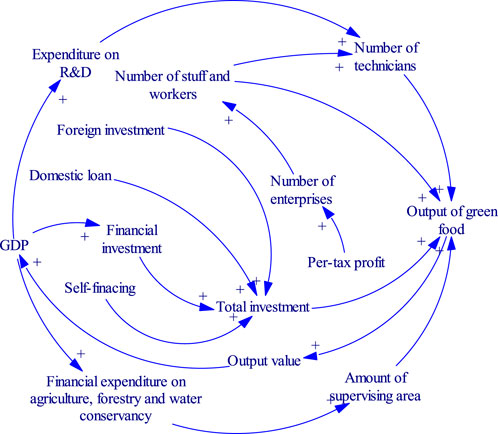
FIGURE 2. Supply subsystem of green food.
Combing the demand and supply subsystems, this paper obtains the complete causal feedback diagram of the green food industry, as shown in Figure 3:
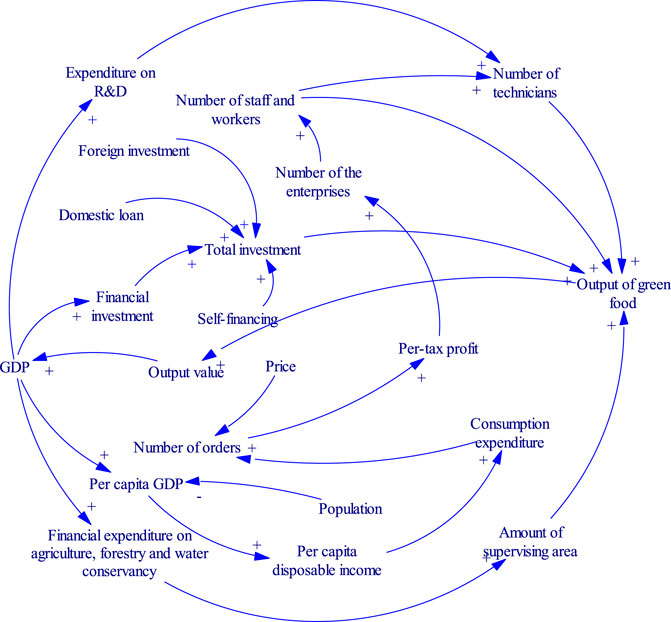
FIGURE 3. Causal feedback diagram of the green food industry.
Figure 3 shows the complex feedback relationship of the industrial system. Variables are independent but interaction and change on anyone variable will affect others in varying degrees, and even result in structural change in the overall system. Thus, this paper analyzes the link between financial investment and the industry development of green food based on the system dynamics approach, to reflect the dynamic behavior accurately.
4.2 Stock-flow diagram
The causal feedback diagram is used to describe the system structure and the causal relationship of important elements, but it cannot distinguish the influence degree of variables. The stock-flow diagram further divides variables into four types to reflect features of variables, including stock, rate, auxiliary, and constant. The stock is the accumulation of the rate, and the auxiliary is the intermediary variable, as well as the constant, which is the exogenous variable. Based on Figure 3, this paper sets one stock, one rate, 17 auxiliaries, 7 table functions, and 5 constants, as shown in Table 1:
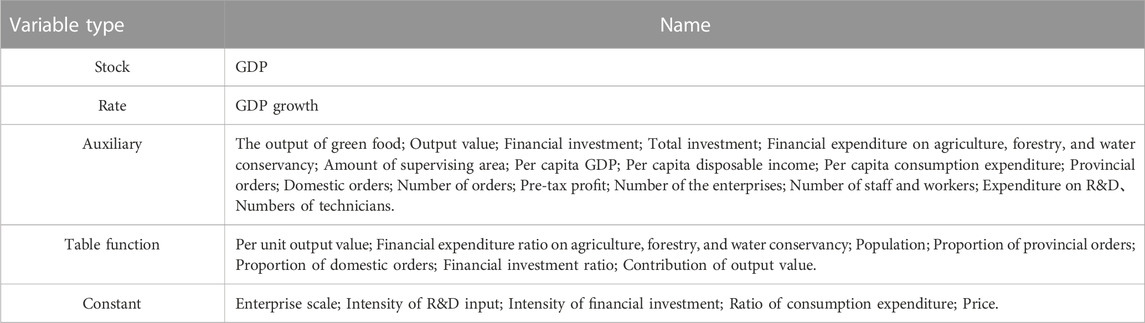
TABLE 1. Variables of the stock-flow diagram.
Thus, this paper forms the stock-flow diagram, as shown in Figure 4, and the main formulas can be found in Appendix.
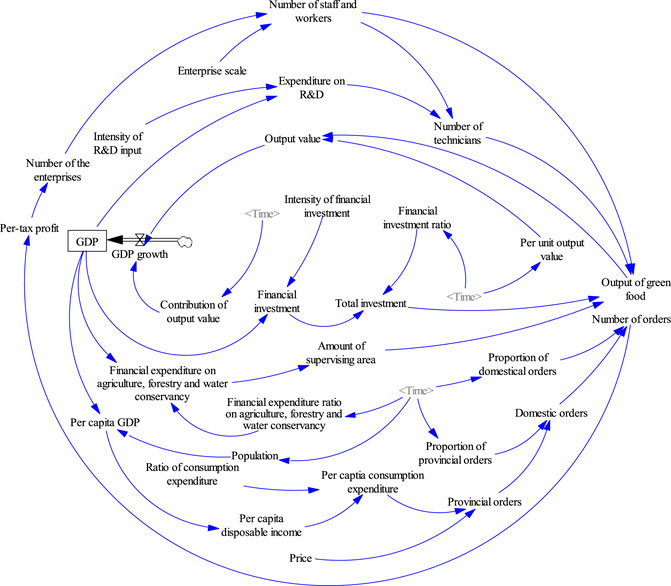
FIGURE 4. The stock-flow diagram of the green food industry.
5 Model simulation
This paper takes Heilongjiang province as an example. Heilongjiang province locates in northeast China, and it is one of the important production bases of commodity grain. In 2018, the sown area of Heilongjiang province is 1467.33 million hectares, which accounts for 8.85% of the total in China. Meanwhile, its grain output is 75,068 thousand tons, which accounts for 11.41% of the national total and ranks first for 8 years. Heilongjiang province is affluent in natural resources and has great potential in the green food industry, which is one of five pilots that are approved by the Ministry of agriculture. Famous brands of green food, such as “Beidahuang”, “Wandashan”, “Wuchang rice”, and “Jiusan”, all come from this province.
Furthermore, the green food industry provides opportunities for increasing farmers’ income to solve rural problems. According to the statistics, the per capita income of rural people in Heilongjiang Province will grow by 1% when the total output of the green food industry increases by 10% (Lin et al., 2009), and the local governments have regarded it as a new economic growth point. Nowadays, Heilongjiang Province has formulated Measures for Green Food Management and Measures for Administration of Green Food Labeling, the green food industry is very important for future economic development.
Therefore, part of the research data comes from the official documents of Heilongjiang province, such as GDP, population, and R&D expenditure. Some of the data is from the Statistical yearbook of Heilongjiang Province (2000–2017), including the yield and the output value of the green food industry. Others are results of table functions or statistical methods, such as the proportion of domestic orders and consumption ratio.
Table function is a user-defined function in system dynamics programs, usually represented in the form of a chart, used to reflect the special nonlinear relationship between two variables. The application of table functions in system dynamics modeling is very common, as many variables in socio-economic systems have complex nonlinear relationships that can only be described through graphical methods. Therefore, based on the above principles, this paper inputs indicators such as population and industrial contribution into the chart to fit the function. The specific table function formula can be found in the Appendix.
5.1 Model test
In order to ensure that the model can better fit the reality of green industry development in Heilongjiang Province, this paper conducted extreme test and sensitivity test on the model to ensure that the model structure and behavior are correct, that is, the correct structure of the model produces the correct behavior. In addition, the data used in the model are all from official data released by Heilongjiang Province, and there have been multiple discussions with experts in the field during the modeling process.
5.1.1 Suitability test
The suitability test is used to check whether the model is consistent with the internal mechanism of the system, whether the causal relationship is appropriate, whether the variable selection = is reasonable, and whether the equation expression is accurate. As for this paper, the system dynamics model is built based on previous literature and practical investigation. Besides, the result of the Check Model button of Vensim_PLE software is Model is OK, which means this model can be used for further simulation.
5.1.2 Extreme test
An extreme test is used to check the model function in extreme circumstances. This paper set the investment proportion of R&D as zero, and the result is shown in Figure 5:
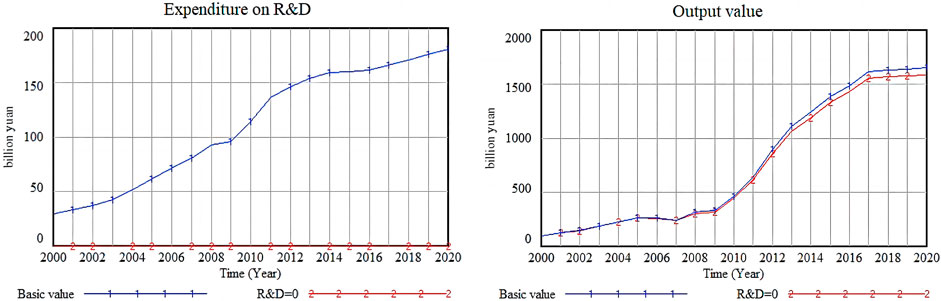
FIGURE 5. The extreme test of the SD model.
It can be found that the R&D investment becomes zero when its proportion is set as zero. The output value of the green food industry does not have abnormal fluctuations, and its curve sharp is similar to that of the basic value. Therefore, this system dynamics model passes the extreme test.
5.1.3 Sensitivity test
The sensitivity test is used to check behavior sensitivity, which refers to the change of exogenous variables that will lead to the trend variation of simulation results. Behavior sensitivity represents that the model has significant errors and it must be revised according to the real world. This paper adjusts the investment proportion of R&D, and the result is shown in Figure 6:
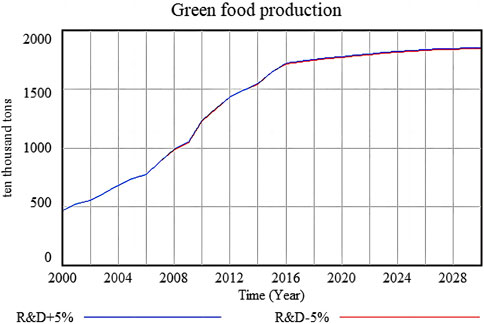
FIGURE 6. The sensitivity test of the SD model.
Figure 6 shows the curve sharp does not have trend variation when the exogenous variable is changed, and the system dynamics model passes the sensitivity test.
5.2 Simulation result
5.2.1 Life cycle of the green food industry
The green food industry of Heilongjiang Province is not a mature one, and it is hard to divide its life cycle only depending on historical data. Thus, this paper uses model simulation to show the future trend of this industry, and the simulation basis is the historical data from 2000 to 2017. The result is shown in Figure 7:
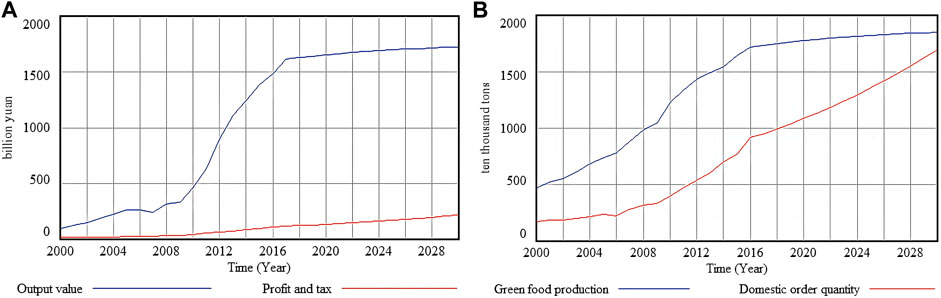
FIGURE 7. System basic behavior simulation of the green food industry. (A) Output value and Profit tax. (B) Production and Order quantity.
Figure 7 shows that the output value of green food in Heilongjiang province turned from slow growth to accelerated growth before 2017, then it will maintain a stable level in the future.
According to the theory of the industry life cycle, one industrial development will go through four stages: formation period, growth period, maturity period, and recession period, and show an S-type change. The development trend of the green food industry is similar to an S-type curve, and whether it has distinguished industrial periods? This paper uses the logistic curve fitting method to check and identify inflection points.
Firstly, this paper selects the output value of the green food industry as the variable to fit the logistic curve, and the data mainly come from Heilongjiang statistical yearbook (2000–2017). The measurement result indicates that the
Secondly, this paper uses the Logistic model to divide the development periods of the green food industry, and the four-point estimation approach is shown as follows:
Four years represent four sample points (2000, 2006, 2011, and 2017), and the corresponding output value of green food in each year is substituted into Formula 1 to obtain the value of K
According to Formula 2, this paper identifies two inflection points: 2011 and 2019. 2011 is the starting point of the growth period, and 2019 is the starting point of the maturity period. Before 2011, the green food industry grows slowly and it mainly focuses on market development. From 2011 to 2019, a large number of enterprises enter the market which leads to fierce competition, and this industry develops rapidly. With the further development of the industry, the merger and reorganization of enterprises happen often. Since 2019, the scale of enterprises has increased significantly, and the market has gradually become stable, which means this industry will enter a mature period.
Besides, Figure 7 also presents some extra information. For example, Figure 7A shows that the increase of profit and tax is less than that of output value in the early stage of industrial development, but the growth rate of output value gradually speeds up and over that of profit and tax in the mature period. Fig. (b) shows that the production and orders of green food keep increasing, and the growth rate of production is slower than that of domestic orders. That means, the demand will outstrip supply in the future, and this situation will inhibit industrial development.
5.2.2 Multi-scenario simulation
This paper wants to find the main influencing factors of the green food industry through the multi-scenario simulation. Specifically, one scenario only changes one variable based on the baseline, and the simulation can reflect and compare the effects of scenarios.
This paper set four scenarios, which are shown in Table 1, and scenario 1 is the baseline with no variable that has been adjusted. Based on scenario 1, scenario 2 increases by 20% of financial investment, scenario 3 increases by 20% of enterprise scale, and scenario 4 increases by 20% of input-intensity of R&D, as shown in Table 2:

TABLE 2. Four scenarios for simulation.
The result of the multi-scenario simulation is shown in Figure 8:
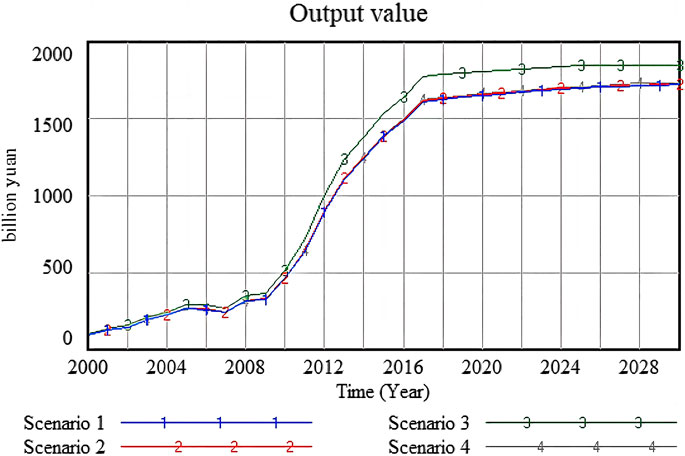
FIGURE 8. The result of multi-scenario simulation.
It can be found that scenario 3 grows fastest compared with the other three scenarios, which means that the enterprise scale has the most significant impact on industrial development. Besides, its effect is not obvious in the growth period of the industry, which is gradually strengthened and becomes a crucial factor in the maturity period.
This paper wants to furtherly explore the link between financial investment and industrial development. Previous studies have identified the important role of policy, and financial investment is frequently proposed as a primary approach. For example, Mosier and Thilmany (2016) proposed that financial investment drive the extension of the organic food line, which improved the consumption level; Mykolaichuk and Mykolaichuk (2017) analyzed and predicted the industrial structure of green food in Ukraine, which can be optimized by financial investment; Wang J. et al. (2019) suggested that financial investment helped to promote the consumption and technological innovation of green food; Thus, does a financial investment impose a positive influence or negative influence? Or a combination of both? This paper also uses multi-scenario simulation to analyze. There are five scenarios (Table 3), similarly, based on base value, FI1 increases by 20% of the financial investment, FI2 decreases by 50%, FI3 increases by 50%, and FI4 decreases by 50%. The simulation result is shown in Figure 9:
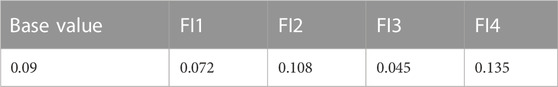
TABLE 3. Financial investment scenarios for simulation.
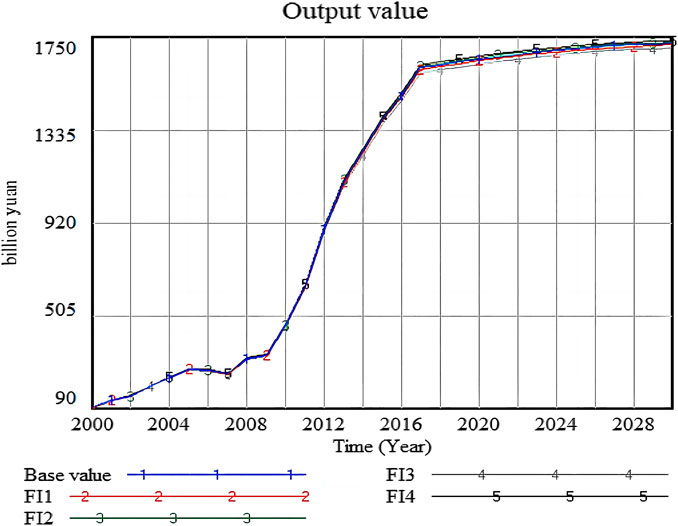
FIGURE 9. Simulation result of the financial investment.
Financial investment does not have a powerful influence on the output value of the green food industry, and Figure 8 has illustrated this point. Since 2016, when the industry gradually enters the maturity period, scenarios FI3 and FI4, which greatly change the financial investment, ultimately give a different image. However, the result presents that the FI4 can add more output value than that FI3, which means, the financial investment exerts a negative effect on the green food industry.
In summary, the enterprise scale is the main influencing factor of the green food industry, and its effect exceeds that of the input intensity of R&D and financial investment. Besides, financial investment does not have a powerful influence, and the great increase in it even imposes a negative effect on the green food industry.
6 Discussion
Heilong Jiang Province is a representative example of the green food industry. Simulation results show the enterprise scale is the main influencing factor for the further development of the industry because the structure of green food enterprises in the province is not reasonable. There are too many small-sized enterprises and quite a few leading enterprises whose output value can exceed 100 million RMB yuan. Taking the pig slaughtering industry as an example, it can be found that only 31 (16%) enterprises have the capacity of slaughtering more than 150,000 pigs per year, and there are 53 (26.5%) enterprises that slaughter less than 20,000 pigs per year.
Besides, the rapid increase of small-sized enterprises further brings a decrease in the average scale in recent years. The main reasons are: (i) Green food attracts more and more small-sized enterprises for low industrial threshold and high profitability; (ii) Part of small-sized enterprises continue to survive under local protectionism. This circumstance will result in negative consequences. For example, small-sized enterprises are ill-equipped to ensure food quality, and small-sized enterprises mainly focus on the middle and low-end markets. Over time, the whole industry cannot cultivate a famous brand and technological innovation, which will gradually lose competitiveness.
Simulation result also presents the negative effect of financial investment. Even though the policy is identified as a crucial tool to promote the development of the green food industry, the financial investment is not a good measure. A low level of financial investment cannot produce a noticeable effect, but a high level of that will exert a negative effect on the maturity period of the green food industry. In the maturity period, the industry has formed a balanced competition pattern, the financial investment will break the role of the market mechanism, and enterprises will probably be confronted with the market reshuffle. This point is an important addition to policy research on the green food industry.
7 Conclusion
Since 1990, the Ministry of Agriculture (MOA) launched the Green Food Program, China’s green food industry began to develop rapidly and has made great progress. This industry not only reduces agricultural pollution and improves the level of national health, but also bears the additional expectation of prospering the rural economy and achieving rural revitalization. This paper finds the main influencing factor of the green food industry through model development and multi-scenario simulation. Compared with other studies, the research innovation of this paper is to divide the life cycle of the green food industry and to discuss the effects of influencing factors during the different periods. The conclusion is presented as follows:
Firstly, the life cycle of the green food industry can be divided into three stages: Before 2011, the green food industry grows slowly, and this stage is the germination period; From 2011 to 2019, a large number of enterprises enter the market that leads to fierce competition, and this stage is growth period; Since 2019, the market has gradually become stable, and this period is maturity period. The final time of simulation is 2030, and the industry shows no signs of faltering.
Secondly, among enterprise scale, financial investment, and intensity of R&D, the enterprise scale is the main influencing factor that can make positive effects on the output value of the green food industry during the growth period. Others have no obvious impact.
Finally, an undesirably high level of financial investment will exert a negative effect on industrial development, at least in terms of output value. Previous studies have verified the role of policy in the green food industry, but the financial investment is not an alternative tool, especially in the maturity period.
This paper also has some research limitations. For example, the system dynamics model uses output value to measure the level of industrial development, which is incomplete and not comprehensive. Moreover, this paper focuses more on the development of the green food industry from a socio-economic perspective, such as considering the impact of fiscal support and taxation, which better involves environmental indicators such as water/land use, carbon emissions, or biodiversity impacts. In future research, this paper will expand the above model by considering more environmental indicators, and use diversified indicators such as product trade and product types to measure the level of industrial development. In addition, this paper will increase the number of cases, especially by using more major grain producing areas in China as case studies to enhance the applicability and universality of the conclusions.
Data availability statement
The original contributions presented in the study are included in the article/supplementary material, further inquiries can be directed to the corresponding author.
Author contributions
XZ: Data curation, Funding acquisition, Resources, Writing–original draft. LZ: Formal Analysis, Software, Writing–original draft. GM: Software, Writing–original draft. HL: Conceptualization, Supervision, Writing–review and editing.
Funding
The author(s) declare financial support was received for the research, authorship, and/or publication of this article. The paper is financially supported by the National Social Science Foundation of China [grant numbers (19BJL054)].
Acknowledgments
We would like to express thanks to those who participated in this research and numerous people who shared comments, criticisms, and encouragement on this work. Thanks to the editor and peer-re-viewers for their very helpful insights and feedback, as well as the National Social Science Foundation of China [grant numbers (19BJL054)].
Conflict of interest
The authors declare that the research was conducted in the absence of any commercial or financial relationships that could be construed as a potential conflict of interest.
Publisher’s note
All claims expressed in this article are solely those of the authors and do not necessarily represent those of their affiliated organizations, or those of the publisher, the editors and the reviewers. Any product that may be evaluated in this article, or claim that may be made by its manufacturer, is not guaranteed or endorsed by the publisher.
References
Aschemann-Witzel, J., and Zielke, S. (2017). Can't buy me green? A review of consumer perceptions of and behavior toward the price of organic food. J. Consumer Aff. 51 (1), 211–251. doi:10.1111/joca.12092
Brenner, T., and Dorner, M. (2017). Is there a life cycle in all industries? First evidence from industry size dynamics in West Germany. Appl. Econ. Lett. 24 (5), 289–297. doi:10.1080/13504851.2016.1184369
Bryla, P. (2015). The development of organic food market as an element of sustainable development concept implementation. Soc. Sci. Electron. Publ. 10 (1), 79–88.
Cheung, R., Lau, M. M., and Lam, A. Y. C. (2015). Factors affecting consumer attitude towards organic food: an empirical study in Hong Kong. J. Glob. Scholars Mark. Sci. 25 (3), 216–231. doi:10.1080/21639159.2015.1041782
Cobb, D., Feber, R., Hopkins, A., Stockdale, L., O’Riordan, T., Clements, B., et al. (1999). Integrating the environmental and economic consequences of converting to organic agriculture: evidence from a case study. Land Use Policy 16, 207–221. doi:10.1016/s0264-8377(99)00023-x
Duguleană, L., Bălăşescu, M., Duguleană, C., Bălăşescu, S., Neacşu, N. A., and Dovleac, L. (2018). Dynamic analysis of European organic agricultural areas in the context of sustainable development. Outlook Agric. 47 (1), 27–35. doi:10.1177/0030727018761689
Forrester, J. W. (1987). Lessons from system dynamics modeling. Syst. Dyn. Rev. 3 (2), 136–149. doi:10.1002/sdr.4260030205
Garcia-Yi, J. (2015). Willingness to pay for organic and fair trade certified yellow chili peppers Evidence from middle and high-income districts in Lima, Peru. Br. Food J. 117 (2), 929–942. doi:10.1108/bfj-11-2013-0321
Geall, S., and Ely, A. (2019). Agri-food transitions and the “green public sphere” in China. Environ. Innovation Soc. Transitions 30, 33–42. doi:10.1016/j.eist.2018.07.003
Grankvist, G., Lekedal, H., and Marmendal, M. (2007). Values and eco- and fair-trade labelled products. Br. Food J. 109 (2), 169–181. doi:10.1108/00070700710725527
Hai, N. M., Moritaka, M., and Fukuda, S. (2013). Willingness to pay for organic vegetables in vietnam: an empirical analysis in hanoi capital. J. Fac. Agric. Kyushu Univ. 58 (2), 449–458. doi:10.5109/27378
Hsu, S. Y., Chang, C. C., and Lin, T. T. (2016). An analysis of purchase intentions toward organic food on health consciousness and food safety with/under structural equation modeling. Br. Food J. 118 (1), 200–216. doi:10.1108/bfj-11-2014-0376
Huang, H.-W., Wu, S.-J., Lu, J.-K., Shyu, Y.-T., and Wang, C.-Y. (2017). Current status and future trends of high-pressure processing in food industry. Food control. 72, 1–8. doi:10.1016/j.foodcont.2016.07.019
Kim, G., Seok, J. H., and Mark, T. B. (2018). New market opportunities and consumer heterogeneity in the US organic food market. Sustainablitu-Basel 10 (9), 3166–3182. doi:10.3390/su10093166
Kuhl, S., Gassler, B., and Spiller, A. (2017). Labeling strategies to overcome the problem of niche markets for sustainable milk products: the example of pasture-raised milk. J. Dairy Sci. 100 (6), 5082–5096. doi:10.3168/jds.2016-11997
Larsson, M., Morin, L., Hahn, T., and Andahl, J. (2013a). Institutional barriers to organic farming in central and eastern European countries of the baltic sea region. Agr. Food Econ. 1, 5–20. doi:10.1186/2193-7532-1-5
Larsson, M., Morin, L., Hahn, T., and Sandahl, J. (2013b). Institutional barriers to organic farming in Central and Eastern European countries of the Baltic Sea region. Agric. Food Econ. 5 (1), 5–20. doi:10.1186/2193-7532-1-5
Lau, H., Shum, P. K. C., Nakandala, D., Fan, Y., and Lee, C. (2020). A game theoretic decision model for organic food supplier evaluation in the global supply chains. J. Clean. Prod. 242, 118536. doi:10.1016/j.jclepro.2019.118536
Liang, R. D., and Lim, W. (2020). Why do consumers buy organic food? Results from an S–O–R model. Asia Pac. J. Mark. Log. 33, 394–415. doi:10.1108/apjml-03-2019-0171
Lin, L., Zhou, D. Y., and Ma, C. X. (2009). Green food industry in China: development, problems and policies. Renew. Agric. Food Syst. 25 (1), 69–80. doi:10.1017/s174217050999024x
Marshall, A. (2000). Sustaining sustainable agriculture: the rise and fall of the Fund for Rural America. Agric. Hum. Values 17 (3), 267–277. doi:10.1023/a:1007640300392
Mosier, S. L., and Thilmany, D. (2016). Diffusion of food policy in the U.S. The case of organic certification. Food Policy 61, 80–91. doi:10.1016/j.foodpol.2016.02.007
Mykolaichuk, M., and Mykolaichuk, N. (2017). Food industry development in the context of the food security of regions of Ukraine. Baltic J. Econ. Stud. 3 (5), 304–310. doi:10.30525/2256-0742/2017-3-5-304-310
Nasir, V. A., and Karakaya, F. (2014). Underlying motivations of organic food purchase intentions. Agribusiness 30 (3), 290–308. doi:10.1002/agr.21363
O'Mahony, B., and Lobo, A. (2017). The organic industry in Australia: current and future trends. Land Use Policy 66 (7), 331–339. doi:10.1016/j.landusepol.2017.04.050
Singh, A., and Verma, P. (2017). Factors influencing Indian consumers’ actual buying behaviour towards organic food products. J. Clean. Prod. 167, 473–483. doi:10.1016/j.jclepro.2017.08.106
Sofos, J. N. (2008). Challenges to meat safety in the 21st century. Meat Sci. 78, 3–13. doi:10.1016/j.meatsci.2007.07.027
Sun, C. Z., Huang, D. J., Li, H., Chen, C., Wang, C., Li, M., et al. (2021). Green food industry in China: spatial pattern and production concentration drivers concentration drivers. Front. Environ. Sci. 9, 2296–665X. doi:10.3389/fenvs.2021.665990
Wang, C., Ghadimi, P., Lim, M. K., and Tseng, M. (2019a). A literature review of sustainable consumption and production: a comparative analysis in developed and developing economies. J. Clean. Prod. 206, 741–754. doi:10.1016/j.jclepro.2018.09.172
Wang, J., Wang, K., Shi, X., and Wei, Y.-M. (2019b). Spatial heterogeneity and driving forces of environmental productivity growth in China: would it help to switch pollutant discharge fees to environmental taxes. J. Clean. Prod. 223, 36–44. doi:10.1016/j.jclepro.2019.03.045
Zhang, X. Y., Li, G., and Zhang, L. (2004). Chinese consumers’ concern on food safety. China Rural. Surv. 1, 10–17.
Appendix
The main formulations of the system dynamics model are shown as follows:
(1) Stock variable
GDP = INTEG (GDP growth, 3151.4).
(2) Rate variable
GDP growth = Output value * Contribution of output value.
(3) Auxiliary variable
Output of green food = EXP (3.845 + 0.254*LN(Amount of supervising area)+0.564*LN(Numbers of technicians)+0.384*LN(Number of staff and workers)+0.015*LN (Total investment))
Output value = Per unit output value * Output of green food.
Number of staff and workers = EXP (-1.2562 + 0.826*LN(Number of the enterprises)+0.477*LN (Enterprise scale))
Numbers of technicians = 0.485 + 0.096* Number of staff and workers +0.001* Expenditure on R&D.
Per-tax profit = 0.1268* Number of orders −9.0346.
Number of orders = Domestic orders/Proportion of domestic orders.
Provincial orders = EXP (0.288*(LN(Per capita consumption expenditure))^2–4.5512*LN(Per capita consumption expenditure)+22.135).
*(1.6–0.6* Price).
(3) Table function
Population = WITH LOOKUP (Time, ([(2000,3750)-(2017,3850)], (2000,3807), (2001,3811), (2002,3813), (2003,3815), (2004,3817), (2005,3820), (2006,3824), (2007,3825), (2008,3825), (2009,3826), (2010,3833.4), (2011,3834), (2012,3834), (2013,3835), (2014,3833), (2015,3812), (2016,3799), (2017,3788)))
Contribution of output value = WITH LOOKUP (Time, [(2000,0)-(2017,6)], (2000,4.445), (2001,2.945), (2002,3.934), (2003,5.361), (2004,4.816), (2005,3.86), (2006,3.806), (2007,5.26), (2008,1.185), (2009,5.954), (2010,5.1), (2011,1.72), (2012,0.947), (2013,0.523), (2014,0.031), (2015,0.143), (2016,0.32), (2017,0.32).
Keywords: green food industry, influencing factor, life cycle, dynamic model, Heilongjiang province
Citation: Zhai X, Zheng L, Ma G and Lin H (2024) Influencing factors of different development stages of green food industry: a system dynamic model. Front. Environ. Sci. 11:1319687. doi: 10.3389/fenvs.2023.1319687
Received: 12 October 2023; Accepted: 18 December 2023;
Published: 24 January 2024.
Edited by:
Muhammad Asad Ur Rehman Naseer, Bahauddin Zakariya University, PakistanReviewed by:
Chandra Dhakal, CDC Foundation, United StatesChuanzhun Sun, South China Agricultural University, China
Copyright © 2024 Zhai, Zheng, Ma and Lin. This is an open-access article distributed under the terms of the Creative Commons Attribution License (CC BY). The use, distribution or reproduction in other forums is permitted, provided the original author(s) and the copyright owner(s) are credited and that the original publication in this journal is cited, in accordance with accepted academic practice. No use, distribution or reproduction is permitted which does not comply with these terms.
*Correspondence: Hong Lin, linhong_1977@163.com