Carbon and nitrogen isotope characterization of imported coals in South Korea
 Eui-Kuk Jeong1,2
  Yeongmin Kim2
  Youn-Young Jung2
  Kwang-Sik Lee1,2
  Seung-Hyun Choi2† Yeon-Sik Bong3
  Woo-Jin Shin2*
- 1Graduate School of Analytical Science and Technology, Chungnam National University, Daejeon, Republic of Korea
- 2Research Center for Geochronology and Isotope Analysis, Korea Basic Science Institute, Cheongju-si, Chungbuk, Republic of Korea
- 3Center for Research Equipment, Korea Basic Science Institute, Cheongju-si, Chungbuk, Republic of Korea
1 Introduction
Since the Industrial Revolution in the late 1700s, coal has been a major energy source widely used in transportation, industries, and electricity generation. According to recent statistics on total global coal production, the coal consumption rate has continuously increased from 4,699 Mton in 2000 to 8,025 Mton in 2022 (International Energy Agency, IEA, 2022). The increase in coal consumption is closely related to the production of electricity. In 2017, the International Energy Agency, IEA, 2019 reported that coal-fired power plants generated 40% of total electricity worldwide. Despite the necessity of coal, its use contributes to a rise in the Earth’s temperature due to the emission of greenhouse gases (e.g., CO2) into the atmosphere during combustion. Global warming, due to the use of fossil fuels, including coal, has increased the global mean surface air temperature by 0.89°C in 2022 (National Oceanic and Atmospheric Administration National Centers for Environment Information, NOAA, 2022). Recently, at the Paris Climate Conference in 2015, nearly 200 countries adopted an international agreement that aims to reduce greenhouse gas emissions to keep the global average temperature at <2°C above pre-industrial levels (UNFCCC, 2015).
China is the largest coal-producing country in the world, with >48% of global coal production (International Energy Agency, IEA, 2020). However, since 2005, China’s average annual coal consumption rate has slightly exceeded the national coal production rate. Consequently, approximately 7% (300 million tons) of the total coal consumption in China has been imported from Indonesia (65.8%), Russia (17.4%), and Mongolia (3%) (International Energy Agency, IEA, 2022). However, in South Korea, the coal consumption rate (157 million tons) has largely exceeded the coal production rate (1.9 million tons) (CEIC, 2021). Therefore, the coal consumed in South Korea relies entirely on imports from other countries. In 2022, the largest amount of coal was imported from Australia (37%), followed by Russia (22%), Indonesia (20%), Canada (7%), South Africa (5%), the United States (3.7%), the Philippines (1.6%), and Colombia (1.4%) (Korea Institute of Geoscience and Mineral Resources, 2023). In contrast, imports of coal from China have gradually decreased, accounting for only 0.03% of total coal imported into South Korea in 2022.
Geographically, South Korea is located to the east of China, and air pollutants (including greenhouse gases) emitted from thermal power and industrial plants in China are transported to South Korea by the westerlies. To solve this environmental problem between the two countries, it is important to explore the scientific evidence that air pollutants move from China to South Korea. Kim (2019) assessed that the concentration of particulate matter (PM10) entering Korea from China had an impact of 12%–30%, depending on the season and wind direction. Oh et al. (2020) estimated that >60% of fine particulate matter (PM2.5) concentrations observed in South Korea over five consecutive days in January 2019 were derived from China. Park et al. (2018), based on the composition of carbon and nitrogen isotopes, found that PM2.5 collected from Baengnyeong Island, which is geographically located between China and Korea, was predominantly derived from China. Carbon and nitrogen isotope ratios of air samples have been used to identify the origins of atmospheric pollutants (Turnbull et al., 2011; Walters et al., 2015; Pang et al., 2016; Wojtal et al., 2016). Zong et al. (2020) estimated the nitrogen isotopic composition of national NOx (δ15N-NOx) emissions by vehicle in China based on δ15N-NOx values from various vehicle exhausts (n = 137). Widory and Javoy (2003) identified the contribution of CO2 sources (e.g., vehicles, heating sources, and human respiration) in the urban atmosphere using a combination of carbon isotopes and CO2 concentrations. However, no studies focused on whether coal-fired gases could be used to identify national-derived greenhouse gases and air pollutants from nearby countries.
Therefore, the objectives of this study were to analyze the multi-isotopic composition of coal used mainly in Korea and to preliminarily evaluate whether it is possible to judge whether greenhouse gases derived from China contribute to the atmosphere in Korea using the isotopic composition of coal. To this end, the coal samples used in coal-fired power plants in Korea, imported from eight countries (South Africa, Australia, Russia, the United States, Canada, Indonesia, Colombia, and the Philippines), were analyzed.
2 Methodology
2.1 Coal samples
In South Korea, coal-fired power plants are located along the coastlines of the central-western (and northwestern), northeastern, and central-southern areas (Supplementary Figure S1). Most plants have been operating since the 1990s, while a few new ones are under construction. Of the coal-fired power plants, those in the western areas account for the highest electricity production (73%), followed by those in the central southern (22%), and northeastern (5%) areas (Korea Electric Power Corporation, KEPCO, 2023). A total of 68 coal samples were collected from five coal-fired power plants in western, southern, and eastern Korea (Supplementary Figure S1). Samples collected from the plants were transferred to Ziploc bags using a plastic shovel and transported to the laboratory. The samples imported from eight countries in 2021 were distributed as follows: Australia (n = 18), Indonesia (n = 21), the Russian Federation (n = 15), South Africa (n = 4), Canada (n = 2), Colombia (n = 4), the Philippines (n = 1), and the United States (n = 3). Other information, such as the location of the coal mine, was not available. The coal samples were stored in the laboratory at room temperature until analysis.
2.2 Coal sample preparation and analyses
The coal samples were dried at room temperature and pulverized using an agate mortar and pestle. To determine the carbon and nitrogen isotopic compositions (δ13C and δ15N, respectively), approximately 50 μg and 2 mg of ground samples were enclosed in tin capsules, respectively. The packed samples were stored in a drying oven until further analysis. δ13C and δ15N values were measured using a VisION mass spectrometer (Isoprime, Manchester, United Kingdom) interfaced with a Vario PyroCube elemental analyzer (Elementar, Hesse, Germany). Although the elemental analyzer included a U-shaped adsorption column to separate the CO2 and N2 gases generated through a combustion tube maintained at 1,150°C, carbon, and nitrogen isotope ratios were separately analyzed due to the extremely high abundance of carbon than nitrogen in the samples.
δ13C and δ15N values were reported in the delta (δ) notation relative to VPDB and air, respectively, where δ (‰) = (Rsample/Rstandard − 1) × 1,000, and R represents 13C/12C and 15N/14N, respectively. δ13C values were normalized using international standards IAEA-600 (−27.8‰), NBS-22a (−29.7‰), USGS-40 (−26.4‰), and IAEA-CH6 (−10.5‰), and laboratory standard UREA (−35.46‰). δ15N values were normalized using international standards USGS-40 (−4.52‰), IAEA-NO3 (4.7‰), and IAEA-600 (1.0‰), and laboratory standard UREA (20.17‰).
3 Results and discussion
The carbon (C), hydrogen (H), nitrogen (N), and sulfur (S) contents of coal (n = 62) imported from eight countries (South Africa, Australia, Russia, the United States, Canada, Indonesia, Colombia, and the Philippines) to South Korea and the isotopic compositions of each element are listed in Supplementary Tables S1, S2, respectively.
3.1 Major elements in imported coal samples
Carbon contents in coal (n = 62) were predominantly high at 47.3%–75.5% (68.3% ± 4.9%), followed by H at 3.0%–6.1% (4.9% ± 0.6%), N at 0.7%–2.5% (1.4% ± 0.5%), and S at 0.1%–1.6% (0.4% ± 0.3%). There were no correlations between the elemental contents or even between those from the same country. Additionally, no correlation was observed between δ13C and any other element (not shown). When the C content in coal is entirely determined by coalification processes, their δ13C values increase together with the C content due to the loss of methane during the process, which is typically a13C-depleted carbon (Whiticar, 1996; Thomas et al., 2022). Due to the lack of correlation between δ13C values and C content in coal, Suto and Kawashima (2016) suggested other factors besides coalification processes, such as photosynthetic fractionation associated with geological time. Thus, the C isotopic composition of the coal in this study was assumed to be determined by the factors suggested by Suto and Kawashima (2016).
3.2 Carbon isotopic compositions in imported coal samples
The δ13C values ranged from −28.1‰ to −22.8‰ (average −25.4 ± 1.6‰, n = 68) (Supplementary Figure S2; Supplementary Table S2). On average, Indonesian and South African coal samples showed the lowest (average −27.3 ± 1.1‰, n = 21) and highest (average −23.5 ± 0.5‰, n = 4) δ13C values, respectively. Two samples of Indonesian coal significantly exceeded the Grubbs test value (Gcritical 2.73; Gobserved 3.22-3.58; p > 0.0001). With the two samples excluded, the Indonesian and South African coal samples could be completely discriminated. Although the numbers of coal samples from the Philippines and Colombia were low, their δ13C values were similar to those of Indonesian coal. The samples from the other countries (such as Russia, Australia, Canada, and the United States) included δ13C values closer toward South African coal; i.e., the average values of Russian and Australian coals were −24.1 ± 0.5‰ and −24.6 ± 0.6‰, respectively. These results were consistent with previously reported δ13C values. Suto and Kawashima (2016) reported δ13C values of −24.4 ± 1.1‰ for Russian coal and −24.5 ± 0.6‰ for Australian coal.
The carbon isotope ratios obtained in this study were classified into two groups with a bimodal distribution in the histogram (Figure 1). The δ13C values of approximately <−26‰ were observed in the samples from Indonesia, Colombia, and the Philippines, whereas those of others were >−26‰. This phenomenon has also been observed in previously reported δ13C values (Rigby and Batts, 1986; Suto and Kawashima, 2016; Feng et al., 2020). Specifically, most δ13C values for Indonesian coals (−27.7 ± 0.7‰, n = 45) were lighter than −26‰, whereas those from Australia (−24.7 ± 0.8‰, n = 32) and Russia (−23.9 ± 1.3‰, n = 13) were heavier (Figure 1). According to Suto and Kawashima (2016), coal samples (mainly produced by conversion by C3 plants) characterized by a relatively young coal-production age, such as the Cenozoic Tertiary, had lighter δ13C values, whereas coals with heavier δ13C values were produced from the Paleozoic Permian to Mesozoic Jurassic periods (Figure 2). Likewise, different CO2 concentrations and O2/CO2 ratios in the atmosphere over geologic time led to photosynthetic fractionation of −24‰ during the Carboniferous and Permian times and −18‰ during the Cretaceous times (Beerling et al., 2002; Strauss and Peters-Kottig, 2003), producing a wide range of δ13C values for coal. These results implied that the same coal-producing countries export coal with similar δ13C values to South Korea and that δ13C values of coal used in South Korea can be subdivided into ca. −28‰–−27‰ and the other group of ca. −25‰–−24‰. For differences in the carbon isotope between the two groups, conversion by C4 plants into coal would not be dominant. Coal was mostly formed between the Mesozoic and Paleozoic periods (Suto and Kawashima, 2016), and the C4 plant appeared in the Cenozoic period (Osborne and Beerling, 2006). Of the samples, only Indonesian coal was formed in the Cenozoic period (Suto and Kawashima, 2016) and might be from the C4 plants. If so, their carbon isotope compositions theoretically should be characterized by higher δ13C values than those in this study due to the typical δ13C value of the C4 plants. However, Indonesian coal samples in this study showed lower δ13C values compared to other coal samples (Figures 1, 2). Thus, we excluded the potential influence of plant types (i.e., C3 and C4 plants) on the difference in δ13C values.
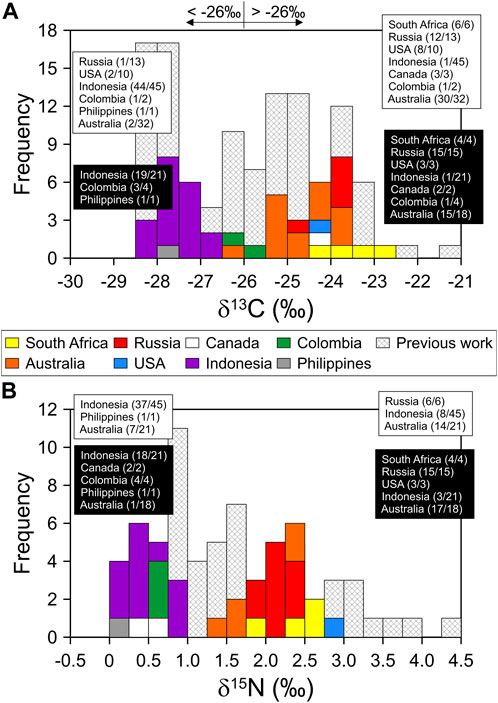
FIGURE 1. Distributions of δ13C and δ15N values for coals imported in South Korea from eight coal-producing countries in this study (colored bars) and in previous studies (hatched bars). The bars represent bimodal distributions at approximately −26‰ and 1.3‰ for δ13C and δ15N values, respectively. Coal-producing countries corresponding to the colored and hatched bars are listed in black and white squares, respectively. The fraction represents the ratio of the number of samples with (A) <−26‰ or >−26‰ and (B) <1.3‰ or >1.3‰ to the number of samples analyzed for coals from different countries.
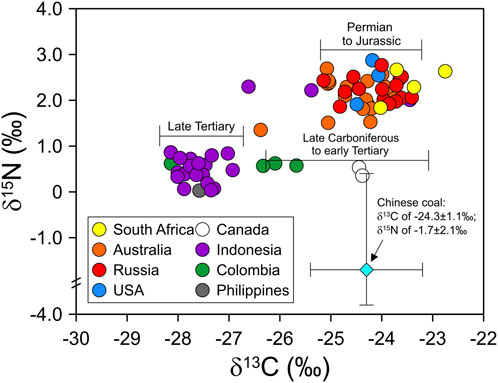
FIGURE 2. Plot of δ13C and δ15N values of coals imported in South Korea from eight coal-producing countries: South Africa, Australia, Russia, the United States, Canada, Indonesia, Colombia, and the Philippines. The isotope compositions representative of Chinese coal (blue color diamond) are from previous studies (Xiao and Liu, 2011). The carbon isotope compositions of the coal correspond to the geological time suggested by Suto and Kawashima (2016).
3.3 Nitrogen isotopic compositions in imported coal samples
The δ15N values of coal samples ranged from 0.03‰ to 2.87‰ (average 1.56 ± 0.89‰, n = 68) (Supplementary Table S2), which is a trend similar to the classification of carbon isotopic compositions related to producing countries. On average, coal samples from Indonesia, Canada, Colombia, and the Philippines showed the lowest δ15N values (average 0.65 ± 0.59‰, n = 28), which had the lower values by excluding three samples with δ15N values of >2.0‰ (0.47 ± 0.25‰, n = 25); the Grubbs test values (Gcritical 2.71) were significantly high for the three samples (Gobserved 2.80–3.73; p > 0.0001). The samples from other countries (South Africa, Russia, the United States, and Australia) showed relatively 15N-enriched isotope values of 1.35‰–2.87‰ (average 2.20 ± 0.35‰, n = 40). The difference in the average of δ15N values was statistically significant (t-test, p < 0.0001). These results were similar to those reported previously for δ15N values. That is, the δ15N values for Russian and Australian coal samples were higher (average 2.13 ± 1.15‰, n = 27) than those of Indonesia and the Philippines (1.23 ± 0.52‰, n = 27) (Rigby and Batts, 1986; Feng et al., 2020). Canadian coal mostly exhibited δ15N values of 0‰–1‰ (Whiticar, 1996). Based on previous studies, the geographical deviations in δ15N values are attributed to organic matter sources and peat-forming vegetation (Xie et al., 2021). The variations in coal rank values from bituminous to anthracite coal were independent of δ15N values (Xie et al., 2021), and all coal samples used in this study were anthracite. These results support the fact that the δ15N values of coal in this study were mainly determined by the organic source materials and coal-forming environment.
3.4 Comparison with carbon and nitrogen isotopes in Chinese coals and implications
Chinese coal represents the wide range of δ13C values from −29.3‰ to −22.1‰ (average −24.3 ± 1.1‰, n = 351) (Supplementary Figure S2), and those from 25th to 75th percentiles are from −24.8‰ to −23.5‰ (Duan, 1995; Zhang et al., 1999; Suto and Kawashima, 2016; Xu et al., 2017; Ding et al., 2018; Guo et al., 2020; Zheng et al., 2020; Wang et al., 2022). The δ15N values of Chinese coal (for anthracite only) range from ca. −4.0‰ to +1.5‰ with a median of −2.0‰, and those from the 25th to 75th percentiles range from approximately −3.0‰ to −0.5‰ (Xiao and Liu, 2011). Both δ13C and δ15N values of Chinese coal were lower than those of the coal used in South Korea, and thereby, were precisely discriminated from the others, especially by δ15N values (Figure 2). Nonetheless, judging whether Chinese coal combustion affects the air quality in South Korea is challenging using the discrimination of the multi-isotopic compositions of coal due to the following reasons:
According to previous studies (Widory, 2006; Warwick and Ruppert, 2016), the carbon isotope fractionation between CO2 derived from coal and its combustion is approximately ∼2‰, and no one of them has consistently higher (or lower) δ13C value. Considering this isotope fractionation, δ13C values of Chinese coal were similar to those of the imported coal in South Korea. In contrast, NOx derived from coal combustion has δ15N values greatly different from those of the coal itself because of the isotopic fractionation occurring in fuel NOx production and NOx reduction technologies (Felix et al., 2012). In South Korea, for NOx released from coal-fired plants operating with the selective catalytic reduction (SCR) (with NOx removal process) and flue gas desulfurization (without NOx removal process) systems, the δ15N values have been reported to be 17.6 ± 0.4‰ and 10.4 ± 0.2‰, respectively (Park et al., 2019). Similarly, Zong et al. (2022) estimated the δ15N value of 17.9‰ for NOx from industrial coal combustion when NOx removal systems reached 79% in China. In Korea, SCR systems operate in most coal-fired plants (Kim et al., 2020); therefore, the NOx derived from coal-fired plants in both countries represents similar δ15N values, although Chinese coals are different from those used in Korea. Moreover, considering NOx is highly reactive and is eliminated within 2 days of emission into the atmosphere (Kenagy et al., 2018) and fine dust originating from China takes approximately one to 7 days to move to South Korea (Kim, 2019), it might be useless to assess whether atmospheric pollutant from China moves to South Korea using nitrogen isotope of NOx. Non-fossil fuel emissions (e.g., biomass burning and microbial N cycle) account for >50% of the total NOx emissions in East Asia (Song et al., 2021). Isotope fractionation occurs during transformation processes into other N-bearing compounds (e.g., HNO3, NO3−, NH3, and particulate nitrate) and preferential wet scavenging (Chen et al., 2022); the δ15N value of 3.9 ± 1.8‰ deviated between precipitation NO3− and the initial NOx mixture. Thus, instead of intercontinental source tracking of air pollutants, it can be used as a powerful tool to assess the sources impacting domestic air quality because NOx emitted from coal-fired power plants represents the distinct δ15N values compared to those of other sources (please see the following paragraph for more details). Nonetheless, the possibility of intercontinental transport of pollutants between China and South Korea may exist because pollution transport occurring as plumes is horizontally spread over ∼1,000 km scale in the free troposphere for ∼2 weeks (English, 2011; Zhuang et al., 2018).
Meanwhile, vehicle emission, with coal-fired emission, is a major anthropogenic source releasing NOx into the atmosphere. According to previous studies, NOx derived from vehicle emission has a wide range of δ15N values. In general, gasoline-derived NOx shows higher δ15N values (−15.1‰ ∼ +10.5‰) than those from diesel vehicles (−23.3‰ ∼ +5.4‰) due to the isotope fractionation occurring during NO production and reduction in vehicle engines (Widory, 2007; Walters et al., 2015). Recently, Zong et al. (2020) reported δ15N values of −18.8‰ to +6.4‰ for vehicle-derived NOx with consideration for differences in structure, performance, and operation between gasoline and diesel engines. Consequently, vehicle-derived NOx represents δ15N values different from those of coal-fired plants. Non-fossil fuel NOx has δ15N values of −30.3 ± 9.4‰ for microbial N cycle and 1.0 ± 4.1‰ for biomass burning (Chen et al., 2022). According to the OPEC’s statistics, crude oil used in China and South Korea is dominantly imported from Middle East countries (Saudi Arabia, UAE, Kuwait, and Iraq). Thus, combustions of the oil may emit CO2 gas with similar δ13C values to the atmosphere. It would be difficult to estimate the contribution of CO2 from China to the atmosphere in South Korea. Based on the analytical data in this study and literature review (Semmens et al., 2014; Suto and Kawashima, 2016; Wang et al., 2022), δ13C values for gasoline- and diesel-derived CO2 are discriminated from coal-derived CO2. Note that their intrinsic isotopic signals can be disturbed by both natural and anthropogenic sources with distinct isotopic values. For example, the δ13C values of soil CO2 range from −31‰ to −24‰ (Jasek et al., 2014), similar to the δ13C values of CO2 from vehicle emissions of −29.3‰ to −27.6‰, while those of CO2 from the combustion of natural gas (heating source) have a low range of −40.5‰ to −37.7‰ (Widory and Javoy, 2003). Recently, the relationship between CO2 concentration and its carbon isotope compositions has been used to trace sources in a local area (Clark-Thorne and Yapp, 2003; Widory and Javoy, 2003). These results suggest that vehicle derived NOx and CO2 have the distinct multi-isotope values and can be discriminated those from coal-fired power plants, implying that the multi-isotopes for coal- and fuel-derived gases can be used to identify atmospheric sources in local scale.
4 Conclusion
The coal samples (n = 68) imported from eight countries (Australia, Colombia, Indonesia, Russia, the United States, Canada, South Africa, and the Philippines) to Korea were collected for comparison with Chinese coal using multi-isotopic compositions and to determine whether it is possible to evaluate the contribution of air pollutants in Korea from coal combustion derived from nearby countries. Coals used in coal-fired power plants in South Korea showed two ranges from −28‰ to −27‰ and from −25‰ to −24‰ for δ13C values and from 0‰ to 1‰ and from 1.8‰ to 2.8‰ for δ15N values. By comparison, Chinese coals showed −24.3‰ for δ13C values and −1.7‰ for δ15N values. Thus, on a plot of δ13C and δ15N values, coals imported in South Korea were discriminated from Chinese coals, especially by δ15N value. These results suggest that a database for multi-isotopic compositions of coals produced in various countries can play a role in identifying Chinese coals. The similar δ13C values of coal used in both countries were preserved after coal combustion with a small isotope fractionation. However, the δ15N value for NOx emitted from coal-fired power plants in both countries can be similar, owing to isotopic fractionation occurring in the fuel NOx production and NOx reduction processes. Complex chemical reactions occurring between NOx and other N-bearing compounds in the atmosphere did not allow us to use multi-isotope compositions as tracers for discriminating intercontinental air pollutant sources. Therefore, the results of this study suggest that more information on air pollutant sources and other analytical tools are required to quantitatively estimate whether emissions from coal combustion in China contribute to air quality in South Korea. In addition, coal derived gases have distinct isotope values discriminated from vehicle emissions, implying that multi-isotopes for gas samples can be used to quantitatively estimate anthropogenic sources in atmosphere in local scale.
Data availability statement
The original contributions presented in the study are included in the article/Supplementary Material, further inquiries can be directed to the corresponding author.
Author contributions
E-KJ: Conceptualization, Data curation, Methodology, Visualization, Writing–original draft. YK: Formal Analysis, Investigation, Writing–review and editing. Y-YJ: Writing–review and editing. K-SL: Writing–review and editing. S-HC: Writing–review and editing, Formal Analysis. Y-SB: Formal Analysis, Writing–review and editing. W-JS: Conceptualization, Funding acquisition, Methodology, Project administration, Supervision, Writing–review and editing.
Funding
The author(s) declare financial support was received for the research, authorship, and/or publication of this article. This work was supported by Korea Basic Science Institute (KBSI) grant (C330120) and by the National Research Foundation of Korea (2020R1C1C1008859).
Conflict of interest
The authors declare that the research was conducted in the absence of any commercial or financial relationships that could be construed as a potential conflict of interest.
Publisher’s note
All claims expressed in this article are solely those of the authors and do not necessarily represent those of their affiliated organizations, or those of the publisher, the editors and the reviewers. Any product that may be evaluated in this article, or claim that may be made by its manufacturer, is not guaranteed or endorsed by the publisher.
Supplementary material
The Supplementary Material for this article can be found online at: https://www.frontiersin.org/articles/10.3389/fenvs.2023.1279004/full#supplementary-material
References
Beerling, D. J., Lake, J. A., Berner, R. A., Hickey, L. J., Taylor, D. W., and Royer, D. L. (2002). Carbon isotope evidence implying high O2/CO2 ratios in the Permo-Carboniferous atmosphere. Geochim. Cosmochim. Acta 66, 3757–3767. doi:10.1016/S0016-7037(02)00901-8
Census and Economic Information Center (2021). CEIC. Available at: https://www.ceicdata.com/en/indicator/korea/coal-production (Accessed July 11, 2023).
Chen, Z., Huang, X., Huang, C., Yang, Y., Yang, H., Zhang, J., et al. (2022). High atmospheric wet nitrogen deposition and major sources in two cities of Yangtze River Delta: combustion-related NH3 and non-fossil fuel NOx. Sci. Total Environ. 806, 150502. doi:10.1016/j.scitotenv.2021.150502
Clark-Thorne, S. T., and Yapp, C. J. (2003). Stable carbon isotope constraints on mixing and mass balance of CO2 in an urban atmosphere: dallas metropolitan area, Texas, USA. Appl. Geochem. 18, 75–95. doi:10.1016/S0883-2927(02)00054-9
Ding, D., Liu, G., Sun, X., and Sun, R. (2018). Response of carbon isotopic compositions of Early-Middle Permian coals in North China to paleo-climate change. J. Asian Earth Sci. 151, 190–196. doi:10.1016/j.jseaes.2017.10.043
Duan, Y. (1995). Study of characteristics of coal isotope composition in China. Coal Geol. Explor. 23, 29–35.
English, J. M. (2011). A sectional microphysical model to study stratospheric aerosol: ions, geoengineering and large volcanic eruptions. Colorado (CO): University of Colorado. Doctoral dissertation.
Felix, J. D., Elliott, E. M., and Shaw, S. L. (2012). Nitrogen isotopic composition of coal-fired power plant NOx: influence of emission controls and implications for global emission inventories. Environ. Sci. Technol. 46, 3528–3535. doi:10.1021/es203355v
Feng, L., Li, H., and Yan, D. (2020). A refinement of nitrogen isotope analysis of coal using elemental analyzer/isotope ratio mass spectrometry and the carbon and nitrogen isotope compositions of coals imported in China. ACS Omega 5, 7636–7640. doi:10.1021/acsomega.0c00488
Guo, B., Eley, Y., Hilton, J., Zou, M., and Wang, Q. (2020). Carbon-isotope, petrological and floral record in coals: implication for Bajocian (Middle Jurassic) climate change. Int. J. Coal Geol. 220, 103417. doi:10.1016/j.coal.2020.103417
International Energy Agency, IEA (2019). CO2 emissions from fuel combustion. Available at: https://iea.blob.core.windows.net/assets/eb3b2e8d-28e0-47fd-a8ba-160f7ed42bc3/CO2_Emissions_from_Fuel_Combustion_2019_Highlights.pdf (Accessed June 26, 2023).
International Energy Agency, IEA (2022). Coal 2022. Available at: https://iea.blob.core.windows.net/assets/91982b4e-26dc-41d5-88b1-4c47ea436882/Coal2022.pdf (Accessed June 26, 2023).
International Energy Agency, IEA (2020). International energy agency. Available at: https://www.iea.org/data-and-statistics/charts/global-coal-production-2018-2021 (Accessed June 26, 2023).
Jasek, A., Zimnoch, M., Gorczyca, Z., Smula, E., and Rozanski, K. (2014). Seasonal variability of soil CO2 flux and its carbon isotope composition in Krakow urban area, Southern Poland. Isot. Environ. Health Stud. 50, 143–155. doi:10.1080/10256016.2014.868455
Kenagy, H. S., Sparks, T. L., Ebben, C. J., Wooldrige, P. J., Lopez-Hilfiker, F. D., Lee, B. H., et al. (2018). NOx Lifetime and NOy partitioning during winter. J. Geophys. Res. Atmos. 123, 9813–9827. doi:10.1029/2018JD028736
Kim, H. S., Kasipandi, S., Kim, J., Kang, S. H., Kim, J. H., Ryu, J. H., et al. (2020). Current catalyst technology of selective catalytic reduction (SCR) for NOx removal in South Korea. Catalysts 10, 52. doi:10.3390/catal10010052
Kim, M. J. (2019). The effects of transboundary air pollution from China on ambient air quality in South Korea. Heliyon 5, e02953. doi:10.1016/j.heliyon.2019.e02953
Korea Electric Power Corporation, KEPCO (2023). The monthly report on major electric power statistics. Available at: https://home.kepco.co.kr/kepco/KO/ntcob/list.do?boardCd=BRD_000097&menuCd=FN05030101 (Accessed July 11, 2023).
Korea Institute of Geoscience and Mineral Resources (2023). KIGAM. Available at: https://www.kigam.re.kr/menu.es?mid=a30102030203 (Accessed June 17, 2023).
National Oceanic and Atmospheric Administration National Centers for Environment Information, NOAA (2022). Monthly global climate report for January 2022. Available at: https://www.ncei.noaa.gov/access/monitoring/monthly-report/global/202201 (Accessed July 11, 2023).
Oh, H. R., Ho, C. H., Koo, Y. S., Baek, K. G., Yun, H. Y., Hur, S. K., et al. (2020). Impact of Chinese air pollutants on a record-breaking PMs episode in the Republic of Korea for 11-15 January 2019. Atmos. Environ. 223, 117262. doi:10.1016/j.atmosenv.2020.117262
Osborne, C. P., and Beerling, D. J. (2006). Nature’s green revolution: the remarkable evolutionary rise of C4 plants. Phil. Trans. R. Soc. B 361, 173–194. doi:10.1098/rstb.2005.1737
Pang, J., Wen, X., and Sun, X. (2016). Mixing ratio and carbon isotopic composition investigation of atmospheric CO2 in Beijing, China. Sci. Total Environ. 539, 322–330. doi:10.1016/j.scitotenv.2015.08.130
Park, K. S., Kim, H., Yu, S. M., Noh, S., Park, Y. M., Seok, K. S., et al. (2019). Characterization of contribution of vehicle emissions to ambient NO2 using stable isotopes. Anal. Sci. Technol. 32, 17–23. doi:10.5806/AST.2019.32.1.17
Park, Y. M., Park, K. S., Kim, H., Yu, S. M., Noh, S., Kim, M. S., et al. (2018). Characterizing isotopic compositions of TC-C, NO3-N, and NH4-N in PM2.5 in South Korea: impact of China’s winter heating. Environ. Pollut. 233, 735–744. doi:10.1016/j.envpol.2017.10.072
Rigby, D., and Batts, B. D. (1986). The isotopic composition of nitrogen in Australian coals and oil shales. Chem. Geol. 58, 273–282. doi:10.1016/0168-9622(86)90016-3
Semmens, C., Ketler, R., Schwendenmann, L., Nesic, Z., and Christen, A. (2014). Isotopic composition of CO2 in gasoline, diesel and natural gas combustion exhaust in Vancouver, BC. Vancouver, BC: Canada. University of British Columbia. Available at: https://open.library.ubc.ca/cIRcle/collections/facultyresearchandpublications/42387/items/1.0103591 (Accessed August 11, 2023).
Song, W., Liu, X. Y., Hu, C. C., Chen, G. Y., Liu, X. J., Walters, W. W., et al. (2021). Important contributions of non-fossil fuel nitrogen oxides emissions. Nat. Commun. 12, 243. doi:10.1038/s41467-020-20356-0
Strauss, H., and Peters-Kottig, W. (2003). The Paleozoic to Mesozoic carbon cycle revisited: the carbon isotopic composition of terrestrial organic matter. Geochem. Geophys. Geosyst. 4, 1083. doi:10.1029/2003GC000555
Suto, N., and Kawashima, H. (2016). Global mapping of carbon isotope ratios in coal. J. Geochem. Explor. 167, 12–19. doi:10.1016/j.gexplo.2016.05.001
Thomas, R. A. P., Riding, M. J., Robinson, J. D. F., Brown, S. J. A., and Taylor, C. (2022). Distinguishing sources of ammonium in groundwater at former gasworks sites using nitrogen isotopes. Q. J. Eng. Geol. Hydrogeol. 55, qjegh2021–139. doi:10.1144/qjegh2021-139
Turnbull, J. C., Tans, P. P., Lehman, S. J., Baker, D., Conway, T. J., Chung, Y. S., et al. (2011). Atmospheric observations of carbon monoxide and fossil fuel CO2 emissions from East Asia. J. Geophys. Res. 116, D24306. doi:10.1029/2011JD016691
United Nations Framework Convention on Climate Change, UNFCCC (2015). Adoption of the Paris agreement. Available at: https://unfccc.int/documents/9064 (Accessed June 17, 2023).
Walters, W. W., Goodwin, S. R., and Michalski, G. (2015). Nitrogen stable isotope composition (δ15N) of vehicle-emitted NOx. Environ. Sci. Technol. 49, 2278–2285. doi:10.1021/es505580v
Wang, P., Zhou, W., Xiong, X., Wu, S., Niu, Z., Cheng, P., et al. (2022). Stable carbon isotopic characteristics of fossil fuels in China. Sci. Total. Environ. 805, 150240. doi:10.1016/j.scitotenv.2021.150240
Warwick, P. D., and Ruppert, L. F. (2016). Carbon and oxygen isotopic composition of coal and carbon dioxide derived from laboratory coal combustion: a preliminary study. Int. J. Coal Geol. 166, 128–135. doi:10.1016/j.coal.2016.06.009
Whiticar, M. J. (1996). Stable isotope geochemistry of coal, humic kerogens and related natural gases. Int. J. Coal Geol. 32, 191–215. doi:10.1016/S0166-5162(96)00042-0
Widory, D. (2006). Combustibles, fuels and their combustion products: a view through carbon isotopes. Combust. Theory Model. 10, 831–841. doi:10.1080/13647830600720264
Widory, D., and Javoy, M. (2003). The carbon isotopic composition of atmospheric CO2 in Paris. Earth Planet. Sci. Lett. 215, 289–298. doi:10.1016/S0012-821X(03)00397-2
Widory, D. (2007). Nitrogen isotopes: tracers of origin and processes affecting PM10 in the atmosphere of Paris. Atmos. Environ. 41, 2382–4390. doi:10.1016/j.atmosenv.2006.11.009
Wojtal, P. K., Miller, D. J., O’Connor, M., Clark, S. C., and Hastings, M. G. (2016). Automated, high-resolution mobile collection system for the nitrogen isotopic analysis of NOx. J. Vis. Exp. 118, e54962. doi:10.3791/54962
Xiao, H. Y., and Liu, C. Q. (2011). The elemental and isotopic composition of sulfur and nitrogen in Chinese coals. Org. Geochem. 42, 84–93. doi:10.1016/j.orggeochem.2010.10.011
Xie, P., Dai, S., Hower, J. C., Nechaev, V. P., French, D., Graham, I. T., et al. (2021). Nitrogen isotopic compositions in NH4+-mineral-bearing coal: origin and isotope fractionation. Chem. Geol. 559, 119946. doi:10.1016/j.chemgeo.2020.119946
Xu, C., Chen, B., Wu, D., Ding, D., Xia, Y., and Liu, G. (2017). Distribution characteristics of isotope carbon and its geological origin in coal & gas carbon of Qidong coal mine, Huaibei coalfield. Coal Geol. Explor. 45, 54–58. doi:10.3969/j.issn.1001–1986.2017.03.010
Zhang, H., Shen, G., and He, Z. (1999). A carbon isotopic stratigraphic pattern of the Late Palaeozoic coals in the North China Platform and its palaeoclimatic implications. Acta Geol. Sin. 73, 111–119. doi:10.1111/j.1755-6724.1999.tb00817.x
Zheng, X., Dai, S., Nechaev, V., and Sun, R. (2020). Environmental perturbations during the latest Permian: evidence from organic carbon and mercury isotopes of a coal-bearing section in Yunnan Province, southwestern China. Chem. Geol. 549, 119680. doi:10.1016/j.chemgeo.2020.119680
Zhuang, J., Jacob, D. J., and Eastham, S. D. (2018). The importance of vertical resolution in the free troposphere for modeling intercontinental plumes. Atmos. Chem. Phys. 18, 6039–6055. doi:10.5194/acp-18-6039-2018
Zong, Z., Shi, X., Sun, Z., Tian, C., Li, J., Fang, Y., et al. (2022). Nitrogen isotopic composition of NOx from residential biomass burning and coal combustion in North China. Environ. Pollut. 304, 119238. doi:10.1016/j.envpol.2022.119238
Keywords: carbon isotope, nitrogen isotope, coal-fired plants, source identification, coal-derived air pollutants
Citation: Jeong E-K, Kim Y, Jung Y-Y, Lee K-S, Choi S-H, Bong Y-S and Shin W-J (2023) Carbon and nitrogen isotope characterization of imported coals in South Korea. Front. Environ. Sci. 11:1279004. doi: 10.3389/fenvs.2023.1279004
Received: 17 August 2023; Accepted: 10 October 2023;
Published: 24 October 2023.
Edited by:
Karl Ropkins, University of Leeds, United KingdomReviewed by:
Maciej Górka, University of Wrocław, PolandWendell William Walters, Brown University, United States
Copyright © 2023 Jeong, Kim, Jung, Lee, Choi, Bong and Shin. This is an open-access article distributed under the terms of the Creative Commons Attribution License (CC BY). The use, distribution or reproduction in other forums is permitted, provided the original author(s) and the copyright owner(s) are credited and that the original publication in this journal is cited, in accordance with accepted academic practice. No use, distribution or reproduction is permitted which does not comply with these terms.
*Correspondence: Woo-Jin Shin, sirms4@kbsi.re.kr
†Present address: Seung-Hyun Choi, INA Korea Corp., Seoul, Republic of Korea