The characteristic of atmospheric particulate matter and the influence factors in Xiamen for air quality management
 Jiali Lin
 Ying Lin
 Shuangyi Lin3
 - 1Chengyi University College, Jimei University, Xiamen, China
- 2College of Landscape Architecture, Fujian Agriculture and Forestry University, Fuzhou, China
- 3Xiamen Greening Center, Xiamen, Fujian, China
- 4School of Architecture, Clemson University, Clemson, SC, United States
Urbanization can drive economic growth, but it may harm the quality of the urban environment if improper actions are performed. Environmental issues resulting from urbanization can negatively impact the health of city dwellers. Therefore, studying air pollutants is crucial to urban development. In this study, we focus on Xiamen and examine the distribution patterns of urban air pollutants over an extended period of time. The goal is to enhance Xiamen’s air quality and bridge the research gap in long-term air quality studies specific to Xiamen. Based on monitoring data from 2014 to 2021 spanning 8 years, this study analyzed the trends in atmospheric particulate matter (PM: PM10, PM2.5) and their relationship with meteorological factors (such as wind speed: WS, temperature: T, dew point temperature: DPT, height of the cloud ceiling: HCC) and the concentrations of other pollutants (SO2, NO2, CO, and O3). The results indicated that (1) The high air quality in Xiamen with the lowest PM values observed during summer and the highest during winter; NO2 and SO2 concentrations showed similar trends to PM, while O3 and CO concentrations varied differently. (2) In general, the maximum daily PM concentration was observed in the evening and early morning, while the lowest value appeared at noon. The concentrations of PMs were positively correlated with other pollutants, while T, WS, HCC (cloud cover of more than 70%), and DPT were negatively correlated with PM concentrations. (3) There exists a relationship between concentrations of atmospheric particulate matter, atmospheric pollutants, and meteorological factors. The wind direction had varying effects on PM concentration, with PM2.5 and PM10 concentrations showing consistent trends and higher concentrations of PMs observed when winds blew from the west, southeast, and northeast. This study also provides a summary of strategies for addressing different air pollutant distribution characteristics. The purpose of this study is to analyze the distribution patterns of air pollutants in Xiamen and provide valuable insights for improving the city’s air quality.
1 Introduction
Rapid economic development, urbanization, and industrialization have deteriorated the living environment in many ways, such as air quality (Zhou et al., 2016), human health (Mohammed et al., 2016; Qi et al., 2022a), flooding (Wang et al., 2023), and thermal environment (Qi et al., 2022b; Qi et al., 2023). One of the most concerns is air quality that major cities around the world have faced since the mid-20th century (Mohammed et al., 2016; Zhou et al., 2016). Among the most concerning air pollutants are particulate matter (PM), which includes both fine particles (PM2.5) with a diameter of ≤2.5 μm, and coarser particles (PM10) with a diameter of ≤10 μm (Li et al., 2013; Zhang et al., 2022). Previous research has demonstrated that particulate matter (PM) exposure has detrimental effects on human health (Qu, 2020). These particles can adsorb large quantities of toxic substances, which, when inhaled, can lead to various respiratory and cardiovascular diseases (Mohammed et al., 2016). The accumulation of PM2.5, PM10, NO2, SO2, and O3 has the potential to trigger acute exacerbations of COPD (Chronic Obstructive Pulmonary Disease) (Qu, 2020). In addition to the health impacts, PMs also have a direct impact on climate change due to their thermal radiation effect. The ability of PMs to absorb and scatter light can lead to atmospheric cooling or warming phenomena. Beyond these direct impacts, PMs exert indirect effects on the climate by altering the physical and radiative properties of clouds. These alterations can impact cloud formation and precipitation patterns, further influencing weather can climate dynamics (Jiang et al., 2022; Li et al., 2022; Sundram et al., 2022).
Despite numerous studies on atmospheric pollutants, the impact of these pollutants on spatial dispersion patterns remains unclear (Xiao et al., 2016). Numerous studies have demonstrated that air pollutants significantly influence the ecological health of urban areas, which is now becoming an increasing concern in urban development (Sloane, 1982; Doyle and Dorling, 2002; Ministry of Environmental Protection, 2012). Hence, one of the key challenges for city managers is findings ways to bolster urban management to reduce overall atmospheric particulate matter concentration in cities. The majority of research on the management of urban air quality has focused on urban green areas, such as exploring air quality in urban forests and optimizing tour routes. However, there has been less emphasis on the long-term impacts of urban air pollutants. This is a critical area of investigation, given that air quality is closely related to the quality of life in urban environments and serves as an important measure of urban environmental quality. Furthermore, enhancing urban air quality can considerably boost the health of urban residents (Koschmieder, 1926; Husar et al., 1984; Xue et al., 2015; Wang et al., 2016). Ma et al., (2016) revealed the temporal and spatial characteristics of atmospheric pollutants in three megacities over China, explored the variation of air quality, major air pollutants, and analyzed the influences of meteorological factors. Jiang et al., (2022) reveal the characteristics of ambient PMs and O3 in China and synergy in anthropogenic emissions and atmospheric processes (Sundram et al., 2022).
Atmospheric air pollution is a global issue, and managing urban air quality is essential for achieving sustainable urban development. In China, many regions, particularly the economically developed coastal cities, are confronted with diverse air pollution issues. Furthermore, air pollution in China exhibits notable regional disparities (Ting et al., 2022), underscoring the significance of investigating air pollutant concentrations in specific areas. Xiamen, situated in the southern region of Fujian Province, is one of the most densely populated and economically vibrant cities in China. As a renowned tourist destination, it is crucial to understand the concentrations of particulate matter (PM) and other atmospheric pollutants, as well as their impact factors, in Xiamen. Studies focusing on PM in Xiamen primarily involve analyzing the chemical composition of PM (Jiang et al., 2022), with fewer studies addressing the variation of PMs. For instance, Ting Ma conducted a spatial and temporal variation analysis of PM10 concentration in 2006 (Song et al., 2017). However, there have been scant analysis on PMs concentration variation patterns and associated influence factors. In summary, scholarly research on air quality in Xiamen, which is a typical coastal tourist city, is relatively limited. There is indeed a significant research and analysis gap when it comes to studying the long-term air quality in Xiamen. Hence, summarizing the distribution patterns of air pollutants in Xiamen can provide valuable insights for improving the city’s atmospheric environment.
Based on the Chinese Ambient Air Quality Standard (CAAQS No. GB3095-2012), this study comprehensively investigated the hourly average mass concentrations of PM2.5 and PM10 in Xiamen over an 8-year period from 1 January 2014, to 30 December 2021. The study also analyzed the intricate relationship between PMs, other pollutants, and meteorological factors. The study’s contributions can be summarized as follows: firstly, it analyzed the variation pattern of PMs concentration based on daily, monthly, seasonal, and spatial variations; secondly, it analyzed the PMs concentration characteristics under comprehensive meteorological conditions using K-means clustering; thirdly, it analyzed the correlation between PMs and meteorological factors and other pollutants in Xiamen, focusing on the relationship between PMs concentration and atmospheric visibility and PMs concentration and wind direction; finally, it analyzed the impact on PMs concentration brought by typical extreme weather—typhoon. This study has important implications for urban development in Xiamen and contributes to filling the knowledge gap on distribution patterns of air pollutants in coastal tourist cities over long time spans. Furthermore, the findings can serve as a catalyst for air quality improvement in other coastal cities.
2 Materials and methods
2.1 Overview of study area
Xiamen, located in the southern part of Fujian Province, China, stands out as one of the only two prefecture-level administrative regions characterized by a predominantly island-based landscape. The city encompasses Xiamen Island, Gulangyu Island, the northern inland area, and several smaller islands scattered throughout the surrounding sea. Its extensive coastline spans a length of 234 km, accompanied by a sea area of 390 km2 (Sundram et al., 2022). In 2015, the estimated population of Xiamen was approximately 3.86 million (Li et al., 2022). Being a prominent city in the economic zone on the west coast of Taiwan, Xiamen is currently undergoing rapid economic and urban growth, rendering it a significant tourist destination within Fujian Province. However, this rapid development has led to a less than optimistic air quality situation (Xiao et al., 2016). Consequently, enhancing the air quality in Xiamen holds crucial importance, not only for the wellbeing of its residents but also for cultivating a positive perception of the region among tourist influx.
2.2 Data source
In February 2012, the State Ministry of Environmental Protection and the General Administration of Quality Supervision, Inspection and Quarantine jointly released the national environmental quality standard known as the Ambient Air Quality Standard (GB 3095-2012). This standard delineated the main ambient air pollutant, including particulate matter with an aerodynamic diameter not exceeding 10 μm (PM10) and particulate matter with an aerodynamic diameter not exceeding 2.5 μm (PM2.5). Additionally, it encompasses four specific pollutants, namely, sulfur dioxide (SO2), nitrogen dioxide (NO2), carbon monoxide (CO), and ozone (O3) (Ministry of Environmental Protection, 2012). Therefore, for this study, we selected these six air pollutants for this study.
To acquire meteorological data, including temperature, humidity, barometric pressure, wind speed, and dew point temperature, we accessed information from the Xiamen Gaoqi site, sourced from the China Meteorological Data Network (http://data.cma.cn/) and the National Oceanic and Atmospheric Administration (NOAA, https://www.climate.gov/). The Air Quality Index (AQI) and air pollutant concentrations (PM10, PM2.5, SO2, NO2, CO, O3) were provided by the Ministry of Environmental Protection of the People’s Republic of China (MEPRC, http://www.mep.gov.cn/hjzl/). The monitoring stations were established in Huli District, Siming District, Gulangyu Island, and Tongan District of Xiamen Island, with an hourly monitoring interval. Thus, the data in this study are presented in hourly increments. These stations are located at a distance of 80 km from the Gaoqi meteorological monitoring station, ensuring spatial representativeness in the meteorological observations.
2.3 Analysis method
The study utilized five statistical analysis methods as follows: 1) The initial phase of analysis involves statistical analysis of the annual variation patterns of atmospheric particulate matter, combined with other atmospheric pollutant concentrations, and meteorological factors. This analysis aims to discern the annual variations in atmospheric pollutant levels. 2) The secondary analysis focuses on the evaluation of daily variation patterns under different meteorological conditions, across different years, seasons, months, and monitoring points. By examining daily variations, more targeted strategies for improving urban air quality can be derived. 3) Utilizing the K-means clustering technique, we conducted a classification of statistical data in SPSS 19.0 to analyze the characteristics of concentration shifts of atmospheric particulate matter under different comprehensive meteorological conditions. An effective summarization of these characteristics can help derive measures for improving meteorological conditions. 4) Further, we calculated the correlation between the concentration of atmospheric particulate matter, atmospheric pollutants, and meteorological factors. We also performed an analysis of the relationship between wind direction and atmospheric pollutant concentration. A profound understanding of the relationship between meteorological factors and atmospheric pollutants has the potential to assist urban developers in directing improvements to ambient air quality, premised on the prevailing meteorological conditions. 5) Lastly, we referred to the study of M. Doyle and S. Dorling’s study (Doyle and Dorling, 2002) and formulated a regression equation for atmospheric visibility and atmospheric particulate matter concentration. To make the regression equation more representative, our study carefully excluded data affected by special weather conditions that could alter visibility, such as foggy days or episodes of heavy rainfall. Additionally, monitoring data with a relative humidity greater than 90% were disregarded as higher air humidity can have a strong blocking effect on air particle dispersion (Sloane, 1982). All data analysis was conducted in SPSS 19.0 software.
The extinction coefficient, denoted as βext, was obtained by referring to Koschmieder’s research method (Koschmieder, 1926):
This is example 1 of an equation:
In Eq. 1, βext is the extinction coefficient in (km−1); V is the atmospheric visibility (km).
In an authentic atmospheric setting, the hygroscopic tendencies of atmospheric suspended matter can affect its physicochemical properties. The “dry extinction coefficient” (βdryext) can be calculated based on βext and relative humidity (RH). The study was based on the equation put forth by Husar et al. (1984) as the mathmeticla framework for calculating βdryext:
In Eq. 2: RH is the relative humidity, βext is the extinction coefficient, and βdryext is the dry extinction coefficient. Analysis of the typical extreme weather along the southeast coast: typhoons, with their impact on atmospheric particulate matter concentrations.
3 Results
3.1 Annual characteristic of the concentration of the air pollution
The study observed that the concentration of atmospheric particulate matter peaked in winter and dipped to their lowest levels in summer with an annual change pattern characterized by elevated levels in spring and winter and lower concentrations in summer and autumn. The AQI index, alongside with the concentrations of NO2, SO2, and CO, showed similar annual variation characteristics as those of PMs. Conversely, the concentration trend of O3 appeared relatively flat, absent of a discernible seasonal pattern. Further observations revealed that PM concentrations were the lowest in July and the highest in January. Contrastingly, the AQI index showed the opposite trend, with the highest value noted in December and the lowest in July. The monthly low concentrations of air pollutants in July may be attributed to high temperatures and rainfall during the summer season, in conjunction with the recurrent incidence of typhoons during this period–factors which could largely account for the decline in air pollutant concentrations. Xiamen demonstrated consistent high-level air quality as shown in Figure 1, which presents the annual variation pattern of PMs, other air pollutant concentrations, and meteorological factors from January 2014 to December 2021. Based on the environmental air quality standard (http://kjs.mep.gov.cn), the annual average AQI index, PM10, SO2, NO2, CO, and O3 concentrations were found to be 47 μg/m3, 48.92 μg/m3, 11.12 μg/m3, 29.27 μg/m3, 0.61 mg/m3, and 51.78 μg/m3, respectively, all of which conformed to the primary standard of environmental quality. However, the PM2.5 concentration (28.94 μg/m3) slightly exceeded the primary standard of 25 μg/m3.
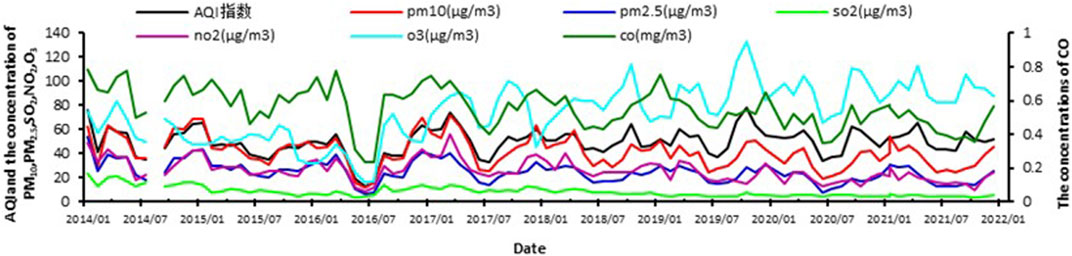
FIGURE 1. Variations of the concentrations of PMs and other pollutants.
3.2 Daily variation pattern of atmospheric particulate matter concentration
Figure 2 and Figure 3 depict the temporal and spatial variations of PM2.5 and PM10 concentrations in Xiamen over the monitoring period, showing daily variations in different seasons, months, pollution levels, years, monitoring sites (located in urban, suburban, and distant suburbs), and weather conditions. The mean daily variation showcases that the peak concentrations typically occur at midnight and early morning, whereas the lowest values are usually noted in the evening. The diurnal fluctuations in PM2.5 and PM10 concentrations manifest disparate trends in different seasons, with PM2.5 reaching its peak only at noon, while PM10 displays two distinct peaks, one at noon and another between 18:00-21:00. Each month exhibits a similar pattern of change, with PM10 showing a double-peak and double-valley configuration particularly in October-December, characterized by a midday peak and an evening peak. The daily change in PM concentration is typified by a “sharp rise and fall” on polluted days, while the PM concentration tends to change more slowly under lower pollutant concentration. The yearly trend reveals a decreasing trend of PM concentration, indicating effective treatment of air pollutant control. The Xidong monitoring site, located in the far suburbs, shows daily trends different from the other three monitoring points, indicating high concentrations at noon and low concentrations during the morning and evening, indicative of anthropogenic influences. The change of PM concentration under different weather conditions proves to be more complicated. The PM2.5 concentration typically ascends from sunny to rainy and from cloudy to overcast weather conditions, while the PM10 concentration tends to increase from cloudy to rainy conditions. Further analysis reveals that different weather conditions exert varied impacts on PM10 and PM2.5, which are likely linked to specific characteristics of climate change (see Figure 3 for details).
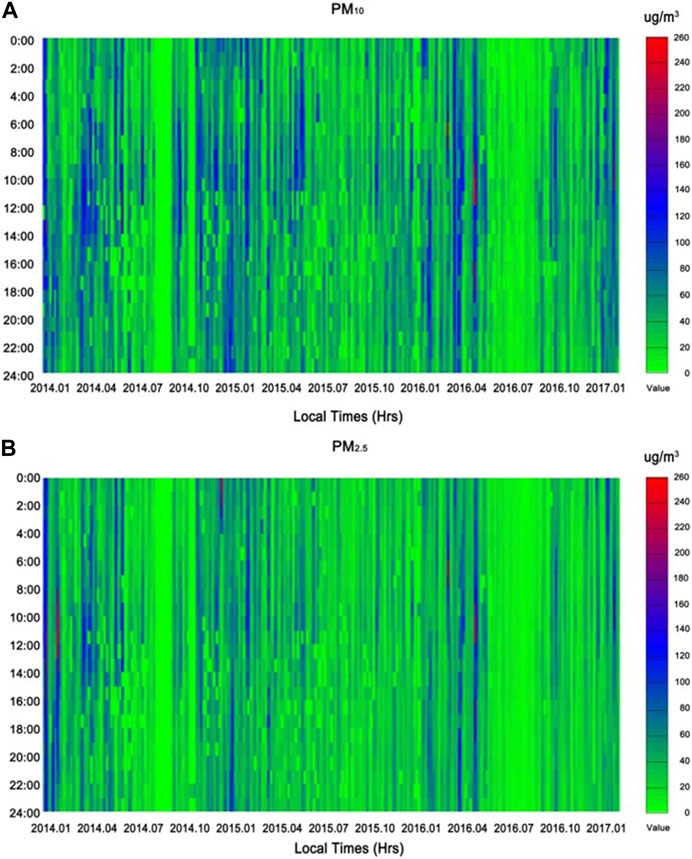
FIGURE 2. Thermal Imaging of diurnal variation of atmospheric particle concentration. (A) PM10, (B) PM2.5.
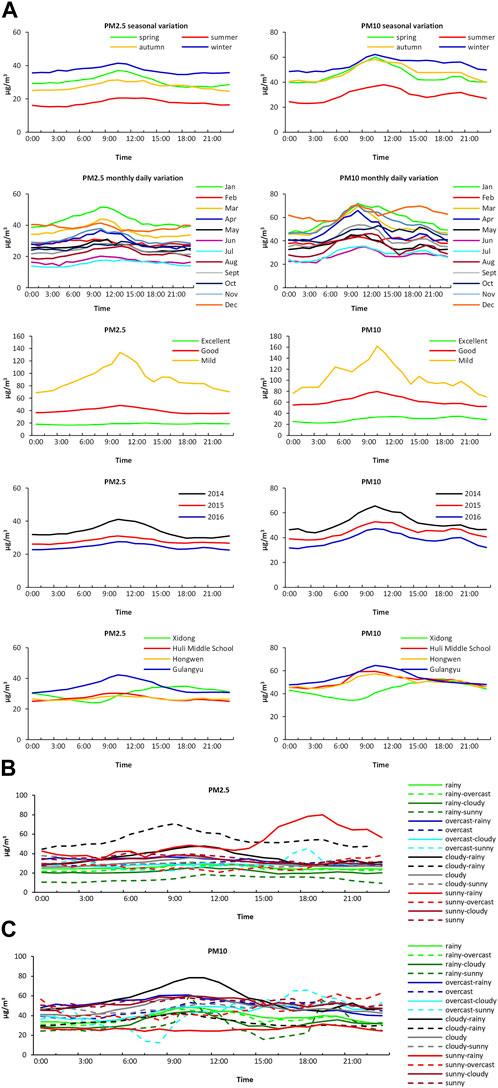
FIGURE 3. Daily variations of the value of AQI, visibility, and concentrations of PM10, PM2.5, SO2, NO2, O3, and CO in Xiamen in (A) spring, (B) summer, (C) fall, winter during 2015–2016 1–2: spring, 3-4: summer, 5-6: fall, 7-8: winter.
3.3 K-means clustering analysis of meteorological factors
To comprehensively investigate the interplay of meteorological factors on the atmospheric particulate matter concentrations, a K-means clustering analysis was implemented on a dataset of 8,700 monitoring data point. This dataset was refined by excluding those with more than 8 h of daily missing measurements and those devoid of sea-level pressure (SLP) data (since SLP is monitored every 3 h). Following the methodology of previous studies (Xue et al., 2015), we classified the data based on atmospheric visibility, temperature (excluding dew point temperature), humidity, wind speed, and SLP, and calculated the mean values of PM10, PM2.5 concentrations, atmospheric visibility, temperature, SLP, relative humidity, and wind speed for each of the five groups. Table 1 presents the results of the K-means clustering analysis, which was performed with 20 iterations.
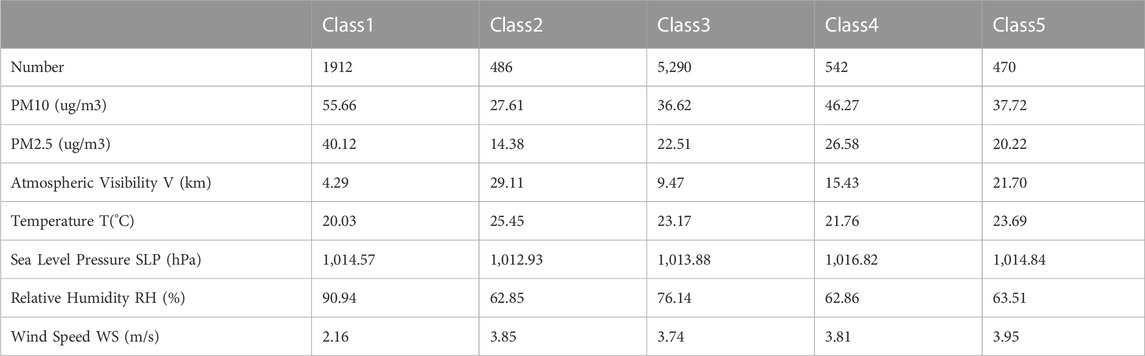
TABLE 1. Average values of air pollutants, meteorological factors, and visibility for each class after clustering analysis based on 7 parameters.
The mean concentrations of PM10 and PM2.5 in group 2 were 27.61 and 14.38 μg/m3, respectively, which were the lowest among the groups. Group 2 exhibited meteorological conditions of high temperatures, low humidity, high wind speeds, and low pressure, which are characteristics of summer afternoons in Xiamen. These results suggest that the atmospheric particulate matter concentrations in Xiamen are generally lower during the summer compared to other seasons. The mean PM10 values in groups 3 and 5 were 36.62 and 37.72 μg/m3, respectively, with corresponding PM2.5 concentrations being 22.51 and 20.22 μg/m3. The temperature, wind speed, and pressure in these groups were observed to be similar, while the relative humidity in group 3 exceeded that in group 5. This observation suggests that the atmospheric visibility in group 3 was reduced by 9.47 km relative to group 5 at a distance of 21.70 km, thereby highlighting the pronounced impact of humidity on atmospheric visibility when the concentrations of large pollutants and meteorological factors remain akin. In group 4, the average concentrations of PM10 and PM2.5 were 46.27 and 26.58 μg/m3, respectively, and the meteorological conditions were characterized by lower temperature and humidity and higher air pressure, which is typical of winter weather without precipitation. Group 1 exhibited high humidity, low wind speed, low temperature, and high pressure, alongside elevated concentrations of atmospheric pollutants, with PM10 and PM2.5 reaching 55.66 and 40.12 μg/m3, respectively. These conditions are typical of rainy days in spring and winter, which tend not to facilitate the diffusion of atmospheric particulate matter, thereby leading to its accumulation. Furthermore, there are more sources of pollution in winter, resulting in group 1 being the highest concentrations of PMs among the groups.
Upon summarizing the characteristics of air pollutants predicated on the above classification, we can identify noteworthy patterns and trends. This study underlines the necessity of upgrading urban management measures to ameliorate air quality. The correlation analysis between major pollutants and atmospheric particulate matter concentrations substantiates that sources of urban air pollutants bear significant similarity. Therefore, measures such as reducing auto exhaust and restricting straw burning in winter should be advocated as means to reduce pollution.
Moreover, this study found that urban particulate matter concentrations demonstrate spatial variability across different urban locations. By identifying the pollution sources, suitable tree species, possessing a strong ability to retain PM2.5 and other particulate matter, should be selected for planting around these sources. A reasonable spatial configuration of plants, embodying varying life forms and leaf habits, can improve the leaf area index or green volume level. This, in turn, can enhance the effect of landscape structure, yielding better air purification benefits (Wan et al., 2011; Wu et al., 2012; Du et al., 2013; Song et al., 2017).
Overall, this study’s findings provide invaluable insights into the path towards air quality improvement in Xiamen city. The implementation of urban management measures coupled with the selection of suitable tree species for planting can have a significant impact on reducing air pollution levels. The insights gleaned from this study could serve as a valuable reference for other cities, both in China and globally, that are facing similar air quality challenges. However, further research is needed to determine the long-term effects of these measures on air quality improvement.
3.4 Analysis of the relationship between atmospheric particulate matter concentration and atmospheric pollutant concentration and meteorological factors
3.4.1 Correlation analysis of atmospheric particulate matter concentration with atmospheric pollutants and meteorological factors
To enhance the practical applicability of our findings, we examined the correlations between the concentrations of particulate matter, atmospheric pollutants, and meteorological factors across different seasons. Our results indicate that the concentrations of atmospheric particulate matter were positively and significantly correlated with the concentrations of atmospheric pollutants, such as SO2, NO2, CO, and O3, suggesting that an increase in these pollutants contributed to an increase in the levels of PMs. Furthermore, PMs concentrations were negatively and significantly correlated with temperature, wind speed, minimum cloud height (when the cloud cover >70%), and dew point temperature, while positively and significantly correlated with humidity and sea level pressure. Notably, certain meteorological factors exhibited seasonal variations, as summarized in Table 2.
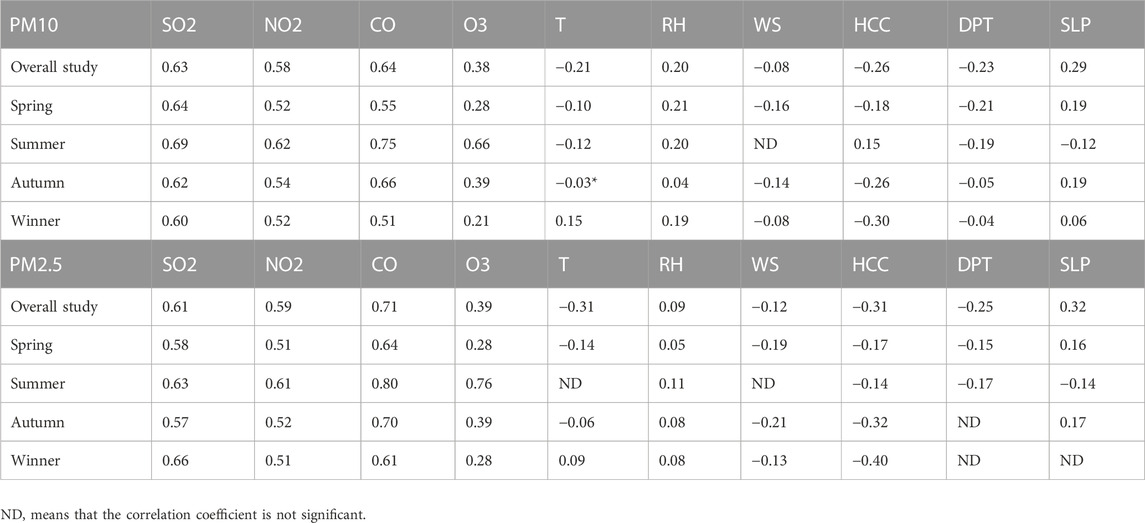
TABLE 2. Pearson correlations between the visibility and air pollutants and meteorological factors.
3.4.2 Regression equation construction of atmospheric particulate matter concentration and atmospheric visibility
Regression models were developed using the extinction coefficient (βext), dry extinction coefficient (βdryext), and concentrations of atmospheric pollutants PM10 and PM2.5, as depicted in Figure 4. The analysis reveals that both βext and βdryext exhibit a significant positive correlation with PM10 and PM2.5 concentrations, while concurrently presenting a negative correlation with atmospheric visibility. These regression models achieved statistical significance at the 0.001 level (p-value <0.001) with R-squared values of 0.500 (p-value = 0.156) and 0.393 (p-value = 0.129), respectively. In addition, these results demonstrate that the linear regression equation encompassing βext and visibility yields a higher R-squared value than the equation with dry extinction coefficient, underscoring the dominance of βext over βdryext in terms of its contribution to the model.
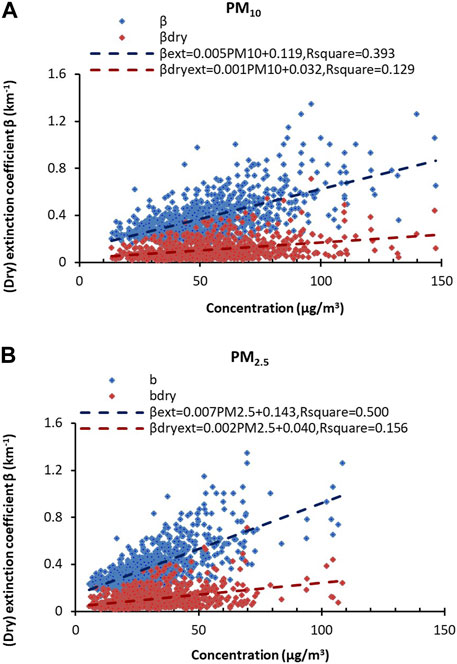
FIGURE 4. Regression model of AQI and the concentrations of air pollutants and βext and βdryext using linear regression. (A) PM2.5, (B) PM10.
3.4.3 Analysis of the relationship between atmospheric particulate matter concentration and wind direction
Figure 5 illustrates the association between PM2.5 and PM10 concentrations and wind direction during the entire monitoring period (a), as well as in different seasons, namely, spring (b), summer (c), autumn (d), and winter (e). The results uncover significant variations in PM2.5 and PM10 mass concentrations contingent on wind direction. Specifically, the influence of airflow from the due west, southeast, and northeast directions on PMs concentration is consistently positive. There is a marked difference in the effects of wind direction on PMs concentrations across different seasons, with static atmospheric conditions having a greater impact on PMs than windy conditions, irrespective of the season. It is worth noting that PM2.5 and PM10 concentrations generally change in a consistent manner.
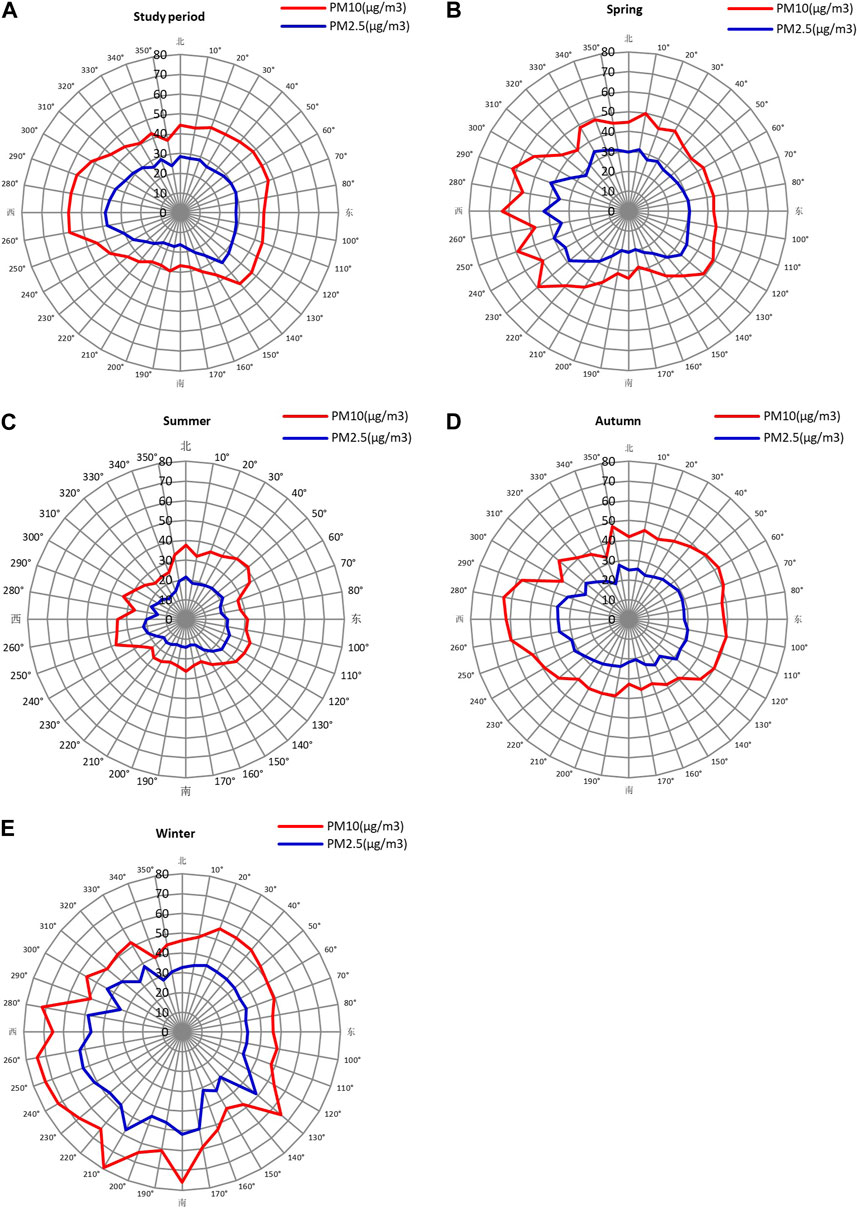
FIGURE 5. Mean mass concentrations of PM2.5 and PM10 concerning wind directions during (A) study period, (B) spring, (C) summer (D) fall, and (E) winter for calm conditions (C) and variable conditions (V). (A): PM10-51.61 (Quiet): 42.46 (Movement) and PM2.5-34.01(Quiet): 27.49(Movement). (B): PM10-54.08 (Quiet): 45.58 (Movement) and PM2.5-36.37(Quiet): 30.61(Movement). (C): PM10-32.30 (Quiet): 30.20 (Movement) and PM2.5-19.11(Quiet): 18.03(Movement). (D): PM10-53.71 (Quiet): 45.73 (Movement) and PM2.5-32.52(Quiet): 27.50(Movement). (E): PM10-60.51 (Quiet): 56.54 (Movement) and PM2.5-42.35(Quiet): 39.86(Movement).
4 Discussion
4.1 Variation pattern of atmospheric particulate matter concentration in Xiamen
This study demonstrated that Xiamen maintains a high level of air quality, characterized by an annual average temperature of 22.59°C, a relative humidity of 77.09%, and an average wind speed of 3.42 m/s during the monitoring period, which is typical of the south-central subtropical climate. Factors such as the elevated temperature and wind speed, as well as the open terrain, foster the dispersion of air pollutants. Additionally, Xiamen, as a provincial economic center dominated by tertiary industries, experiences lower emissions from agricultural and industrial pollution, thereby contributing to its overall superior air quality. The study further identifies the seasonal variation in air pollutants, including pollutants from coal-fired heating in the north traveling southward during spring and winter with the prevailing airflow (Deng et al., 2012). Straw stalk burning in the surrounding cities, compounded by the reduced adsorption capacity of plants during the dormant winter period, results in higher PMs concentration. These findings are in agreement with previous studies conducted in other cities (Natali et al., 2016; Hu et al., 2018; Wei et al., 2021; Zhang et al., 2022). Furthermore, daily variations of PM concentrations were classified based on different urbanization construction gradients, seasons, and pollution levels. The three-dimensional representation of the daily variation characteristics under different conditions provides valuable insights into the dynamics of air pollution in Xiamen. The study also ascentains a decline in PM concentration in recent years, corroborating findings from previous studies (Natali et al., 2016; Westervelt et al., 2016; Hu et al., 2018; Kota et al., 2018; Torres et al., 2018; Wei et al., 2021; Zhang et al., 2022). The variations of PM concentrations across seasons and months, which are related to the geographical location of the study site and its surrounding environment, also exhibits distinct patterns.
4.2 Impact factor analysis
4.2.1 Effect of other pollutant concentrations on atmospheric particulate matter concentrations
During the study period, a positive correlation and similar trends were identified between concentrations of PMs and other atmospheric pollutants. However, O3 concentrations differed from those of other pollutants, as O3 is produced in the atmosphere through the photodissociation of oxygen. An intriguing observation was that during the period of elevation in other pollutants, O3 concentration decreased, indicating that the rate of O3 production was surpassed by its consumption and dissipation. The O3 concentration showed lower values in January and July, while higher values were observed in April and October, thereby exhibiting an opposite trend to the NO2 concentration. This trend may be ascribed to NOX (nitrogen oxides), which is produced by the oxidation reaction of NO2, undergoing conversion to O3 via photolysis in conditions of sufficient sunlight (Yan et al., 2015; Li et al., 2017; Mou et al., 2017; Zhao et al., 2017). However, due to reduced sunlight in January and lower NOX concentration in July, O3 displays a different pattern from other pollutants. Similar patterns were also found in India (Jiang et al., 2022).
4.2.2 Influence of meteorological factors on the concentration of atmospheric particulate matter
The K-means cluster analysis categorized the various climatic syntheses into five groups. Among these groups, group 2, characterized by high temperature, low humidity, high wind speed, and low pressure, which are typical climatic conditions in Xiamen during summer afternoons, had the lowest PM concentration. This suggests that Xiamen usually experiences relatively lower atmospheric particulate matter concentrations in the summer than other seasons. This can be attributed to several factors. Firstly, better dispersion conditions prevail during summer, facilitated by strong convective air mixing, high wind speed, and fast vertical exchange. Secondly, high precipitation during this period exerts a cleaning effect on air pollutants. Lastly, the East Asian summer winds induce a certain diffusion effect on pollutants. The meteorological factors of both group 3 and group 5 are similar, with relative humidity being the significant point of divergence, underscoring the greater influence of humidity on atmospheric visibility when atmospheric pollutant concentrations and meteorological factors are similar. This is consistent with the results from previous studies (Wang et al., 2009; Wan et al., 2011; Du et al., 2013; Chai et al., 2014; Liu et al., 2017; Gaudel et al., 2018). Group 4 is characterized by low temperature, low humidity, and high air pressure, which is typical winter weather without rainfall. Group 1, on the other hand, has high humidity, low wind speed, low temperature, and high air pressure, alongside high concentrations of atmospheric pollutants. These meteorological conditions, typical of spring and winter rainy days, impede the diffusion of atmospheric particulate matter, thus promoting its accumulation. Combined with more pollution sources in winter, group 1 has the highest concentration of atmospheric particulate matter. The correlation analysis revealed significant negative correlations between PM concentration and factors such as temperature, wind speed, minimum cloud height (when cloud cover >70%), and dew point temperature. Conversely, there were significant positive correlations between PM concentration and factors like humidity and sea level pressure, which is consistent with previous studies (Qu, 2020). Some meteorological factors displayed seasonal variations. In winter, humidity averaged 71.96% ± 18.59%, wind speed was 3.53 ± 2.15 m/s, the minimum cloud height reached 841.64 ± 480.84 m, dew point temperature was 9.36°C ± 5.25°C, and sea level pressure was 1,022.11 ± 4.18hpa. Under these conditions, the change in temperature, ranging between 14.89°C ± 3.63°C, had a positive correlation with PM concentration. Conversely, in summer, under high temperature and low humidity conditions, no correlation wa observed between wind speed and PM concentration. However, the lowest cloud heights were positively correlated with PM concentration, and the sea level pressure exhibited a positive correlation with atmospheric particulate matter concentration. The correlation between PM2.5 concentration and meteorological factors showed a high consistency with that of PM10 concentration. However, in summer, PM2.5 concentration did not have a significant relationship with temperature. In autumn and winter, dew point temperature and sea level pressure, respectively, did not show significant relationships with PM2.5 concentration. These findings deviate from previous studies and may be attributed to the increased pollution sources in winter and higher rainfall in summer. These results indicate that the effects of each meteorological factor on the changes in atmospheric particulate matter concentrations fluctuates under different meteorological conditions. Different wind directions also have varying effects on PM concentration. In general, changes in PM2.5 and PM10 concentrations align, with due west, southeast, and northeast airflows intensifying PM concentration. The air quality brought about by different wind directions varies substantially across seasons, with higher PM concentrations observed under static conditions. During winter, the straw stalk burning by farm workers contributes to the accumulation of PM concentration. Furthermore, the primary industry in Zhangzhou City, located southwest of Xiamen, significantly exacerbates PM concentration brought by southwest airflow. The higher sea level pressure in winter, indicative of a lower mixed layer height, hinders pollutant dispersion, thereby leading to higher PM concentrations under windless conditions. This finding aligns with previous studies.
4.3 The effect of atmospheric particulate matter concentration on atmospheric visibility
Regression models were formulated using the extinction coefficient (βext), dry extinction coefficient (βdryext), and atmospheric pollutant concentration (PMs). The analysis revealed that the constructed models effectively represented the relationship between βext (βdryext) and PMs concentration. Previous studies have established a close relationship between atmospheric visibility and atmospheric particulate matter concentration and have utilized related approaches to assess trends of air quality after accounting for meteorological factors (Wu et al., 2012). However, studies on numerical simulation of atmospheric visibility are somewhat scarce, largely due to the lack of comprehensive observational data with both long-term and high-density coverage, required for verifying and correcting simulation results. Correspondingly, Deng et al (Deng et al., 2012; Hu et al., 2018) conducted a similar study in southeastern China in which a regression model was constructed, encapsulating the extinction coefficient and dry extinction coefficient with Air Pollution Index (API) as the analysis object on a daily basis. The contribution rate of the regression equation ranged between 0.26 and 0.43, signifying a significant influence of atmospheric pollutants on atmospheric visibility, which is consistent with the findings of the present study (Natali et al., 2016; Westervelt et al., 2016; Torres et al., 2018; Wei et al., 2021; Zhang et al., 2022).
4.4 Limitations
This research effectively investigates the variation patterns of particular matter and its relationship with meteorological factors. However, it is important to acknowledge that this study exclusively focuses on Xiamen, a coastal city in southeastern China, characterized by relatively high average wind speed and high annual humidity. Consequently, the findings may not be fully representative of inland cities or cities experiencing rapid industrialization with manufacturing or mining industries, which have the potential to significantly impact air quality and elevate particulate matter levels. Furthermore, the study’s time period begins in 2014, thus limiting the examination of meteorological and atmospheric patterns prior to that year. Considering the historic significance of understanding changing patterns over a wider time range, the absence of pre-2014 data may restrict the comprehensive analysis of long-term trends.
5 Conclusion
Urbanization often brings about air pollution, a problem that is particularly noticeable in coastal tourist cities such as Xiamen and requires concerted attention. In this study, the annual average concentrations of AQI, PM10, SO2, NO2, CO, and O3 in Xiamen were found to fall within the environmental quality level 1 standard, with corresponding values of 47, 48.92 μg/m3, 11.12 μg/m3, 29.27 μg/m3, 0.61 mg/m3, and 51.78 μg/m3. However, the concentration of PM2.5 (28.94 μg/m3) slightly exceeded the primary standard (25 μg/m3), indicating a relatively high level of air quality in Xiamen. Our findings also revealed that the lowest and highest values of atmospheric particulate matter concentrations typically occurred in summer and winter, with the highest daily values seen late at night and early morning, and the lowest around noon. Moreover, the trends of daily changes differed significantly between seasons, weather conditions, and town gradients.
Future research on urban air pollutants could extend over longer time durations (e.g., 10–15 years), and a broader range of air pollutant indicators for in-depth analysis. Incorporate aspects of human comfort into the study could also provide valuable insights for creating a more livable and harmonious urban environment.
Data availability statement
The original contributions presented in the study are included in the article/supplementary material, further inquiries can be directed to the corresponding author.
Author contributions
JL and JD provided the research idea and purpose of this study; JL, YL, and SL designed the research; JL and YL collected and analyzed the data; JL wrote the paper; SL supervised, corrected, and revised the paper; JD corrected the article language and made some suggestions. All authors contributed to the article and approved the submitted version.
Conflict of interest
The authors declare that the research was conducted in the absence of any commercial or financial relationships that could be construed as a potential conflict of interest.
Publisher’s note
All claims expressed in this article are solely those of the authors and do not necessarily represent those of their affiliated organizations, or those of the publisher, the editors and the reviewers. Any product that may be evaluated in this article, or claim that may be made by its manufacturer, is not guaranteed or endorsed by the publisher.
References
Chai, F., Gao, J., Chen, Z., Wang, S., Zhang, Y., Zhang, J., et al. (2014). Spatial and temporal variation of par-ticulate matter and gaseous pollutants in 26 cities in China. J. Environ. Sci. 26, 75–82. doi:10.1016/s1001-0742(13)60383-6
Deng, J., Du, K., Wang, K., Yuan, C. S., and Zhao, J. (2012). Long-term atmospheric visibility trend in Southeast China, 1973-2010. Atmos. Environ. 59, 11–21. doi:10.1016/j.atmosenv.2012.05.023
Doyle, M., and Dorling, S. (2002). Visibility trends in the UK 1950–1997. Environ 36, 3161–3172. doi:10.1016/s1352-2310(02)00248-0
Du, K., Mu, C., Deng, J., and Yuan, F. (2013). Study on atmospheric visibility variations and the impacts of meteorological pa-rameters using high temporal resolution data: An application of environmental internet of things in China. Int. J. Sustain. Dev. World Ecol. 20, 238–247. doi:10.1080/13504509.2013.783886
Gaudel, A., Cooper, O., Ancellet, G., Barret, B., Boynard, A., Burrows, J., et al. (2018). Tropospheric Ozone Assessment Report: Present-day distribution and trends of tropospheric ozone relevant to climate and global atmospheric chemistry model evaluation. Elem. Sci. Anth 6, 1–58. doi:10.1525/elementa.291
Hu, J., Huang, L., Li, J., Ying, Q., Zhang, H., Liu, X., et al. (2018). Sources of particulate matter in China: Insights from source apportionment studies published in 1987–2017. Environ. Int. 115, 343–357. doi:10.1016/j.envint.2018.03.037
Husar, R. B., and Holloway, J. M. (1984). “The properties and climate of atmospheric haze,” in Hy-groscopic aerosols. Editors L. H. Ruhnke, and A. Deepak (Hampton, Va: Deepak Publ.), 129.
Jiang, Y., Wang, S., Jia, X., Zhao, B., Li, S., Chang, X., et al. (2022). Ambient fine particulate matter and ozone pollution in China: Synergy in anthropogenic emissions and atmospheric processes. Environ. Re-search Lett. 17 (12), 123001. doi:10.1088/1748-9326/ACA16A
Kota, S., Guo, H., Myllyvirta, L., Hu, J., Sahu, S., Garaga, R., et al. (2018). Year-long simula-tion of gaseous and particulate air pollutants in India. Atmos. Environ. 180, 244–255. doi:10.1016/j.atmosenv.2018.03.003
Li, G., Bei, N., Cao, J., Wu, J., Long, X., Feng, T., et al. (2017). Widespread and persistent ozone pollu-tion in eastern China during the non-winter season of 2015: Observations and source attributions. Atmos. Chem. Phys. 17, 2759–2774. doi:10.5194/acp-17-2759-2017
Li, L., Song, M., Zhou, J., Sun, X., and Yuan, L. (2022). Ambient particulate matter exposure causes visual dysfunction and retinal neuronal degeneration. Ecotoxicol. Environ. Saf. 247, 114231. doi:10.1016/J.ECOENV.2022.114231
Li, T. C., Chen, W. H., Yuan, C. S., Wu, S. P., and Wang, X. H. (2013). Physicochemical characteristics and source apportionment of atmos-pheric aerosol particles in kinmen-xiamen airshed. Aerosol Air Qual. Res. 13, 308–323. doi:10.4209/aaqr.2011.11.0203
Liu, B., Yang, J., Yuan, J., Wang, J., Dai, Q., Li, T., et al. (2017). Source apportionment of atmos-pheric pollutants based on the online data by using PMF and ME2 models at a megacity, China. Atmos. Res. 185, 22–31. doi:10.1016/j.atmosres.2016.10.023
Ministry of Environmental Protection (2012). China’s ministry of environmental protection. Beijing: State General Administration of Quality Supervision, Inspection and Quaran-tine.
Mohammed, M. O. A., Song, W., Ma, W. L., Li, W. L., Li, Y. F., Khan, A. U., et al. (2016). Potential toxicological and cardiopulmonary effects of PM2.5 exposure and related mortality: Findings of recent studies published during 2003-2013. Biomed. Environ. Sci. 29 (1), 66–79. doi:10.3967/bes2016.007
Mou, B., He, B., Zhao, D., and Chau, K. (2017). Numerical simulation of the effects of building dimensional variation on wind pressure distribution. Eng. Appl. Comput. Fluid Mech. 11, 293–309. doi:10.1080/19942060.2017.1281845
Natali, M., Zanella, A., Rankovic, A., Banas, D., Cantaluppi, C., Abbadie, L., et al. (2016). Assessment of trace metal air pollution in Paris using slurry-TXRF analysis on cemetery mosses. Environ. Sci. Pollut. Res. 23 (23), 23496–23510. doi:10.1007/s11356-016-7445-z
Qi, J., Ding, L., and Lim, R. (2022b). A decision-making framework to support urban heat mitigation by local governments. Resour. Conservation Recycl. 184, 106420. doi:10.1016/j.resconrec.2022.106420
Qi, J., Ding, L., and Lim, S. (2023). Application of a decision-making framework for multi-objective optimisation of urban heat mitigation strategies. Urban Clim. 47 (2023), 101372. doi:10.1016/j.uclim.2022.101372
Qi, J., Yok Tan, P., Chun Man Ho, R., Sia, A., and Olszewska-Guizzo, A. (2022a). Development and application of 3D spatial metrics using point clouds for landscape visual quality assessment. Landsc. Urban Plan. 228 (2022), 104585. doi:10.1016/j.landurbplan.2022.104585
Qu, F. (2020). Deposition in bronchial epithelium on fine particulate matter induced extracellular matrix obstructive pulmonary disease and IL37 effect and mechanism effects of air pollutants on hospitalization of chronic. PhD Thesis. Hebei: Hebei Medical University.
Sloane, C. S. (1982). Visibility trends—I. Methods of analysis. Environ 16, 41–51. doi:10.1016/0004-6981(82)90312-2
Song, Y., Wan, X. M., Bai, S. X., Guo, D., Ren, C., Zeng, Y., et al. (2017). The characteristics of air pollutants during two distinct episodes of fireworks burning in a valley city of north China. PLoS One 12, e0168297. doi:10.1371/journal.pone.0168297
Sundram, T., Lim, H., Farahnaz, A., Ahmad, B. N., Tan, P., Tan, C., et al. (2022). Effects of ambient particulate matter (PM2.5) exposure on calorie intake and appetite of outdoor workers. Nutrients 14 (22), 4858. doi:10.3390/NU14224858
Ting, F., Chen, T., Li, M., Chi, J., Tang, H., Zhang, T., et al. (2022). Discrimination of the pollution grade of metal elements in atmospherically deposited particulate matter via laser-induced breakdown spec-troscopy combined with machine learning method. Chemom. Intelligent Laboratory Syst. 231, 104691. doi:10.1016/J.CHEMOLAB.2022.104691
Torres, P., Ferreira, J., Monteiro, A., Costa, S., Pereira, M., Madureira, J., et al. (2018). Air pollution: A public health approach for Portugal. Sci. Total Environ. 643, 1041–1053. doi:10.1016/j.scitotenv.2018.06.281
Wan, J. M., Lin, M., Chan, C. Y., Zhang, Z. S., Engling, G., Wang, X. M., et al. (2011). Change of air quality and its impact on atmospheric visibility in central-western Pearl River Delta. Environ. Monit. Assess. 172, 339–351. doi:10.1007/s10661-010-1338-2
Wang, J., Zhang, Y. F., Feng, Y. C., Zheng, X. J., Jiao, L., Hong, S. M., et al. (2016). Characterization and source apportionment of aerosol light ex-tinction with a coupled model of CMB-IMPROVE in Hangzhou, Yangtze River Delta of China. Atmos. Res. 178, 570–579. doi:10.1016/j.atmosres.2016.05.009
Wang, K., Dickinson, R. E., and Liang, S. (2009). Clear sky visibility has decreased over land globally from 1973 to 2007. Science 323, 1468–1470. doi:10.1126/science.1167549
Wang, M., Liu, M., Zhang, D., Qi, J., Fu, W., Zhang, Y., et al. (2023). Assessing and optimizing the hydrological performance of Grey-Green infrastructure systems in response to climate change and non-stationary time series. Water Res. 232, 119720. doi:10.1016/j.watres.2023.119720
Wei, G., Zhang, Z., Ouyang, X., Shen, Y., Jiang, S., Liu, B., et al. (2021). Delineating the spatial-temporal variation of air pollution with urbanization in the Belt and Road Initiative area. Environ. Impact Assess. Rev. 91, 106646. doi:10.1016/j.eiar.2021.106646
Westervelt, D. M., Horowitz, L. W., Naik, V., Tai, A. P. K., Fiore, A. M., and Mauzerall, D. L. (2016). Quantifying PM2.5 meteorology sensi-tivities in a global climate model. Atmos. Environ. 142, 43–56. doi:10.1016/j.atmosenv.2016.07.040
Wu, J., Fu, C., Zhang, L., and Tang, J. (2012). Trends of visibility on sunny days in China in the recent 50 years. Atmos. Environ. 55, 339–346. doi:10.1016/j.atmosenv.2012.03.037
Xiao, J., Du, G., Shi, Y., Wen, Y., Yao, J., Gao, Y., et al. (2016). Spatiotemporal distribution pattern of ambient air pollution and its correlation with meteorological factors in Xiamen City. Acta Sci. Circumstanti-ae 36 (09), 3363–3371. doi:10.13671/j.hjkxxb.2016.0105
Xue, D., Li, C., and Liu, Q. (2015). Visibility characteristics and the impacts of air pollutants and meteorological conditions over Shanghai, China. Environ. Monit. Assess. 187, 363. doi:10.1007/s10661-015-4581-8
Yan, J., Chen, L., Lin, Q., Li, Z., Chen, H., and Zhao, S. (2015). Chemical characteristics of submicron aerosol particles during a long-lasting haze episode in Xiamen, China. Atmos. Environ. 113, 118–126. doi:10.1016/j.atmosenv.2015.05.003
Zhang, D., Zhou, C., and He, B. J. (2022b). Spatial and temporal heterogeneity of urban land area and PM2. 5 concentration in China. Urban Clim. 45, 101268. doi:10.1016/j.uclim.2022.101268
Zhang, J., Zhu, M., Yu, M., Wang, K., and Zhang, R. (2022a). Evaluation of multiple air pollutant emission reductions in northern China district via resource sharing. J. Clean. Product. 379, 134743. doi:10.1016/j.jclepro.2022.134743
Zhao, S., Chen, L., Yan, J., and Chen, H. (2017). Characterization of lead-containing aerosol particles in Xiamen during and after Spring Festival by single-particle aerosol mass spectrometry. Sci. Total Environ. 580, 1257–1267. doi:10.1016/j.scitotenv.2016.12.086
Zhou, X. H., Cao, Z. Y., Ma, Y. J., Wang, L. P., Wu, R. D., and Wang, W. (2016). Concentrations, correlations and chemical species of PM2.5/PM10 based on published data in China: Potential implications for the revised particulate standard. Chemosphere 144, 518–526. doi:10.1016/j.chemosphere.2015.09.003
Keywords: air quality, air pollution, meteorological conditions, K-mean cluster, meteorological factors
Citation: Lin J, Lin Y, Lin S and Dong J (2023) The characteristic of atmospheric particulate matter and the influence factors in Xiamen for air quality management. Front. Environ. Sci. 11:1220720. doi: 10.3389/fenvs.2023.1220720
Received: 11 May 2023; Accepted: 03 July 2023;
Published: 21 July 2023.
Edited by:
Liubin Huang, Shandong University, ChinaReviewed by:
Bao-Jie He, Chongqing University, ChinaYang Zhang, Shanghai Maritime University, China
Xinna Zhang, Beijing Forestry University, China
Copyright © 2023 Lin, Lin, Lin and Dong. This is an open-access article distributed under the terms of the Creative Commons Attribution License (CC BY). The use, distribution or reproduction in other forums is permitted, provided the original author(s) and the copyright owner(s) are credited and that the original publication in this journal is cited, in accordance with accepted academic practice. No use, distribution or reproduction is permitted which does not comply with these terms.
*Correspondence: Jiaying Dong, jiayind@clemson.edu