Changes in the water retention of mountainous landscapes since the 1820s in the Austrian Alps
 Gabriel Stecher
 Severin Hohensinner
 Mathew Herrnegger1†
- 1Institute of Hydrology and Water Management, University of Natural Resources and Life Sciences, Vienna, Austria
- 2Institute of Hydrobiology and Aquatic Ecosystem Management, University of Natural Resources and Life Sciences, Vienna, Austria
Interactions of humans with the environment are strongly related to land use and land cover changes (LULCCs). In the last decades, these changes have led to a degradation of ecosystem services, including water regulation and flood control. In the Alpine areas of Austria, land cover changes have increased flood risk since the middle of the 19th century. In this paper, we assess the influence of these long-term land use changes on the landscape’s ability to retain water using the qualitative Water Retention Index (WRI). The changes are thereby evaluated on the basis of the historical (1826–1859) and present (2016) land cover situation, which is to our knowledge the first high-resolution and regional application of the WRI. The results show that the water retention potential mimics the mountainous characteristic and features. Except for areas strongly dominated by settlement areas, the highest retention potentials are found in valley floors and the lowest values are depicted along the main Alpine complex. In low-lying areas, the retention decreased by over 10%. It was found that this decrease can be mostly attributed to settlement expansion. Above 1,250 m, land use transformations led to slightly increasing water retention values owing to the transformation of wasteland or glaciers to stagnant waters and to the expansion of forest and grassland in high elevations. This examination allows for a holistic and spatially distributed LULCC impact assessment on the landscape’s water regulation capacities and offers valuable high-resolution information for future land use planning and sustainable land development.
1 Introduction
Anthropogenic interactions with the environment through land use and land cover change (LULCC) are strongly connected to ecosystem functions and the provision of ecosystem services (ESS) (Hasan et al., 2020). Ecosystem services benefit society and are obtained either directly or indirectly from ecosystems (e.g., Gómez-Baggethun & Barton, 2013; Silvestri et al., 2013). These benefits comprise a variety of services and can be categorized into four types including, (i) supporting services (e.g., soil formation, nutrient supply), (ii) provisioning services (e.g., raw materials, water, food), (iii) regulating services (e.g., climate regulation, water purification), and (iv) cultural services (e.g., ecotourism, recreational uses) (MEA, 2005; Hasan et al., 2020). Multiple authors reported a decline of ESSs due to LULCC (e.g., Haines-Young et al., 2012; Kindu et al., 2016; Rai et al., 2018), while long-term LULCC (1960–2019) are four times greater than estimated before and affect almost one-third of the global land area (Winkler et al., 2021). LULCC negatively affect hydrological provisioning and regulating ecosystem services as well as the supporting services of natural flows to sustain ecosystems (Jin et al., 2015) and also leads to the alterations of hydrological processes and their functions (Maitima et al., 2009; Guzha et al., 2018). The dependence of hydrological ecosystem services on specific land uses subsequently leads to effects on regulating services such as water conservation, water availability, and flood control due to LULCC (Hasan et al., 2020).
Land use changes, such as deforestation, urbanization, and wetland drainage, as well as agricultural utilization of land, affect various hydrological processes including evapotranspiration, infiltration, and surface and subsurface water storage (e.g., Andréassian, 2004; Oudin et al., 2008; Hall et al., 2014; Wesemann et al., 2018). LULCC and associated agriculturally modified hillslopes can influence flow paths, flow velocity, water storage, and concentration times. Vertical soil infiltration and water retention can also be reduced due to the intensification of agricultural practices (Rogger et al., 2017). Similarly, numerical simulations showed that flood peaks in small headwater catchments can increase by up to 75% due to the construction of forest roads (Wesemann, 2021; Herrnegger et al., 2022). These examples show that human landscape interventions and intensification in land use can adversely affect regulating ecosystem services such as water retention. LULCCs also influence flood generation processes by altering the infiltration capacity of the landscape (Hall et al., 2014). Among climate change and river channelization, land use change is therefore another potential main driver of flood regime changes (Merz et al., 2012). However, the impact on flood regimes is stronger in smaller headwater catchments (e.g., Wesemann, 2021). In larger catchments, other factors such as river straightening, loss of floodplains, and changes in atmospheric conditions, such as changes in regional precipitation based on different atmospheric circulation patterns, are more dominant (Viglione et al., 2016). If managed properly, LULCC can be beneficial for water regulation in urban areas but also in upstream runoff-generating areas (Vandecasteele et al., 2017). Thus, flood risk management plans might also include the encouragement of sustainable land use as well as the improvement of water retention and the controlled flooding of certain areas in case of a flood event as defined in the EU Floods Directive 2007/60/EC (EU, 2007). The integrated flood risk management (IFRM) approach thus aims to reduce the severity and vulnerability to flooding based on a portfolio of approaches that include structural and non-structural measures (Van Herk et al., 2015).
In the Alpine areas of Austria, LULCC has increased flood risk since the mid-19th century, especially in valley corridors as shown by Hohensinner et al. (2021). In their study, digitalized historical maps from 1826 to 1859 were compiled and compared with a detailed land cover dataset approximating the land cover of 2016. During this period, arable land was reduced by 69%, forests increased by 23%, and various agricultural areas declined by 27%. At the same time, settlement areas have expanded by over 6 times (Hohensinner et al., 2021). The expansion of settlements in flood-prone areas by 28% has resulted in increased flood damage potential (Junger et al., 2022). Although agricultural areas have declined since the mid-19th century, over 12% of highly valuable agricultural areas are currently located in flood-prone areas (Junger et al., 2022). In mountainous areas, where areas for agriculture are topographically limited, over 30% of agricultural land important for food security is located in flood-risk areas (Grüneis et al., 2021). At the same time, the construction of hydropower reservoirs in Alpine valleys since the middle of the 20th century led to large flood retention potentials and to a strong decrease of flood peaks and flood risk (Stecher & Herrnegger, 2022).
Currently, 41 km2 of productive soils are commanded for land development in Austria annually. Thereof 15–21 km2 are permanently sealed and their associated ESS, including water retention, are eternally lost (UBA, 2022). The Austrian government, therefore, aims to reduce land consumption to 9 km2 annually by 2030 (Gov., 2020). Future land use changes (2030) might increase flood-affected residential areas by 159% in an Austrian Alpine valley (Cammerer et al., 2013). At the same time, flood risk could be reduced by the introduction of non-structural flood protection measures. The enhancement of private precaution and stricter land use regulations reduces flood risk by approximately 30%. Regardless of future changes in flood risk due to climate and land use change, non-structural measures always reduce flood risk (Thieken et al., 2016). In Austria, flood policies should prefer non-structural measures, flood retention, and natural retention over structural measures (linear structures, technical/controlled retention) (BMLFUW, 2015; Nordbeck et al., 2019; Nordbeck et al., 2023). Therefore, land use and land development management are crucial tools for maintaining hydrological ecosystem services including water retention and flood control.
Grüneis et al. (2021), Hohensinner et al. (2021), and Junger et al. (2022) investigated flood risk changes due to LULCC, thereby analyzing flood exposure focusing on Alpine valley corridors. In contrast, the present contribution examines how LULCCs since the mid-19th century (Hohensinner et al., 2021) have affected the hydrological ecosystem services of water regulation and flood control based on the Water Retention Index (WRI). The qualitative Water Retention Index was developed by Vandecasteele et al. (2017) to assess the water regulation of landscapes on a European scale. Here, we apply the index on a regional scale to assess the impact of LULCC on the ecosystem services of water retention and flood control. The objectives of this study are i) the application of the WRI for a spatially high-resolution regional evaluation of the landscape’s water retention potential, ii) to derive spatially distributed water retention index (WRI) maps for the present and past land cover situation and iii) to quantify the water retention changes for individual land use transformations but also elevation bands.
The findings complement the studies on flood risk in the Alpine regions and additionally quantify the effect of LULCC on water retention. These results might assist policymakers responsible for land management and spatial planning who are also concerned with integrated flood risk management.
2 Materials and methods
The study area is 19,307 km2 large and covers the Austrian catchments of the rivers Rhine (provincial state Vorarlberg), Salzach (Salzburg), and Drava (Carinthia and Eastern Tyrol). The extent of the study area is determined by the data availability of the land cover dataset provided by Hohensinner et al. (2021). The land cover datasets of the past (1826–1859) and present (2016) are shown in the Supplementary Appendix Figure SA1. The altitude ranges from 338 to 3,798 m.a.s.l. and the topography is largely dominated by the Alpine main ridge. The study area is strongly characterized by high mountain ranges, steep slopes, and glacially formed valleys. Towards the southeast, it also includes parts of the Alpine forelands (Figure 1). Thus, space for land development is restricted by these natural features and only approximately 21% of the area of the Austrian Alps is suitable for permanent settlements (Alpine Convention, 2015; Löschner et al., 2017).

FIGURE 1. Location of the study area covering the provincial states of Vorarlberg (Rhine catchment), Salzburg (Salzach) and Eastern Tyrol/Carinthia (Drava) in the context of Austria.
To determine how LULCC from the mid-19th century to the present affected the natural water retention of the alpine landscape of Austria, the Water Retention Index (WRI) is calculated based on the historical and current land use and land cover. The WRI is a qualitative composite indicator showing the relative water retention potential on a scale from 0 to 10 (Vandecasteele et al., 2017). The index can be used to represent the landscape’s ability to regulate water, thereby reducing the risk of floods and also droughts. The WRI aims to represent the physical processes of interception, infiltration, and retention in soil, percolation to groundwater and water storage in surface water bodies by using proxy datasets. Water retention is also influenced by the slope angle and sealed surface areas of the landscape. Therefore, these parameters are also considered in the calculation of the WRI (Vandecasteele et al., 2017).
In the current study, the WRI was derived at a resolution of 100*100 m to capture the heterogeneity of the Alpine topography and was calculated as a weighted average (with the weights
Figure 2 shows the schematic workflow of the computation and analysis of the WRI for the present study. The input parameters represented by proxy datasets used to characterize the factors influencing the water retention capacity are given at the top of Figure 2. Compared to the study of Vandecasteele et al. (2017), the input parameters were derived from different data sources, because they were either released only recently or are available only on the regional Austrian level. The input layers represent similar proxy data, mostly at a higher spatial resolution.
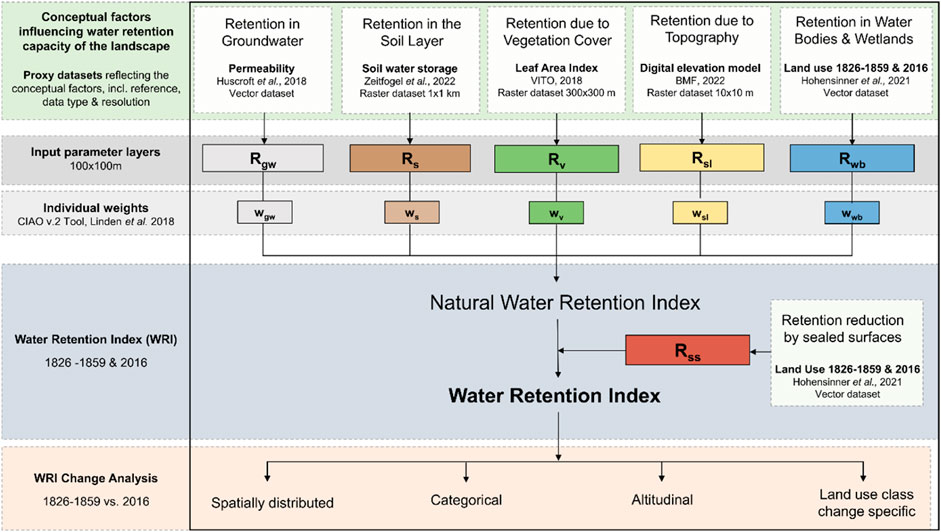
FIGURE 2. Schematic workflow diagram of the calculation and analysis of the Water Retention Index adjusted from Vandecasteele et al. (2017) and extended for the present study.
The input parameter Rgw represents groundwater storage and was derived from the GLHYMPS 2.0 dataset (Huscroft et al., 2018). This dataset represents global permeability data of the unconsolidated and consolidated Earth in a vector format. Permeability represents the ability of porous media to transmit fluids and is therefore a suitable parameter to derive the potential of infiltration and percolation to groundwater. The soil storage component (Rs) represents the infiltration and retention capacity in the soil matrix. This parameter is derived from a soil water storage dataset, which was estimated using a spatial predicting XGBoost model for Austria at a 1*1 km2 grid (Zeitfogel et al., 2022). The potential retention in vegetation is represented by the input parameter Rv. Following Vandecasteele et al. (2017), it is assumed that the capacity of vegetation to intercept water is linearly related to the Leaf Area Index (LAI). Therefore, the globally available Copernicus Global Land Service LAI dataset (VITO, 2018) was used to calculate the average LAI per land cover class and catchments of the LamaH dataset (Klingler et al., 2021) for the period 2014 to 2020. The input parameter Rsl describes the slope of the landscape and is derived from an Austrian digital elevation model, which is available at a 10*10 m resolution at https://www.data.gv.at/ (BMF, 2022). Rsl is assumed to have a negative linear relationship with water retention (Vandecasteele et al., 2017). The input parameter Rwb represents the retention in water bodies and is calculated as the areal share of water bodies within each spatial unit of 100*100 m. In contrast to Vandecasteele et al.(2017), we did not only consider surface water bodies but also wetlands in this input parameter, assuming a similar retention behavior of wetlands and surface water bodies on the water retention capacity. The input parameter Rss represents the share of settlement area per spatial unit (100*100 m). Rwb and Rss are derived from the high-resolution land use and land cover dataset provided by Hohensinner et al. (2021). A summary of all original data obtained to derive the 6 input parameters is given in the Supplementary Appendix Table SA1. All input parameter datasets were rescaled or converted to a consistent raster with a resolution of 100*100 m. Except for the parameter of sealed surface (Rss), all parameters were rescaled from 0 to 10 using a linear function. The minimum and maximum values for the linear function are represented by the minimum and maximum values of each original input layer. This assures a uniform scale for all input parameters. In order to assign steep slopes with low and flat areas with high values, the slope parameter Rsl was inversely rescaled.
For the calculation of the historical Water Retention Index (WRIhis) the input parameters Rv, Rwb, and Rss had to be adjusted with respect to the historical land cover dataset. The input parameters Rss and Rwb were derived from the historical land cover dataset. The vegetation parameter Rv representing the historical land cover state was estimated by transferring the average Rv values per land cover class and catchment of the current state onto the historical land cover classes in each catchment. This approach considers the spatial characteristics, dependencies, and shifts of land use and land cover (LULC) transformation within each catchment. The parameters Rgw, Rs, and Rsl and their impact on water retention were assumed to be constant over time.
The next step consists of the aggregation of the composite indicator by assigning individual weights to each input parameter, except for Rss (see Eq. 1). The soil sealing parameter is considered a multiplying factor, which linearly affects the WRI. The applied weights reflect the importance of each input parameter with regard to the composite indicator. The importance of each parameter is often a source of contention and can significantly influence the composite indicator (OECD, 2008). Therefore, we used the same methodological approach as Vandecasteele et al. (2017). This method uses a weight optimization approach which is based on the calculation of the first-order sensitivity index Si (Sobol, 1993) for each input parameter with respect to the overall indicator (WRI). It incorporates penalized splines as a method of nonlinear regression (Paruolo et al., 2013) and an adopted optimization scheme developed by Becker et al. (2017). The general objective of the optimization is that each input parameter contributes equally to the (spatial) variance of the composite indicator.
The optimization of the individual weights was carried out using the Composite Indicator Analysis and Optimization (CIAO) Tool v.2 (Lindén et al., 2021), which incorporates the optimization procedure as described above. Due to the computationally intensive approach, all input parameters were aggregated to the LamaH catchment level (Klingler et al., 2021) and are listed in the (Supplementary Appendix Table SA2). This decreased the input data drastically from 1.9 million pixels to 201 catchment values. The optimization process was started by assigning equal weights to all input parameters and with the condition that the sum of all weights must be one. Using these weights, the associated normalized Si values were unsatisfying and showed large differences between the input parameters. The parameters Rv and Rgw exhibited strong nonlinearities (Supplementary Appendix Figure SA2). After running the optimization routine, the normalized sensitivity indices of all input parameters showed equal values. The algorithm searched for the individual weights of each parameter to diminish the differences between the Si values between all parameters. This means that the individual contribution to the (spatial) variance of the overall composite indicator was equally distributed between all input parameters. The optimized Si values and the associated weights are listed in Table 1. These weights were subsequently used for the calculation of the WRI of both periods.
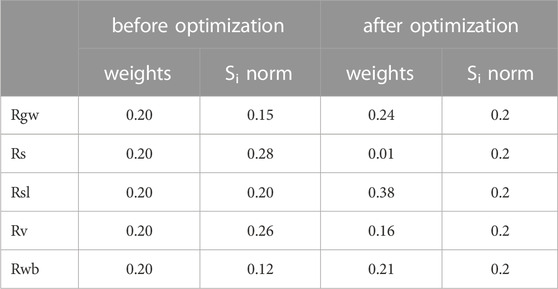
TABLE 1. Weights and sensitivity indices (Si) before and after the optimization for the individual layer of the WRI Rgw (groundwater storage), Rs (soil water storage), Rv (Interception), Rwb (share of water bodies), Rsl (slope), Rss (share of sealed surface).
3 Results
3.1 Input parameter layers
The resulting input parameter layers for the calculation of the current Water Retention Index (WRIcur) are plotted in Figure 3. The high resolution of all input parameters revealed a spatial pattern following the topographic features. Large valleys and high mountain ranges can be strongly recognized in several parameters, including Rgw, Rs, and Rv. The parameter Rs revealed that areas with sealed surfaces occur mostly on valley floors. All input parameters for the calculation of the WRIhis are represented in the Supplementary Appendix Figure SA1.
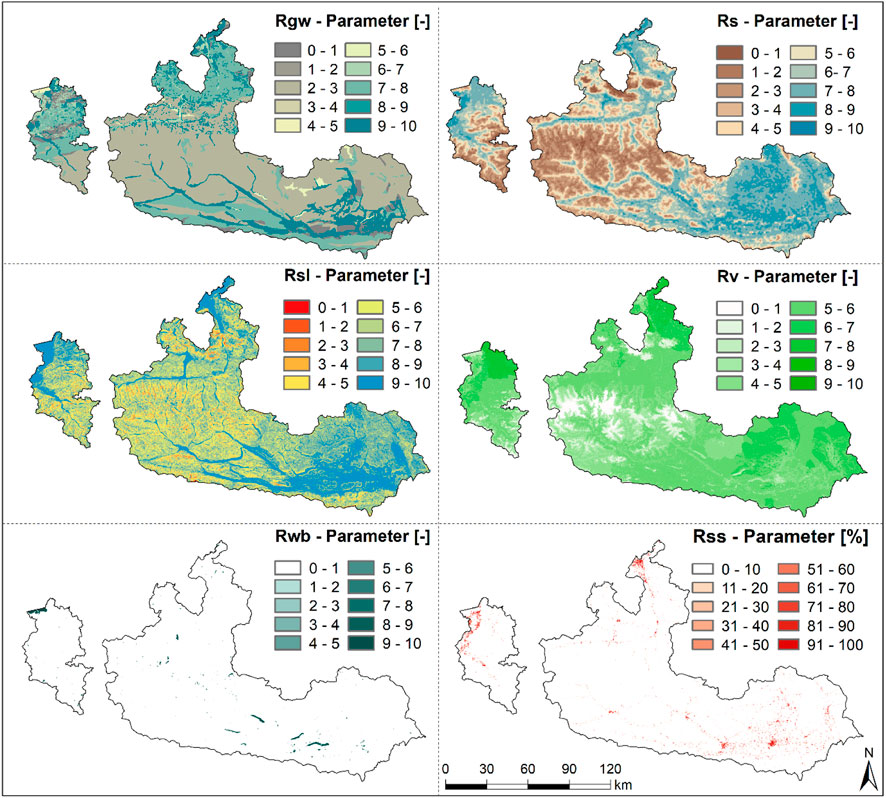
FIGURE 3. Overview WRI input parameters layers for 2016; Rgw (groundwater storage), Rs (soil water storage), Rv (Interception), Rwb (share of water bodies), Rsl (slope), Rss (share of sealed surface).
3.2 Spatial distributed WRI characteristics
In Figure 4, the current WRI (2016) and the historical WRI (1826–1859) are plotted in the top and middle panels, respectively. The difference in WRI between the current and historical state is shown in the bottom panels. The numbers on each map indicate different regions of the study area. Vorarlberg (1) includes the area of the Austrian Rhine catchment. Two and three represent the Upper and Lower Salzach catchments, respectively, and thus compose the Austrian Salzach catchment. Eastern Tyrol (4) is in the upper part of the Drava catchment and together with the Upper (5) and Lower Drava (6) regions defines the Drava catchment.
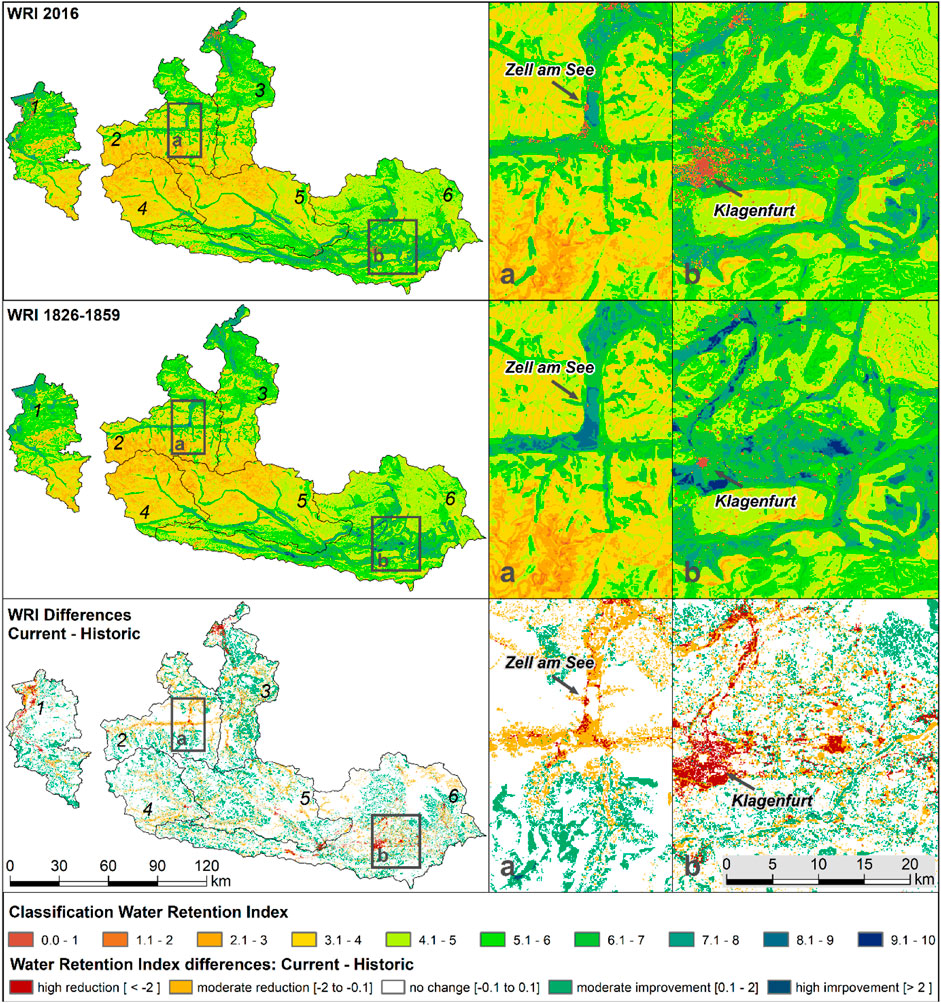
FIGURE 4. On the left side the resulting current WRI (top), historical WRI (middle), and the differences between the current and historical WRI (bottom) are shown. On the right-hand side, panels a) show the Salzach Valley with Zell am See and panels b) show the area around the city of Klagenfurt in detail for all three representations.
The WRI shows a comparable and distinct spatial pattern for both calculated time periods. In general, values are higher in valley floors and rather flat areas, such as in the Rhine Valley, along the Drava River, or in the eastern part of the analyzed area, compared to areas characterized by steep topography and Alpine features. This is the result of the combination of low vegetation cover, shallow soil water storage, and low permeability in mountainous areas, e.g., along the main Alpine complex. This shows that water retention is more pronounced in valley areas than in steep headwater catchments. The results also indicate that the general spatial WRI patterns did not change significantly due to LULCC but are strongly influenced by the topographic features.
The WRI difference plot, shown in the bottom panel of Figure 4, however, depicts a moderate (−0.1 to −2) to high (<−2) reduction of the retention potential, especially in the Alpine valleys at low elevations and along watercourses. This can largely be explained by the expansion and development of settlement areas. In addition, the loss of river landscapes, the draining of wetlands, and the clearing of forested areas at lower elevations reduced water retention. River channelization, which can significantly limit the retention effect of rivers and their formerly available fluvial corridors also adversely affected the regulation potential. In contrast, there are large areas that showed a moderate increase (0.1–2) in the WRI. These are attributed to the increase in forest and to the transformation of wasteland to grassland in these areas. In addition, new artificial water areas have been added due to the construction of Alpine storage reservoirs, which positively affect the retention potential.
The areas of the Salzach Valley (panel a) and Klagenfurt area (panel b) illustrate the current and historical WRI values exemplary for a more rural (a) and urban (b) land development setting. The bottom panel a) shows that water retention has decreased in large parts of the Salzach Valley. Moderate reduction rates (−0.1 to −2) were observed in most parts, but some areas also showed strong WRI reductions (≤−2), due to increased settlement density. At the same time, it can be seen that the retention potential moderately improved (>0.1–2) along the valley flanks at higher altitudes. In panel b) a strong reduction of the retention potential was detected due to the expansion of built-up surfaces in the Klagenfurt area. Areas with very high WRI values in the north of Klagenfurt transformed into areas with significantly less retention potential. Similar developments can also be seen in the east of Klagenfurt. The WRI change characteristics between the historical and current state for these two examples are somewhat representative of other regions in the study area. High WRI reductions due to intense settlement development are also visible in the Rhine Valley in Vorarlberg or around the city of Salzburg in the North. Moderate reductions are depicted in almost all valley floors due to river channelization, loss of wetlands, or the reduction of forest cover.
3.3 Aggregated WRI results
For further analysis, the continuous WRI values were aggregated into 5 categories, namely, very low (0–2), low (2–4), moderate (4–6), high (6–8), and very high (8–10). This allows for categorical analysis of the WRI changes. In Table 2, the relative changes between 1826–1859 and 2016 are shown for each region of the study area. The table reveals that large areas of each region did not show any class changes (highlighted in grey). The sum of the constant areas per region (highlighted in blue) ranged from 97.2% in Eastern Tyrol to 92.5% in the Lower Salzach region, respectively. This indicates that regions with lower changes in WRI exhibited lower land development compared to other regions. Overall, these results suggest that only minor areas show class changes. The total relative sum of negative and positive areas, in which class shifts occurred are highlighted with orange (−) and green (+) colors, respectively. Generally, the negative effects on the WRI based on LULCC exceed the positive impacts in all regions.
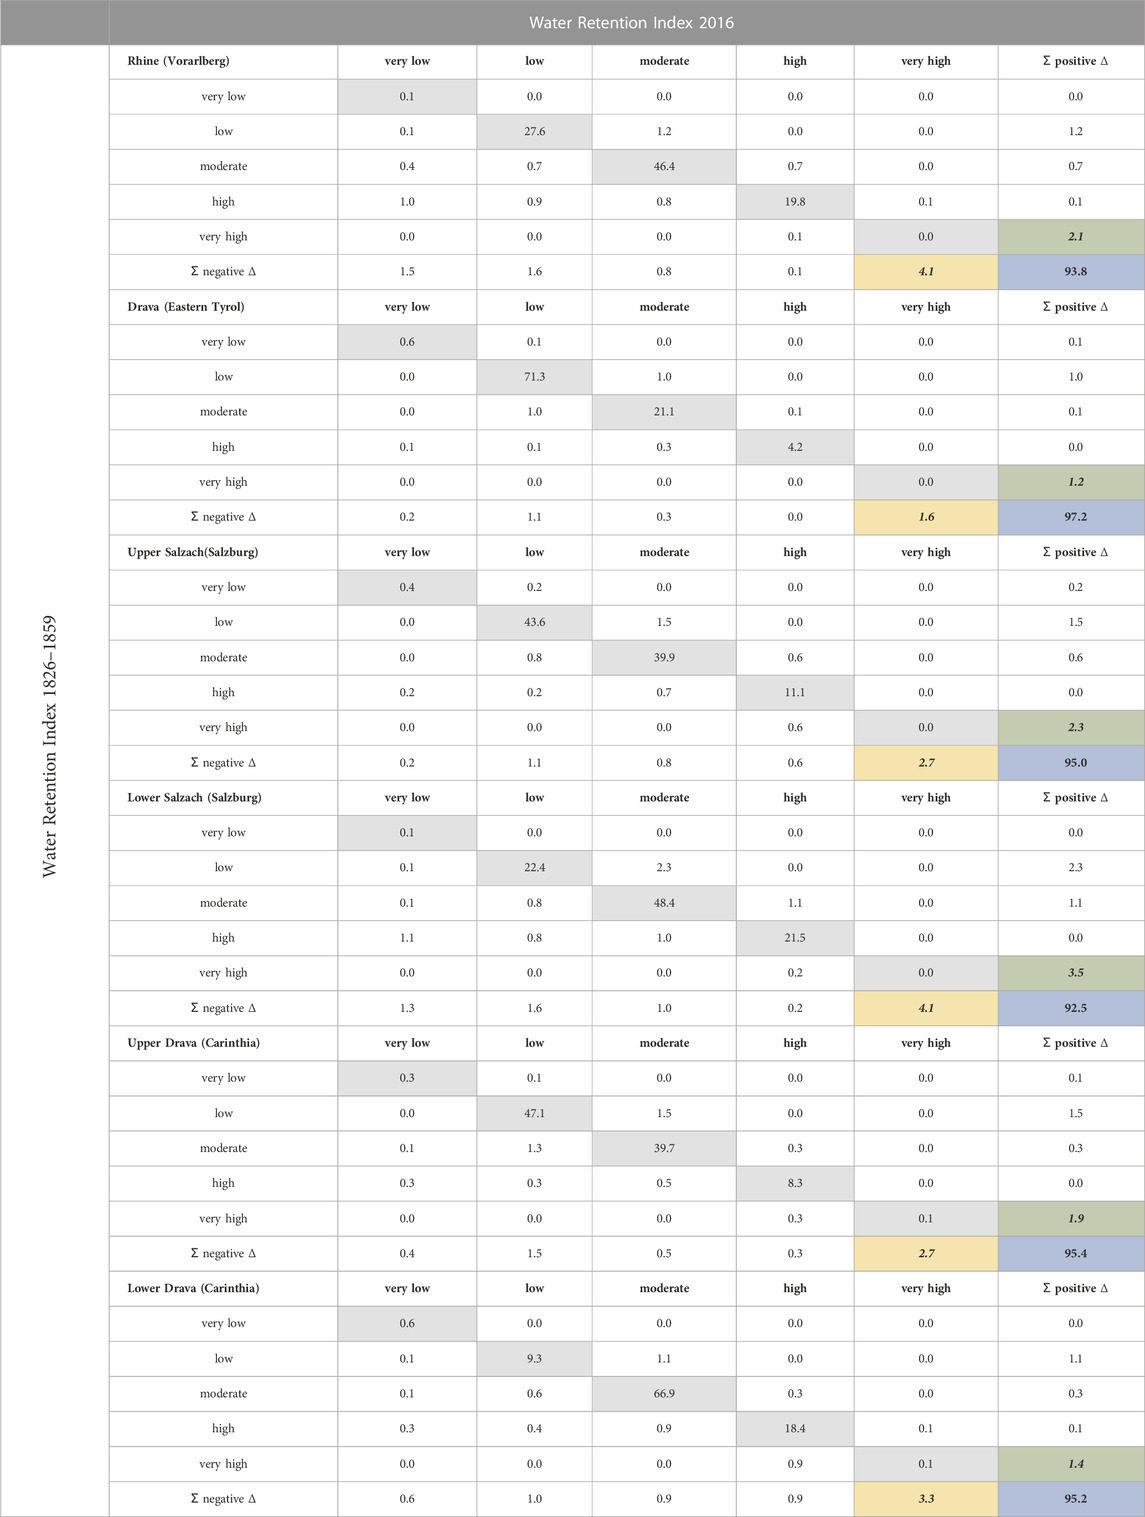
TABLE 2. Change matrix WRIhis (1826–1859) and WRIcur (2016) for each region and river catchment [%]. The values are calculated based on the WRI categories very low (0–2), low (2–4), moderate (4–6), high (6–8), and very high (8–10); orange cells show the relative sum of areas, where the WRI deteriorated; green cells show the relative sum of areas, where the WRI improved; blue cells show the sum of area, where no change occurred.
Figure 5 shows the WRI class shifts for the overall study area in a Sankey diagram. Sankey diagrams illustrating Table 2 and the results for each region are shown in the Supplementary Appendix Figure SA3. Large areas (94.9%) of the study area (19,307 km2) did not exhibit any categorical shifts. Accordingly, Figure 5 only represents 5.1% of the study area, which experienced class changes between the historical and current WRI situation. In addition, the absolute areas and the relative proportions of the total area are shown. The results suggest that there has been an over 9-fold increase in areas with very low WRI (0–2; red). The largest contribution to the very low WRI class can be assigned to historically high WRI values (6–8). In contrast, large areas with historically low WRI values (2–4; yellow) have improved and shifted to moderate WRI values (4–6; green). Areas with moderate WRI values have increased by approximately 50%. LULCCs have also led to a large reduction in areas with high and very high WRI (6–10; light and dark blue). A comparison of historical and current conditions shows a 13-fold decrease in very high WRI values (8–10; dark blue).
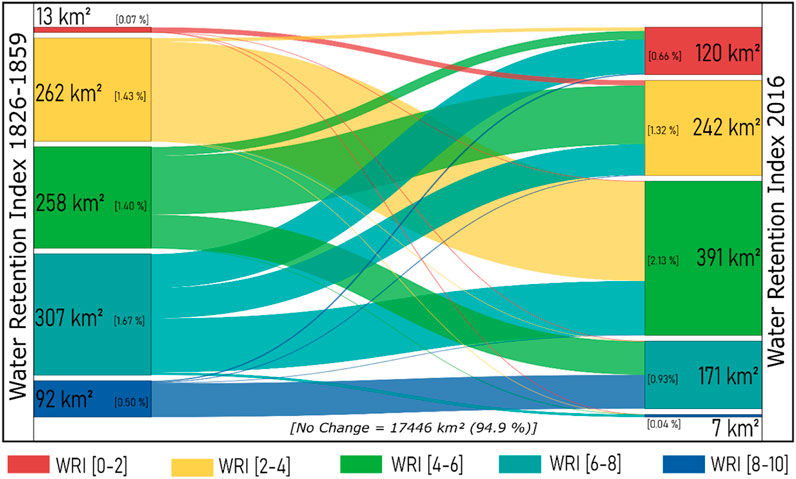
FIGURE 5. Shifts in water retention index between historical (1826–1859; left) and current (2016; right) conditions. For this purpose, the WRI was divided into 5 classes with the categories very low (0–2), low (2–4), moderate (4–6), high (6–8), and very high (8–10). The changes shown are for 5.1% (1,861 km2) of the total area, where class shifts have occurred.
The individual WRI classes can be related to different land cover classes. The lowest class (WRI 0–2) is strongly dominated by settlements and wasteland. Low WRI values (2–4) relate mostly to a combination of forest, wasteland, and grasslands. Forest and grassland define moderate WRI ranges (4–6). High WRI values are frequently attributed to grassland and forest, but also arable land is dominant in this class. The highest WRI class (8–10) is represented by stagnant and running water in the current WRI. Interestingly, the historic very high WRI (8–10) class is related to various land cover types, including grassland, arable land, stagnant water, or forest. The relative contributions to each WRI class described here only focus on the major land cover class contributions. The detailed relative contributions of each land cover class to the WRI classes (1826–1859 and 2016) are given in the Supplementary Appendix Table SA4 and Supplementary Appendix Figure SA5.
3.4 Altitudinal gradients of the historical and present WRI
The study area is dominated by strong topographic gradients. These are also present in the resulting WRI values in both time periods and are shown in the spatially distributed difference plot (Figure 4; bottom panel). Figure 6 shows the relative WRI differences for elevation bands of 250 m. Additionally, the natural Water Retention Index (WRInat) is plotted. WRInat is calculated as the WRI but does not consider the soil sealing parameter Rss (see Eq. 1) which is the linear scaling factor considering artificially introduced surfaces. The comparison of these two indicators allows us to distinguish between the WRI with and without the soil sealing factor (Vandecasteele et al., 2017). Based on this differentiation, the impact of soil sealing due to the construction of infrastructure and settlement areas is illustrated. At the bottom of the plot, the area per elevation band is given in km2 and % as additional information.
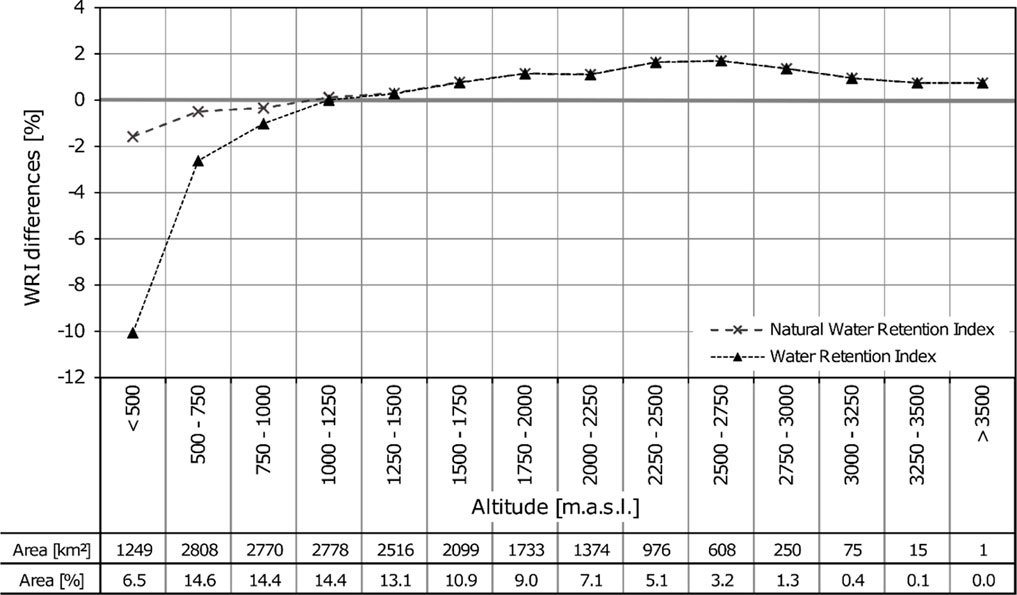
FIGURE 6. Mean WRI changes for different elevation bands, including the absolute areas and relative share compared to the overall study area (19,307 km2). The natural WRI does not consider soil sealing and is thus an indicator of the water retention without settlement or infrastructure development.
Generally, Figure 6 confirms the similar WRI-change pattern as shown in the spatially distributed WRI plots (Figure 4). WRI values strongly decreased in lower elevations. In areas with an elevation lower than 500 m (i.e., valley floors), the water retention capabilities of the landscape decreased by over −10% on average due to LULCC. WRI values in slightly higher areas up to 1,000 m, also show decreasing values, however only with a mean of around −3%. The WRInat shows comparable changes to the WRI for areas above 1,000–1,250 m. In contrast, especially in elevations covering valley floors, a strong difference can be detected. In these regions (<500 m), the WRInat exhibits an over 5-fold smaller decrease in the water retention potential. At altitudes below 1,250 m, a smaller decrease of the WRInat can be detected compared to the WRI. Interestingly, almost no difference between the two indices can be seen at higher altitudes. In comparison to lower elevations, WRI values show an increase above 1,250 m. The settlement area development (Rss) since the mid-19th century reveals likewise altitudinal features. In areas lower than 500 m, these areas have increased by 107%. In areas between 500–750 m and 750–1,000 m, settlement areas and associated soil sealing have expanded by 54% and 16% respectively. This reveals that large areas of degrading water retention values are associated mostly with settlement expansion but also loss of wetlands and deforestation, especially in low-lying regions (e.g., valley floors) as reported by Hohensinner et al. (2021). On the other hand, an increase in water retention capabilities is detected in higher altitudes, due to the LULCCs since the mid-19th century. A similar altitudinal signal can also be observed for the development of the input parameter Rv. Rv values have generally increased at all elevations, except in areas lower than 500 m. At altitudes between 2000 and 2,750 m, the highest increases of Rv by approximately 2.3%–3.1% can be detected. This shows that the increase in vegetation at higher elevations is also related to increasing WRI values to some degree.
3.5 Impact of LULC changes on the water retention
As a further step, the relative WRI changes associated with the specific LULCC are investigated. Here we relate the past and present LULC classification to the changes in the WRI since land development and certain land cover changes can be related to changes in water retention. Table 3 gives the relative change of the WRI for each possible land cover transformation. The numbers given in the table represent the relative spatial mean changes between the historical and current LULC situations. Additionally, the 5th and 95th quantiles are given to represent the spatial variability of WRI value changes per land cover transformation.
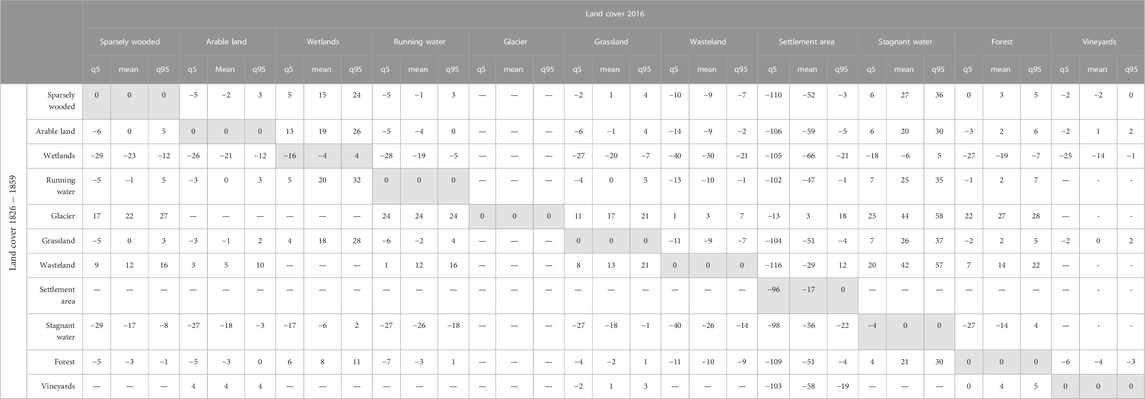
TABLE 3. Spatial mean relative WRI change matrix [%] for land cover class changes, also including 5% (q5) and 95% (q95) quantile values. For example, the transformation category of all wetlands (1826–1859) to the current sparsely wooded land cover (2016) led to a spatial mean reduction of the WRI by 23% in this transformation category. There were, however, single cases where the reduction was stronger (q5 of −29%) or less pronounced (q95 of −12%).
The vector-based land cover datasets were spatially aggregated to a 100*100 m raster based on the major LULC class within the resulting grid consistently with the WRI maps. Some land use and land cover class might therefore be under or over-estimated by the aggregation from a vector to a raster dataset and might be afflicted with some degree of inaccuracy. Table 3 shows that settlement areas have not been transformed into any other land use and land cover class in the current LULC situation. Interestingly, results indicate that current settlement areas reduced the WRI by −17% on average, compared to historical settlement areas. According to the results, wetlands also show a slight decrease of −4% in the water retention capability compared to the historical land cover situation. These inaccuracies might result from the spatial aggregation to a raster dataset by using the major LULC class per raster pixel. Both input parameters (Rv, Rss) are derived based on the areal coverage per pixel (100*100 m). Therefore, the change of the areal share per pixel linearly influences the resulting input parameters. So, the results indicate that settlement areas have increased by 17% at pixels classified as such in the past and present. Likewise, wetlands have decreased by 4% at pixels constantly classified as wetlands on average.
Transformations from historical wetland areas to any other land cover class result in decreasing WRI values. On average former wetland areas experienced a drop of 22% in their water regulation abilities. Similar results can be obtained for areas classified as stagnant water in the historical land cover dataset. These areas show a mean reduction of 20% considering all land cover class transformations. The strongest reduction can be detected for areas, which were transformed from wetlands to settlement areas. These areas show a spatial mean drop in water retention of 66%. On average, areas transformed into settlement areas experienced the largest reduction rates of 44%. Former glacier and wasteland areas increased their water retention ability by 20% and 9%, on average. On the other hand, most areas that were transformed into wetlands and stagnant water from any LULC increased the water retention potential by 10% and 22%, respectively. The transformations from glacier to forest and from grassland to stagnant water resulted in increases of 26% and 27%, respectively. The largest increase in WRI values was detected for areas that have changed from wasteland or glaciers to stagnant water. These LULCCs resulted in over 40% increases in water retention.
4 Discussion
4.1 Input data and weight estimation
Although the concept of the Water Retention Index was developed and proposed to assess the landscape’s water regulation potential on a macroscale (Vandecasteele et al., 2017) our results show that the methodological framework of the WRI is also suitable for a regional high-resolution analysis of the landscape’s potential of water retention and regulation. Compared to the methodology and input data of Vandecasteele et al. (2017) slight changes have been applied in our study due to the availability of more recent and more regionally differentiating datasets. The input parameters representing the infiltration and retention in soil (Rs) and the retention in groundwater (Rgw) were derived differently. Rs was retrieved from a recently released dataset representing the soil water storage for Austria (Zeitfogel et al., 2022). Additionally, no temporal change of the input parameter Rs depending on the changes in organic carbon content and soil bulk density over time was incorporated. The parameter representing groundwater retention was derived from the GLHMPS 2.0 dataset (Huscroft et al., 2018) already incorporating the permeability of the consolidated and unconsolidated Earth. Therefore we did not consider a reduction of the bedrock permeability factor based on hydrological categories of the overlying soil as Vandecasteele et al. (2017). Compared to the original WRI approach, in the presented study the input layer Rwb not only considers stagnant water but also wetland areas, suggesting that these land cover classes have similar water retention abilities. The high-resolution LULC datasets used to derive Rss and Rwb for the historical and current state are additionally subject to some degree of uncertainty due to potential inaccuracies and misinterpretations. Especially, settlement areas might be underestimated in the historical dataset (Hohensinner et al., 2021).
The applied weighting scheme yielded large differences between the individual input layers. The slope input parameter (Rsl) was assigned the highest weight (0.38), which could be explained by the strong topographic gradients of the study area and emphasizes the importance of the slope factor for water retention. On the other hand, the optimization yielded the lowest weight of 0.01 for the soil retention parameter. The correlation matrix between all input parameters (n = 201) for the weight optimization showed strong correlations of 0.77 (p < 0.001) and 0.84 (p < 0.001) between Rs and both Rsl and Rv, respectively (Supplementary Appendix Table SA3). The strong correlations might explain the very low weight of Rs and it suggests that the importance of soil retention might already be captured in Rsl and Rv to some degree. The optimized weights of 0.21 (Rwb) and 0.24 (Rgw) suggest that the retention in surface water bodies and wetlands is comparably important as groundwater retention for the resulting WRI. These weights are close to those applied by Vandecasteele et al. (2017). Additionally, the relative contribution of each input parameter (except Rss) and the associated weights with regard to the resulting WRIcur have been calculated and ranked from 1st to 5th and are presented in the (Supplementary Appendix Figure SA4). The spatially distributed contribution of each input parameter and their respective weights yield additional information on the importance of each retention process represented by the proxy input datasets. The results suggest that Rsl is the most important input parameter for large areas of the study region. Rv and Rgw are the second and third most important input parameters. Thus, it is clear that the weights, which define the importance of the input parameters, have a strong impact on the results. The weights in this work were estimated based on a frequently applied method from the literature (Becker et al., 2017; Vandecasteele et al., 2017; Lindén et al., 2021) and the applied optimization framework guarantees objectivity, transparency, and reproducibility, and some degree of comparability between different estimations of the WRI. Advances in the estimation of spatially distributed parameters in hydrological models, also using Machine Learning (e.g., Klotz et al., 2017; Feigl et al., 2020; Feigl et al., 2022) may be used in the future for calculating the weights of the WRI. For example, runoff data could be used for weight optimization.
4.2 Spatial and altitudinal patterns between LULCC and the WRI
The resulting WRI changes per region echoes the spatially different LULCC in these regions. Since the mid-19th century, Eastern Tyrol (region 4) experienced the lowest settlement area development of all six regions (Kofler, 2021) and accordingly showed the lowest negative WRI changes. Here settlements have increased slightly over two times, while, to put this into context, Hohensinner et al. (2021) reported a 6-fold increase for the whole study area. On the contrary, the Vorarlberg region and the Lower Salzach region showed the highest reductions in water retention (Table 2) due to LULCC. In Vorarlberg and the Lower Salzach, settlement areas have increased by over 9 and 6 times, respectively. At the same time, wetlands have decreased dramatically by 7 times in Vorarlberg. In the Lower Salzach region, wetlands have almost vanished completely (Rapottnig, 2021; Bozzetta, 2022).
The spatial distribution of the WRI changes suggests that large decreases did occur in the Alpine valley corridors and at locations where major settlement developments took place (Figure 4). At the same time, slight retention capacity increases along the valley slopes can be depicted. The decrease of WRI in the valley floors is strongly associated with the development of settlement areas and the reduction of wetland areas by 95%. The strong settlement development led to an increase in settlement areas located within flood-prone areas. This also increased flood exposure and therefore flood risk (Junger et al., 2022). Accordingly, large-scale losses of fluvial corridors led to decreasing flood retention capacity (Hohensinner et al., 2021), somehow a lose-lose situation. The LULCC-induced vertical separation of Alpine landscape features reported by Hohensinner et al. (2021) also transitioned into a comparable separation of increasing and decreasing WRI areas. Strong decreasing WRI values are obtained for low-elevation areas. The natural water retention index (WRInat), which does not consider sealed surface areas, shows a significantly lower decrease in the water retention capacities of low-elevation areas. The changes in WRInat in low-lying areas can therefore be attributed to the loss and transformation of wetlands to agricultural land and forests. The altitudinal investigation shows that the WRI and WRInat values increased accordingly in areas above 1,250 m. The general increase of the water retention potential in higher altitudes suggests that the water regulation potential has increased. This reflects the increase of forest areas and the large areal transformation from wasteland and glaciated areas to Alpine grassland, by 16% and 4.2%, respectively (Hohensinner et al., 2021).
4.3 WRI changes due to specific land use class changes
The specific WRI changes with regard to certain LULC transformations (Table 3) represent spatial mean values over the whole study area. To address the variability of the WRI change per LULCC the 5th and the 95th quantile were additionally presented. The results indicate, e.g., that current settlement areas reduced the WRI by 17% on average, for areas already classified as settlement areas in the past. The 5th quantile suggests even a reduction of 98%. This might be due to the introduced uncertainty in the aggregation but could also suggest that today’s settlement areas are constructed with a higher building and soil sealing density. In addition, the input land cover dataset might already be subject to some degree of uncertainty due to inaccuracies and potential misinterpretations during the digitalization of the historical datasets. Therefore, settlement areas might be underrepresented (Hohensinner et al., 2021). The transformation from a glacier to a settlement area would indicate a slight positive change in the water retention potential. This explicit result is highly uncertain and might represent another limiting factor of the spatial aggregation and the representation of spatial mean values. Generally, transformations from any LULC class to wetlands resulted mostly in an increase in the WRI. At the same time, areas that are constantly classified as wetlands over time show a minor reduction of −4% (q5 = −16%, Q95 = 4%). This slight reduction might have also been introduced due to the reclassification based on the majority and is therefore afflicted with some degree of uncertainty. In addition, wetlands and stagnant water land cover classes are both presented within the input parameter Rgw, assuming a similar retention behavior. This might also lead to an overestimation of the retention potential of wetlands, which strongly depends on the saturation status and therefore on the maximum available retention potential. Especially during extreme events, such as floods, wetlands can either contribute to amplification or mitigation (Bullock & Acreman, 2003; Acreman & Holden, 2013). Accordingly, the results presented for each specific land use change category might show some inaccuracies and are certainly subject to some degree of uncertainty. However, the given relative WRI values assist in the qualitative interpretation and allow for comparison between certain land use transformations. Additionally, other accompanying LULCC effects on the water retention potential processes such as soil storage reduction due to soil compaction with heavy machinery on arable land were not considered (Rogger et al., 2017) in our investigation. Therefore, it can be assumed that the presented impacts of land use transformations with regard to water regulation might be somewhat underestimated.
5 Summary and conclusion
Regulating ecosystem services, such as water purification, flood control, and water regulation are strongly affected by LULCC (Hasan et al., 2020). Various studies have linked LULCCs to declining ecosystem services (e.g., Haines-Young et al., 2012; Kindu et al., 2016; Rai et al., 2018). Human-induced land use change not only affects hydrological ecosystem services but also affects hydrological processes (e.g., Rogger et al., 2017; Wesemann, 2021) and can therefore also affect flood-generating processes and consequently flood risk (Hall et al., 2014). Alpine areas of Austria have experienced strong LULCC since the mid-19th century. Recent studies showed that these LULCCs have resulted in increased flood exposure and flood risk, especially in Alpine valley corridors (Hohensinner et al., 2021; Junger et al., 2022). However, sustainable land use and properly managed LULCC can be beneficial for water regulation (Vandecasteele et al., 2017). Accordingly, the present study aimed to investigate the effects of these LULCCs on the water retention of the landscape in the Alpine areas of Austria. We calculated the Water Retention Index (WRI) developed by Vandecasteele et al. (2017) for the past (1826–1859) and present (2016) land cover situation for the Austrian catchment of the Rhine, Salzach, and Drava rivers.
The resulting WRI maps show a clear spatial pattern mimicking the characteristic Alpine topography, the difference between the historical and present WRI maps reveals that LULCC negatively affected the water retention potential primarily in valley floors. This links the significant settlement expansion in Alpine valleys, leading to increased flood exposure (Hohensinner et al., 2021; Junger et al., 2022), with a decreasing capacity for water regulation. The altitudinal comparison of the WRI with the natural WRI, which does not consider the settlement area parameter in the calculation, shows that the reduction of the water retention capacity is significantly lower without settlements. Without settlement areas, the water retention reduction would be 77% lower in areas lower than 1,000 m.a.s.l. At elevations higher than 1,250 m.a.s.l., almost equally increasing values of the WRI and the natural WRI are present. The strongest WRI reduction of 66% is attributed to the land use changes from wetlands to settlement areas. The highest intensifications of the landscape’s potential to regulate water could be observed by the transformation from wasteland or glacier to stagnant water. In these areas, WRI values increased by over 40%. The results indicate a large variability of WRI changes depending on the specific LULC transformation within the investigated time period.
The results presented in this study showed that a high-resolution utilization of the Water Retention Index can be very supportive to investigate the impacts of LULCC on water regulation on a regional scale. The land cover changes are very well reflected in the calculated WRI maps and the spatial distributed WRI value maps yielded new insights about the impact of LULCC on flood control and water regulation. The results also highlight that soil sealing through settlement developments shows the strongest adverse effects and leads to a decline in regulating ecosystem services including flood control. In an already very limited area for permanent settlements, such as the Austrian Alps, these adverse impacts might lead to further pressures on ecosystem services and conflicts between different land uses. Therefore, sustainable land use and land cover change management would enhance the landscape’s ability to retain water and support flood risk mitigation measures.
Data availability statement
The datasets presented in this article are not readily available because underlying data are partly subject to third party restrictions. Selected data and data supporting the conclusion of the paper are available on request. Requests to access the datasets should be directed to gabriel.stecher@boku.ac.at.
Author contributions
GS: conceptualization, methodology, investigation, validation, writing; SH: validation, writing, reviewing; MH: conceptualization, methodology, investigation, validation, writing, reviewing, funding. All authors contributed to the article and approved the submitted version.
Funding
This work was funded by the Earth System Sciences (ESS) research programme of the Austrian Academy of Sciences (ÖAW) within the project “Integrated Flood Risk Management in Mountain Areas: Assessing Sectoral Interdependencies, Conflicts and Options for Policy Coordination” (PoCo-FLOOD).
Conflict of interest
The authors declare that the research was conducted in the absence of any commercial or financial relationships that could be construed as a potential conflict of interest.
Publisher’s note
All claims expressed in this article are solely those of the authors and do not necessarily represent those of their affiliated organizations, or those of the publisher, the editors and the reviewers. Any product that may be evaluated in this article, or claim that may be made by its manufacturer, is not guaranteed or endorsed by the publisher.
Supplementary material
The Supplementary Material for this article can be found online at: https://www.frontiersin.org/articles/10.3389/fenvs.2023.1219030/full#supplementary-material
References
Acreman, M., and Holden, J. (2013). How wetlands affect floods. Wetlands 33, 773–786. doi:10.1007/s13157-013-0473-2
Alpine Convention (2015). Demographic changes in the alps. Report on the state of the Alps. Austria: Innsbruck.
Andréassian, V. (2004). Waters and forests: From historical controversy to scientific debate. J. Hydrology 27, 1. doi:10.1016/j.jhydrol.2003.12.015
Becker, W., Saisana, M., Paruolo, P., and Vandecasteele, I. (2017). Weights and importance in composite indicators: Closing the gap. Ecol. Indic. 80, 12–22. doi:10.1016/j.ecolind.2017.03.056
BMLFUW (2015). Richtlinien für die Bundes- Wasserbauverwaltung (RIWA-T) Bundesministerium für Land-und Forstwirtschaft, Umwelt und Wasserwirtschaft, Wien.
Bozzetta, T. (2022). Land cover change in the catchment of the rhine river (Vorarlberg). Vienna: University of Natural Resources and Life Sciences Vienna.
Bullock, A., and Acreman, M. (2003). The role of wetlands in the hydrological cycle. Hydrology Earth Syst. Sci. 7, 358–389. doi:10.5194/hess-7-358-2003
Cammerer, H., Thieken, A. H., and Verburg, P. H. (2013). Spatio-temporal dynamics in the flood exposure due to land use changes in the Alpine Lech Valley in Tyrol (Austria). Nat. Hazards 68, 1243–1270. doi:10.1007/s11069-012-0280-8
EU (2007). Directive 2007/60/EC of the European Counil and European Parliment of 23 October 2007 on the assessment and management of flood risks. Official J. Eur. Union, 27–34.
Feigl, M., Herrnegger, M., Klotz, D., and Schulz, K. (2020). Function space optimization: A symbolic regression method for estimating parameter transfer functions for hydrological models. Water Resour. Res. 56, e2020WR027385–24. doi:10.1029/2020WR027385
Feigl, M., Thober, S., Schweppe, R., Herrnegger, M., Samaniego, L. E., and Schulz, K. (2022). Automatic regionalization of model parameters for hydrological models. Water Resour. Res. 58, e2022WR031966. doi:10.1029/2022WR031966
Gómez-Baggethun, E., and Barton, D. N. (2013). Classifying and valuing ecosystem services for urban planning. Ecol. Econ. 86, 235–245. doi:10.1016/j.ecolecon.2012.08.019
Gov (2020). Federal Government Austria: Aus Verantwortung für Österreich: Zusammenfassung des Regierungsprogrammes 2020-2024. Report. Vienna.
Grüneis, H., Schroll, K., and Wagner, K. (2021). The role of agriculture in flood risk management in Austria F0BE conflicts and challenges. J. Environ. Sci. Eng. B 10, 112–127. doi:10.17265/2162-5263/2021.03.004
Guzha, A. C., Rufino, M. C., Okoth, S., Jacobs, S., and Nóbrega, R. L. B. (2018). Impacts of land use and land cover change on surface runoff, discharge and low flows: Evidence from East Africa. J. Hydrology Regional Stud. 67, 49. doi:10.1016/j.ejrh.2017.11.005
Haines-Young, R., Potschin, M., and Kienast, F. (2012). Indicators of ecosystem service potential at European scales: Mapping marginal changes and trade-offs. Ecol. Indic. 21, 39–53. doi:10.1016/j.ecolind.2011.09.004
Hall, J., Arheimer, B., Borga, M., Brázdil, R., Claps, P., Kiss, A., et al. (2014). Understanding flood regime changes in europe: A state-of-the-art assessment. Hydrology Earth Syst. Sci. 18, 2735–2772. doi:10.5194/hess-18-2735-2014
Hasan, S. S., Zhen, L., Miah, M. G., Ahamed, T., and Samie, A. (2020). Impact of land use change on ecosystem services: A review. Environ. Dev. 34, 100527. doi:10.1016/j.envdev.2020.100527
Herrnegger, M., Wesemann, J., Fürst, J., and Schulz, K. (2022). “Event-based runoff simulations show forest roads enhancing floods,” 18th biennial conference of the euromediterranean network of experimental and representative basins ERB 2022, Portoferraio, Italy.
Hohensinner, S., Atzler, U., Berger, M., Bozzetta, T., Höberth, C., Kofler, M., et al. (2021). Land use and cover change in the industrial era: A spatial analysis of alpine river catchments and fluvial corridors. Front. Environ. Sci. 9, 1–17. doi:10.3389/fenvs.2021.647247
Huscroft, J., Gleeson, T., Hartmann, J., and Börker, J. (2018). Compiling and mapping global permeability of the unconsolidated and consolidated earth: GLobal HYdrogeology MaPS 2.0 (GLHYMPS 2.0). Geophys. Res. Lett. 45, 1897–1904. doi:10.1002/2017GL075860
Jin, G., Li, Z., Lin, Q., Shi, C., Liu, B., and Yao, L. 2015. Land use suitability assessment in low-slope hilly regions under the impact of urbanization in yunnan, China. Adv. Meteorology 2015, 1, 9. doi:10.1155/2015/848795
Junger, L., Hohensinner, S., Schroll, K., Wagner, K., and Seher, W. (2022). Land use in flood-prone areas and its significance for flood risk management—a case study of alpine regions in Austria. Land 11, 392. doi:10.3390/land11030392
Kindu, M., Schneider, T., Teketay, D., and Knoke, T. (2016). Changes of ecosystem service values in response to land use/land cover dynamics in Munessa-Shashemene landscape of the Ethiopian highlands. Sci. Total Environ. 547, 137–147. doi:10.1016/j.scitotenv.2015.12.127
Klingler, C., Schulz, K., and Herrnegger, M. (2021). LamaH-CE: LArge-SaMple DAta for Hydrology and environmental Sciences for central europe. Earth Syst. Sci. Data 13, 4529–4565. doi:10.5194/essd-13-4529-2021
Klotz, D., Herrnegger, M., and Schulz, K. (2017). Symbolic regression for the estimation of transfer functions of hydrological models. Water Resour. Res. 53, 9402–9423. doi:10.1002/2017WR021253
Kofler, M. (2021). Land cover change in the catchment of the Drava River (eastern Tyrol). (Master thesis). University of Natural Resources and Life Sciences Vienna.Vienna.
Lindén, D., Cinelli, M., Spada, M., Becker, W., and Burgherr, P. (2021). Composite indicator analysis and optimization (CIAO) tool, v.2. doi:10.13140/RG.2.2.14408.75520
Löschner, L., Herrnegger, M., Apperl, B., Senoner, T., Seher, W., and Nachtnebel, H. P. (2017). Flood risk, climate change and settlement development: A micro-scale assessment of Austrian municipalities. Reg. Environ. Change 17, 311–322. doi:10.1007/s10113-016-1009-0
Maitima, J. M., Mugatha, S. M., Reid, R. S., Gachimbi, L. N., Majule, A., Lyaruu, H., et al. (2009). The linkages between land use change, land degradation and biodiversity across East Africa. Afr. J. Agric. Res. 3, 310–325. doi:10.5897/AJEST08.173
MEA (2005). Millennium ecosystem assessment - ecosystems and human well-being: Synthesis. Washington, D.C: Island Press. doi:10.1016/B978-0-12-809665-9.09206-5
Merz, B., Vorogushyn, S., Uhlemann, S., Delgado, J., and Hundecha, Y. (2012). HESS opinions: More efforts and scientific rigour are needed to attribute trends in flood time series. Hydrology Earth Syst. Sci. 16, 1379–1387. doi:10.5194/hess-16-1379-2012
Nordbeck, R., Seher, W., Grüneis, H., Herrnegger, M., and Junger, L. (2023). Conflicting and complementary policy goals as sectoral integration challenge: An analysis of sectoral interplay in flood risk management. Policy Sci. doi:10.1007/s11077-023-09503-8
Nordbeck, R., Steurer, R., and Löschner, L. (2019). The future orientation of Austria’s flood policies: From flood control to anticipatory flood risk management. J. Environ. Plan. Manag. 62, 1864–1885. doi:10.1080/09640568.2018.1515731
OECD (2008). Handbook on constructing composite indicators. Methodology and user guide, 2. Berlin: OECD PUBLICATIONS. rue André-Pascal.
Oudin, L., Andréassian, V., Lerat, J., and Michel, C. (2008). Has land cover a significant impact on mean annual streamflow? An international assessment using 1508 catchments. J. Hydrology 357, 303–316. doi:10.1016/j.jhydrol.2008.05.021
Paruolo, P., Saisana, M., and Saltelli, A. (2013). Ratings and rankings: Voodoo or science? J. R. Stat. Soc. Ser. A Statistics Soc. 176, 609–634. doi:10.1111/j.1467-985X.2012.01059.x
Rai, R., Zhang, Y., Paudel, B., Acharya, B. K., and Basnet, L. (2018). Land use and land cover dynamics and assessing the ecosystem service values in the trans-boundary Gandaki River Basin, Central Himalayas. Sustain. Switz. 10, 3052–3122. doi:10.3390/su10093052
Rapottnig, L. (2021). Land cover change in the catchment of the middle Salzach river (Salzburg). Vienna: University of Natural Resources and Life Sciences Vienna.
Rogger, M., Agnoletti, M., Alaoui, A., Bathurst, J. C., Bodner, G., Borga, M., et al. 2017. Land use change impacts on floods at the catchment scale: Challenges and opportunities for future research. Water Resour. Res. 53: 5209–5219. doi:10.1002/2017WR020723
Silvestri, S., Zaibet, L., Said, M. Y., and Kifugo, S. C. (2013). Valuing ecosystem services for conservation and development purposes: A case study from Kenya. Environ. Sci. Policy 31, 23–33. doi:10.1016/j.envsci.2013.03.008
Sobol, I. M. (1993). Sensitivity estimates for nonlinear mathematical models. Math. Model. Comput. Exp., 407–414.
Stecher, G., and Herrnegger, M. (2022). Impact of hydropower reservoirs on floods: Evidence from large river basins in Austria. Hydrological Sci. J.Accept. 67, 2082–2099. doi:10.1080/02626667.2022.2130332
Thieken, A. H., Cammerer, H., Dobler, C., Lammel, J., Sch, ?, and berl, F. (2016). Estimating changes in flood risks and benefits of non-structural adaptation strategies - a case study from Tyrol, Austria. Mitig. Adapt. Strategies Glob. Change 21, 343–376. doi:10.1007/s11027-014-9602-3
Van Herk, S., Rijke, J., Zevenbergen, C., and Ashley, R. (2015). Understanding the transition to integrated flood risk management in The Netherlands. Environ. Innovation Soc. Transitions 15, 84–100. doi:10.1016/j.eist.2013.11.001
Vandecasteele, I., Marí i Rivero, I., Baranzelli, C., Becker, W., Dreoni, I., Lavalle, C., et al. (2017). The Water Retention Index: Using land use planning to manage water resources in Europe. Sustain. Dev. 26, 122–131. doi:10.1002/sd.1723
Viglione, A., Merz, B., Dung, N. V., Parajka, J., Nester, T., and Blöschl, G. (2016). Attribution of regional flood changes based on scaling fingerprints. J. Hydrology 52, 5322–5340. doi:10.1002/2016wr019036
VITO. (2018). Gio global land component - lot I; operation of the global land component - product user manual.
Wesemann, J., Herrnegger, M., and Schulz, K. (2018). Hydrological modelling in the anthroposphere: Predicting local runoff in a heavily modified high-alpine catchment. J. Mt. Sci. 15, 921–938. doi:10.1007/s11629-017-4587-5
Wesemann, J. (2021). Hydrologische Modellierung des natürlichen Abflussverhaltens und dessen Veränderung durch anthropogene Einflüsse. PhD thesis. Vienna: University of Natural Resources and Life Sciences.
Winkler, K., Fuchs, R., Rounsevell, M., and Herold, M. (2021). Global land use changes are four times greater than previously estimated. Nat. Commun. 12, 2501. doi:10.1038/s41467-021-22702-2
Keywords: water retention, land use, land cover change, flood control, ecosystem service, Alpine regions
Citation: Stecher G, Hohensinner S and Herrnegger M (2023) Changes in the water retention of mountainous landscapes since the 1820s in the Austrian Alps. Front. Environ. Sci. 11:1219030. doi: 10.3389/fenvs.2023.1219030
Received: 10 May 2023; Accepted: 05 July 2023;
Published: 28 July 2023.
Edited by:
Yiping Wu, Xi’an Jiaotong University, ChinaCopyright © 2023 Stecher, Hohensinner and Herrnegger. This is an open-access article distributed under the terms of the Creative Commons Attribution License (CC BY). The use, distribution or reproduction in other forums is permitted, provided the original author(s) and the copyright owner(s) are credited and that the original publication in this journal is cited, in accordance with accepted academic practice. No use, distribution or reproduction is permitted which does not comply with these terms.
*Correspondence: Gabriel Stecher, gabriel.stecher@boku.ac.at
†ORCID: Gabriel Stecher, orcid.org/0000-0002-3334-3259; Severin Hohensinner, orcid.org/0000-0002-3517-0259; Mathew Herrnegger, orcid.org/0000-0002-5388-2831