Evaluation of predicted loss of different land use and land cover (LULC) due to coastal erosion in Bangladesh
 Md Sariful Islam
 Thomas W. Crawford
 Yang Shao
- Department of Geography, Virginia Polytechnic Institute and State University, Blacksburg, VA, United States
Coastal erosion is one of the most significant environmental threats to coastal communities globally. In Bangladesh, coastal erosion is a regularly occurring and major destructive process, impacting both human and ecological systems at sea level. The Lower Meghna estuary, located in southern Bangladesh, is among the most vulnerable landscapes in the world to the impacts of coastal erosion. Erosion causes population displacement, loss of productive land area, loss of infrastructure and communication systems, and, most importantly, household livelihoods. With an aim to assess the impacts of historical and predicted shoreline change on different land use and land cover, this study estimated historical shoreline movement, predicted shoreline positions based on historical data, and quantified and assessed past land use and land cover change. Multi-temporal Landsat images from 1988–2021 were used to quantify historical shoreline movement and past land use and land cover. A time-series classification of historical land use and land cover (LULC) were produced to both quantify LULC change and to evaluate the utility of the future shoreline predictions for calculating amounts of lost or newly added land resources by LULC type. Our results suggest that the agricultural land is the most dominant land cover/use (76.04% of the total land loss) lost over the studied period. Our results concluded that the best performed model for predicting land loss was the 10-year time depth and 20-year time horizon model. The 10-year time depth and 20-year time horizon model was also most accurate for agricultural, forested, and inland waterbody land use/covers loss prediction. We strongly believe that our results will build a foundation for future research studying the dynamics of coastal and deltaic environments.
1 Introduction
Coastal erosion is one of the most prominent problems in coastal areas globally and the world’s mega-deltas are heavily impacted (Woodroffe et al., 2006). Human life and natural environements are threatened by coastal erosion. Due to erosion, coastal lands are being swallowed by the seawater and people are forced to move inland. A recent global study found that the earth surface lost about 28,000 km2 land during 1984–2015, which is twice the surface land area gained (Mentaschi et al., 2018). Coastal erosion is caused by many different physical (e.g., strong wave action, upstream discharge, river bathymetry) and anthropogenic factors (e.g., global warming, sea level rise). Soil properties such as texture and structure govern pore size distribution have an influence on soil’s erodibility. Studies suggest that soil moisture has substantial influence on water runoff and soil erosion (Wei et al., 2007; Lal et al., 2023). Due to coastal erosion, people living in the coast lose their valuable lands and properties. Climate change driven coastal erosion is posing extra risk for the coastal ecosystems. Increased frequency and severity of the events including storm, rainfall and flood, increased freshwater input to the marine systems and lengthening open water periods are influencing coastal erosion process in addition to the rising sea level (Sanò et al., 2011; Radosavljevic et al., 2016). Mean sea level rose 11–16 cm during 20th century (Hay et al., 2015; Dangendorf et al., 2017), possibly exacerbating coastal erosion globally. Land subsidence is another factor that is influencing coastal erosion risk. For instance, a study on land subsidence and its effects on coastal erosion in the Nam Dinh Coast of Vietnum found that the combined effects of land subsidence and relative sea level rise (SLR) were responsible for 66% of the observed rate of erosion (Nguyen and Takewaka, 2020). Resulting inundation from rising seas will heavily impact low-lying areas, impacting at least 100 million persons globally who live within 1 m of mean sea level (Zhang et al., 2004). This is a tremendous threat for the people living in the coastal communites.
Coastal communities in Bangladesh are vulnerable to different natural hazards and disasters due to close proximity to the sea and sea level. Most parts of coastal areas in Bangladesh are within few meters of the sea level. Extreme erosion is one of the biggest problems threatening the livelihoods of coastal populations, especially the poor. Coastal Bangladesh is highly vulnerable to coastal erosion; land erosion and accretion rates are among the highest in the world (Brammer, 2014; Ahmed et al., 2018; Crawford et al., 2021). It is a recurring driver of homelessness impacting thousands of people annually. The coastal poor are the most susceptible to these impacts. A study by Kumar et al. (2022) suggested that a proper afforestation measures in the upper cathments of Brahmaputra basin might reduce soil erosion and subsequent impacts on the riverbank communities.
Bangladesh is considered as one of the most vulnerable countries to the impacts of climate change in the world, particularly sea-level rise (Nicholls et al., 2007; Sarwar and Khan, 2007; Davis et al., 2018). Moreover, future global warming and subsequent rising sea levels seriously threaten coastal populations in this part of the world. Additionally, as economically marginalized populations live in coastal Bangladesh, the magnitudes and severity of the affected people may affect the total economic growth of the country (Hossain et al., 2016). As a lower middle-class country like Bangladesh, with limited internal resources, it is hard to cope with catastrophic natural hazards like erosion and its related consequences (Poncelet et al., 2010). Additionally, disasters like coastal erosion create the acute problems of unemployment in coastal rural areas and thereby worsen the socio-economic condition of displaced people. Most of these displaced people become landless, which pushes them further into poverty and forces migration. Future climate change is more likely to impact the migration decisions of the people living in coastal Bangladesh in search of prosperous livelihoods (Call et al., 2017).
Due to coastal erosion, people living on the coast not only lose their valuable lands and houses but also infrastructure, communication systems, and most importantly their livelihood (Monirul Alam et al., 2017). A proper estimation of different types of land loss is crucial for better understanding of the impacts of shoreline movement. It is particularly important for proper planning and implementation of appropriate environmental practices. Land use and land cover analysis using satellite imagery is a cost-effective way to monitor long-term changes. Many different methods are used to classify land use and land cover. The maximum likelihood, random forest, support vector machine, and artificial neural network methods were found to be most applied method for LULC analysis (Otukei and Blaschke, 2010; Rodriguez-Galiano et al., 2012; Balha and Singh, 2022). It is well evident that in the recent decades, human activity has significantly influenced land use and land cover globally (Lambin and Geist, 2008). A significant portion of the global population lives near the coast. As a result, it is expected that the coastal ecosystem will change globally due to a large number of human footprints in the coastal region. For regions experiencing the loss or gain of land resources due to erosion/accretion processes, it is important to map existing land use and land cover (LULC) and to integrate resulting data products with information on future shoreline change.
Coastal landscapes are changing rapidly due to both natural and anthropogenic activities in Bangladesh and elsewhere (Muttitanon and Tripathi, 2005; Olaniyi et al., 2012; Abdullah et al., 2019; Ekumah et al., 2020). In Bangladesh, coastal landscape is changing over time due to many reasons. A recent study by Abdullah et al. (2019) found that the vegetation coverage in the coastal Bangladesh is declining day by day due to natural (e.g., flooding, cyclones, etc.) as well as human influenced alterations (e.g., shrimp farming). They also found that river areas have increased by 4.52 percent within 27 years (1990–2017). This indicates that, as this part of the country is the heart of the Ganges-Brahmaputra Meghna (GBM) delta, coastal areas of Bangladesh are experiencing erosion at alarming rates over the last few decades. Global warming and sea level rise is putting extra fuel on ever changing coastal landscape in Bangladesh. A similar study by (Rahman et al., 2017) found 26 percent increase in shrimp farm area from 1989–2015. During this 26 year of period, about 21% of bare lands declined. This is an indication that this highly dynamic coastal region of Bangladesh is changing rapidly.
With an aim to assess the impacts of historical and predicted shoreline change on different land use and land cover, this study estimated historical shoreline movement, predicted shoreline positions based on historical data, and quantified and assessed land loss due to historical and predicted shoreline movement. In our previous study, we assessed the predicted performance of shoreline movement (Islam and Crawford, 2022). We analyzed how prediction performance varies depending on the time depths of input historical shoreline data and the time horizons of predicted shorelines. Our results suggested that the higher the number of shorelines used in calculating and predicting shoreline change rates the better predictive performance was yielded. Though the prediction performance varied spatially, we found that prediction accuracies were substantially higher for the immediate future years compared to the more distant future. In this study, we assess how different LULC classes changed due to historical and predicted shoreline movement. The specific goals of this study were to 1) assess historical land loss in the Lower Meghna river region of Bangladesh, 2) measure the amount of different LULC has been lost to erosion over defined time intervals, and 3) estimate how well predicted shorelines predict amounts of succeeding LULC resources lost to erosion.
2 Materials and methods
2.1 Study area
The area covered in this study consists of Ramgati and Kamalnagar upazilla of Lakshmipur district in Bangladesh. The upazillas are the second lowest elevation administrative units in Bangladesh. The study area covers approximately 885 km2 with an estimated population of 490,000 (BBS, 2011). This area is located in coastal Bangladesh along the Lower Meghna river (Figure 1), which is highly prone to different natural hazards and disasters including coastal erosion, flooding, cyclones, etc. This area is a major hotspot of coastal erosion in the country (Crawford et al., 2021). Peoples living in this part of the coastal Bangladesh are mostly dependent on agriculture and fishing for their livelihood (Paul et al., 2021; Rahman et al., 2021, 2022).
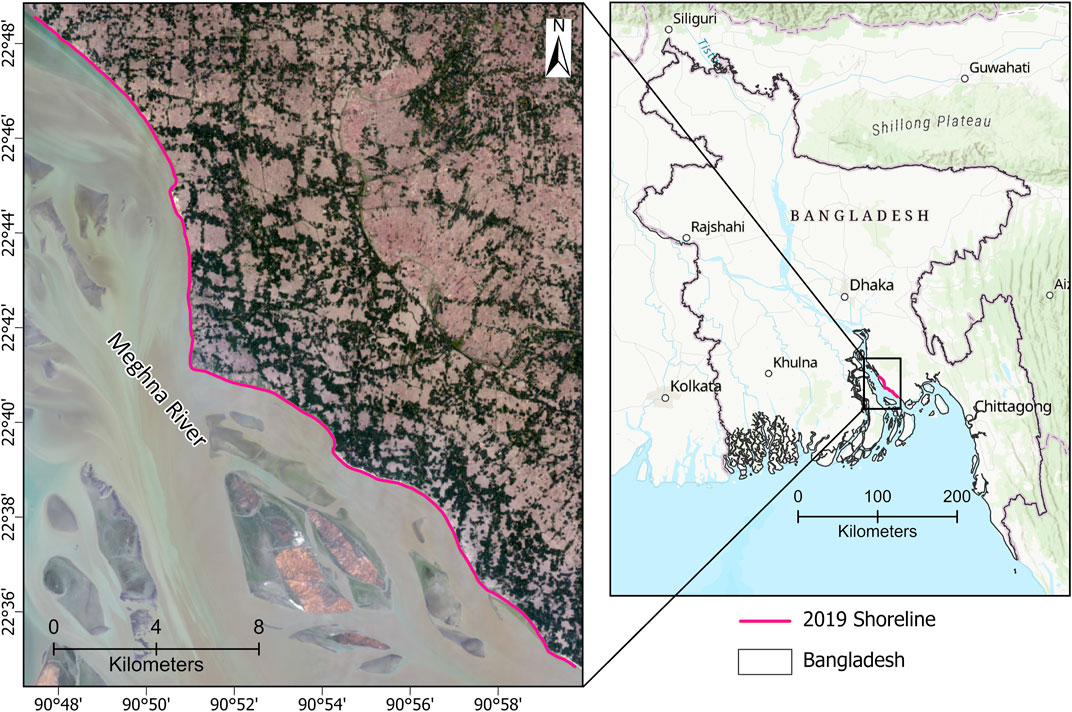
FIGURE 1. The location of study area in coastal Bangladesh. In the map, natural color band combinations (4, 3, 2) were used to show the actual landscape in this part of the coast.
2.2 Data
Multitemporal Landsat satellite imagery from 1988–2021 was used in this study. Landsat satellite data were obtained from the USGS Earth Explorer website (https://earthexplorer.usgs.gov/). Landsat imagery (30 m resolution) were used for both shoreline mapping and LULC classification. To avoid cloud issues, we obtained imagery only from the dry season. This allowed us to acquire cloud free scenes. Landsat imagery is widely used for quantification of coastal erosion and land use and land cover change (Ghoneim et al., 2015; Ahmed et al., 2018; Crawford et al., 2021). Additionally, this research used high resolution satellite imagery from Google Earth Pro for post classification accuracy assessment.
2.3 Shoreline extraction
After getting the imagery, multiple steps were followed to extract shorelines. First, the Modified Normalized Difference Water Index (MNDWI) was used to create an index that enhances the ability to distinguish between open water and non-open water sources (Xu, 2006). MNDWI makes use of the middle infrared and green bands. Values ranges from −1 to 1, where water pixels approach 1 and are easily distinguishable from other pixels. It is a widely used method to separate water and non-water pixels (Singh et al., 2015; Crawford et al., 2021). Second, MNDWI images were used as an inputs with other Landsat bands to classify images into different classes. The ISO cluster unsupervised classification was used to classify the image into 10 classes. After getting the classification output, it was reclassified into two classes, water and non-water via visual interpretation. A similar approach was used to generate annual vector shorelines from 1988–2021. Shoreline uncertainty was assessed by considering different uncertainty terms, including georeferencing uncertainty, pixel uncertainty, digitizing uncertainty, and uncertainty due to tidal variation. Shoreline total uncertainty was assessed using the following equation provided by (Hapke et al., 2011).
Where, Utotal = total uncertainty, Ug = georeferencing uncertainty, Up = pixel uncertainty, Ud = digitizing uncertainty, and Ut = uncertainty associated with tide.
To assess shoreline uncertainty, we adopted a similar approach used in our previous research (Crawford et al., 2020; Islam and Crawford, 2022). The shoreline uncertainty analysis suggest that the mean uncertainty related to georeferencing (Ug), pixel (Up), digitizing (Ud), and tidal variation (Ut) were 4.72, 30, 0, and 7.32 m respectively. The mean total uncertainty (Utotal) was found to be 32.27 m.
2.4 Shoreline change rates calculation
Shoreline change rate was calculated using the DSAS (Digital Shoreline Analysis System), a software package for quantification of shoreline movement developed by United States Geological Survey (Thieler et al., 2009). There are several widely accepted methods for estimating coastal erosion rates including End Point Rate (EPR), Linear Regression Rate (LRR), Net Shoreline Movement (NSM), and Weighted Linear Regression (WLR) (Ciritci and Türk, 2020; Crawford et al., 2020, 2021). In this study, the LRR rates were used to estimate shoreline change rates. This method is the most used method for coastline change analysis (Kanwal et al., 2022). The LRR rate is calculated by fitting a least-squares regression line to all shoreline points for along digital transects that are cast orthogonal from an offshore or onshore baseline to the mapped shorelines. This method is applied to the set of transects such that each transect obtains a position-specific shoreline change rate and uncertainty value.
2.5 Shoreline prediction
We used LRR rates to predict future shoreline position. Prediction involves a general two-step process. First, we generated shoreline change rates using the LRR method. Second, we used these rates as inputs for future shoreline prediction. Future shoreline prediction is implemented by simple extrapolation of historical rates deployed in ArcGIS via relevant geoprocessing tools and/or original scripts to automate processing. One of the essential aspects of this research was establishing a temporal strategy to predict future shorelines. Our strategy included two different variables: time depth and time horizon. Here, time depth means the number of years of shoreline data used in DSAS (e.g., 5 years means 5 years of annual shorelines as input to DSAS for estimates of transect-specific shoreline rates). Time horizon can be defined as the year of prediction in the future. For time depth, we used three different time depths of 5, 10, and 15 years; for time horizon we used four different time horizons of 1, 5, 10, and 20 years into the future. Using 5, 10, and 15-year time depths of shoreline rates, future shoreline positions were predicted for different time horizons (e.g., 1, 5, 10, and 20 years). After deriving the predicted shoreline movement rates for each transect (e.g., LRR), we created the predicted shoreline positions along the transect using the following equation.
Where, Start point =
End point =
Predicted Point =
The distance between Start and End point,
Distance ratio,
Predicted distance =
Finally, we used the geoprocessing functionality of ArcGIS Pro to create the predicted linear shorelines by connecting predicted shoreline points of sequentially adjacent transects created by the above equation.
2.6 Land use and land cover (LULC) classification and accuracy assessment
Based on the satellite images’ spectral characteristics and familiarity with the study area’s land use, we identified and classified six LULC categories for the years 1995, 1999, 2000, 2004, 2005, 2009, 2010, 2014, 2015, and 2019 (Figure 2). A detailed description of the LULC categories can be found in Table 1. We used the Random Forest (RF) and Support Vector Machine (SVM) algorithms to classify land use/cover. Random Forest is a robust machine learning classifier that balances ease of implementation and generalization ability (Rodriguez-Galiano et al., 2012). It is one of the most widely used land use land cover change classifiers (Rodriguez-Galiano et al., 2012; Zhou et al., 2020). The Support Vector Machine (SVM) algorithm is also found to be one of the most widely used algorithms in land use and land cover classification (Huang et al., 2002; Otukei and Blaschke, 2010). For a given land cover mapping task, it is often a good practice to examine multiple machine learning algorithms to compare and select a better performer (Ren et al., 2021).
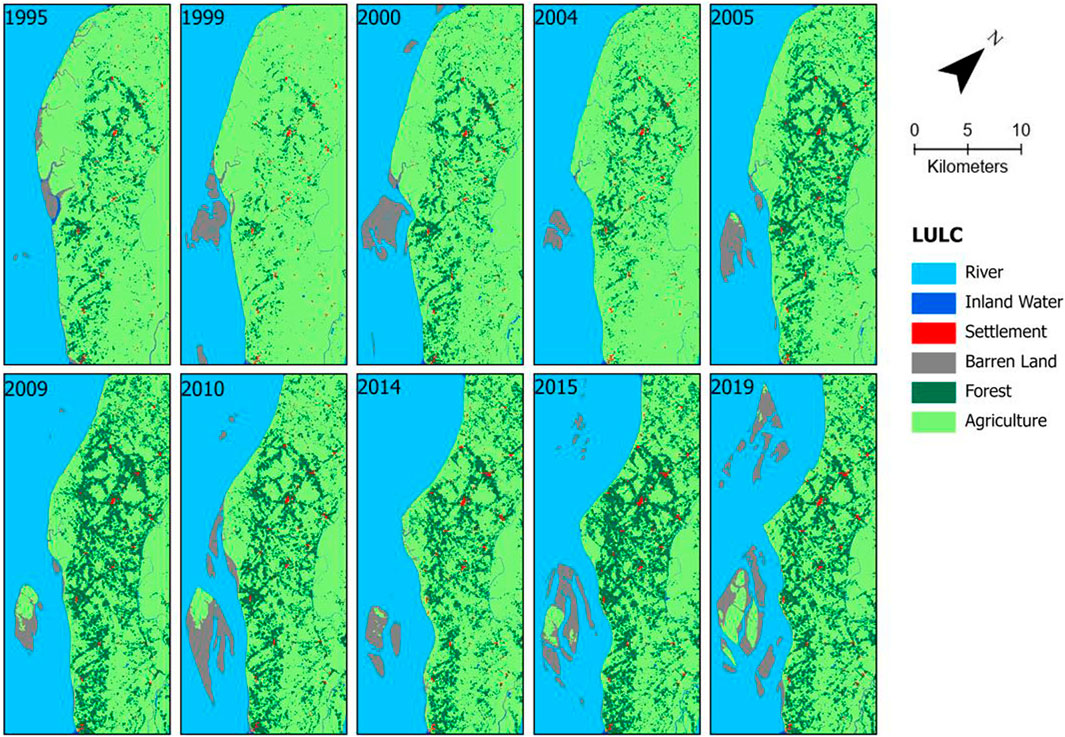
FIGURE 2. Land use and land cover (LULC) of the coastal Lakshmipur region.
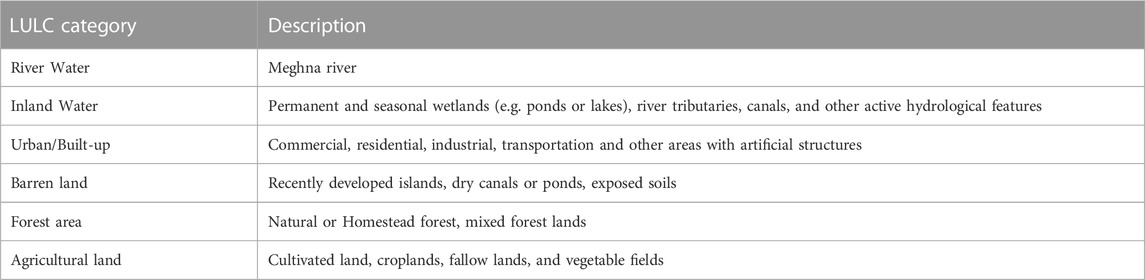
TABLE 1. Description of the LULC categories used for the classification.
Post-classification accuracy is an essential part of LULC analysis. After getting the classified image, an accuracy assessment was conducted using high-resolution imagery in Google Earth Pro. Our initial assessment found that the accuracy of the SVM classifier was slightly better. As a result, we used SVM-classified LULC products for all the subsequent analyses. After getting the classified data, we found that the urban pixels are overly estimated for most of the years and underestimated for several years. To make the urban pixels consistent, we fused the Urban Settlement Footprint (WSF) data product of the German Aerospace Center (Marconcini et al., 2020). The World Settlement Footprint (WSF) evolution is a 30 m resolution dataset of the global settlement extent. First, we mask out urban/built-up class using WSF results. Second, we classify the remaining study area based on our classification scheme. Finally, our classified image was fused with the WSF products using the raster calculator tool in ArcGIS Pro.
We assessed classification accuracy for the year 2015, first using the Create Accuracy Assessment Points tool in ArcGIS Pro to create 300 random points. Each land cover/use covers 60 random points. Accuracy was assessed using standard methods, including user’s accuracy, producer’s accuracy, overall classification accuracy, and the kappa coefficient. Our accuracy assessment result suggested that the 2015 LULC map had an overall accuracy of 86.67% and the Kappa statistic was 0.83 (Table 2). A high Kappa statistic value indicates that the relation between the predicted and actual land use is very strong. The user accuracy analysis suggested that all classes except built-up (75%) had greater than 80% accuracy. For producer accuracy, the barren and forest class had highest (96%) and lowest (75.68%) accuracy, respectively.
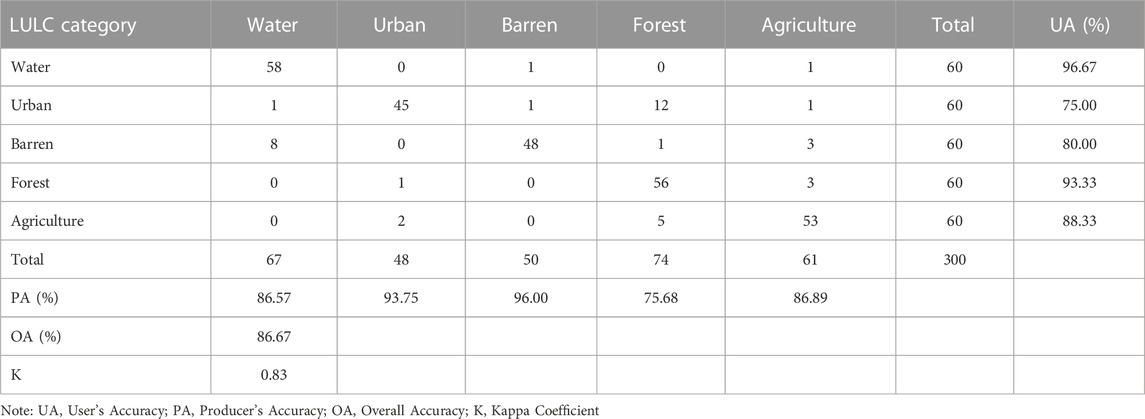
TABLE 2. Result of LULC accuracy assessment for the year 2015.
2.7 Impacts of shoreline change on land use and land cover calculation
Historical and predicted shorelines were overlaid with classified LULC to assess the impacts of coastal erosion on different land use and land cover. This provided historical estimation of LULC that has been impacted by coastal erosion, as well as the estimation of the future impacts. Using the actual and predicted shoreline, we created polygon to estimate the area lost. We used clip raster tool to extract area that is lost by overlaying the LULC and polygon layer. This allowed us to estimate both the total land loss and the land loss by LULC type. We used similar approach to estimate both the actual and predicted land loss for all the shoreline prediction scenarios. One goal of this overlay analysis was to quantify how well previously generated shoreline predictions perform in predicting lost or gained LULC in terms of lost area by LULC type. For example, for 2010 and 2015, we had the actual 2010 and 2015 shorelines and LULC for both years. Additionally, we produced predicted shorelines for 2015 based on the actual 2010 shoreline and using selected time depths of historical shorelines leading up to 2010 (e.g., 5 years, 10 years, and 15 years time depths). These results allowed for a comparison of the actual vs. predicted lost LULC due to erosion after the 2010 to 2015 study period. A similar approach was used for other years of assessment. A detailed description of the methodology followed for predicting future shorelines using different time depths and time horizons can be found in our previously published research (Islam and Crawford, 2022). Finally, the zonal statistics tool in ArcGIS Pro was used to extract the actual and predicted land use and land cover lost.
2.8 Land loss accuracy assessment
We used recall, precision, and F1 Score metrics to evaluate the predicted land use/cover lost accuracy. The recall, precision and F1 score are confusion matrix-based metrics. The F1 score metric is a more balanced metric than recall and precision (Chicco and Jurman, 2020). All these metrics are broadly used for assessing prediction accuracy (Tseng et al., 2022). The values of the metrics mentioned above range from 0 to 1. A higher value of a metric indicates higher prediction accuracy. The metrics were calculated using the following equations. In this case, true positive (TP) means overlapping areas of actual and predicted land loss. False positive (FP) and false negative (FN) means over-predicted and under-predicted land loss areas. Figure 3. Depicts a schematic diagram of land loss accuracy assessment.
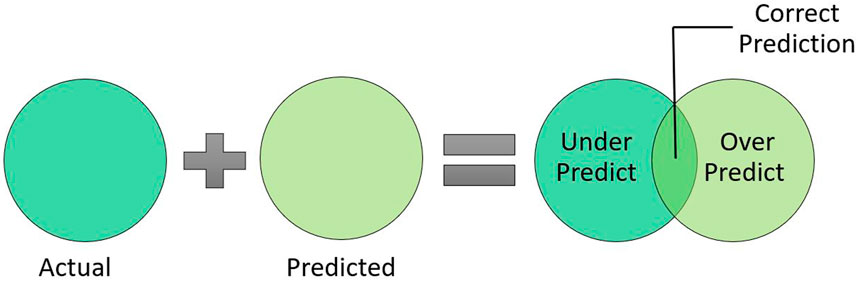
FIGURE 3. Schematic diagram of land loss accuracy assessment.
2.9 Statistical analysis
We used two non-parametric statistical Friedman test and Wilcoxon signed-rank test to assess the difference among models. The Friedman test is widely used for multiple comparisons of different models (Khosravi et al., 2018). We used a p-value less than 0.05 (α = 0.05) to be statistically significant. In addition to the Friedman test, we used the Wilcoxon signed-rank test since Friedman does not provide a pairwise comparison of the models. The Wilcoxon signed-rank tests are typically used to check the statistical significance of pairwise comparisons of the models (Nhu et al., 2020). The probability of the hypothesis is assessed here: whether to accept or reject a null hypothesis. The null hypothesis is rejected if there is a significant difference between different models (Nickerson, 2000).
3 Results
3.1 Spatio-temporal patterns of land loss
The land loss due to erosion between 1995–2020 is shown in Figure 4. During the study period, agricultural land represented the LULC incurring the most loss (76.04%). This was expected, as agricultural land is the region’s dominant land use/cover (Figure 2). Forest land accounted for approximately 12.93% of the total land loss. Other land cover types included barren, inland waterbodies, and settlements that were estimated to be lost at levels of 9.57%, 1.27%, and 0.19%, respectively. Previous studies suggest that most people living on this part of the coast depend on farming/agriculture and fishing for their livelihood (Paul et al., 2020; Rahman et al., 2021). As such, agricultural land loss forces people to migrate and threatens their livelihood. Among the different studied periods, the highest (3,137 ha) and lowest (1,367 ha) land losses were during 2010–2015 and 2000–2005. During 1995–2000, approximately 2,285.64 ha of land were lost. Land loss decreased in the following half-decade period (2000–2005). After that, it increased until the mid of the last decade. The latter half of the last decade experienced a decreased amount of land loss compared to the first half. Factors like upstream water discharge, wave energy, storm events, and heavy rainfall are possible drivers of these trends.
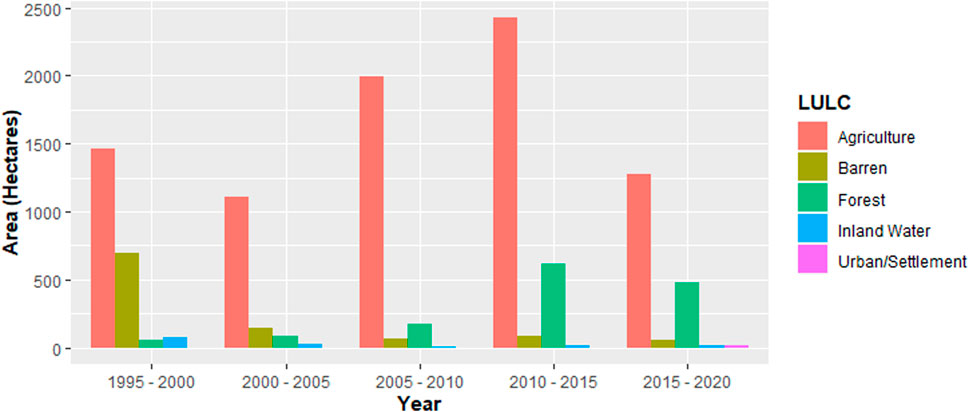
FIGURE 4. Historical land/LULC loss from 1995 to 2020.
3.2 Model comparison—total land loss
Land loss prediction performance was evaluated by averaging the ranking of each metric. We followed a similar ranking approach to Moayedi et al. (2020) who evaluated the performance of different image classification algorithms. First, we ranked individual metrics (e.g., recall, precision, F1) based on the prediction performance. Second, we averaged the ranking of all metrics to get the final rank. The results of individual metric ranking indicate that the best-performing model for recall was 5 year time depth and 1 year time horizon; for precision it was 15 year time depth and 10 year time horizon, and for F1, 10 year time depth and 20 year time horizon (Table 3). Our final ranking system suggests that the best model was the 10 year time depth and 20 year time horizon, followed by the 5 year time depth and 20 year time horizon model. Our lowest-ranked model was the 15 year time depth and 1 year time horizon model. This indicates the performance was best while 10 years of shoreline data were used to predict shoreline positions 20 years in the future. This result also aligns with our previous research (Islam and Crawford, 2022), where we assessed the prediction performance of shoreline movement.
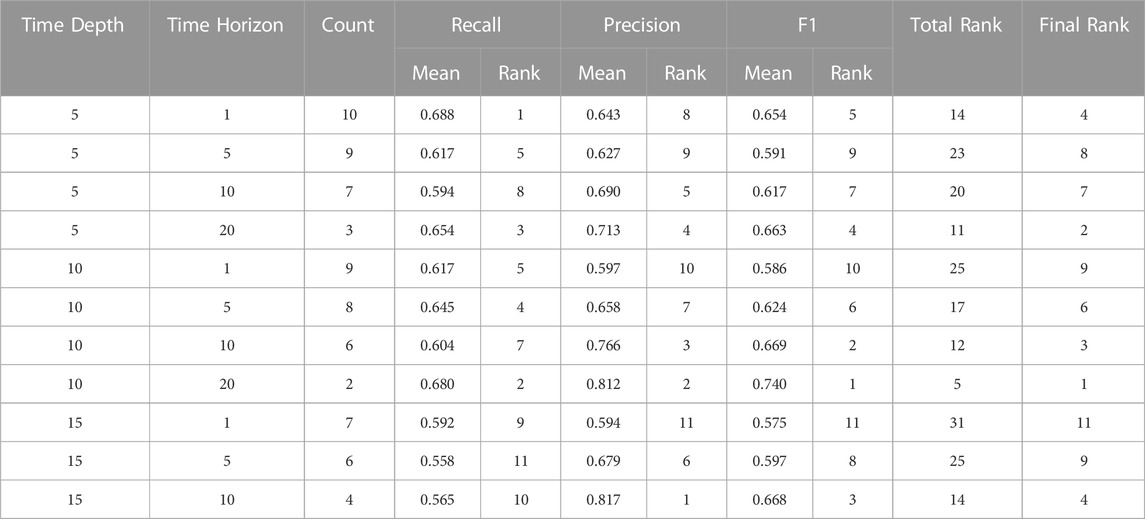
TABLE 3. Ranks of different combinations of time depth and time horizon evaluation for total land loss.
In addition to the ranking system, the model performance was also evaluated by the non-parametric Friedman test and Wilcoxon signed-rank test. As mentioned earlier, the null hypothesis is rejected if the p-value is less than 0.05 (α = 0.05). If the p-value is less than 0.05, there is a statistically significant difference in model performance. The Friedman test results suggested a statistically significant difference in model performance for multiple models used. The lowest p-value of Friedman test was found to be 0.042, while difference in model performance was assessed using precision values for 10-year time depth and 1-year time horizon, 10-year time depth 5-year time horizon, and 10-year time depth and 10-year time horizon. The results of the Friedman’s test are shown in Table 4.
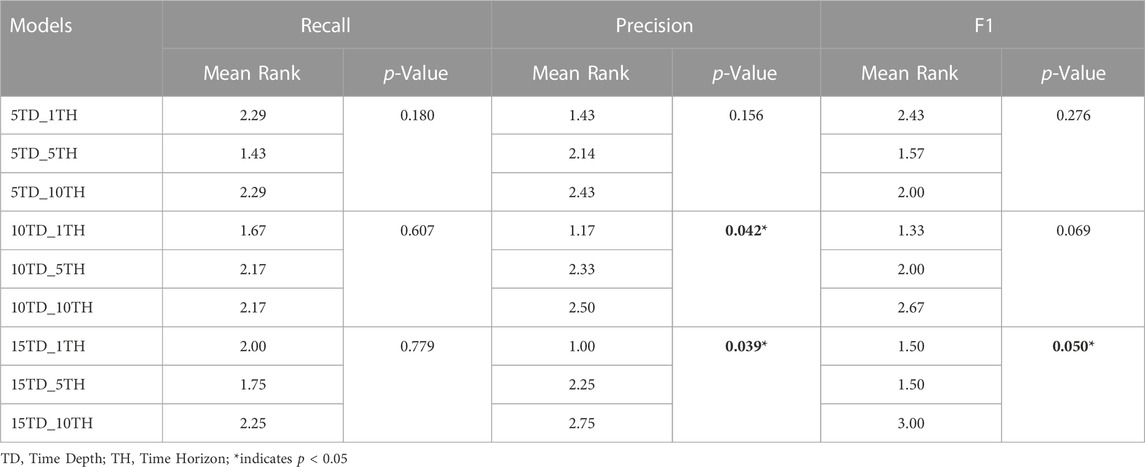
TABLE 4. Performance evaluations of different models using Friedman’s test.
The Friedman test does not provide any information on pairwise comparison. As a result, we used Wilcoxon signed rank test to discover the statistically significant performance difference between two models. The Wilcoxon test results suggest that multiple pairs of models exhibit statistically significant differences in prediction performance (α = 0.05). Among different model pairs, 5-year time depth and 1-year time horizon versus 5-year time depth and 5-year time horizon exhibit a p-value less than 0.05 for precision and F1 score. Other significant pairs of models are 10-year time depth and 1-year time horizon versus 10-year time depth and 10-year time horizon with a p-value less than 0.05 (α = 0.05) for both precision and F1 score. These statistically significant results of different pairs illustrate that there are multiple models where the results are significantly different from one another. Detailed results of Wilcoxon signed-rank tests can be found in Table 5.
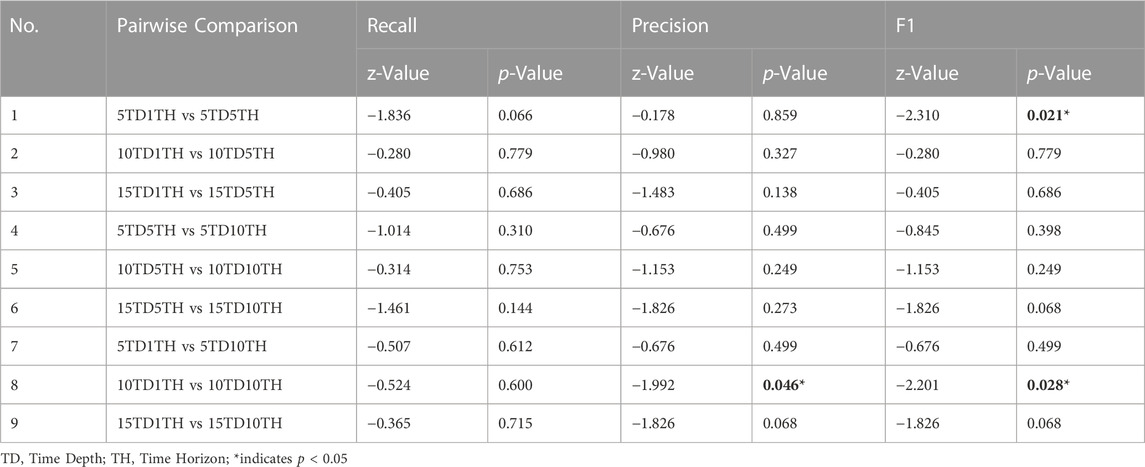
TABLE 5. Performance of different models by Wilcoxon signed-rank test.
3.3 Model comparison–land loss by different LULC
Our results suggest that the model with 10 years time depth and 20 years time horizon performed the best for agricultural land, forest, and water body. The 15 years time depth and 5 years time horizon model performed the best for the urban class. In case of barren land loss prediction, the 10 years time depth and 10 years time horizon model performed the best. The 15 years time depth and 1 year time horizon model perfomed the worst for land cover classes of agricultural land and urban. For forest, waterbody and barren land, the worst performing models were found to be 15 years time depth and 5 years time horizon, 10 years time depth and 1 year time horizon, and 5 years time depth and 1 year time horizon model, respectively. Table 6 shows the ranking of land loss prediction performance by different LULC.
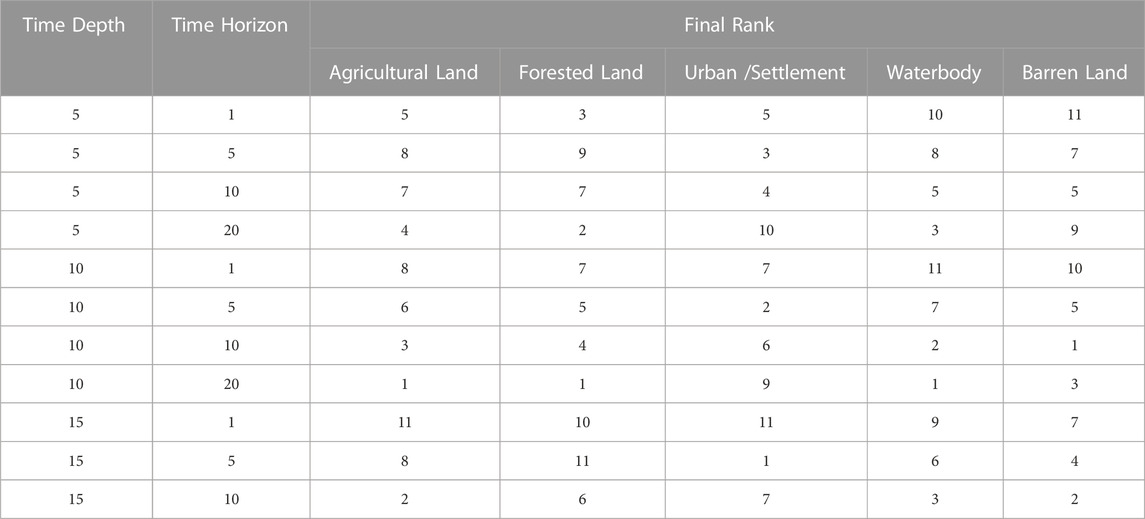
TABLE 6. Rank of different combinations of time depths and time horizons evaluation for land loss by LULC type.
While evaluating results for individual metrics used for assessing prediction performance, we found that the F1 rank had the most influence on the final ranking. It is expected because among the metrics used the F1-score was found to be most balanced metric for accuracy assessment. Due to the nature of variables used in the accuracy metric equation, the ranking result varied. For instance, in case of agricultural land, the 5 years time depth and 1 year time horizon performed best for recall. On the other hand, the best performing models based on precision and F1 score are: 15-year time depth and 10-year time horizon and 10-year time depth and 20-year time horizon models, respectively. In case of forest land, we found that 5 years time depth and 1 year time horizon model performed best based on recall value, 15-year time depth and 10-year time horizon performed best for precision and 10-year time depth and 20-year time horizon model performed best based on F1 score ranking. A detailed ranking for different metrics used can be found in Supplementary Tables S1–S5.
4 Discussion
In this study, land loss due to historical and predicted shoreline movement was quantified and assessed using Landsat satellite imagery from 1988–2021. This study used 34 years of data, enabling us to assess the land loss prediction performance for a rich time series of data. The study area is located in coastal Bangladesh along the eastern bank of Meghna river. Our previous studies found that this area is highly prone to erosion (Crawford et al., 2021; Islam and Crawford, 2022). This side of the riverbank is eroding at an alarming rate; thousands of economically marginalized inhabitants of the delta are continually displaced.
The study demonstrated that overall land loss decreased from the last half of the 1990 s to the mid of 2000 s (Figure 5). After 2005, the land loss increased until 2015, and afterward, it decreased again. The performance of 10-year time depth and 20-year time horizon model was found to be the best (Rank 1) for predicting future land loss. Among the different land use/cover predictions, the 10-year time depth and 20-year time horizon model was found to be the best model for predicting agricultural, forest, and inland waterbodies loss. In the urban and barren land loss prediction, the 15-year time depth and 5-year time horizon and 10-year time depth and 10-year time horizon models were found to be best performing models, respectively. Our analysis of Friedman and Wilcoxon signed-rank tests results suggests a statistically significant difference among the different model performances.
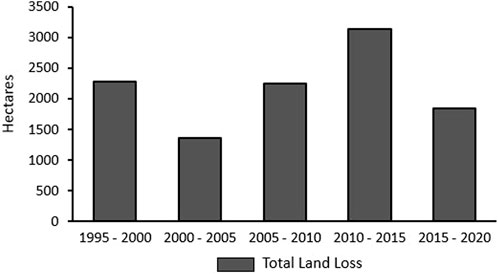
FIGURE 5. Total land loss in the studied area during 1995–2020.
Compared to much of the coastal erosion literature, this work draws from a 34 years time series of satellite-derived shorelines at annual temporal resolution. This time depth enables us to employ a temporal design strategy expected to yield a robust characterization of space-time erosion patterns. It also enables us to empirically assess the performance of future land use/cover loss predictions by predicting future shoreline positions depending on the time depths of input historical shoreline data. This is a methodological innovation with the potential for prediction of future land use/cover loss, and is applicable to other deltas and vulnerable coastal areas globally. With the increasing availability of high spatial/temporal remote sensing data, our methods can be generalized to derive a robust database of shorelines. We advocate developing and calibrating shoreline predictions using longer time-series data. While empirical results are specific to the project’s study area, results can inform the region’s future land use/cover loss and associated mitigation and adaptation strategies.
4.1 Limitations of the study
Our analysis provides one of the first assessments of how well predicted shoreline movement predicts amounts of LULC resources lost to erosion. Nevertheless, this study has limitations that point to future research opportunities. First, we predicted future shoreline positions solely based on the extrapolation of historical erosion rates. We know that coastal erosion rates might differ over time due to factors including flooding, cyclones, sea level rise, sediment transportation, extreme rainfall events, wave intensity, height, etc. (Sanuy and Jiménez, 2019; Bamunawala et al., 2021). Since this study didn’t consider these factors while predicting future shoreline positions, our prediction might get under or over-estimated for some years. Second, our analysis of LULC suggests that several classes were under or overestimated for some years. For example, urban classes were underestimated, primarily due to the built structure of these areas. Most of the houses in this part of the coast are located near/under homestead forest. As a result, we believe certain residential areas were classified as forest cover. Similar to the urban areas, water bodies like small ponds or narrow canals were classified as forest cover, and sometime even as barren land. On the other hand, we believe that the barren lands were overestimated for some years due to the depths of some wetlands or ponds being very shallow. Third, our study site is located in coastal Bangladesh where the rates of erosion are among the highest in the world. The prediction accuracy of future shoreline locations might vary based on the type, rates or location of the coast. Finally, we used Landsat imagery for both LULC and coastal erosion analysis. The pixel size of Landsat imagery is 30 m. High-resolution imagery might better and accurately detect shoreline movement and LULC. Where possible, future studies might be prioritized to investigate different types of coastal landscapes with differing erosion rates.
5 Conclusion
Coastal areas are impacted by erosion globally. The severity and magnitude of coastal erosion is often high in the deltaic environments. Due to erosion, people lose their households, agricultural lands, and livelihoods. In this study, we assess the impacts of historical and predicted shoreline change on different land use and land covers in Bangladesh’s Lower Meghna estuary region. This area is highly susceptible to the damaging coastal erosion. Long-term time series data at an annual scale during 1988–2021 were used to assess the prediction performance of different land use/cover losses. We employed a temporal design strategy of three different time depths and four different time horizons to predict future land loss for different scenarios. Agricultural lands were the top most lost land use class (76.04% of total land loss). Our results suggest that the best-performing model for land loss prediction was 10-year time depth and 20-year time horizon (rank 1) followed by the 5-year time depth and 20-year time horizon model. Among the individual land cover loss prediction, 10-year time depth and 20-year time horizon model were best performing model for the agricultural, forested and inland waterbodies loss prediction. Though the results are specific to our study area located in coastal Bangladesh, they can inform and help refine other models to predict land loss due to erosion in other parts of the coastal and deltaic environment worldwide. The results of this study provide spatiotemporally specific evidence useful for targeted coastal land management by planners, policymakers, and other relevant stakeholders.
Data availability statement
The raw data supporting the conclusion of this article will be made available by the authors, without undue reservation.
Author contributions
Conceptualization, MSI and TWC; methodology, MSI, TWC, and YS; software, MSI; validation, TWC; formal analysis, MSI; data curation, MSI and TWC; writing—original draft preparation, MSI; writing—review and editing, MSI, TWC, and YS; visualization, MSI; supervision, TWC and YS; funding acquisition, TWC. All authors have read and agreed to the published version of the manuscript.
Funding
This research was funded by the U.S. National Science Foundation, grant number 1660447. The article processing costs were partially supported by Virginia Tech's Open Access Subvention Fund (OASF).
Acknowledgments
We would like to thank Munshi Khaledur Rahman for his contribution in generating shorelines for the initial years while working as a postdoctoral researcher in this project.
Conflict of interest
The authors declare that the research was conducted in the absence of any commercial or financial relationships that could be construed as a potential conflict of interest.
Publisher’s note
All claims expressed in this article are solely those of the authors and do not necessarily represent those of their affiliated organizations, or those of the publisher, the editors and the reviewers. Any product that may be evaluated in this article, or claim that may be made by its manufacturer, is not guaranteed or endorsed by the publisher.
Supplementary material
The Supplementary Material for this article can be found online at: https://www.frontiersin.org/articles/10.3389/fenvs.2023.1144686/full#supplementary-material
References
Abdullah, A. Y. M., Masrur, A., Adnan, M. S. G., Baky, M. A. A., Hassan, Q. K., and Dewan, A. (2019). Spatio-temporal patterns of land use/land cover change in the heterogeneous coastal region of Bangladesh between 1990 and 2017. Remote Sens. 11, 790. doi:10.3390/rs11070790
Ahmed, A., Drake, F., Nawaz, R., and Woulds, C. (2018). Where is the coast? Monitoring coastal land dynamics in Bangladesh: An integrated management approach using GIS and remote sensing techniques. Ocean Coast. Manag. 151, 10–24. doi:10.1016/j.ocecoaman.2017.10.030
Balha, A., and Singh, C. K. (2022). “Comparison of maximum likelihood, neural networks, and random forests algorithms in classifying urban landscape,” in Application of remote Sensing and GIS in natural Resources and built infrastructure management water science and technology library. Editors V. P. Singh, S. Yadav, K. K. Yadav, G. A. Corzo Perez, F. Muñoz-Arriola, and R. N. Yadava (Berlin, Germany: Springer International Publishing), 29–38. doi:10.1007/978-3-031-14096-9_2
Bamunawala, J., Ranasinghe, R., Dastgheib, A., Nicholls, R. J., Murray, A. B., Barnard, P. L., et al. (2021). Twenty-first-century projections of shoreline change along inlet-interrupted coastlines. Sci. Rep. 11, 14038. doi:10.1038/s41598-021-93221-9
Brammer, H. (2014). Bangladesh’s dynamic coastal regions and sea-level rise. Clim. Risk Manag. 1, 51–62. doi:10.1016/j.crm.2013.10.001
Call, M. A., Gray, C., Yunus, M., and Emch, M. (2017). Disruption, not displacement: Environmental variability and temporary migration in Bangladesh. Glob. Environ. Change 46, 157–165. doi:10.1016/j.gloenvcha.2017.08.008
Chicco, D., and Jurman, G. (2020). The advantages of the Matthews correlation coefficient (MCC) over F1 score and accuracy in binary classification evaluation. BMC Genomics 21, 6. doi:10.1186/s12864-019-6413-7
Ciritci, D., and Türk, T. (2020). Assessment of the Kalman filter-based future shoreline prediction method. Int. J. Environ. Sci. Technol. 17, 3801–3816. doi:10.1007/s13762-020-02733-w
Crawford, T. W., Islam, M. S., Rahman, M. K., Paul, B. K., Curtis, S., Miah, M. G., et al. (2020). Coastal erosion and human perceptions of revetment protection in the lower Meghna estuary of Bangladesh. Remote Sens. 12, 3108. doi:10.3390/rs12183108
Crawford, T. W., Rahman, M. K., Miah, M. G., Islam, M. R., Paul, B. K., and Curtis, S. (2021). Coupled adaptive cycles of shoreline change and households in deltaic Bangladesh: Analysis of a 30-year shoreline change record and recent population impacts. Ann. Am. Assoc. Geogr. 111, 1002–1024. doi:10.1080/24694452.2020.1799746
Davis, K. F., Bhattachan, A., D’Odorico, P., and Suweis, S. (2018). A universal model for predicting human migration under climate change: Examining future sea level rise in Bangladesh. Environ. Res. Lett. 13, 64030. doi:10.1088/1748-9326/aac4d4
Ekumah, B., Armah, F. A., Afrifa, E. K. A., Aheto, D. W., Odoi, J. O., and Afitiri, A. R. (2020). Assessing land use and land cover change in coastal urban wetlands of international importance in Ghana using Intensity Analysis. Wetl. Ecol. Manage 28, 271–284. doi:10.1007/s11273-020-09712-5
Ghoneim, E., Mashaly, J., Gamble, D., Halls, J., and AbuBakr, M. (2015). Nile Delta exhibited a spatial reversal in the rates of shoreline retreat on the Rosetta promontory comparing pre- and post-beach protection. Geomorphology 228, 1–14. doi:10.1016/j.geomorph.2014.08.021
Hapke, C., Himmelstoss, E., Kratzmann, M., and Thieler, E. (2011). National assessment of shoreline change: Historical shoreline change along the new england and mid-atlantic coasts. https://digitalcommons.usf.edu/msc_facpub/2498.
Hossain, Md. S., Dearing, J. A., Rahman, M. M., and Salehin, M. (2016). Recent changes in ecosystem services and human well-being in the Bangladesh coastal zone. Reg. Environ. Change 16, 429–443. doi:10.1007/s10113-014-0748-z
Huang, C., Davis, L. S., and Townshend, J. R. G. (2002). An assessment of support vector machines for land cover classification. Int. J. Remote Sens. 23, 725–749. doi:10.1080/01431160110040323
Islam, M. S., and Crawford, T. W. (2022). Assessment of spatio-temporal empirical forecasting performance of future shoreline positions. Remote Sens. 14, 6364. doi:10.3390/rs14246364
Kanwal, S., Ding, X., Wu, S., and Sajjad, M. (2022). Vertical ground displacements and its impact on erosion along the karachi coastline, Pakistan. Remote Sens. 14, 2054. doi:10.3390/rs14092054
Khosravi, K., Pham, B. T., Chapi, K., Shirzadi, A., Shahabi, H., Revhaug, I., et al. (2018). A comparative assessment of decision trees algorithms for flash flood susceptibility modeling at Haraz watershed, northern Iran. Sci. Total Environ. 627, 744–755. doi:10.1016/j.scitotenv.2018.01.266
Kumar, A., Mondal, S., and Lal, P. (2022). Analysing frequent extreme flood incidences in Brahmaputra basin, South Asia. PLOS ONE 17, e0273384. doi:10.1371/journal.pone.0273384
Lal, P., Shekhar, A., Gharun, M., and Das, N. N. (2023). Spatiotemporal evolution of global long-term patterns of soil moisture. Science of The Total Environment, 867, 161470, doi:10.1016/j.scitotenv.2023.161470
Lambin, E. F., and Geist, H. J. (2008). Land-use and land-cover change: Local processes and global impacts. Springer Science & Business Media, Berlin, Germany.
Marconcini, M., Gorelick, N., Metz-Marconcini, A., and Esch, T. (2020). Accurately monitoring urbanization at global scale – The world settlement footprint. IOP Conf. Ser. Earth Environ. Sci. 509, 12036. doi:10.1088/1755-1315/509/1/012036
Mentaschi, L., Vousdoukas, M. I., Pekel, J.-F., Voukouvalas, E., and Feyen, L. (2018). Global long-term observations of coastal erosion and accretion. Sci. Rep. 8, 12876. doi:10.1038/s41598-018-30904-w
Moayedi, H., Jamali, A., Gibril, M. B. A., Kok Foong, L., and Bahiraei, M. (2020). Evaluation of tree-base data mining algorithms in land used/land cover mapping in a semi-arid environment through Landsat 8 OLI image; Shiraz, Iran. Geomatics, Nat. Hazards Risk 11, 724–741. doi:10.1080/19475705.2020.1745902
Monirul Alam, G. M., Alam, K., Mushtaq, S., and Clarke, M. L. (2017). Vulnerability to climatic change in riparian char and river-bank households in Bangladesh: Implication for policy, livelihoods and social development. Ecol. Indic. 72, 23–32. doi:10.1016/j.ecolind.2016.06.045
Muttitanon, W., and Tripathi, N. K. (2005). Land use/land cover changes in the coastal zone of Ban Don Bay, Thailand using Landsat 5 TM data. Int. J. Remote Sens. 26, 2311–2323. doi:10.1080/0143116051233132666
Nguyen, Q. H., and Takewaka, S. (2020). Land subsidence and its effects on coastal erosion in the Nam Dinh coast (vietnam). Cont. Shelf Res. 207, 104227. doi:10.1016/j.csr.2020.104227
Nhu, V.-H., Shirzadi, A., Shahabi, H., Singh, S. K., Al-Ansari, N., Clague, J. J., et al. (2020). Shallow landslide susceptibility mapping: A comparison between logistic model tree, logistic regression, naïve bayes tree, artificial neural network, and support vector machine algorithms. Int. J. Environ. Res. Public Health 17, 2749. doi:10.3390/ijerph17082749
Nicholls, R. J., Wong, P. P., Burkett, V., Codignotto, J., Hay, J., McLean, R., et al. (2007). Coastal systems and low-lying areas, https://ro.uow.edu.au/scipapers/164/.
Nickerson, R. S. (2000). Null hypothesis significance testing: A review of an old and continuing controversy. Psychol. Methods 5, 241–301. doi:10.1037/1082-989X.5.2.241
Olaniyi, A. O., Abdullah, A. M., Ramli, M. F., and Alias, M. S. (2012). Assessment of drivers of coastal land use change in Malaysia. Ocean Coast. Manag. 67, 113–123. doi:10.1016/j.ocecoaman.2012.05.029
Otukei, J. R., and Blaschke, T. (2010). Land cover change assessment using decision trees, support vector machines and maximum likelihood classification algorithms. Int. J. Appl. Earth Observation Geoinformation 12, S27–S31. doi:10.1016/j.jag.2009.11.002
Paul, B. K., Rahman, M. K., Crawford, T., Curtis, S., Miah, Md. G., Islam, R., et al. (2021). “Coping strategies of people displaced by riverbank erosion in the lower Meghna estuary,” in Living on the edge: Char Dwellers in Bangladesh springer Geography. Editors M. Zaman, and M. Alam (Berlin, Germany: Springer International Publishing), 227–239. doi:10.1007/978-3-030-73592-0_13
Paul, B. K., Rahman, M. K., Crawford, T., Curtis, S., Miah, M. G., Islam, M. R., et al. (2020). Explaining mobility using the community capital framework and place attachment concepts: A case study of riverbank erosion in the lower Meghna estuary, Bangladesh. Appl. Geogr. 125, 102199. doi:10.1016/j.apgeog.2020.102199
Poncelet, A., Gemenne, F., Martiniello, M., and Bousetta, H. (2010). “A country made for disasters: Environmental vulnerability and forced migration in Bangladesh,” in Environment, forced migration and social vulnerability. Editors T. Afifi, and J. Jäger (Berlin, Heidelberg: Springer), 211–222. doi:10.1007/978-3-642-12416-7_16
Radosavljevic, B., Lantuit, H., Pollard, W., Overduin, P., Couture, N., Sachs, T., et al. (2016). Erosion and flooding—threats to coastal infrastructure in the arctic: A case study from herschel island, yukon territory, Canada. Estuaries Coasts 39, 900–915. doi:10.1007/s12237-015-0046-0
Rahman, M. K., Crawford, T. W., Paul, B. K., Sariful Islam, Md., Curtis, S., Giashuddin Miah, Md., et al. (2021). “Riverbank erosions, coping strategies, and resilience thinking of the lower-meghna river basin community, Bangladesh,” in Climate Vulnerability and Resilience in the global South: Human Adaptations for sustainable futures climate change management. Editors G. M. M. Alam, M. O. Erdiaw-Kwasie, G. J. Nagy, and W. Leal Filho (Berlin, Germany: Springer International Publishing), 259–278. doi:10.1007/978-3-030-77259-8_13
Rahman, M., Popke, J., and Crawford, T. W. (2022). Resident perceptions of riverbank erosion and shoreline protection: A mixed-methods case study from Bangladesh. Nat. Hazards 114, 2767–2786. doi:10.1007/s11069-022-05489-3
Rahman, M. T. U., Tabassum, F., Rasheduzzaman, Md., Saba, H., Sarkar, L., Ferdous, J., et al. (2017). Temporal dynamics of land use/land cover change and its prediction using CA-ANN model for southwestern coastal Bangladesh. Environ. Monit. Assess. 189, 565. doi:10.1007/s10661-017-6272-0
Ren, J., Shao, Y., Wan, H., Xie, Y., and Campos, A. (2021). A two-step mapping of irrigated corn with multi-temporal MODIS and Landsat analysis ready data. ISPRS J. Photogrammetry Remote Sens. 176, 69–82. doi:10.1016/j.isprsjprs.2021.04.007
Rodriguez-Galiano, V. F., Ghimire, B., Rogan, J., Chica-Olmo, M., and Rigol-Sanchez, J. P. (2012). An assessment of the effectiveness of a random forest classifier for land-cover classification. ISPRS J. Photogrammetry Remote Sens. 67, 93–104. doi:10.1016/j.isprsjprs.2011.11.002
Sanò, M., Jiménez, J. A., Medina, R., Stanica, A., Sanchez-Arcilla, A., and Trumbic, I. (2011). The role of coastal setbacks in the context of coastal erosion and climate change. Ocean Coast. Manag. 54, 943–950. doi:10.1016/j.ocecoaman.2011.06.008
Sanuy, M., and Jiménez, J. A. (2019). Sensitivity of storm-induced hazards in a highly curvilinear coastline to changing storm directions. The tordera delta case (NW mediterranean). Water 11, 747. doi:10.3390/w11040747
Sarwar, G. M., and Khan, M. H. (2007). sea level rise A threat to the coast of Bangladesh. Int. Asienforum 38, 375–397.
Singh, K. V., Setia, R., Sahoo, S., Prasad, A., and Pateriya, B. (2015). Evaluation of NDWI and MNDWI for assessment of waterlogging by integrating digital elevation model and groundwater level. Geocarto Int. 30, 650–661. doi:10.1080/10106049.2014.965757
Thieler, E. R., Himmelstoss, E. A., Zichichi, J. L., and Ergul, A. (2009). The digital shoreline analysis system (DSAS) version 4.0 - an ArcGIS extension for calculating shoreline change. Reston, VA, USA: US. Geol. Surv. doi:10.3133/ofr20081278
Tseng, H.-H., Yang, M.-D., Saminathan, R., Hsu, Y.-C., Yang, C.-Y., and Wu, D.-H. (2022). Rice seedling detection in UAV images using transfer learning and machine learning. Remote Sens. 14, 2837. doi:10.3390/rs14122837
Wei, L., Zhang, B., and Wang, M. (2007). Effects of antecedent soil moisture on runoff and soil erosion in alley cropping systems. Agric. water Manag. 94 (1-3), 54–62. doi:10.1016/j.agwat.2007.08.007
Woodroffe, C. D., Nicholls, R. J., Saito, Y., Chen, Z., and Goodbred, S. L. (2006). “Landscape variability and the response of asian megadeltas to environmental change,” in Global Change and integrated coastal management: The asia-pacific region coastal systems and continental margins. Editor N. Harvey (Amsterdam, Netherlands: Springer Netherlands), 277–314. doi:10.1007/1-4020-3628-0_10
Xu, H. (2006). Modification of normalised difference water index (NDWI) to enhance open water features in remotely sensed imagery. Int. J. Remote Sens. 27, 3025–3033. doi:10.1080/01431160600589179
Zhang, K., Douglas, B. C., and Leatherman, S. P. (2004). Global warming and coastal erosion. Clim. Change 64, 41–58. doi:10.1023/B:CLIM.0000024690.32682.48
Keywords: coastal erosion, land loss, land use and land cover, Lower Meghna river, Bangladesh
Citation: Islam MS, Crawford TW and Shao Y (2023) Evaluation of predicted loss of different land use and land cover (LULC) due to coastal erosion in Bangladesh. Front. Environ. Sci. 11:1144686. doi: 10.3389/fenvs.2023.1144686
Received: 14 January 2023; Accepted: 03 April 2023;
Published: 19 April 2023.
Edited by:
Xiaoyang Zhang, South Dakota State University, United StatesReviewed by:
Preet Lal, Michigan State University, United StatesKyle D. Buck, United States Environmental Protection Agency (EPA), United States
Copyright © 2023 Islam, Crawford and Shao. This is an open-access article distributed under the terms of the Creative Commons Attribution License (CC BY). The use, distribution or reproduction in other forums is permitted, provided the original author(s) and the copyright owner(s) are credited and that the original publication in this journal is cited, in accordance with accepted academic practice. No use, distribution or reproduction is permitted which does not comply with these terms.
*Correspondence: Md Sariful Islam, shariful@vt.edu