Assessment of past and future land use/cover change over Tordzie watershed in Ghana
 Mexoese Nyatuame
 Sampson Agodzo
 Leonard Kofitse Amekudzi1
 - 1Kwame Nkrumah University of Science and Technology, Kumasi, Ghana
- 2Ho Technical University, Ho, Ghana
Land use/ land cover (LULC) change has been identified as the main driving force of global change. The study investigated LULC change in Tordzie watershed in Ghana and predicted the future development. The supervised classification procedure was applied to Landsat images of 1987, 2003, and 2017. The cellular automata–Markov model embedded in IDRISI 17 software was employed to model LULC for the years 2030 and 2050. The trend of LULC change was exploited from 1987 to 2003, from 2003 to 2017, and projected to 2030 and 2050. Settlement and crop land, respectively, increased from 2.68% to 16.46% in 1987 to 3.65% and 53.47% in 2003 and finally to 20.61% and 58.52% in 2017. Vegetation cover declined from 23.2% in 1987 to 13.9% in 2003 and finally to 11.3% in 2017. The annual rate of change was determined. In 2030 and 2050, the dominant land use type will be crop land (56%). However, it decreased between 2017 and 2030 by −1.73%. The findings of the study are very relevant to land and water resource planners, policy formulators and implementers, and environmental and climate change advocates. Sustainable land use policy and its implementation are recommended.
1 Introduction
The anthropogenic modification of the surface of the Earth by human activities induced land use/land cover (LULC) changes. Although the modification of the Earth’s surface by people existed since time immemorial to support livelihood for humankind’s continual existence on Earth, the current state of LULC changes is alarming with its attendant degradation of the ecosystem due to increasing population. The current LULC changes are carried out in an unsustainable manner and thus negatively endangering posterity. The mentioned changes are the driving forces behind the local, regional, and global changes in the climate. The extreme climate events such as flush floods and droughts could also be attributed to LULC (Nyatuame and Agodzo, 2017) since LULC modifies the hydrology of a watershed or a catchment area.
The global change has become a topical issue and has attracted the attention of the world leaders and scientists. In the study and analysis of global change, the LULC plays an essential role. The data available on LULC changes and the rate of change provide critical information to aid in decision-making of ecological management and environmental planning for the future (Chowdhury et al., 2018; Mengist et al., 2022). The change detection procedure has an objective of identifying LULC changes on digital images that provide change features between different timelines (Lu et al., 2019). Minale (2013) pointed out that the increase in LULC changes is alarming and its implication is enormous at local, regional, and global levels with high negative consequences. Schulp et al. (2018) employed the mapping and modeling technique to assess the impact of the past and future changes in LULC on Europe’s cultural landscape. The study was aimed to decipher the threats to future cultural landscape as a result of LULC changes.
LULC changes have direct and indirect impact on the hydrological cycle and climate on the local, regional, and global scale (Butt et al., 2015; Nyatuame et al., 2020). LULC does not only impact the hydrological cycle but also biodiversity (Rawat and Kumar, 2015) and land productivity. The hydrological cycle is impacted by deforestation locally as trees with extensive root networks and capable of accessing deep reservoirs of moisture are replaced with pasture or crop land (Bagley, 2011). According to Mengist et al. (2022), deforestation has a bio-geophysical impact on the energy balance. Bagley (2011) reported the previous finding leads to a sharp reduction in latent heat flux as a consequence and a small reduction in net radiation. In addition, Bagley (2011) argued that there is moderate increment in sensible heat flux and storage of surface energy. Coe et al. (2011) further argued that runoff increases as a consequence of deforestation to balance the excess moisture, which alters the basin flow.
Remote sensing (RS) and geographical information systems (GIS) are powerful tools employed to acquire accurate and timely information on the spatial distribution of LULC changes (Das et al., 2021). GIS offered an environment for gathering, storing, presenting, and examining digital data for change discovery (Liping et al., 2018; Kafy et al., 2020). Nicu and Stoleriu (2019) employed RS and GIS techniques to land use changes and dynamics over a century around churches of Moldavia, Bukovina, and Northern Romania to ascertain the challenges and future perspectives of LULC. The study of Nicu and Stoleriu (2019) found out that the land use dynamic was dominated by anthropogenic phenomena and therefore recommended the deployment of the sustainable land use policy and the conservation of the cultural landscape’s biocultural diversity.
Remotely sensed data are normally employed for differencing of image, post-classification comparison (PCC), and vegetation index differencing (Alam et al., 2020). The images from different periods are compared independently so as to distinguish changes in land cover (Kalra et al., 2013). The images from different dates are classified separately, which do not require modification for direct comparison (Cheruto et al., 2016).
In Ghana, a number of studies have been conducted in recent times to analyze LULC changes using the techniques of RS and GIS to assess the changes of LULC both at the national and watershed levels (Appiah et al., 2015; Basommi et al., 2016). It has been reported by most researchers that human activities like illegal lumbering, urbanization, and agricultural land expansion are responsible for the LULC (Awotwi et al., 2018; Forkuor, 2014). Sarfo et al.(2023) also conducted a study in south-eastern Ghana on class dynamics and relationship between land use systems and temperature, employing geospatial technologies on satellite images and found out the drivers of LULC as political, social, economic, scientific, and biophysical in nature.
However, a search of the literature revealed the gap of no LULC change analysis employing remote sensing-based technology at the microclimate level of Tordzie watershed. The LULC dynamics is not expected to be the same across board but vary from one location to another with its implications. Therefore, a study of LULC dynamics in Tordzie watershed is justified. The Tordzie basin is an important basin in the Volta region of Ghana. It has enormous economic benefits to its catchment dwellers. The water from the basin serves for domestic use, and for agricultural and industrial purposes among others (Nyatuame et al., 2022). As has been established, LULC changes influence the hydrology and the LULC assessment of Tordzie is essential because of the implications for water availability and others. Tordzie watershed encompasses key towns such as Shia, Kpedze, Honuta, Kpetoe, and Tordzinu besides other smaller towns. The 2021 national housing and population census in Ghana estimated the population at Kpedze to be around 27,000, Shia to be around 2000, Honuta estimated to be 1800, Kpetoe to be around 40,000, and Tordzinu also estimated to be 20,000. According to GSS (2021), the population around the watershed is increasing at the rate of 2.5% per annum; therefore, the future LULC situation could be precarious if the future scenario is not known and measures are adopted to ensure sustainability. Against the aforementioned background, this study seeks to assess the LULC and analyze its futuristic ramifications. The findings of this research will guide the environmental policy formulators and implementers by churning out valuable information, the way forward and the adoption of more sustainable development plans as a strategy in lines with sustainable development goals (SDGs) 11, 13, and 15. Again, the scientific knowledge and understanding of LULC dynamics are very essential for both medium- and long-term watershed restoration and management, as well as developing a strategy for soil and water resource conservation plan.
For posterity’s sake, the historical LULC evaluation would be accompanied with future development analysis. A modeling technique is the answer to the quest for future demand and supply analysis. A number of working models have been employed by the scientists in modeling LULC changes (Karimi et al., 2018). An example of such a model is the cellular automata (CA) (Arunyawat and Shrestha, 2016) and Markov chain (Awotwi et al., 2018) model used for the prediction of LULC change. In this study, the CA–Markov model was employed to model the future LULC change and analysis. The primary reason for choosing the CA–Markov model for this research is because of reports of its high accuracy and other advantages over other models (Gidey et al., 2017). It is also universal and effective. The CA–Markov model was adopted by Luo et al (2015) to study the dynamics of landscape in Central Asia. Matlhodi et al. (2021) also employed the same model to analyze future land use and cover change in Botswana and its implication for water resources.
The objective of the study is to investigate historical LULC changes using satellite imagery and GIS in Tordzie watershed and predict future LULC.
2 Materials and methods
2.1 Study area
The study was carried out in Tordzie watershed in Ghana, Figure 1. The geocodes of stations in Tordzie watershed were Honuta (6o83′0″N, 0053′0″E), Kpetoe (6033′0″N, 0069′0″E), and Tordzinu (505′0″N, 0045′0″E). The digital elevation model (DEM) of the watershed is shown in Figure 1. Tordzie is a trans-boundary basin; the area in Ghana constitutes 83.7%, and the remaining in Togo is 16.3% (WRC, 2010); however, the current study is conducted in the area within Ghana.
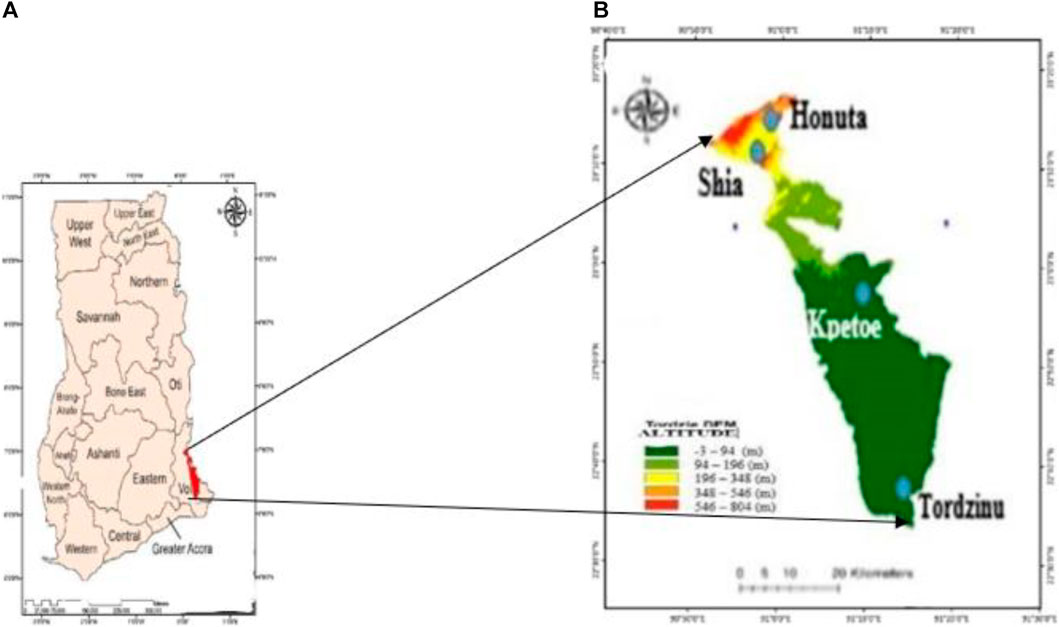
FIGURE 1. Map of Ghana in relation to the Volta region (A), Tordzie watershed, and DEM (B).
2.2 Data used
A cloud-free Landsat multispectral scanner (MSS) and Enhanced Thematic Mapper Plus (ETM+) imageries obtained on January and February 1987, December 2003, and January 2017 were downloaded from the USGS–EROS archive and used. The summary of the Landsat imagery details is presented in Table 1. The Landsat images used for processing were based on what is available and its quality for the area of the study for the chosen years. The limitation with the data was the unequal interval of good-quality Landsat images available for the study area for analysis.
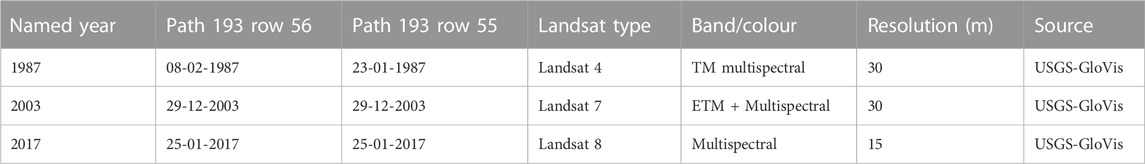
TABLE 1. Characteristics of satellite images used.
2.3 Image preprocessing
Image pre-processing was carried out to obtain useful data from the satellite images. Data were pre-processed in ENVI 5.0 for geo-referencing, mosaicking, and sub-setting of the image on the basis of the area of interest (AOI). The pre-processing involves actions like geometric corrections, image enhancement, noise removal, and topographic corrections. The acquired data were stacked into composite images as the first step. The layers were stacked to create a multispectral image after combining the required bands. To make the data compatible with each other, projection transformation was carried out and assigned UTM WGS-84,30N projection. The AOI was extracted from the images using the subset option by employing a second-degree polynomial to rectify the scene. The images were taken to ArcMap 10.2.2 for the clipping of the AOI, which is the Tordzie basin. The changes in the LULC type were detected on pixel count from the analysis in ArcMap.
2.4 Image classification
The image classification has the objective of automatically categorizing all pixels in an image into land cover classes. In this study, the images were classified into thematic maps using supervised classification. A band combination of visible and infrared color composites was prepared by delineating the training areas. Signatures and overlapping signatures were merged into one using a histogram tool to compare them. This assisted in avoiding overlapping spectral signatures and thus clearly representing the cover classes distinctly without any ambiguity. The maximum likelihood algorithm (MLA)-supervised classification procedure was adopted as it has more advantages (Talukdar et al., 2020).
2.5 Post-classification
In order to improve the classification accuracy to avoid misclassification, Google Earth Explorer was used to cross-check or validate the classification on the ground. Based on the ground verification, the necessary corrections were made.
2.6 Assessment of accuracy
In order for the classified land use classes to be dependable and useful for analysis of changes, it is required that the accuracy assessment for individual classification be performed. The accuracy assessment technique of classification, which is the most popular, is the error matrix. Kappa is a measure of agreement between pre-defined producer ratings and user assigned ratings. Kappa statistic was computed for the classification using error matrices. It is calculated by the following formula:
where P(A) is the number of times the k raters agree and P(E) is the number of times the k raters are expected to agree only by chance (Flight and Julious, 2015).
2.7 LULC change detection
LULC identification is the procedure of recognizing changes in the state of an object or phenomenon by observing it at different times. Thus, a new thematic layer was also produced from the two five-class maps, containing different combinations of ‘‘from–to’’ change classes. The general procedure for LULC detection employs the PCC method by comparing the state of the land imagery at two different independent dates (Hassan et al., 2016). The LULC-type classification employed in the study is presented in Table 2. In addition, the flow chart showing procedures followed in LULC detection, quantification, and projection is displayed in Figure 2.
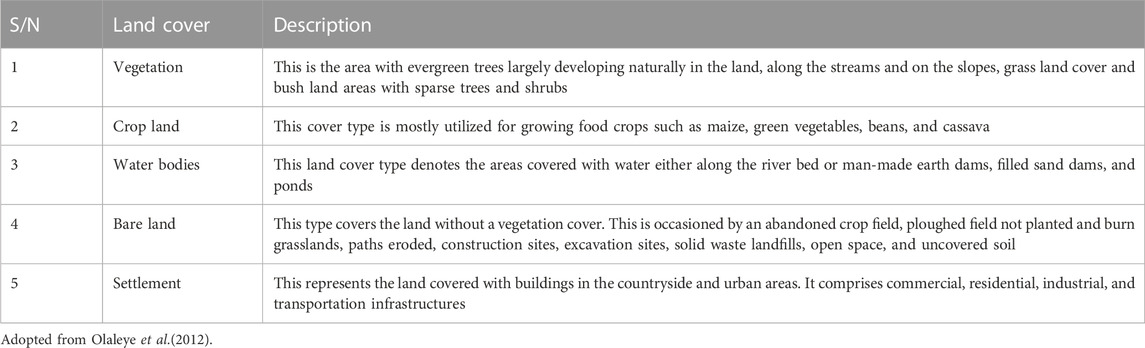
TABLE 2. LULC-type description.
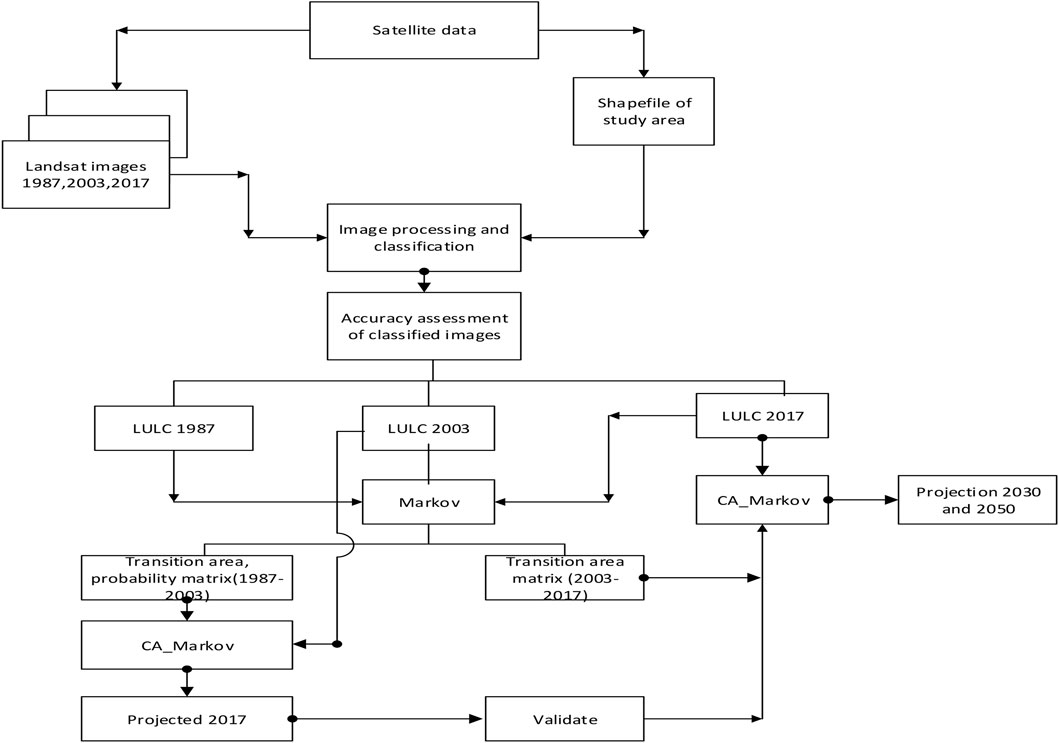
FIGURE 2. Summary of LULC and the cellular automata (CA)–Markov model.
2.8 LULC-type computation
Subsequent to image classification, according to Meshesha et al (2016), the geographical extent in hectares for the LULC type must be calculated for each time period and the extent of change in the LULC type within and between periods compared. The variation in the LULC type was performed using ArcGIS 10.2.2 software. In the analysis of the change, relation (2) was used to compute the rate of change in hectares (ha) per year (ha/y.) and the percentage (%) share of each class type in the period of study.
where
The rate of change of the LULC cover type was computed using relation (3):
where
For the purpose of achieving the objective of evaluating the LULC change in Tordzie watershed, three land cover maps were created with a blend of satellite image bands. With the aim of limiting classification blunder and dissimilarities in the vegetation development consistently, all data were gathered for the periods of December, January, and February with the cloud cover set to zero.
2.9 Land use modeling in the CA–Markov model
IDRISI 17 embedded with land change modeling (LCM) was employed to predict the future LULC for analysis. The following procedures were followed: analysis of change, transition potential modeling, prediction of change, and validation of the model.
2.9.1 Transition potential modeling
A number of transition maps were developed arising out of location of change. The transition maps denote the suitability of a pixel count to turn to other LULC classes in each transition. The transition probability matrix was generated from the transition maps to quantify the likelihood of a particular land use type transitioning into another type in the future.
2.9.2 Change prediction
The change rates calculated previously with the LCM were employed in addition to the transitional potential maps produced subsequently to predict the scenario of future 2030 and 2050. The land use map of 1987–2003 was used to predict the LULC map of 2017. The simulated LULC map of 2017 was compared with the LULC map of 2017 classified as a way of validation. The LULC map of 2017 was employed as the baseline for future prediction.
2.9.3 Model validation
The aim of the validation process was to determine the quality of the map predicted in 2007 in relation to the 2017 LULC map. Kappa indices of agreement (KIA) were employed to compare the spatial proximity of land cover classes between two models. The validation module in IDRISI was employed for validating the model resulting in the parameters listed as Kno = 0.8302, Klocation = 0.7899, and Kstandard = 0.6935. According to Mishra et al. (2018), Kno is the most important parameter for the accuracy assessment of the simulation. Klocation is the ability of the simulation to identify the location. Klocation of 1 is perfect for predicting the future LULC. As observed, with a Klocation of 0.7899, it means there is uncertainty with the future prediction with the CA–Markov model.
3 Results and discussion
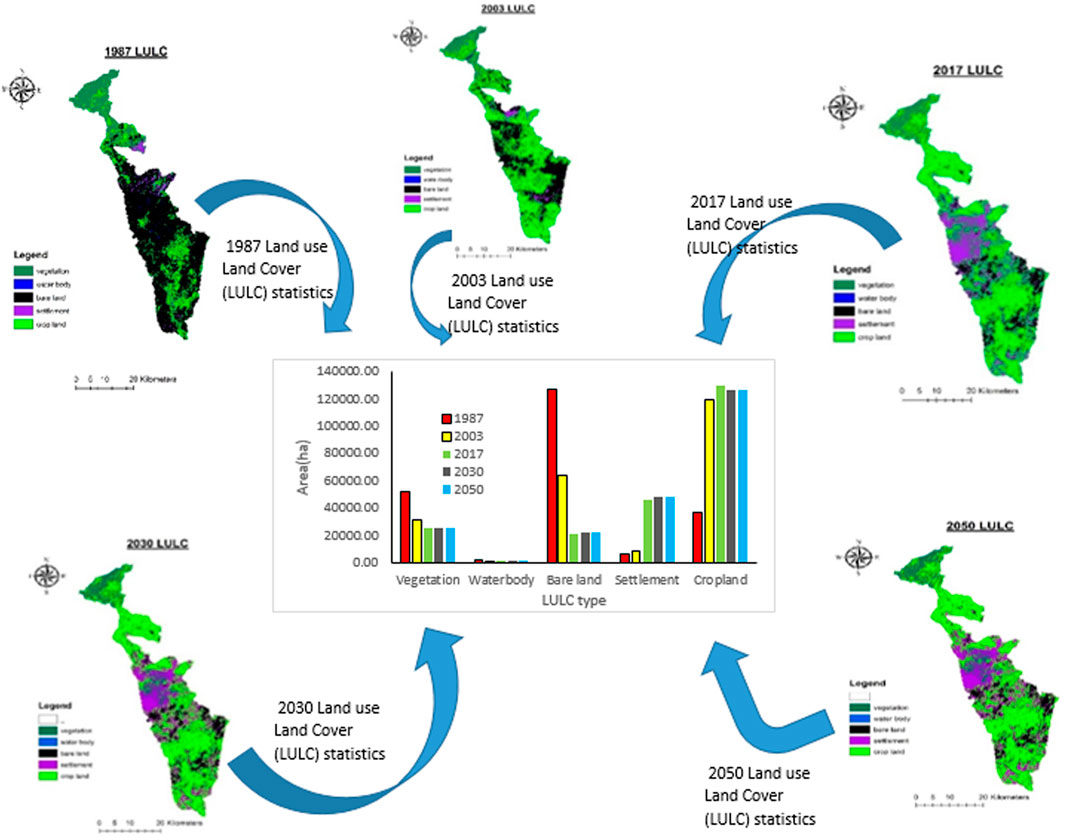
The LULC maps for the years of 1987, 2003, and 2017 are shown in Figure 3. The assessment of accuracy of the LULC-type classification was carried out using Kappa coefficient for different years, as presented in Table 3.
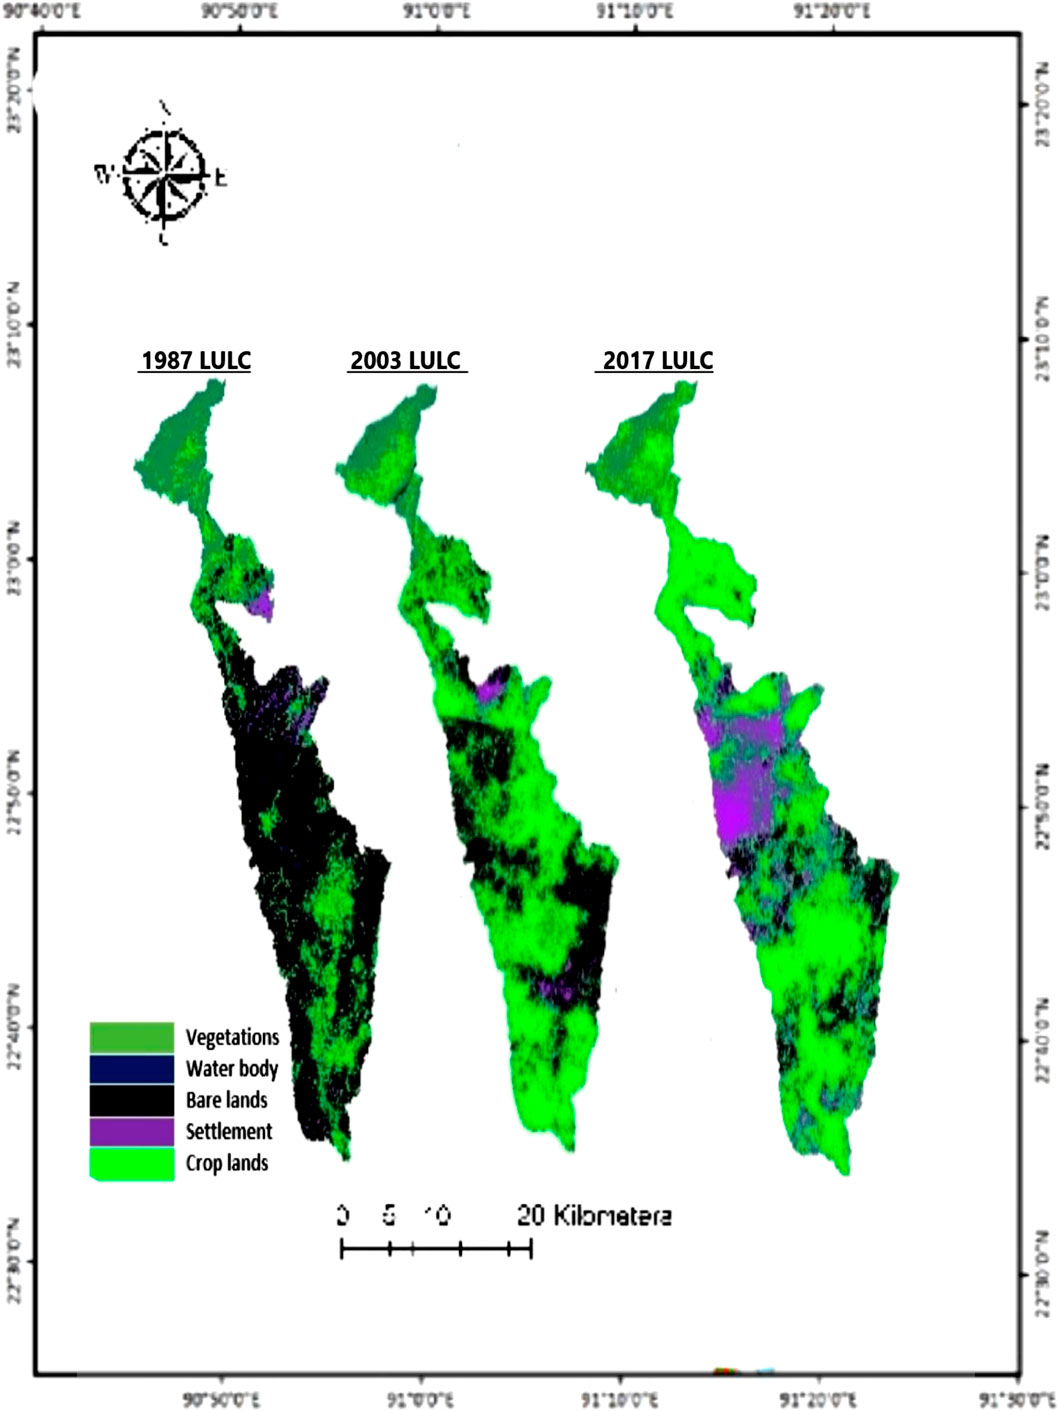
FIGURE 3. LULC maps for Tordzie watershed.
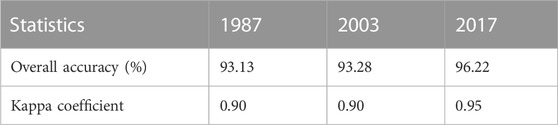
TABLE 3. Accuracy assessment statistics.
3.1 The dynamics of LULC
The land cover, change rate, and the rate of change per annum are summarized in Table 4 in area and in percentage for Tordzie watershed. In the year 1987, the bare land was the main LULC type with 57% (126,875.38 ha) of the total land area. The mentioned LULC type was followed by vegetation (23.22%), crop land with 16.46% (36,665.27 ha), settlement (2.68%), and finally water bodies (0.70%). The vegetation cover, water bodies, and bare lands progressively decreased from 23.22%, 0.70%, and 56.95% in 1987 to 13.94%, 0.08%, and 28.87% in 2003 and lastly to 11.30%, 0.01%, and 9.55%, respectively, in 2017. However, the settlement and crop land, respectively, increased from 2.68% to 16.46% in 1987 to 3.65% and 53.47% in 2003 and finally to 20.61% and 58.52% in 2017. When vegetation cover and water bodies reduced at the given percentages mentioned, there was an increment in settlement and the agricultural land area under production. These observations are in line with the similar studies in other jurisdictions (Awotwi et al., 2018). The implications of the vegetation cover decline are enormous such as the loss of biodiversity and reduction in land productivity among others (Rawat and Kumar, 2015).
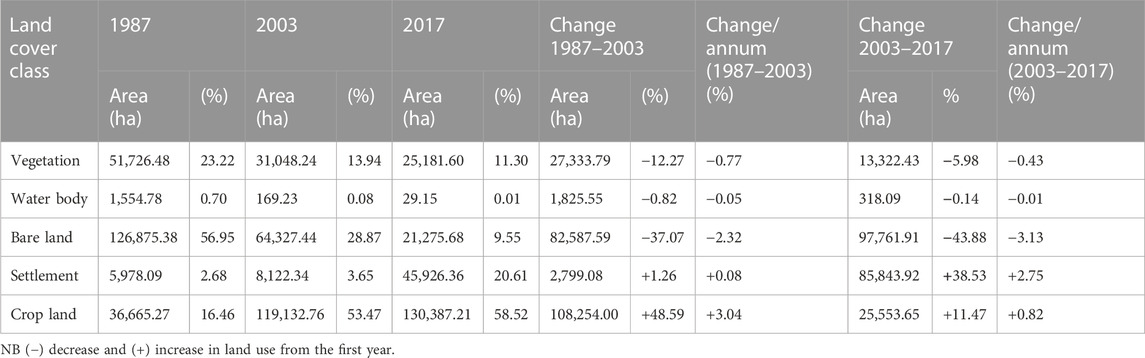
TABLE 4. LULC change statistics.
3.2 The rate of LULC change
The rate of change of the LULC type is indicated in Table 4. The rate of vegetation loss per annum from 1987 to 2003 was −0.77% and from 2003 to 2017 was −0.43%. The loss of bare land from 1987 to 2003 was −2.32% per annum and −3.13% per annum from 2003 to 2017 and that of the water body for the same stated period were −0.05% and −0.01%, respectively, per annum. On the other hand, the rate of land gain by settlement and crop land for the mentioned period were +0.08% and +2.75%, and +3.04 and +0.82%, respectively, per annum. The result implies the intensive gain in the settlement and crop land is at the expense of massive loss of vegetation and bare land. The result obtained is in agreement with Appiah et al. (2015) and Basommi et al. (2016), who conducted a similar study at different parts of Ghana.
3.3 Implication of LULC changes
The implication of the conversion of vegetation to crop land and settlement is the modification of the evapotranspiration regime, thus impacting the precipitation. This is because vegetation or forest has high evaporation, which contributes to atmospheric circulation. Thus, deforestation reduces evapotranspiration due to vegetation loss with the consequences of reduction in atmospheric moisture circulation and leads to declining precipitation. The aforementioned assertion is buttressed by the contemporary literature (Snyder, 2010; Spracklen et al., 2012).
The aforementioned scientific consensus on the negative impact of deforestation is further supported by Aragao (2012). He stated that the canopy of forest reprocesses water more efficiently through evapotranspiration than sparsely vegetated surfaces like farmlands. There is also an associated flood risk as a result of loss of vegetation. This is because the canopies of forest intercept rainfall, increase soil infiltration capacity, lower runoff, and reduce evaporation of water from the canopy. The aforesaid deduction agrees with Fonseca et al. (2022), who revealed in their study that 10% decrease in natural forest is responsible for increased flood frequency of between 4% and 28%. Lobell et al. (2011) related declining rainfall and rising temperatures to de-vegetation, leading to a reduction in crop yield with an estimated 10% decline in crop yield due to 1% rise in temperature.
The reduction in the vegetation cover also has a health implication as the quality of air is deteriorated because plants give oxygen and absorb carbon dioxide. A typical example is where slash and burn are employed in converting vegetation to farm land; air pollution results from emission of smokes. This smoke includes carbon particles smaller than 1.5 µm in size, which is harmful to human health.
3.4 Land loss/land gain
The trend of the LULC change generally is a shift of vegetation, bare lands, and water bodies to crop land and settlement. When the vegetative cover of the land is being lost together with the water bodies and bare lands, there is a gain for the farmland and settlement. The magnitude of the change from 1987 to 2003 and 2003 to 2017 is illustrated in Figures 4, 5. The total vegetation loss from 1987 to 2017 was −26544.88 ha (−11.92%) and that of the bare land was −105599.7 ha (−47.4%). The gain in settlement and crop land for the same period was +39,948.27 ha (+17.93%) and +93,721.94 ha (+42.06%), respectively. The trend of the reduction of vegetation cover corresponded with the expansion of the settlement area and agricultural land to cater for the food security needs of the burgeoning population. The negative and positive trends in LULC detection corresponded to the gain or loss of the specific land cover.
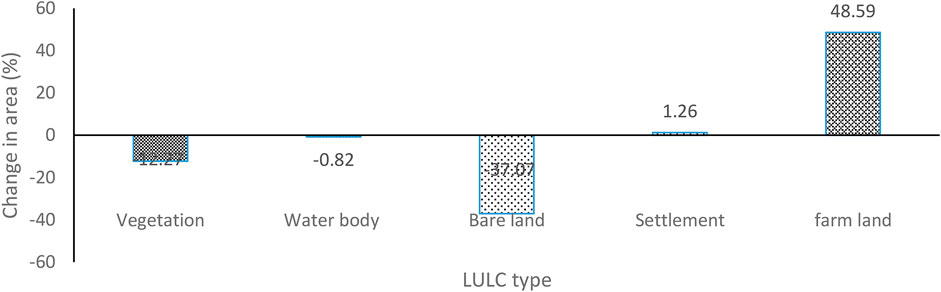
FIGURE 4. Land gain/loss from 1987 to 2003.
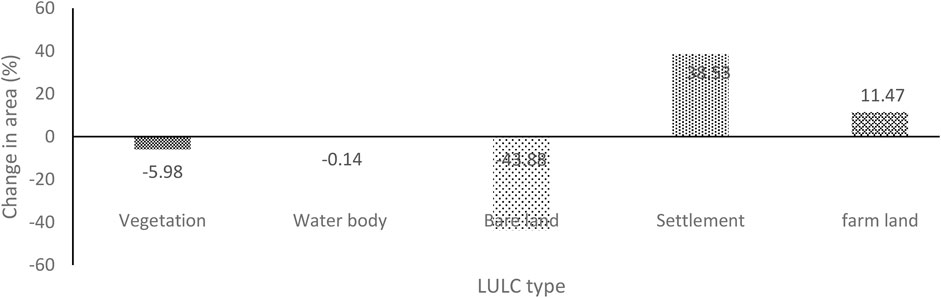
FIGURE 5. Land gain/loss from 2003 to 2017.
The implication of the fast rate of the vegetation decline and the sprawl of urbanization is that climate change impacts will be exacerbated. As the urbanization sprawl, it leads to the destruction of the natural ecosystem, water quality, and the impairment of biodiversity due to development of the area. Urbanization, as a result of vegetation loss, culminates in the loss of terrestrial carbon stored in vegetation biomass and thus increase carbon footprint in the ecosystem, which contribute to climate change (Seto et al., 2012).
3.5 Prognosis of LULC based on the CA–Markov Chain model
Land cover change has substantial influence on the functioning of social, economic, and ecological systems and enormous benefits for its sustenance (Mahmoud and Alazba, 2015). Predicting the future impacts of land cover changes on an area necessitates an understanding of the effects that historic land cover changes have exerted on the environment. The projected land cover in 2030 and 2050 is shown in Figures 6A, B, respectively.
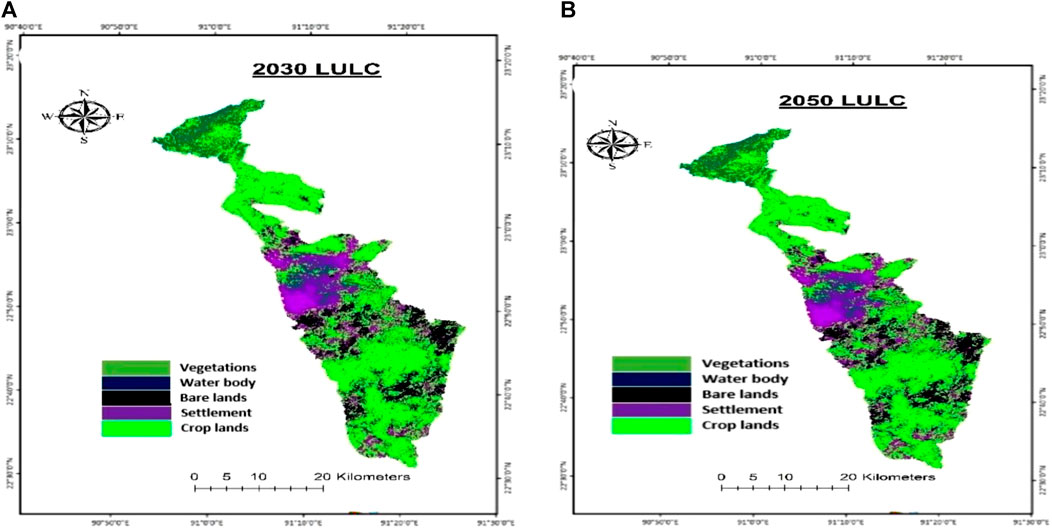
FIGURE 6. Projected LULC map of 2030 (A) and 2050 (B).
3.6 Transition probability matrix analysis
A significant part of detecting change is to determine what is really changing and which LULC type is changing to the other. Table 5 provides the probability that each land cover type will change to the other type. Table 5 shows that the rows indicate the older land cover types, while the columns represent the newer types. The derived probability matrix was employed in predicting the LULC of 2030 and 2050. For instance, between 2003 and 2017, the probability of vegetation changing to crop land was 0.5437 or 54.37% and the converse was 0.0757 or 7.57%. The probability of vegetation converting to crop land has increased from 0.4923 in 1987–2003 to 0.5437 in 2003–2017. The transition probability matrix assists in knowing which changed land use type is due to be converted to another land use type and thus aids in better decision-making for mitigative strategies to manage the ecosystem.
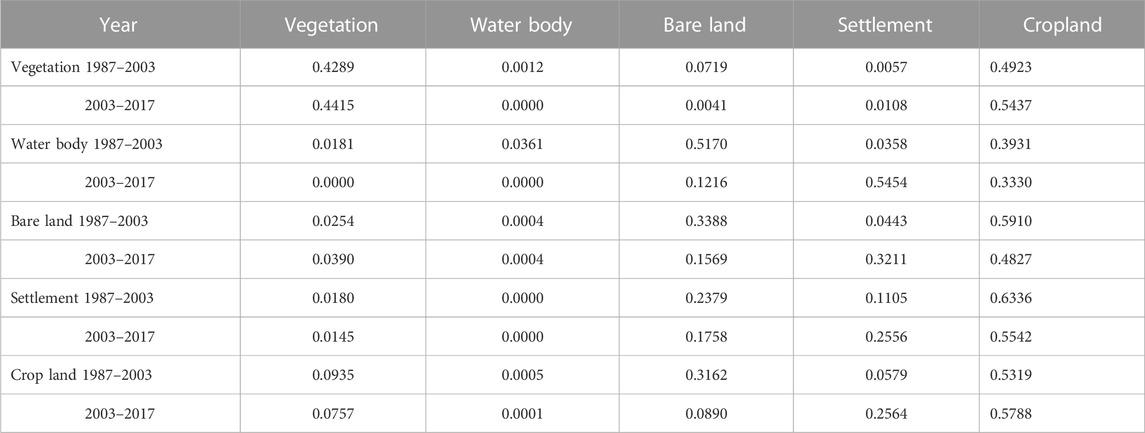
TABLE 5. Markov Chain transition probability matrix for periods 1987–2003 and 2003–2017.
3.7 The driving force of LULC change
Rapid deforestation, as a result of urbanization, may be due to the increase in population, which is leading to change in the land use pattern. According to GSS (2021), population is increasing at the rate of 2.5% per annum and may be playing a significant role in the LULC dynamics. The implications of population increase are many and thus put pressure on the use of natural land resources. The cutting of trees for fuel wood, bush fires, and other economic activities of high market value are the main causes of accelerated deforestation in the watershed. This occurs as there is no alternate livelihood support for rural dwellers who depend a lot on the natural resources for survival. Thus, an increase in population drives the increase in the agricultural land area and the settlement area since there is the need to produce food in response to growing population and the demand for settlement. Evidence abounds in the literature to buttress the point that human activities are the main causes of LULC change dynamics (Shiferaw, 2011). Again, it was also reported by Toma et al. (2023) that population growth, agricultural expansion, illegal wood extraction, increase in the settlement area or built-up area, urbanization, and environmental policy gaps are the major drivers of LULC. The drivers of LULC have been categorized into natural causes and human-induced or anthropogenic stresses. The anthropogenic stresses in relation to biophysical factors may be contributing to the LULC.
The anthropogenic stresses of LULC are further classified as direct causes and underlying causes according to Sarfo et al. (2023). According to Sarfo et al. (2023), five primary drivers of LULC, namely, political, social, economic, scientific, and environmental factors, are considered to be the underlying influencers on human-induced factors.
In 2030 and 2050, the crop land will be 56.8% (126,527.6 ha) and 56.6% (126,085.10 ha), respectively, of the watershed. However, there is a reduction in the crop land between 2017 and projected 2030 by −3,859.61 ha (−1.73%) with a decreasing rate of −0.13% per annum for the stated period. The settlement will increase by 2.4% for the same period. The settlement area projected will continue to increase until 2030 and 2050, and it will be 21.85% (48,688.44 ha) and 21.86% (48,711.43 ha) of the LULC type in the watershed, respectively. The detail projected statistics are presented in Table 6 and Figure 7. The loss from the crop land in the projected will be gained by settlement, bare land, and vegetation. Nonetheless, the net change analysis reveals a decrease in the vegetation area from 1987 to the projected 2030 and 2050.
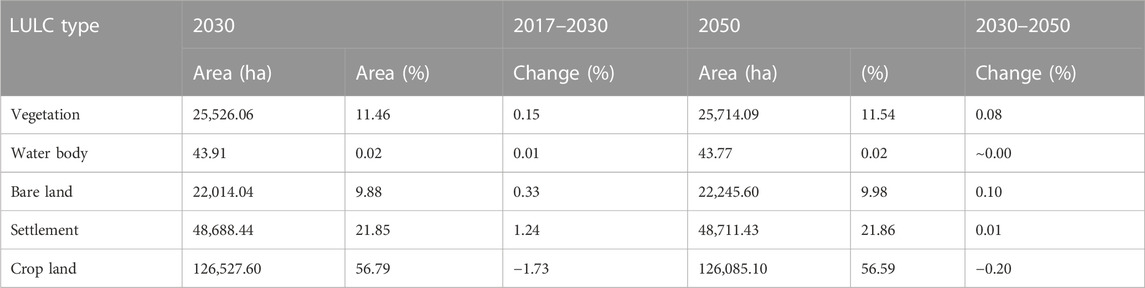
TABLE 6. Projected LULC statistics.
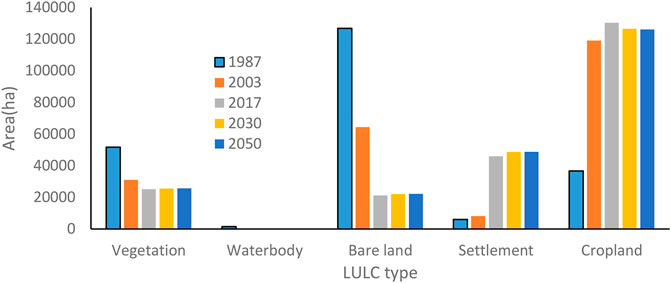
FIGURE 7. LULC variations.
3.8 Implication of the projected LULC change in the watershed
The changes in LULC in the future as simulated, especially the increase in settlement and decline in the agricultural land area, might impact the local population in several ways. It may lead to overexploitation of the ecosystem and natural resources due to socioeconomic factors, such as population increase, which drives the settlement increase. The overexploitation of natural resources may lead to resource use conflict as these resources get scantier and there is a scramble for them.
As a vegetation cover, which serves as a carbon sink, decreases, it may lead to the rise in temperature and reduction in rainfall and its variability. The increasing temperatures may result in thermal discomfort as heat waves are on the rise as a consequence. In order to mitigate the excessive heats at homes, people may have to resort to the use of air conditionings in their homes and thus may lead to an increase in the energy cost.
The increase in settlement, virtually robbing the crop land, may come with its challenges. The conversion of agricultural land to non-agricultural uses may bring serious consequences of food insecurity.
It may also bring about unemployment among the users of agricultural lands and migration of the users to big cities for better opportunities. The conversion of crop land to vegetation may have implications for ecosystem services including providing habitat and biodiversity (Lawler et al., 2014).
Since forest serves as a carbon sink, thus a comparatively small crop land conversion to vegetation may have an enormous impact on the net GHG emissions. However, overall, vegetation has decreased from 1987 to the projected 2050. The marginal increase in the projected bare land could be as a result of the expected increase in road infrastructure, construction sites, and landfill sites due to the increase in the settlement area as a consequence of the expected population rise.
The negative environmental consequences of LULC will worsen if business as usual (BAU) is continued in the future. The detrimental impact on the soil and water resources (water scarcity) in the watershed will be heightened.
The aforementioned LULC changes and implications historically have not been severe, as is expected in the projected LULC changes. The loss of biodiversity associated with the decline in vegetation as simulated may be more severe in the future compared to the historical changes, along with drought severity, intensity, amount, and duration, as projected by Nyatuame and Agodzo (2017), as a result of rainfall variability due to climate and land cover change.
The local population may be severely impacted as there is land productivity decrease, affecting their livelihood, since the local economy is agrarian.
3.9 LULC dynamics, the need for policy intervention
In line with SDGs 13 and 15, and the protection of biodiversity and ecosystem, there need to be a policy to guide the use of natural resources with posterity in mind, which includes the following:
• Vertical development that maximizes the land area instead of horizontal development.
• Planting of indigenous tree species to forestall de-vegetation and to restore the ecosystem benefits of afforestation.
• Obtaining permission from relevant authorities before felling of trees.
• Replacement plan provided and executed to the letter.
• Policy on the land use plan.
• Use of liquefied petroleum gas (LPG) instead of fuel wood.
• Alternative livelihood means instead of lumbering.
Figure 8 illustrates LULC changes and consequences of the change. It also summarizes the drivers of the LULC and the impacts of LULC.
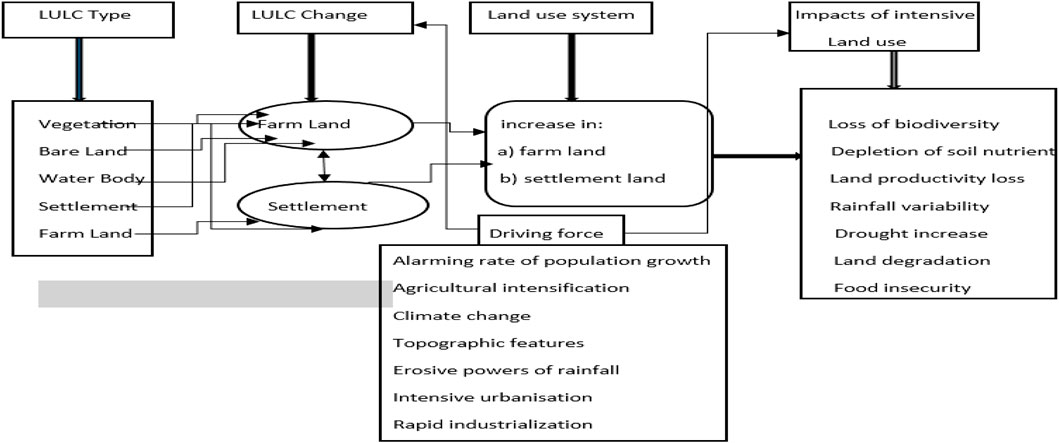
FIGURE 8. Conceptual framework of the LULC dynamics. Adopted from Maitima et al. (2009) and Shiferaw (2011).
4 Conclusion
LULC change has been acknowledged as the main driving force of the climate change and variability. The study revealed a progressive decrease in the land cover of vegetation, water bodies, and bare land from 1987 to 2003 through to 2017. The vegetation cover, water bodies, and bare lands progressively decreased from 23.22%, 0.70%, and 56.95% in 1987 to 13.94%, 0.08%, and 28.87% in 2003 and lastly to 11.30%, 0.01%, and 9.55%, respectively, in 2017. However, the settlement area and crop land, respectively, increased from 2.68% to 16.46% in 1987 to 3.65% and 53.47% in 2003 and finally to 20.61% and 58.52% in 2017. The projected LULC indicated that in 2030 and 2050, the dominant land use type will be crop land (56%). The findings of this research are relevant to environmental policy formulators and implementers, as well as urban and water resource planners.
The limitation to this current study is the images of different time intervals due to the difficulty of obtaining good-quality Landsat images from the study area for the periods under study.
The recourse to land use policy and its effective implementation is recommended to curtail the alarming LULC in Tordzie watershed and its environs. The study also recommends adapted mitigation strategies to protect vegetation (forest cover) and improve the green spaces around the built-up areas by planting more trees. It is further recommended that technology be adopted in farming to increase productivity instead of increasing the farm size. The urbanization in relation to temperature rise, energy cost, and LULC is recommended for further study by the future researchers.
Data availability statement
Publicly available datasets were analyzed in this study. These data can be found at: https://earthexplorer.usgs.gov/.
Author contributions
MN conceptualized the study, designed and analyzed the literature, wrote the manuscript and revised it. SA and LKA reviewed and edited the manuscript. BM-B worked on the figures. All authors contributed to the article and approved the submitted version.
Acknowledgments
The authors acknowledge the authors whose works have been reviewed and duly cited. The authors are especially thankful to the Shuttle Radar Topography Mission (SRTM) for DEM data and the United State Geographical Survey department of the Earth Resources Observation Service (USGS-EROS) for the satellite imageries. The authors would like to thank the editors and the reviewers for the relevant comments and suggestions, which significantly improved the quality of the manuscript.
Conflict of interest
The authors declare that the research was conducted in the absence of any commercial or financial relationships that could be construed as a potential conflict of interest.
Publisher’s note
All claims expressed in this article are solely those of the authors and do not necessarily represent those of their affiliated organizations, or those of the publisher, the editors, and the reviewers. Any product that may be evaluated in this article, or claim that may be made by its manufacturer, is not guaranteed or endorsed by the publisher.
References
Alam, A., Bhat, M. S., and Maheen, M. (2020). Using Landsat satellite data for assessing the land use and land cover change in Kashmir valley. GeoJournal 85 (6), 1529–1543. doi:10.1007/s10708-019-10037-x
Appiah, D. O., Schröder, D., Forkuo, E. K., and Bugri, J. T. (2015). Application of geo-information techniques in land use and land cover change analysis in a peri-urban district of Ghana. ISPRS Int. J. Geo-Information 4 (3), 1265–1289. doi:10.3390/ijgi4031265
Aragao, L. E. (2012). Environmental science: The rainforest's water pump. Nature 489 (7415), 217–218. doi:10.1038/nature11485
Arunyawat, S., and Shrestha, R. P. (2016). Assessing land use change and its impact on ecosystem services in northern Thailand. Sustainability 8, 768. doi:10.3390/su8080768
Awotwi, A., Anornu, G. K., Quaye-Ballard, J. A., and Annor, T. (2018). Monitoring land use and land cover changes due to extensive gold mining, urban expansion, and agriculture in the Pra River Basin of Ghana, 1986–2025. Land Degrad. Dev. 29 (10), 3331–3343. doi:10.1002/ldr.3093
Bagley, J. E. (2011). Impact of land cover change, energy regulation, bread basket production and precipitation. PhD Thesis. University of Wisconsin-Madison.
Basommi, L. P., Guan, Q. F., Cheng, D. D., and Singh, S. K. (2016). Dynamics of land use change in a mining area: A case study of nadowli district, Ghana. J. Mt. Sci. 13 (4), 633–642. doi:10.1007/s11629-015-3706-4
Butt, A., Shabbir, R., Ahmad, S. S., and Aziz, N. (2015). Land use change mapping and analysis using remote sensing and GIS: A case study of simly watershed, islamabad, Pakistan. Egypt. J. Remote Sens. Space Sci. 18 (2), 251–259. doi:10.1016/j.ejrs.2015.07.003
Cheruto, M. C., Kauti, M. K., Kisangau, D. P., and Kariuki, P. C. (2016). Assessment of land use and land cover change using GIS and remote sensing techniques: A case study of makueni county. Kenya.
Chowdhury, M., Hasan, M. E., and Abdullah-Al-Mamun, M. M. (2018). Land use/land cover change assessment of Halda watershed using remote sensing and GIS. Egypt. J. Remote Sens. Space Sci. 23, 63–75. doi:10.1016/j.ejrs.2018.11.003
Coe, M. T., Latrubesse, E. M., Ferreira, M. E., and Amsler, M. L. (2011). The effects of deforestation and climate variability on the streamflow of the Araguaia River, Brazil. Biogeochemistry 105 (1-3), 119–131. doi:10.1007/s10533-011-9582-2
Das, N., Mondal, P., Sutradhar, S., and Ghosh, R. (2021). Assessment of variation of land use/land cover and its impact on land surface temperature of Asansol subdivision. Egypt. J. Remote Sens. Space Sci. 24 (1), 131–149. doi:10.1016/j.ejrs.2020.05.001
Flight, L., and Julious, S. A. (2015). The disagreeable behaviour of the kappa statistic. Pharm. Stat. 14 (1), 74–78. doi:10.1002/pst.1659
Fonseca, C. A. B. D., Al-Ansari, N., Silva, R. M. D., Santos, C. A. G., Zerouali, B., Oliveira, D. B. D., et al. (2022). Investigating relationships between runoff–erosion processes and land use and land cover using remote sensing multiple gridded datasets. ISPRS Int. J. Geo-Information 11 (5), 272. doi:10.3390/ijgi11050272
Forkuor, G. (2014). Agricultural land use mapping in West Africa using multi-sensor satellite imagery,PhD thesis. Germany: University of Wuerzburg.
Gidey, E., Dikinya, O., Sebego, R., Segosebe, E., and Zenebe, A. (2017). Cellular automata and Markov chain (CA_Markov) model-based predictions of future land use and land cover scenarios (2015–2033) in Raya, northern Ethiopia. Model. Earth Syst. Environ. 3 (4), 1245–1262. doi:10.1007/s40808-017-0397-6
Hassan, Z., Shabbir, R., Ahmad, S. S., Malik, A. H., Aziz, N., Butt, A., et al. (2016). Dynamics of land use and land cover change (LULCC) using geospatial techniques: A case study of islamabad Pakistan. Springer plus 5, 812. doi:10.1186/s40064-016-2414-z
Kafy, A. A., Rahman, M. S., Hasan, M. M., and Islam, M. (2020). Modelling future land use land cover changes and their impacts on land surface temperatures in Rajshahi, Bangladesh. Remote Sens. Appl. Soc. Environ. 18, 100314. doi:10.1016/j.rsase.2020.100314
Kalra, K., Goswami, A. K., and Gupta, R. (2013). A comparative study of supervised image classification algorithms for satellite images. Int. J. Electr. Electron. data Commun. 1 (10), 10–16.
Karimi, H., Jafarnezhad, J., Khaledi, J., and Ahmadi, P. (2018). Monitoring and prediction of land use/land cover changes using CA-markov model: A case study of ravansar county in Iran. Arabian J. Geosciences 11 (19), 592–599. doi:10.1007/s12517-018-3940-5
Lawler, J. J., Lewis, D. J., Nelson, E., Plantinga, A. J., Polasky, S., Withey, J. C., et al. (2014). Projected land-use change impacts on ecosystem services in the United States. Proc. Natl. Acad. Sci. U. S. A. 111, 7492–7497. doi:10.1073/pnas.1405557111
Liping, C., Yujun, S., and Saeed, S. (2018). Monitoring and predicting land use and land cover changes using remote sensing and GIS techniques—a case study of a hilly area, jiangle, China. PloS one 13 (7), e0200493. doi:10.1371/journal.pone.0200493
Lobell, D. B., Schlenker, W., and Costa-Roberts, J. (2011). Climate trends and global crop production since 1980. Science 333 (6042), 616–620. doi:10.1126/science.1204531
Lu, Y., Wu, P., Ma, X., and Li, X. (2019). Detection and prediction of land use/land cover change using spatiotemporal data fusion and the Cellular Automata–Markov model. Environ. Monit. Assess. 191 (2), 68–19. doi:10.1007/s10661-019-7200-2
Luo, G., Amuti, T., Zhu, L., Mambetov, B. T., Maisupova, B., and Zhang, C. (2015). Dynamics of landscape patterns in an inland river delta of Central Asia based on a cellular automata-Markov model. Reg. Environ. change 15 (2), 277–289. doi:10.1007/s10113-014-0638-4
Mahmoud, S. H., and Alazba, A. A. (2015). Hydrological response to land cover changes and human activities in arid regions using a geographic information system and remote sensing, Plos One 10, e0125805. doi:10.1371/journal.pone.0125805
Maitima, J. M., Mugatha, S. M., Reid, R. S., Gachimbi, L. N., Majule, A., Lyaruu, H., et al. (2009). The linkages between land use change, land degradation and biodiversity across East Africa. Afr. J. Environ. Sci. Technol. 3 (10).
Matlhodi, B., Kenabatho, P. K., Parida, B. P., and Maphanyane, J. G. (2021). Analysis of the future land use land cover changes in the gaborone dam catchment using ca-markov model: Implications on water resources. Remote Sens. 13 (13), 2427. doi:10.3390/rs13132427
Mengist, W., Soromessa, T., and Feyisa, G. L. (2022). Forest fragmentation in a forest Biosphere Reserve: Implications for the sustainability of natural habitats and forest management policy in Ethiopia. Resour. Environ. Sustain. 8, 100058. doi:10.1016/j.resenv.2022.100058
Meshesha, T. W., Tripathi, S. K., and Khare, D. (2016). Analyses of land use and land cover change dynamics using GIS and remote sensing during 1984 and 2015 in the Beressa Watershed Northern Central Highland of Ethiopia. Model. Earth Syst. Environ. 2, 1–12. doi:10.1007/s40808-016-0233-4
Minale, A. S. (2013). Retrospective analysis of land cover and use dynamics in Gilgel Abbay Watershed by using GIS and remote sensing techniques, Northwestern Ethiopia. Int. J. Geosciences 4 (07), 1003–1008. doi:10.4236/ijg.2013.47093
Mishra, V. N., Rai, P. K., Prasad, R., Punia, M., and Nistor, M. M. (2018). Prediction of spatio-temporal land use/land cover dynamics in rapidly developing varanasi district of Uttar Pradesh, India, using geospatial approach: A comparison of hybrid models. Appl. Geomatics 10 (3), 257–276. doi:10.1007/s12518-018-0223-5
Nicu, I. C., and Stoleriu, C. C. (2019). Land use changes and dynamics over the last century around churches of Moldavia, Bukovina, Northern Romania–Challenges and future perspectives. Habitat Int. 88, 101979. doi:10.1016/j.habitatint.2019.04.006
Nyatuame, M., and Agodzo, S. (2017). Analysis of extreme rainfall events (drought and flood) over Tordzie Watershed in the Volta Region of Ghana. J. Geoscience Environ. Prot. 5 (9), 275–295. doi:10.4236/gep.2017.59019
Nyatuame, M., Amekudzi, L. K., and Agodzo, S. K. (2020). Assessing the land use/land cover and climate change impact on water balance on Tordzie watershed. Remote Sens. Appl. Soc. Environ. 20, 100381. doi:10.1016/j.rsase.2020.100381
Nyatuame, M., Agodzo, S., and Amekudzi, L. (2022). Analysis of rainfall and temperature trend and variability of the Tordzie Watershed. Ghana J. Sci. Technol. Dev. 8 (1), 1–17. doi:10.47881/271.967x
Olaleye, J. B., Abiodun, O. E., and Asonibare, R. O. (2012). Land use and land cover ananlysis of llorin Emirate between 1986 and 2006 using landsat imageries. Afr. J. Environ. Sci. Technol. 6 (4), 189–198.
Rawat, J. S., and Kumar, M. (2015). Monitoring land use/cover change using remote sensing and GIS techniques: A case study of hawalbagh block, district almora, uttarakhand, India. Egypt. J. Remote Sens. Space Sci. 18 (1), 77–84. doi:10.1016/j.ejrs.2015.02.002
Sarfo, I., Bi, S., Kwang, C., Yeboah, E., Addai, F. K., Nkunzimana, A., et al. (2023). Class dynamics and relationship between land-use systems and surface temperature in south-eastern Ghana. Environ. Earth Sci. 82 (4), 104. doi:10.1007/s12665-023-10755-z
Schulp, C. J., Levers, C., Kuemmerle, T., Tieskens, K. F., and Verburg, P. H. (2019). Mapping and modelling past and future land use change in Europe’s cultural landscapes. Land use policy 80, 332–344. doi:10.1016/j.landusepol.2018.04.030
Seto, K. C., Güneralp, B., and Hutyra, L. R. (2012). Global forecasts of urban expansion to 2030 and direct impacts on biodiversity and carbon pools. Proc. Natl. Acad. Sci. 109 (40), 16083–16088. doi:10.1073/pnas.1211658109
Shiferaw, A. (2011). Evaluating the land use and land cover dynamics in borena woreda of south wollo highlands, Ethiopia. J. Sustain. Dev. Afr. 13 (1).
Snyder, P. K. (2010). The influence of tropical deforestation on the Northern Hemisphere climate by atmospheric teleconnections. Earth Interact. 14 (4), 1–34. doi:10.1175/2010ei280.1
Spracklen, D. V., Arnold, S. R., and Taylor, C. M. (2012). Observations of increased tropical rainfall preceded by air passage over forests. Nature 489 (7415), 282–285. doi:10.1038/nature11390
Talukdar, S., Singha, P., Mahato, S., Pal, S., Liou, Y. A., Rahman, A., et al. (2020). Land-use land-cover classification by machine learning classifiers for satellite observations—a review. Remote Sens. 12 (7), 1135. doi:10.3390/rs12071135
Toma, M. B., Belete, M. D., and Ulsido, M. D. (2023). Historical and future dynamics of land use land cover and its drivers in Ajora-Woybo watershed, Omo-Gibe basin, Ethiopia. Nat. Resour. Model. 36 (1), e12353. doi:10.1111/nrm.12353
Keywords: land use, land cover, rate of change, Tordzie watershed, Ghana
Citation: Nyatuame M, Agodzo S, Amekudzi LK and Mensah-Brako B (2023) Assessment of past and future land use/cover change over Tordzie watershed in Ghana. Front. Environ. Sci. 11:1139264. doi: 10.3389/fenvs.2023.1139264
Received: 06 January 2023; Accepted: 02 June 2023;
Published: 20 June 2023.
Edited by:
Xiaoyang Zhang, South Dakota State University, United StatesReviewed by:
Ionut Cristi Nicu, Norwegian Institute for Cultural Heritage Research, NorwayIsaac Sarfo, Nanjing University of Information Science and Technology, China
Copyright © 2023 Nyatuame, Agodzo, Amekudzi and Mensah-Brako. This is an open-access article distributed under the terms of the Creative Commons Attribution License (CC BY). The use, distribution or reproduction in other forums is permitted, provided the original author(s) and the copyright owner(s) are credited and that the original publication in this journal is cited, in accordance with accepted academic practice. No use, distribution or reproduction is permitted which does not comply with these terms.
*Correspondence: Mexoese Nyatuame, doga_nyatuame@yahoo.com