The influence of dust aerosols on solar radiation and near-surface temperature during a severe duststorm transport episode
 Guan Huang1,2,3
  Yaman Zhou4 Zijia Guo3 Xin Liu3
  Yonghang Chen3* Qiong Liu3 Zhijie Ta1 Pengtao Wang1 Qing He5 Jiacheng Gao5 Ying Zhang6
- 1School of Tourism and Research Institute of Human Geography, Xi’an International Studies University, Xi’an, China
- 2Center for Silk Road and Eurasian Civilization Studies, Xi’an International Studies University, Xi’an, China
- 3College of Evironmental Science and Engineering, Donghua University, Shanghai, China
- 4Xinjiang Meteorological Observatory, Urumqi, China
- 5Taklimakan Desert Meteorology Field Experiment Station of CMA, Institute of Desert Meteorology, China Meteorbological Administration, Urumqi, China
- 6Wenjiang Meteorological Bureau, Chengdu, China
In the west of China, a rarely seen black storm, with a high intensity of dust aerosols and a large area of influence, occurred from April 26–29, 2015, for the first time, after more than 30 years. Based on the regional climate model (RegCM version 4.6), combined with Moderate Resolution Imaging Spectroradiometer (MODIS) satellite retrieval, meteorological, and environmental data, this work presents the pollution situation, weather background, and backward trajectory during the black storm process. In addition, we analyzed the temporal–spatial distribution of aerosol optical depth (AOD) and the impacts of dust aerosols on solar radiation and near-surface temperature under this extreme weather condition. We discovered that this black storm process was caused by the surface cold high pressure and frontal transit under the background of the upper-air circulation of “two troughs and two ridges.” The pollutants primarily from Xinjiang and the Central Asia region, along with the airflow, entered northern Xinjiang almost simultaneously with the southwest airflow, piled up along the Tianshan Mountains, and then crossed the mountains into southern Xinjiang. In addition, the areas with high AOD were mostly in the desert regions and basins, whereas the low-value areas were mountainous areas with relatively high altitudes due to the effect of geographical and climatic conditions. The AOD from RegCM 4.6 was generally lower, unlike the MODIS AOD. Moreover, the dust aerosols from this black storm caused a significant decline in net short-wave radiation (NSR) both at the top of the atmosphere (TOA) and surface. The cooling effect was more significant in the region with high AOD. For the areas where the AOD was higher than 0.7, the net short-wave radiative forcing of dust aerosols (ADRF) at the surface was above −70 W•m−2; on the other hand, the cooling effect at the TOA was not as significant as that at the surface, with the ADRFTOA being only about a quarter of the ADRFSUR. The ADRFSUR could reduce the near-surface temperature, and the region with a large temperature drop corresponded to the high-value areas of ADRFSUR/AOD. During this black storm, the near-surface temperature response to dust aerosols reached 0.40°C–2.9°C with a significant temperature drop because of cold air.
1 Introduction
Dust storms are serious natural hazards that are driven by strong winds from the ground and reduce horizontal visibility to less than 1 km, which usually occur in arid and semi-arid areas. Intense dust storms, especially black storms, with strong winds and horizontal maximum visibility of less than 2 m, are extremely destructive environmental disasters. Due to their suddenness, short duration, and high intensity, dust storms often cause serious harm in a short time. They bring a colossal amount of dust aerosols to the atmosphere, which can significantly deteriorate air quality and photosynthetic activity (Korotaeva et al., 2018; Kaskaoutis et al., 2019) by increasing the particulate concentrations at levels that potentially increase atmospheric turbidity, causing the extinction of solar and atmospheric radiation via scattering and absorption (Kaskaoutis et al., 2006; Garcia-Pando et al., 2014; Maghrabi & Al-Dosari, 2016; Kaskaoutis et al., 2019). In addition, the wind erosion of dust storms aggravates desertification, seriously affecting the ecosystem and human health (Kang et al., 2017; Li et al., 2020).
Dust aerosols, derived mainly from dust storms, are one of the important components of the atmospheric system. They can not only change cloud albedo or life cycle by acting as cloud condensation or ice nuclei (Li et al., 2018; Nguyen et al., 2019; Yan & Wang, 2020) but also disrupt radiation budget by directly scattering and absorbing solar radiation, reducing the amount of solar radiation gained by the ground and lower atmosphere, before modifying the near-surface temperature (Ge et al., 2010; Gao et al., 2015; Samset et al., 2018; Wang et al., 2018; 2019; 2020; Zhou et al., 2022a; 2022b). In addition, dust aerosols can stimulate abnormal water cycle feedback and change precipitation distribution (Lau et al., 2017; Zhao et al., 2020). Dust also reduces visibility (Watson, 2002), exacerbates air quality (Salvador et al., 2019), and affects atmospheric circulation by changing atmospheric heating in the middle and upper troposphere (Alizadeh-Choobari et al., 2014). Overall, dust has adverse effects on human health and climate change at regional and even global scales (Huang et al., 2014; 2012; Zhao et al., 2018; Liu et al., 2021). Therefore, systematic studies on the characteristics and radiation effects of dust aerosols during intense dust storms are necessary to develop strategies for mitigating the impacts of dust storms on radiation balance, ecosystems, and human health (Middleton, 2017; Middleton & Kang, 2017).
For dust storms, numerous studies have focused on examining dust source regions, weather background, spatial–temporal distribution, and characteristics and irradiation effect of dust aerosols (Huang et al., 2008; Ashpole and Washington, 2013; Qi et al., 2013; Saeed et al., 2014; Kedia et al., 2018; Filonchyk et al., 2019; Kaskaoutis et al., 2019; Nguyen et al., 2019; Gao et al., 2022; Qin et al., 2022; Zhang et al., 2022). Most of these studies have been performed based on ground observation and satellite remote sensing data (Gehlot et al., 2015; Maghrabi & Al-Dosari, 2016; Maghrabi, 2017; Tian et al., 2018; Bi et al., 2022). Nonetheless, the uneven distribution and the limited number of ground monitoring stations cannot obtain continuous spatial coverage information. Moreover, it is difficult to effectively reflect the spatial and temporal evolution characteristics of related factors (Kaufman et al., 1997; Huang et al., 2020). Satellite remote-sensing observation covers a wide area, with the advantages of macroscopic, economic, and long-term dynamic monitoring, which can compensate for the limitations of ground monitoring stations in spatial distribution (Huang et al., 2008; Huang et al., 2020). However, satellite remote-sensing inversion remains a difficult problem for the Xinjiang region with its vast territory, complex underlying surface, multi-mountain snow, desert, and other bright background regions. For instance, a large area with missing data makes it difficult for satellite remote-sensing data to completely reflect the occurrence, development, transport characteristics, and climate effects of dust aerosols (Wang et al., 2010). Particularly, the absence of observation data limits the operation simulation of meteorological/environmental models, which ultimately leads to the rarely quantitative effect evaluation of dust storm transport on environmental factors such as temperature and humidity in the downstream area (Wang et al., 2013).
Numerical simulation technology considering dust processes is an important tool for studying dust emission, transport, deposition, and interactions with meteorological factors (Sugimoto et al., 2013; McClintock et al., 2019); however, not all numerical models meet our research needs. Mahowald et al. (2010) showed that the Community Climate System Model (CCSM) could not capture dust changes in five research regions (Australia, North Africa, North America, South America, and Middle East/Central Asia) in the 1920s. Because the dust size distribution was biased toward small particles in CMIP5 models, Evan et al. (2014) and Wu et al. (2018) found that the CMIP5 climate model could not reproduce the basic aspects of dust emission and transport over the second half of the 20th century over North Africa and the decrease of dust event occurrence over East Asia between 1961 and 2005. Moreover, the common dust prediction models, including Community Multi-scale Air Quality (CMAQ) and Weather Research and Forecasting-Dust (WRF-Dust), were used for unidirectional coupling sand; the lifting scheme with mesoscale weather model is unsuitable for simulating the long-distance transport process of dust and cannot analyze the feedback of the radiation effect of dust aerosol on the meteorological field and the effect of climate change (Su et al., 2022). In contrast, the regional climate models (RegCMs), developed by the National Center for Atmospheric Research (NCAR) since 1989 (Dickinson et al., 1989) and improved by the International Center for Theoretical Physics (ICTP, Trieste, Italy) (Giorgi & Mearns, 1999), have higher spatial resolution and provide additional details about regional physical processes. This consequently improves the capacity to simulate mesoscale events (Frei et al., 2003). They can not only present spatial and temporal distribution characteristics of dust aerosol, temperature, humidity, radiation, and other environmental meteorological elements but also be used to analyze the interaction and effect mechanism among various elements. The RegCMs have compensated for the shortcomings of existing research methods (Tummon et al., 2010; Yan et al., 2011; Nabat et al., 2012; Solmon et al., 2012) and have been widely used to study climate change and prediction, water cycle, and radiation budget (Pu et al., 2017; Li et al., 2018; Xie et al., 2019).
In the spring of 2015, a black storm with extremely high-speed wind, high intensity of dust aerosols, and a large area of influence was observed in Xinjiang, China. The air quality index (AQI) in Urumqi, the capital city of Xinjiang, reached the “hazardous level” based on the U.S. EPA (2016) for several hours on April 27, and its air quality ranked last among 607 cities in China. It was not only the first dusty weather since 2015 but also the first strong dust episode observed after more than 30 years in Xinjiang. Therefore, this study presents the pollution situation, weather background, and backward trajectory during the black storm process based on the regional climate model RegCM version 4.6 (RegCM 4.6) and the Hybrid Single-Particle Lagrangian Integrated Trajectory (HYSPLIT) model, combined with MODIS satellite retrieval, meteorological, and environmental observational data. We analyzed the temporal–spatial distribution of dust aerosols, radiation effect, and temperature response under this extreme weather condition. We aimed toward providing a scientific basis for further understanding of the occurrence and development mechanism of extra-strong sandstorms; quantitative assessment of the impact of dust aerosol on the meteorological and environmental elements in the involved areas; and improvement in pollution level with early warning, forecast, and prevention and control capabilities. This paper is structured as follows: the data, model, and methodology are introduced in Section 2. The results and discussion are presented in Section 3, followed by a conclusion in Section 4.
2 Data, model, and methodology
2.1 Data
The hourly AQI and particulate matter (PM10 and PM2.5, which include particles less than 10 or 2.5 μm in diameter, respectively) concentrations in Urumqi (Figure 1) were obtained from the Xinjiang Environmental Protection Department.
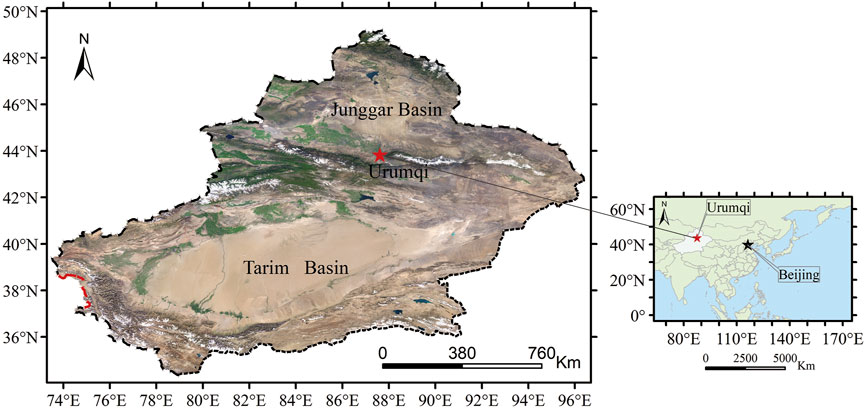
FIGURE 1. Geographical location and terrain of Xinjiang region.
As for satellite data, the EOST/MODIS satellite data after projection for dust remote-sensing monitoring were processed by SMART software of China Satellite Meteorological Center. In addition, unlike the performance of MODIS AOD retrievals with the Dark Target (DT) algorithm, Tao et al. (2017) and Huang et al. (2020) found the Deep Blue (DB) AOD to be more suited for the arid and semi-arid areas with a bright background. Therefore, we extracted the Level 2 Collection 6 MODIS Aqua (MYD) and MODIS Terra (MOD) DB AOD product (550 nm) at 10-km spatial resolution with high quality (Quality Assurance = 2, 3) during April 25–29 in eastern Asia (18–54°N, 73–145°E). The daily average value of MOD and MYD AOD that averaged over the 50 × 50 km window size was used to analyze the transport path of the black storm and confirm the simulation results.
To further analyze the occurrence and development of this black storm, the circulation situation and influence system during the black storm were analyzed based on the synoptic principle and synoptic dynamics diagnosis and analysis method using the National Centers for Environmental Prediction (NCEP) 2.5°x 2.5° reanalysis data every 6 h. Moreover, this study used the HYSPLIT model, combined with 1°x 1° meteorological field data from the NCEP Global Data Assimilation System (GDAS) to calculate the 48 h backward and forward transport trajectories of airflow over Urumqi at 19:00 on April 27. The track initiation point of the trajectory was Urumqi (43.46°N, 87.36°E), and the origin time was 19:00 on April 27 (Beijing time). The simulation was conducted for 48 h backward (20:00 on April 25 to 19:00 on April 27) and forward (19:00 on April 27 to 18:00 on April 29), with a time interval of 6 h. The height of the air mass trajectory was 100 m, 500 m, and 1,000 m, respectively.
2.2 Model
2.2.1 The RegCM 4.6 model description and evaluation
The simulation was conducted using the regional climate model RegCM 4.6, a sigma vertical coordinate model (18 layers), within the hydrostatic version of the 5th generation of the Mesoscale Model MM5 as the dynamical core, developed by the Abdus Salam International Centre for Theoretical Physics (ICTP). Unlike previous versions, RegCM 4.6 improved in describing physical processes, including new land schemes and additional modifications of cumulus convection, radiative transfer, and planetary boundary layer schemes (Liu et al., 2021).
In RegCM 4.6, the aerosol scheme included dust, sea salt, black/anthropic carbon, and sulfate aerosols. It also included atmospheric wind advection, turbulent diffusion, vertical transport of deep convection, surface emission, dry and wet removal processes, and chemical conversion mechanism of gas and liquid phases (Solmon et al., 2006; Liu et al., 2021). The shortwave radiative transfer was calculated using the Community Climate Model (CCM3), which followed the δ-Eddington approximation stated by Kiehl et al. (1998). The dust shortwave radiative effect was calculated with extinction coefficient, asymmetry factor, and single-scattering albedo based on the Mie theory. Additional details about RegCM 4.6 have been described and documented by Giorgi (2011).
To evaluate the simulation results of RegCM 4.6, our research team conducted a validation study of RegCM 4.6 based on the surface observation data (Liu et al., 2020; 2021). In our previous validation study, the basic data used for validation were the daily averaged quality-assured (accuracy less than ±0.01) and cloud-screened Level 2 AOD data at the Dalanzadgad (43.58°N, 104.42°E) site (downloaded from the AErosol RObotic NETwork/AERONET website: http://aeronet. gsfc.nasa.gov). Meanwhile, the fixed grid point from the RegCM simulation that was closest to Dalanzadgad was selected for validation. From the statistical information between the daily averaged model and AERONET AOD at Dalanzadgad station (as shown in Table 1), the linear correlation coefficient (R) was 0.23 and passed the 0.05 significance test. This indicates that the model AOD was significantly and linearly correlated with the observation. Data distribution was relatively concentrated with the root-mean-square error (RMSE) of 0.17. Generally, the model underestimated the AOD with the mean absolute error (MAE) of 0.11 and the relative mean bias (RMB) of 0.80 (Liu et al., 2021).

TABLE 1. Statistics describing the relationship of daily averaged dust AOD between AERONET and simulation at Dalanzadgad (43.58°N, 104.42°E) station during spring from 2012 to 2014.
Figure 2 shows the comparison of monthly mean AOD between AERONET observations (at 500 nm) and model simulation results at Dalanzadgad station. As shown, the average difference in monthly AOD between the two was −0.03. Although discrepancies can be found on individual times, the simulated AOD was in line with the observations. Specifically, the seasonal and interannual variations of AOD were well-captured at the site (Liu et al., 2021). According to the aforestated observations, the difference between the model and AERONET AOD may come from two aspects. One is that the AERONET AOD accounted for all types of aerosols; however, the model AOD only included dust aerosols. The other is that the AERONET AOD was obtained from sun/sky radiometers and only included daytime AOD. In addition, Su et al. (2022) showed that the RegCM 4 model simulated results of dust concentration and that dust optical depth was consistent with the observed distribution, which echoes our findings.
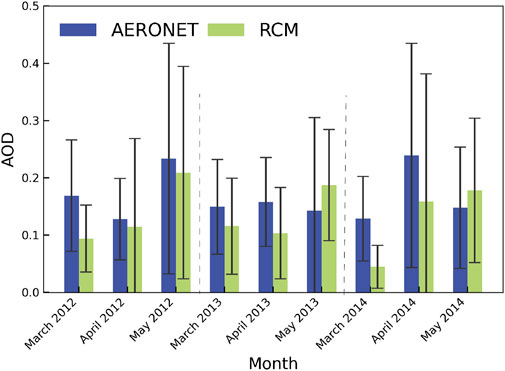
FIGURE 2. Comparison of monthly mean AOD between AERONET observations (at 500 nm) and model simulation results at Dalanzadgad station (43.58°N, 104.42°E).
2.2.2 Model set up
The model domain in this study covered the whole eastern Asia region (−1°N∼70°N, 5°E∼175°E) with (40°N, 90°E) as the center (Figure 3); the horizontal resolution was 50 km, and the top level was at 50 hPa. We adopted the National Center for Atmospheric Research (NCAR) Community Climate Model 3 (CCM3) (Kiehl et al., 1998) as the radiative transfer scheme; Emanuel (1991) was used as the cumulus convective scheme; Holtslag et al. (1990) was employed as the planetary boundary layer scheme. Relaxation, an exponential technique, was employed as the lateral boundary conditions scheme. The Zeng scheme was adopted as the ocean flux scheme; the Explicit moisture scheme was used for moisture; and the Use full fields scheme was used for pressure gradient acquisition. Moreover, the NOAA Optimum Interpolation Sea Surface Temperature (OISST) dataset and Global Multi-resolution Terrain Elevation Data (GMTED, Lambert projection) were used as sea surface temperature and terrain data, whereas the EIN15 dataset of the ECMWF (European Centre for Medium-Range Weather Forecasts) global reanalysis data was used to drive the initial field and side boundary field of RegCM 4.6.
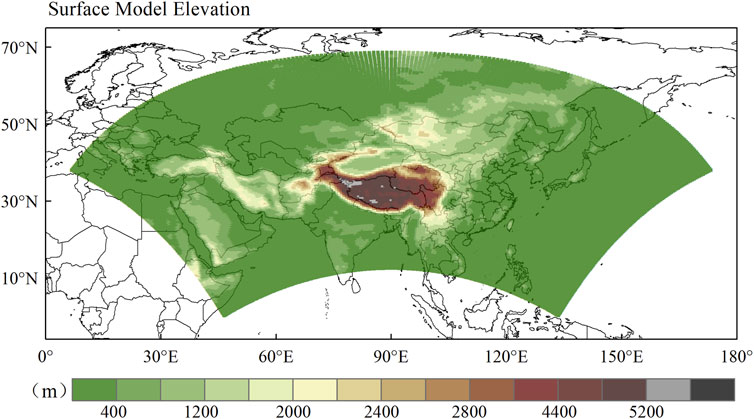
FIGURE 3. Simulation area and its terrain distribution (unit of altitude: m).
The simulation ran between 1 March 2015 and 31 May 2015, where the first month was the initialization time, and the simulation results were the output every 3 h on average. We only analyzed the simulation results between April 25 and April 29 during the black storm. We designed two experimental schemes, of which the mode settings remain unchanged except for the aerosol module, i.e., 1) DUST scheme—open aerosol module based on the DUST04 scheme and 2) NODUST scheme—closed aerosol module to simulate the situation without dust aerosols.
2.3 Methodology
The RegCM 4.6 simulated (RCM) AOD, net short-wave radiation at the top of the atmosphere (NSRTOA), net short-wave radiation at the Earth’s surface (NSRSUR), net short-wave radiative forcing of dust aerosols at TOA and the Earth’s surface (ADRFSUR, ADRFTOA), and the TRSUR were selected as parameters for analysis. The calculation scheme of ADRFSUR, ADRFTOA, and TRSUR are as follows:
NSRTOA(Dust), NSRSUR(Dust), and TSUR(Dust) represent the NSRTOA, NSRSUR, and temperature at 2 m near the ground when there are dust aerosols, respectively. NSRTOA(0), NSRSUR(0), and TSUR(0) represent the corresponding three parameters when there is no dust aerosol, respectively.
3 Results and discussion
3.1 Pollution status of this black storm episode
During April 26–29, 2015, a black storm with extremely high-speed wind, high intensity of dust aerosols, and a wide range of influence occurred in Xinjiang, China. In total, 57 of the 105 meteorological observation stations in Xinjiang had observed sand and dust weather of varying degrees; among them, sandstorms appeared in 16 stations. All the meteorological departments in Xinjiang had sounded 14 early warning signals. Specifically, the visibility of Moyu County and Yutian County in Hotan was zero.
Figure 4 shows the temporal variation of the AQI and particulate mass concentrations in Urumqi during April 26–29, 2015. The period from 0:00 on April 26 to 06:00 on April 27 was slightly polluted, during which the AQI fluctuated slightly around 80–150, and the particulate mass concentrations showed a slow accumulation trend. At 07:00 on the 27th, with the emergence of the black storm, the AQI and particulate mass concentrations increased and reached their respective peaks at noon when the dust storm was the most serious, AQI = 500, PM10 concentration = 1000 μg•m-3, and PM2.5 concentration = 628 μg•m-3 (upper limits of the instrument that detect AQI and PM10 concentration are 500 and 1000 μg/m3 respectively, and the corresponding value of the upper limit is displayed when the meter needle exceeds the upper limits). The air was still heavily polluted until 19:00 on the 27th, when all of the above indices were at high levels, with AQI >374, PM10 concentration >478 μg•m-3, and even gone off the charts for several hours. As shown in Figure 2, PM2.5 concentration was also significantly higher than that without dust, but the increase was not as significant as that of PM10. After 20:00 on the 27th, as the dust weather weakened, the AQI and particulate mass concentrations decreased significantly, the air quality became good, and the pollution process appeared to end. In addition, the ratio of PM2.5 to PM10 had different performances at different stages. When there was no dust, the ratio of PM2.5 to PM10 in Urumqi was mostly concentrated at 0.25–0.40 (the average ratio in the 10 days before and after this dust storm was 0.34). However, when the black storm appeared, the ratio of PM2.5 to PM10 decreased to 0.11–0.15, with a large number of coarse dust particles in the atmosphere, making PM10 the major pollutant.
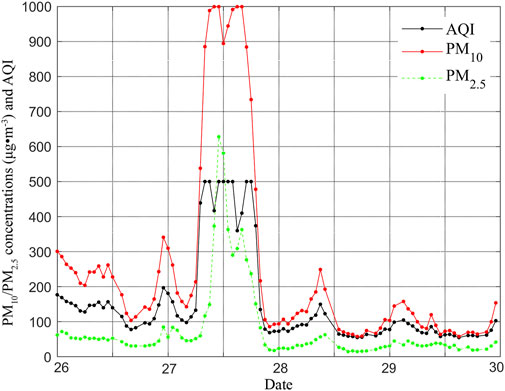
FIGURE 4. Temporal variation of the AQI and particulate mass concentrations in Urumqi during April 26–29, 2015. The black, red, and green lines represent the AQI, PM10 concentration, and PM2.5 concentration, respectively.
Figure 5 is the EOST/MODIS monitor of dust in the south region of Xinjiang at 13:13 on April 27(a) and 13:01 on April 29(b); the spatial resolution is 250 m. As shown, during the black storm process, a large area of dust appeared in the southern Xinjiang Basin, and the main dust body showed a transmission trend from east to west in southern Xinjiang from 27th to 29th.
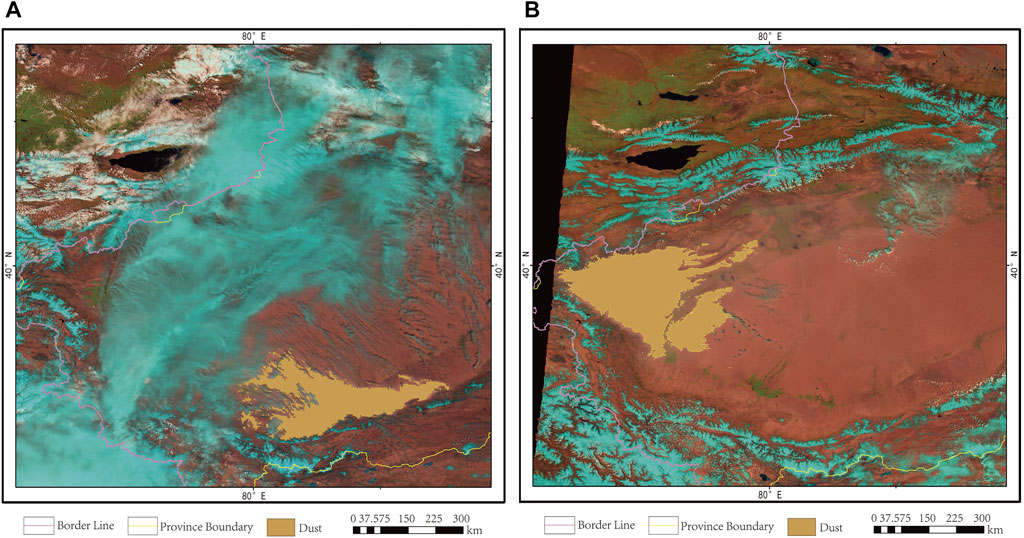
FIGURE 5. EOST/MODIS monitor of dust in the south region of Xinjiang at 13:13 on April 27 (A) and 13:01 on April 29 (B).
Meanwhile, based on the meteorological observations, the dust first appeared in the western part of northern Xinjiang at 05:00 on April 27th. The extent of dust in northern Xinjiang expanded at 08:00, with strong dust appearing along the Tianshan Mountains. At 17:00 on April 27th, a large range of strong dust appeared in the eastern part of the southern Xinjiang Basin, and at the same time, sandstorms or blowing sand were in eastern Xinjiang. In summary, the black storm started in the western part of northern Xinjiang; the dust moved eastward along the Tianshan Mountains and crossed into the eastern part of southern Xinjiang before moving east to eastern Xinjiang.
3.2 Weather background and airflow trajectory during this black storm episode
Figure 6 shows the circulation situation of 500 hPa from April 26th to 29th, 2015. During the early stage of the process, the circulation situation of “two troughs and two ridges” was in Europe and Asia, upper westerly jet active (Figure 6A). Western Siberia and Central Asia were active regions of the low-pressure trough, with dense contour lines and isotherms behind the trough and a large gradient. The temperature trough was behind the height trough, and the strong cold flat flow was transported to the trough after the low trough, with the low-pressure trough further developing. At this time, Xinjiang was controlled by the high-pressure ridge. As the development of the upper European high ridge moved eastward, the eastward movement of the low trough intensified in Western Siberia and Central Asia. From 27th to 28th (Figures 6B, C), the convergence of the low trough in the high and middle latitudes strengthened in the Balkhash Lake region, and the short wave at the bottom of the trough quickly moved into northern Xinjiang. The strong cold air moved eastward and southward, causing a wide range of wind and dust weather. At the same time, the Central Asia trough moved eastward into the Tarim Basin, and with the cold air moving westward, gale and dust weather appeared in the southern Xinjiang Basin. On the 29th (Figure 6D), the trough of low pressure moved eastward, and the northwest wind gradually changed to the westerly wind, which was conducive to the transmission of dust to the downstream areas.

FIGURE 6. 500 hPa potential height field (black contour lines, unit: dagpm), temperature field (red dashed line, unit: °C), and wind field (blue vector, unit: m·s -1) during April 26–29, 2015 [(A) April 26th; (B) April 27th; (C) April 28th; and (D) April 29th].
Combined with the sea-level pressure field view (Figure 7), the surface high pressure was located in the Caspian Sea and the Aral Sea on the 26th (Figure 7A), and the high pressure continued to increase to 1,027 hPa as it moved northeast on the 27th (Figure 7B). The cold front entered Xinjiang, and the isobars behind the front were dense. A large pressure gradient was noted between the warm and cold air masses before and after the cold front, resulting in a surface wind. At the same time, under the effect of the low pressure of 1,005 hPa, a notable area of large value of pressure gradient was evident between high and low pressure, and the pressure gradient formed strong gradient wind, causing gale and dust weather in the northwest. As the upper-level system moved eastward, the cold front passed through on the 28th (Figure 7C), and the dust arrived with the wind. During the development and movement of the high pressure to the northeast, the high-pressure center split into two centers, i.e., the north and south. The north high pressure quickly introduced cold air into the area, and the cold air accumulated along the Tianshan Mountains, causing gale and dust weather along the Tianshan Mountains. The cold air then crossed the Tianshan Mountains and entered the Tarim Basin. In addition, the cold air from the south moved westward, and the gale from the northwest caused sandstorm weather in the west and north of the basin. Additionally, during the northeast movement of the surface high pressure, the cold air entered from the east and caused the sandstorm weather in the east of the basin. The cold air invaded the basin from the east, the west, and the mountain, and the wind and dust scopes were further expanded, forming large-scale sandstorm weather. The high-altitude influence system gradually moved eastward on the 29th (Figure 7D), and the strong front area moved eastward out of the northwest region.
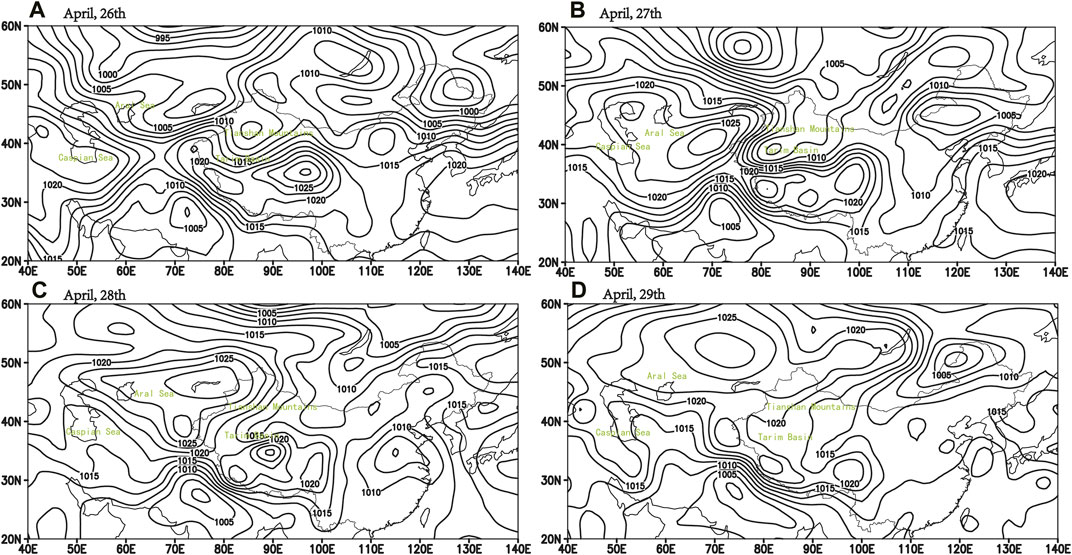
FIGURE 7. Sea-level pressure field (contour lines, unit: hPa) during April 26–29, 2015 [(A) April 26th; (B) April 27th; (C) April 28th; and (D) April 29th].
In conclusion, this process was caused by the surface cold high pressure and frontal transit under the background of the upper-air circulation of “two troughs and two ridges.” In addition, during spring in northwest China, the soil was dry and loose, with less vegetation cover (Chi, 2020); the dust was easily raised by the wind, creating optimum conditions for the occurrence of strong dust storms. As the cold front moved eastward, the dust carried by the wind was transported to the upper air along with the updraft. The prevailing westerly winds in the upper air constantly transmitted the dust aerosols to Inner Mongolia, North China, and other regions downstream, affecting a large region of East Asia.
The HYSPLIT backward (Figure 8A) and forward (Figure 8B) trajectories of Urumqi air at 19:00 on April 27th (48 h) were represented to further analyze the occurrence and transportation of this air pollution episode. The red, blue, and green lines represent the path of air masses at 1,000 m, 500 m, and 100 m, respectively. As shown in Figure 8A, the high-altitude air masses crossed Turkmenistan and Uzbekistan from the northwest of Turkmenistan to Kazakhstan at 20:00 on the 25th and entered Xinjiang at 08:00 on the 27th. The air masses at 500 m started from the Caspian Sea region, passed through the three Central Asian countries, and entered Xinjiang at 08:00 on the 27th. Meanwhile, the low-altitude air masses entered Kazakhstan from the northeastern end of Uzbekistan on the air stream and entered Xinjiang at 07:00 on the 27th. Subsequently, under the action of air currents, air masses at various heights passed through many cities in northern Xinjiang and reached Urumqi at 19:00 on the 27th. As illustrated, the three air masses at different heights had similar transport trajectories during this black storm process; all showing that exogenous pollutants primarily originated from the west of Xinjiang and entered the north of Xinjiang almost synchronously under the action of southwest airflow before reaching Urumqi along the north slope of Tianshan Mountains.
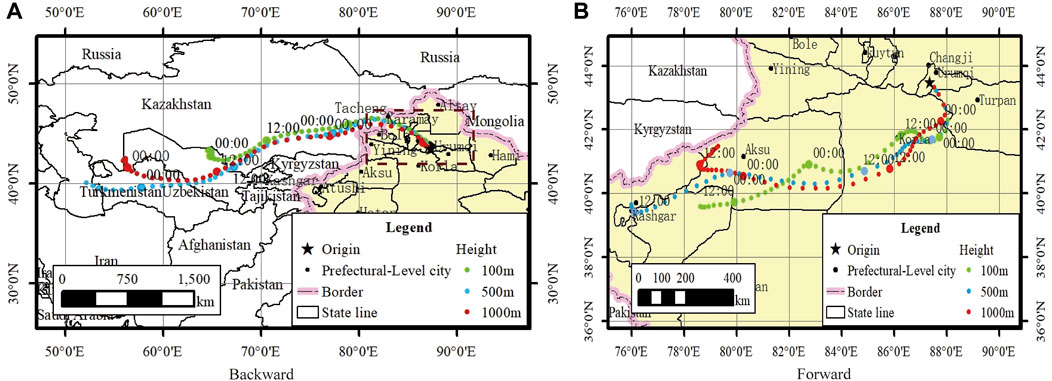
FIGURE 8. HYSPLIT backward (A) and forward (B) trajectories of Urumqi air at 19:00 on April 27th (48 h).
According to the Figure 8B, from 19:00 on the 27th to the early morning of the 29th, the air masses at different heights had similar transport trajectories, all piled up along the Tianshan Mountains before turning over the mountains into the southern Xinjiang Basin, which was consistent with the MODIS observation results. However, since the early morning of the 29th, the three air masses began to move in different directions, i.e., the high-altitude air masses moved west to the east end of Atushi before turning north; the air masses at 500 m followed the southern foot of the western Tianshan Mountains to Atushi and Kashi, the low-altitude air masses follows the southwest into the desert hinterland.
3.3 Temporal–spatial distributions of MODIS AOD and RCM AOD during this black storm episode
Figures 9A, C, E, G, I show the spatial distributions of MODIS AOD (the average value of the MOD AOD and the MYD AOD) during April 25–29 in eastern Asia. As shown, satellite remote-sensing retrieving under bright background remains an extremely difficult problem, as described by Huang et al. (2020) and Tao et al. (2017). The northwest of China is a vast region dominated by arid and semi-arid landforms such as deserts, wastelands, and sparse vegetation—specifically Xinjiang, with unique topographical features and two of the largest basins in China, i.e., Tarim Basin and Junggar Basin (Figure 1). In addition, in the period of more clouds or when the satellite inversion grid is completely covered by clouds, there will be a large number of non-random missing cases in satellite remote sensing AOD, and even the corresponding aerosol inversion results cannot be obtained (Jia et al., 2021). The complex underlying surface and cloud coverage make the satellite retrieval missing area (the white areas in Figures 9A, C, E, G, I) large, which is difficult to completely present the aerosol spatial distribution and obtain the transport process of dust aerosols. However, it can be roughly seen that the sandstorm appeared in Xinjiang from April 27 to 29, 2015, and the dust aerosols showed a trend of movements from east to west in the Xinjiang region. From April 25 to 26, the AOD of Xinjiang was relatively small, around 0.1. Dust aerosols entered Xinjiang on April 27, with high AOD areas (AOD >1.3) appearing in the north of Tianshan Mountains. On April 28, a high-value zone of AOD (AOD = 1.9) appeared at the junction of the southern Tarim Basin and Altun Mountains, and the high-value area, with the AOD lower than that on the 28th (between 1.0–1.4), was transferred to the western region of Xinjiang on April 29.
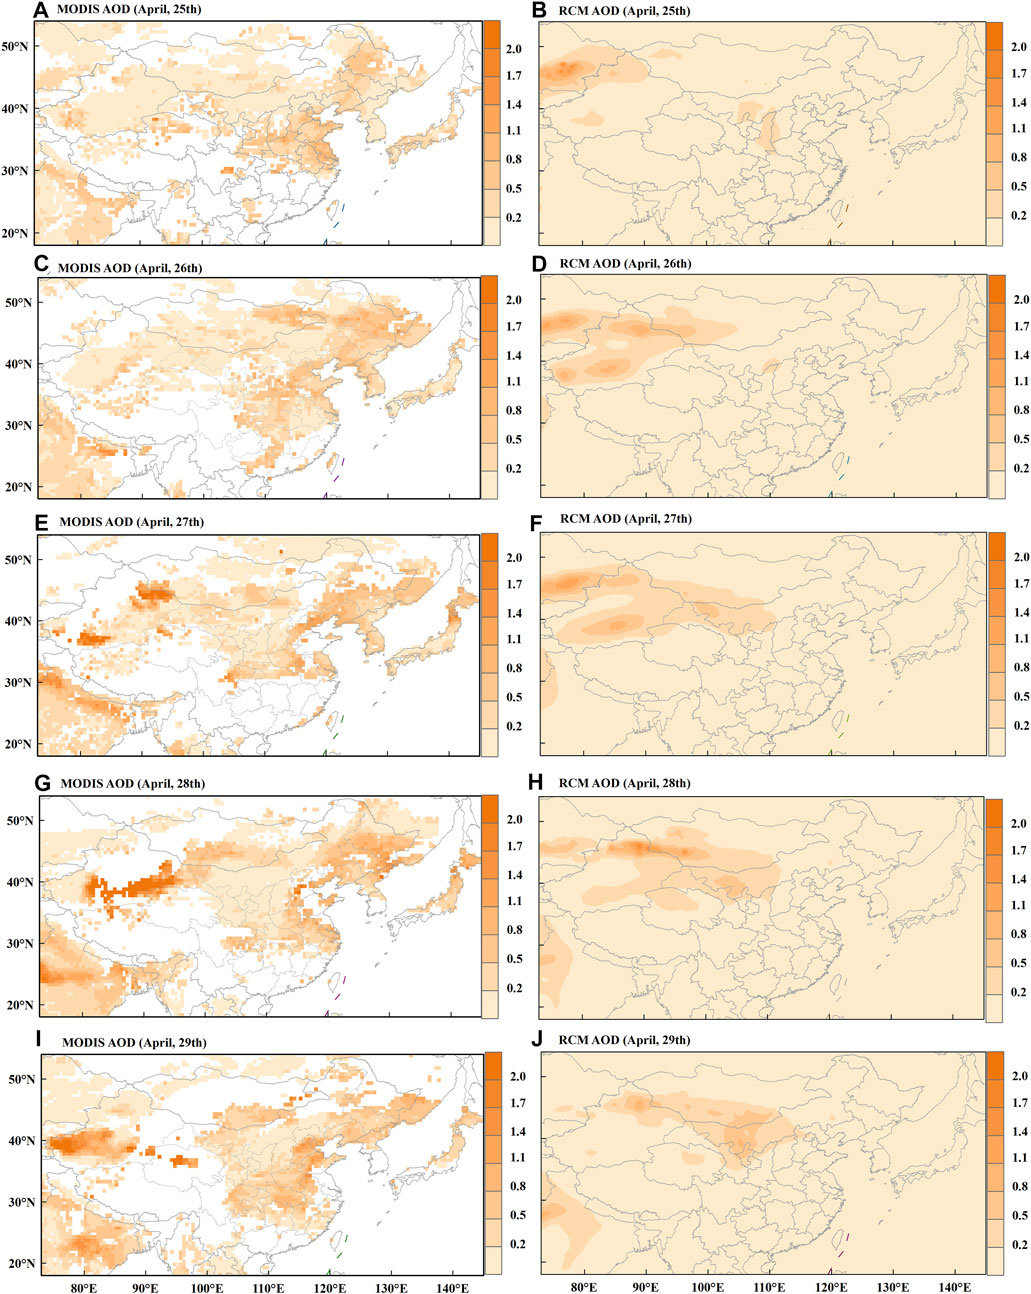
FIGURE 9. Spatial distributions of MODIS AOD (A, C, E, G, and I) and RCM AOD (B, D, F, H, and J) in eastern Asia during April 25–29, 2015.
The RegCM 4.6 simulated results (the mean value between 9:00 a.m. and 3:00 p.m. local time), which could resolve the limitation of satellite retrieval under the complex underlying surface conditions, were used to present a wider range of AOD spatial distribution. From the spatial distributions of RCM AOD on April 25–29 (Figures 9B, D, F, H, J), the spatial distribution of AOD was significantly affected by the underlying surface conditions; the high-value areas were predominant mostly in desert regions and basins, whereas the low-value areas mainly were in mountainous areas with relatively high altitude. Tarim Basin and Junggar Basin are the key areas of wind–sand activities, and their unique topography endows them with more dust emission conditions; under the influence of atmospheric circulation and meteorological conditions during sandstorms, there would be secondary or multiple dust generations. In addition, the AOD in the whole Xinjiang region was lower on April 25 and increased during 26–29. On the 25th, there was a high AOD area (AOD reached 1.3) in the Sarayye Siktra Desert in Kazakhstan; however, the AOD in the entire Xinjiang region was less than 0.5. On the 26th, the AOD high-value area (0.9–1.2) appeared in the Taklimakan Desert and the Gurbantungut Desert in Xinjiang, whereas that of the Taklimakan Desert was above 1.0 on the 27th. On the 28th, the high AOD area moved eastward to the Gurbantungut Desert and southern Mongolia and the western Gobi Desert, and AOD was small across Xinjiang on the 29th. Although the characteristics of aerosol transport from east to west in the Xinjiang region were not prominent, the dust was evidently from Kazakhstan and entered Xinjiang along the Tianshan Mountains.
As evident, the AOD from the simulation was generally lower than that retrieved by MODIS, particularly in eastern China. The primary reason for the underestimation is that the MODIS detected all types of aerosols, including black carbon, sulfate, and anthropogenic organic carbon, which were excluded in the current simulation. Moreover, the simulated AOD was also smaller than MODIS retrievals over the main desert areas (Qaidam Basin, Gobi Desert, Taklimakan Desert, etc.), partly because the MODIS overestimates the AOD magnitude over the semi-arid area due to large uncertainty related to the assumed surface reflectance (Remer et al., 2005; Levy et al., 2013). Overall, the spatial pattern of AOD from RegCM 4.6 simulation was similar to that from MODIS over the dust source region; however, the AOD was generally smaller. The dust emission is activated in the grid cell when the friction velocity, resolved as a function of RegCM 4.6 simulated wind speed and surface roughness, is higher than the minimum friction velocity threshold calculated with surface roughness and soil moisture (Zakey et al., 2006). The overestimated areas were between the Tianshan and Altay mountains, while the underestimated area was distributed in the Taklimakan Desert. The bias should be caused by complex topography and atmospheric circulation in the region which the model cannot effectively deal with (Liu et al., 2021).
3.4 Temporal–spatial distribution of NSR during this black storm episode
From the spatial distributions of the NSRSUR during April 25–29 (Figures 10A, C, E, G, I), the NSRSUR under the cloud-free condition was with a zonal distribution of “high in the south and low in the north.” Solar radiation was weak in high latitudes but strong in low latitudes (Liu et al., 2006). Xinjiang, the Himalayas, and the Saryesik Atyrau Desert in Kazakhstan had lower radiant fluxes, and the strong scattering effect of dust aerosols on solar radiation caused a decrease in NSRSUR (Zhang et al., 2018). On the 25th, there was an apparent low-value area of the NSRSUR, which was between 160–180 W•m-2 and simultaneously corresponded to the high-value area of AOD in the Atyrau Desert of Sareyesik. On the 26th, the NSRSUR in the central Tarim Basin of Xinjiang and the northern Junggar Basin, with high AOD values, were both small (below 170 W•m-2). On the 27th, the low-value area of NSRSUR in Xinjiang and Kazakhstan was enlarged, NSRSUR in most areas of Xinjiang was between 170–180 W•m-2, and there was a low value below 170 W·m-2 in the central part of the Tarim Basin. From 28–29th, the low-value area of NSRSUR moved eastward, and the range of the low-value area in western Inner Mongolia expanded on the 29th.
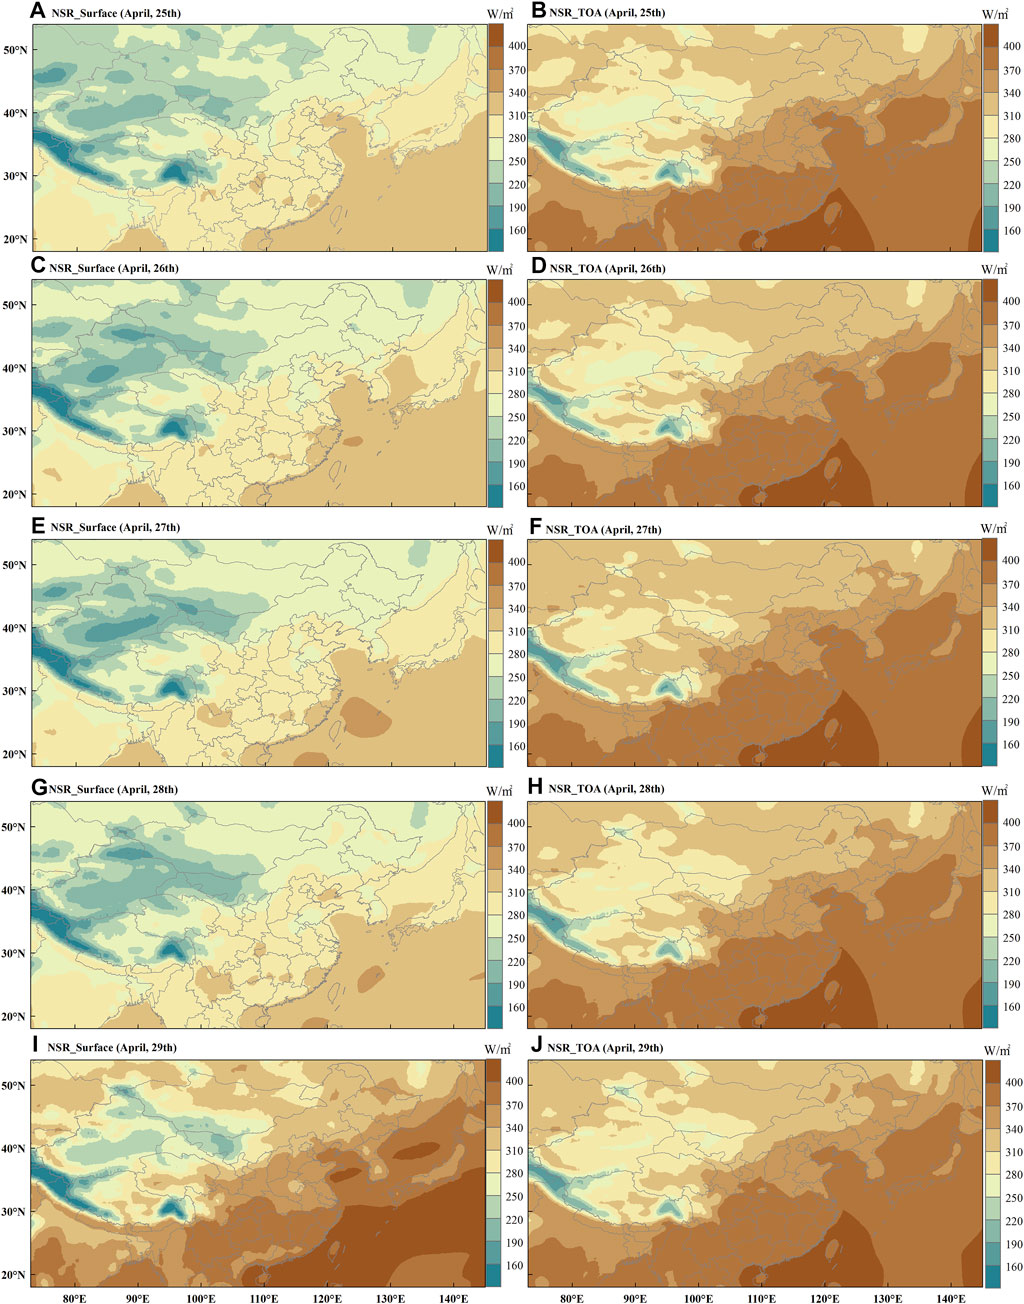
FIGURE 10. Spatial distributions of NSRSUR (A, C, E, G, and I) and NSRTOA (B, D, F, H, and J) under the cloudless condition in eastern Asia during April 25–29, 2015.
From the spatial distributions of NSRTOA under the cloud-free condition on April 25–29 (Figures 10B, D, F, H, J), the NSRTOA was generally higher than the NSRSUR. The basin and the Himalayas were still the low-value areas, whereas the low-value areas in Kazakhstan were relatively inconspicuous. The NSRTOA of the Tarim Basin was low on April 25 (260–280 W•m-2), and the low-value area expanded during April 26–27, with the NSRTOA falling below 240 W•m-2. Meanwhile, the radiation flux in the Saray Atyrau Desert in Kazakhstan decreased to approximately 290 W•m-2. On April 28–29, the NSRTOA of Xinjiang was higher than that on April 27–28, and the low-value area over Kazakhstan disappeared.
3.5 Temporal–spatial distribution of ADRF during this black storm episode
According to the spatial distributions of ADRFSUR on April 25–29 (Figures 11A, C, E, G, I), the dust aerosols had a significant cooling effect on the ground. All of the ADRFSUR corresponding to the high-value areas of AOD was negative, whereas the ADRFSUR of the areas with fewer dust aerosols was close to 0. On April 25, the ADRFSUR in the Saryesik Atyrau Desert in Kazakhstan was the largest (up to −91 W•m-2). On April 26, the ADRFSUR was more significant in the Sareysike Atyrau Desert, the Gurbantungut Desert in the Junggar Basin, and the western part of the Taklimakan Desert, where the AOD was greater than 0.9, with ADRFSUR ranging between −65 and −78 W•m-2. On April 27, the ADRFSUR was between −19 and −32 W•m-2 in some areas of Xinjiang, where the AOD was between 0.4 and 0.7. On April 28, a high-value area of ADRFSUR appeared in the Junggar Basin, up to −80 W•m-2, and there was a palpable correspondence with the high-value area of AOD in spatial distribution. ADRFSUR was above −70 W•m-2 in areas where the AOD value was higher than 0.7. With regard to the spatial distributions of the ADRFTOA on April 25–29 (Figures 11B, D, F, H, J), the maximum ADRFTOA was above −24 W•m-2, which was approximately a quarter of ADRFSUR. On April 25–28, the Saryesik Atyrau Desert in Kazakhstan was an area with high ADRFTOA, particularly during April 25–27; the ADRFTOA in this area was higher than −24 W•m-2. ADRFTOA in most parts of Xinjiang was approximately between 0 and −12 W•m-2. On April 29, the western part of Inner Mongolia was the high-value area of ADRFTOA with a clear correspondence with the high-value area of AOD.
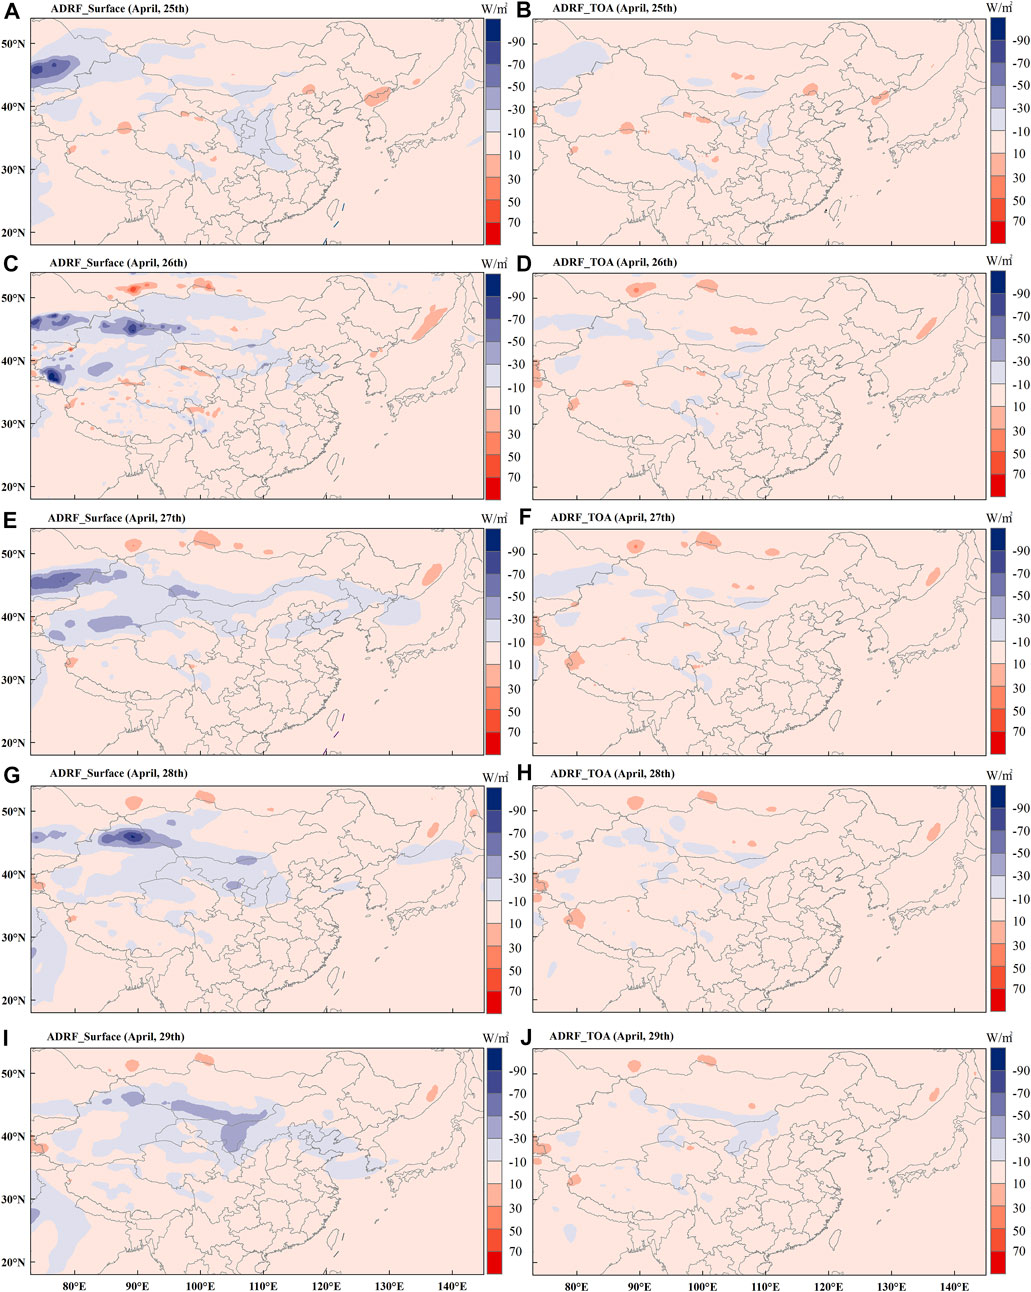
FIGURE 11. Spatial distributions of ADRFSUR (A, C, E, G, and I) and ADRFTOA (B, D, F, H, and J) from dust aerosols in eastern Asia during April 25–29, 2015.
As for the dust-induced radiative forcing, Kaskaoutis et al. (2019) examined the multiple dust storms that hit the eastern Mediterranean and Greece during March 2018; consequently, the ADRF estimates revealed a significant impact of dust on the radiation budget, with large (∼−40 to −50 W•m−2) decrease in SSR and an overall cooling effect at the TOA (∼−5 to −30 W•m−2). Wang (2013) noted that along with a heavy dust storm in northwestern China during April 24–30, 2010, for the Minqin and Semi-Arid Climate and Environment Observatory of Lanzhou University (SACOL) sites, the net dust aerosols direct radiative forcing ranged between −6 and −31 W•m−2 at the surface and 6–36 W•m−2 at the TOA. Huang et al. (2009) found that the average daily mean ADRF during a dust storm over the Taklimakan desert was 44 and −42 W•m−2 at the TOA and surface, respectively. Comparatively speaking, the black storm in our study had a stronger effect on radiation, and the resulting dust aerosols caused a greater degree of the radiation attenuation with a more significant cooling effect at the TOA and surface.
3.6 The near-surface temperature response to dust aerosols
Under the influence of the cold air accompanying the dust weather, the near-surface temperature in most areas decreased significantly, with a descending range of about 3.69°C–11.09°C. The near-surface temperature in Urumqi decreased from 16.00°C on the 25th to about 5.00°C on the 28th to 29th.
To further analyze the effect of dust aerosols produced by the black storm on near-surface temperature, we conducted two simulations under the condition that mode settings except the aerosol module remained unchanged; consequently, the TRSUR of dust aerosols was obtained. From the spatial distributions of TRSUR in eastern Asia during April 25–29, 2015 (Figure 12), a cooling phenomenon was observed in Xinjiang and Kazakhstan, affected by dust aerosols from the black storm. On April 25, the temperature in Xinjiang when dust aerosol appeared was 0.40°C–1.10°C lower than when there was no dust. On April 27, the area with a significant temperature decrease wasTarim Basin, where the temperature decreased by 0.30°C–1.60°C, and its center temperature decreased by 1.60°C–2.90°C. The region with a significant temperature decrease corresponded to the high-value region of ADRFSUR because the sensible heat flux entering the atmosphere can balance the surface shortwave radiative forcing of sand and dust for the cooling effect to be more pronounced in the region with significant surface shortwave radiative forcing. On April 29, sand and dust particles moving to western Inner Mongolia cooled down the region between 0.60°C–1.10°C. This further shows that dust aerosols have a cooling effect near the ground and that cooling of more than 2.00°C could occur in areas with high dust content. Researchers have analyzed the effect of eastern Asia dust aerosols on temperature and found that the ADRF can influence the rate of local temperature change and relative humidity; in addition, dust aerosols decrease the surface temperature in entire eastern Asia by approximately 0.21°C (Su et al., 2016; 2017).
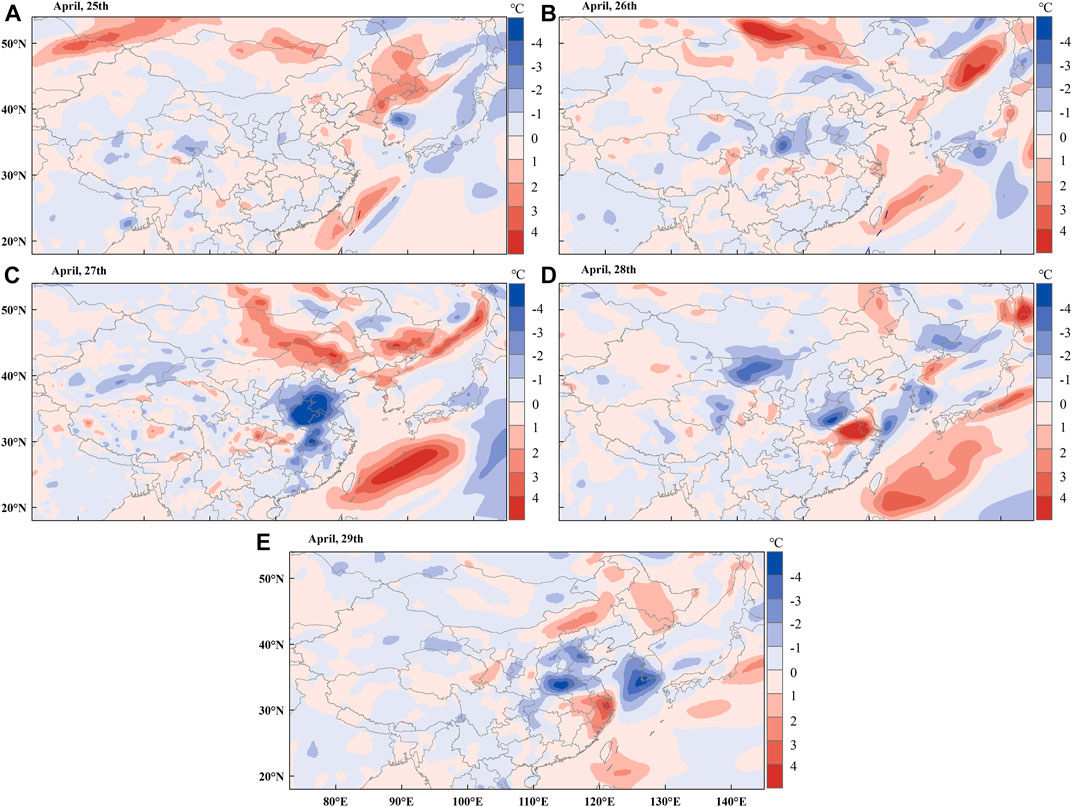
FIGURE 12. Spatial distributions of TRSUR in eastern Asia during April 25–29, 2015 [(A) April 25th; (B) April 26th; (C) April 27th; (D) April 28th; and (E) April 29th].
4 Conclusion
Atmospheric dust aerosols from dust storms can strongly scatter and absorb solar radiation, influencing the amount of solar radiation at the TOA and surface, and consequently, the near-surface temperature. Based on RegCM 4.6 simulation, combined with MODIS satellite retrieval, meteorological, and environmental observational data, this study reported the pollution situation, weather background, and backward trajectory during the black storm in Xinjiang during April 26–29, 2015. We also analyzed the temporal–spatial distribution of AOD, the effects of dust aerosols on solar radiation, and the near-surface temperature under this extreme weather condition.
This black storm, with PM10 as the major pollutant, was most severe on the 27th for the capital city of Xinjiang, Urumqi; the AQI, PM10, and PM2.5 increased, reaching their respective peaks of 500, 1,000 μg•m-3, and 628 μg•m-3, respectively. In addition, during the black storm, a large area of dust appeared in the southern Xinjiang Basin, and the main dust body displayed movement from east to west in southern Xinjiang from 27th to 29th. From the weather background, we can deduce that this process was caused by the surface cold high pressure and frontal transit under the background of the upper-air circulation of “two troughs and two ridges.” The climatic conditions in spring provided abundant sand sources for the occurrence of this black storm. The eastward movement of the cold front and the upper westerly winds continuously transmitted the dust aerosols carried by the dust to Inner Mongolia, North China, and other regions downstream, affecting a large range of East Asia. The backward trajectory showed that the air masses with the pollutants primarily originated from Xinjiang and Central Asia, entered Northern Xinjiang under the action of southwest airflow, and reached Urumqi along the north slope of Tianshan Mountain before pouring east into southern Xinjiang Basin.
Combined with the AOD from the satellite remote sensing and model simulation, we found that the dust of this black storm was from Kazakhstan, entered Xinjiang on April 27, and moved from the east to west in the Xinjiang region. Under the effect of geographical and climatic conditions, the areas with high AOD were mostly in desert regions and basins, including the Taklimakan Desert, whereas the low-value areas were primarily mountainous areas with relatively high altitudes. The AOD from RegCM 4.6 was generally lower than that of MODIS since the aerosol models of the MODIS and RegCM 4.6 are different and influenced differently by different underlying surfaces and climatic conditions.
Moreover, the dust aerosols from this black storm caused a significant decrease in NSR both at the TOA and surface, which was more significant at the surface. The cooling effect was more prominent in the regions with high AOD. ADRFSUR was above −70 W•m−2 in areas where the AOD value was higher than 0.70. The cooling effect at the TOA was not as significant as that at the surface; the maximum ADRFTOA was above −24 W•m−2, which was approximately a quarter of the surface. Moreover, the ADRF from dust aerosols decreased the near-surface temperature decrease, and the region with a significant temperature decrease corresponded to high-value areas of ADRFSUR/AOD. During this black storm, the near-surface temperature response to dust aerosols with high AOD was approximately 0.40°C–2.90°C; specifically, the TRSUR was above 2.00°C and the maximum reaching 2.90°C at the center of the black storm, with the near-surface temperature in most areas decreasing to approximately 3.69°C–11.09°C because of cold air.
Data availability statement
The raw data supporting the conclusion of this article will be made available by the authors, without undue reservation.
Author contributions
GH: investigation, formal analysis, charting, and writing—original draft preparation. YZ: charting and analysis of weather background. ZG: model simulation and analysis. XL: model simulation and validation. YC: writing—reviewing and editing and funding acquisition. QL: supervision and funding acquisition. ZT: literature search and collection. PW: conceptualization and charting. QH: data curation and funding acquisition. JG: charting. YZ: charting and analysis of weather background. All authors have read and agreed to the published version of the manuscript.
Funding
This work was supported by the National Natural Science Foundation of China (Grant Nos 41905131, 41830968, 41675026, and 41375021), the Science and Technology Planning Program of Xinjiang, China (Grant No. 2022E01047), the Natural Science Basic Research Program of Shaanxi Province, China (Grant No. 2021JQ-768), grants from Sichuan University Humanities and Social Sciences Key Research Base, and Meteorological Disaster Prediction, Early Warning and Emergency Management Research Center (No. ZHYJ21-ZD04).
Acknowledgments
MODIS and AERONET data used in this paper were obtained from the NASA Langley Research Center Atmospheric Science Data Center, and the reanalysis data were obtained from the NCEP. The authors are grateful to Xinjiang Meteorological Observatory and Xinjiang Environmental Protection Department for providing relevant data. The authors would like to thank the Home for Researchers editorial team (www.home-for-researchers.com) for the language editing service and the editor and the three reviewers for their helpful comments and suggestions.
Conflict of interest
The authors declare that the research was conducted in the absence of any commercial or financial relationships that could be construed as a potential conflict of interest.
Publisher’s note
All claims expressed in this article are solely those of the authors and do not necessarily represent those of their affiliated organizations, or those of the publisher, the editors, and the reviewers. Any product that may be evaluated in this article, or claim that may be made by its manufacturer, is not guaranteed or endorsed by the publisher.
References
Alizadeh-Choobari, O., Sturman, A., and Zawar-Reza, P. (2014). A global satellite view of the seasonal distribution of mineral dust and its correlation with atmospheric circulation. Dyn. Atmos. Oceans. 68, 20–34. doi:10.1016/j.dynatmoce.2014.07.002
Ashpole, I., and Washington, R. (2013). A new high-resolution central and Western Saharan summertime dust source map from automated satellite dust plume tracking. J. Geophys. Res. Atmos. 118, 6981–6995. doi:10.1002/jgrd.50554
Bi, D., He, Q., Li, J., Lu, Z., Zhou, C., Meng, L., et al. (2022). Study on a dust pollution process in Taklamakan Desert based on vertical observation by UAV. Acta Sci. Circumstantiae 42, 1–13. doi:10.13671/j.hjkxxb.2022.0146
Chi, M. X. (2020). Remote sensing of land uses in dust source regions of East Asia. Hohhot: Inner Mongolia Normal University.
Dickinson, R. E., Errico, R. M., Giorgi, F., and Bates, G. T. (1989). A regional climate model for the Western United-States. Clim. Chang. 15, 383–422. doi:10.1007/bf00240465
Emanuel, K. A. (1991). A scheme for representing cumulus convection in large-scale models. J. Atmos. Sci. 48, 2313–2329. doi:10.1175/1520-0469(1991)048<2313:ASFRCC>2.0.CO;2
Evan, A. T., Flamant, C., Fiedler, S., and Doherty, O. (2014). An analysis of aeolian dust in climate models. Geophys. Res. Lett. 41, 5996–6001. doi:10.1002/2014GL060545
Filonchyk, M., Yan, H., Shareef, T. M. E., and Yang, S. (2019). Aerosol contamination survey during dust storm process in Northwestern China using ground, satellite observations and atmospheric modeling data. Theor. Appl. Climatol. 135, 119–133. doi:10.1007/s00704-017-2362-8
Frei, C., Christensen, J. H., Deque, M., Jacob, D., Jones, R. G., and Vidale, P. L. (2003). Daily precipitation statistics in regional climate models: Evaluation and intercomparison for the European alps. J. Geophys. Res. Atmos. 108, 4124. doi:10.1029/2002JD002287
Gao, Y., Zhang, M., Liu, Z., Wang, L., Wang, P., Xia, X., et al. (2015). Modeling the feedback between aerosol and meteorological variables in the atmospheric boundary layer during a severe fog–haze event over the North China Plain. Atmos. Chem. Phys. 15 (8), 4279–4295. doi:10.5194/acp-15-4279-2015
Gao, Z., Hu, X., Zhang, X., and Wang, Y. (2022). Characteristic analysis of three sand-dust storm process in 2021 based on FY-4A satellite remote sensing data. Meteorological Sci. Technol. 50, 536–544.
Garcia-Pando, C. P., Stanton, M. C., Diggle, P. J., Trzaska, S., Miller, R. L., Perlwitz, J. P., et al. (2014). Soil dust aerosols and wind as predictors of seasonal meningitis incidence in Niger. Environ. Health Persp. 122, 679–686. doi:10.1289/ehp.1306640
Ge, J. M., Su, J., Ackerman, T. P., Fu, Q., Huang, J. P., and Shi, J. S. (2010). Dust aerosol optical properties retrieval and radiative forcing over northwestern China during the 2008 China-U.S. joint field experiment. J. Geophys. Res. 115, D00K12. doi:10.1029/2009JD013263
Gehlot, S., Minnett, P. J., and Stammer, D. (2015). Impact of Sahara dust on solar radiation at Cape Verde Islands derived from MODIS and surface measurements. Remote Sens. Environ. 166, 154–162. doi:10.1016/j.rse.2015.05.026
Giorgi, F., Coppola, E., Solmon, F., Mariotti, L., Sylla, M., Bi, X., et al. (2011). RegCM 4: Model description and preliminary tests over multiple CORDEX domains. Clim. Res. 52 (1), 7–29. doi:10.3354/cr01018
Giorgi, F., and Mearns, L. O. (1999). Introduction to special section: Regional climate modeling revisited. J. Geophys. Res. Atmos. 104, 6335–6352. doi:10.1029/98JD02072
Holtslag, A. A. M., Debruijn, E. I. F., and Pan, H. L. (1990). A high-resolution air-mass transformation model for short-range weather forecasting. Mon. Weather Rev. 118, 1561–1575. doi:10.1175/1520-0493(1990)118<1561:ahramt>2.0.co;2
Huang, G., Chen, Y., Li, Z., Liu, Q., Wang, Y., He, Q., et al. (2020). Validation and accuracy analysis of the collection 6.1 MODIS aerosol optical depth over the westernmost city in China based on the sun-sky radiometer observations from SONET. Earth Space Sci. 7, e2019EA001041. doi:10.1029/2019EA001041
Huang, G., Liu, Q., Wang, Y., He, Q., Chen, Y., Jin, L., et al. (2020). The accuracy improvement of clear-sky surface shortwave radiation derived from CERES SSF dataset with a simulation analysis. Sci. Total Environ. 749, 141671. doi:10.1016/j.scitotenv.2020.141671
Huang, G., Liu, S., and Liang, S. (2012). Estimation of net surface shortwave radiation from MODIS data. Int. J. Remote Sens. 33, 804–825. doi:10.1080/01431161.2011.577834
Huang, J., Fu, Q., Su, J., Tang, Q., Minnis, P., Hu, Y., et al. (2009). Taklimakan dust aerosol radiative heating derived from CALIPSO observations using the Fu-Liou radiation model with CERES constraints. Atmos. Chem. Phys. 9, 4011–4021. doi:10.5194/acp-9-4011-2009
Huang, J., Minnis, P., Chen, B., Huang, Z., Liu, Z., Zhao, Q., et al. (2008). Long-range transport and vertical structure of Asian dust from CALIPSO and surface measurements during PACDEX. J. Geophys. Res. Atmos. 113, D23212. doi:10.1029/2008JD010620
Huang, J., Wang, T., Wang, W., Li, Z., and Yan, H. (2014). Climate effects of dust aerosols over East Asian arid and semiarid regions. J. Geophys. Res. Atmos. 119, 11398–11416. doi:10.1002/2014JD021796
Jia, H., Ma, X., Yu, F., and Quaas, J. (2021). Significant underestimation of radiative forcing by aerosol–cloud interactions derived from satellite-based methods. Nat. Commun. 12, 3649. doi:10.1038/s41467-021-23888-1
Kang, L., Chen, S., Huang, J., Zhao, S., Ma, X., Yuan, T., et al. (2017). The spatial and temporal distributions of absorbing aerosols over East Asia. Remote Sens. 9 (10), 1050. doi:10.3390/rs9101050
Kaskaoutis, D. G., Dumka, U. C., Rashki, A., Psiloglou, B. E., Gavriil, A., Mofidi, A., et al. (2019). Analysis of intense dust storms over the eastern Mediterranean in March 2018: Impact on radiative forcing and Athens air quality. Atmos. Environ. 209, 23–39. doi:10.1016/j.atmosenv.2019.04.025
Kaskaoutis, D. G., Kambezidis, H. D., Jacovides, C. P., and Steven, M. D. (2006). Modification of solar radiation components under different atmospheric conditions in the Greater Athens area, Greece. J. Atmos. Solar-Terr. Phys. 68, 1043–1052. doi:10.1016/j.jastp.2005.05.002
Kaufman, Y. J., Tanre, D., Gordon, H. R., Nakajima, T., Lenoble, J., Frouin, R., et al. (1997). Passive remote sensing of tropospheric aerosol and atmospheric correction for the aerosol effect. J. Geophys. Res. Atmos. 102, 16815–16830. doi:10.1029/97JD01496
Kedia, S., Kumar, R., Islam, S., Sathe, Y., and Kaginalkar, A. (2018). Radiative impact of a heavy dust storm over India and surrounding oceanic regions. Atmos. Env. 185, 109–120. doi:10.1016/j.atmosenv.2018.05.005
Kiehl, J. T., Hack, J. J., Bonan, G. B., Boville, B. A., Williamson, D. L., and Rasch, P. J. (1998). The national center for atmospheric research community climate model: CCM3. J. Clim. 11, 1131–1149. doi:10.1175/1520-0442(1998)011<1131:TNCFAR>2.0.CO;2
Korotaeva, N. E., Ivanova, M. V., Suvorova, G. G., and Borovskii, G. B. (2018). The impact of the environmental factors on the photosynthetic activity of common pine (Pinus sylvestris) in spring and in autumn in the region of Eastern Siberia. J. For. Res. 29, 1465–1473. doi:10.1007/s11676-017-0582-5
Lau, W. K. M., Kim, K. M., Shi, J. J., Matsui, T., Chin, M., Tan, Q., et al. (2017). Impacts of aerosol monsoon interaction on rainfall and circulation over Northern India and the Himalaya Foothills. Clim. Dyn. 49, 1945–1960. doi:10.1007/s00382-016-3430-y
Levy, R. C., Mattoo, S., Munchak, L. A., Remer, L. A., Sayer, A. M., Patadia, F., et al. (2013). The Collection 6 MODIS aerosol products over land and ocean. Atmos. Meas. Techn. 6, 2989–3034. doi:10.5194/amt-6-2989-2013
Li, H., Chen, H., Wang, H., and Yu, E. (2018). Future precipitation changes over China under 1.5 °C and 2.0 °C global warming targets by using CORDEX regional climate models. Sci. Total Environ. 640, 543–554. doi:10.1016/j.scitotenv.2018.05.324
Li, J., Jian, B., Huang, J., Hu, Y., Zhao, C., Kawamoto, K., et al. (2018). Long-term variation of cloud droplet number concentrations from space-based Lidar. Remote Sens. Environ. 213, 144–161. doi:10.1016/j.rse.2018.05.011
Li, Y., Hou, Y., Sang, Y., Luo, W., Xiao, X., and Lei, F. (2020). Research progress of respiratory system injury caused by dust weather and its mechanism. Chin. J. New Clin. Med. 13 (10), 1056–1061.
Liu, H., Zhang, D., and Wang, B. (2006). Recent advances in regional climate modeling and applications. Clim. Environ. Res. 11, 649–668. (in Chinese).
Liu, X., Chen, S., Guo, Z., Zhou, H., Chen, Y., Kang, Y., et al. (2021). The influence of dusts on radiation and temperature over the eastern Asia with a regional climate model. Sci. Total Environ. 792, 148351. doi:10.1016/j.scitotenv.2021.148351
Liu, X., Kang, Y., Liu, Q., Guo, Z., Chen, Y., Huang, D., et al. (2020). Evaluation of net shortwave radiation over China with a regional climate model. Clim. Res. 80, 147–163. doi:10.3354/cr01598
Maghrabi, A. H., and Al-Dosari, A. F. (2016). Effects on surface meteorological parameters and radiation levels of a heavy dust storm occurred in Central Arabian Peninsula. Atmos. Res. 182, 30–35. doi:10.1016/j.atmosres.2016.07.024
Maghrabi, A. (2017). The influence of dust storms on solar radiation data, aerosol properties and meteorological variables in Central Arabian Peninsula. Int. J. Environ. Sci. Te. 14, 1643–1650. doi:10.1007/s13762-017-1279-1
Mahowald, N. M., Kloster, S., Engelstaedter, S., Moore, J. K., Mukhopadhyay, S., McConnell, J. R., et al. (2010). Observed 20th century desert dust variability: Impact on climate and biogeochemistry. Atmos. Chem. Phys. 10, 10875–10893. doi:10.5194/acp-10-10875-2010
McClintock, M. A., McDowell, W. H., González, G., Schulz, M., and Pett-Ridge, J. C. (2019). African dust deposition in Puerto Rico: Analysis of a 20-year rainfall chemistry record and comparison with models. Atmos. Environ. 216, 116907. doi:10.1016/j.atmosenv.2019.116907
Middleton, N. (2017). Desert dust hazards: A global review. Aeolian Res. 24, 53–63. doi:10.1016/j.aeolia.2016.12.001
Middleton, N., and Kang, U. (2017). Sand and dust storms: Impact mitigation. Sustainability 9, 1053. doi:10.3390/su9061053
Nabat, P., Solmon, F., Mallet, M., Kok, J. F., and Somot, S. (2012). Dust emission size distribution impact on aerosol budget and radiative forcing over the mediterranean region: A regional climate model approach. Atmos. Chem. Phys. 12, 10545–10567. doi:10.5194/acp-12-10545-2012
Nguyen, H. D., Riley, M., Leys, J., and Salter, D. (2019). Dust storm event of February 2019 in central and East Coast of Australia and evidence of long-range transport to New Zealand and Antarctica. Atmosphere 10, 653. doi:10.3390/atmos10110653
Pu, X., Wang, T., Huang, X., Melas, D., Zanis, P., Papanastasiou, D. K., et al. (2017). Enhanced surface ozone during the heat wave of 2013 in Yangtze River Delta region, China. Sci. Total Environ. 603, 807–816. doi:10.1016/j.scitotenv.2017.03.056
Qi, Y., Ge, J., and Huang, J. (2013). Spatial and temporal distribution of MODIS and MISR aerosol optical depth over northern China and comparison with AERONET. Atmos. Sci. 58, 2497–2506. doi:10.1007/s11434-013-5678-5
Qin, H., Yang, X., Ma, L., Wang, Y., Fu, C., Zhang, J., et al. (2022). Characteristics and causes of regional sandstorms in Northwest of China from 2000 to 2020. J. Desert Res. 42, 53–64. (in Chinese).
Remer, L. A., Kaufman, Y. J., Tanre, D., Mattoo, S., Chu, D. A., Martins, J. V., et al. (2005). The MODIS aerosol algorithm, products, and validation. J. Atmos. Sci. 62, 947–973. doi:10.1175/JAS3385.1
Saeed, T. M., Al-Dashti, H., and Spyrou, C. (2014). Aerosol’s optical and physical characteristics and direct radiative forcing during a shamal dust storm, a case study. Atmos. Chem. Phys. 14, 3751–3769. doi:10.5194/acp-14-3751-2014
Salvador, P., Molero, F., Fernandez, A. J., Tobías, A., Pandolfi, M., Gómez-Moreno, F. J., et al. (2019). Synergistic effect of the occurrence of African dust outbreaks on atmospheric pollutant levels in the Madrid metropolitan area. Atmos. Res. 226, 208–218. doi:10.1016/j.atmosres.2019.04.025
Samset, B. H., Sand, M., Smith, C. J., Bauer, S. E., Forster, P. M., Fuglestvedt, J. S., et al. (2018). Climate impacts from a removal of anthropogenic aerosol emissions. Geophys. Res. Lett. 45, 1020–1029. doi:10.1002/2017GL076079
Solmon, F., Elguindi, N., and Mallet, M. (2012). Radiative and climatic effects of dust over West Africa, as simulated by a regional climate model. Clim. Res. 52, 97–113. doi:10.3354/cr01039
Solmon, F., Giorgi, F., and Liousse, C. (2006). Aerosol modelling for regional climate studies: Application to anthropogenic particles and evaluation over a European/african domain. Tellus Ser. B Chem. Phys. Meteorol. 58, 51–72. doi:10.1111/j.1600-0889.2005.00155.x
Su, X., Li, K., Wer, Q., and Wen, W. (2016). The optical properties of East Asian dust aerosol and its impact on radiative forcing and temperature. J. Desert Res. 36, 1381–1390. (in Chinese). doi:10.7522/j.issn.1000-694X.2015.00154
Su, X., Sun, H., and Bian, S. (2022). Validation of RegCM-Dust model for simulating a sand-dust storm in East Asia. Meteorology Disaster Reduct. Res. 45, 145–150. (in Chinese). doi:10.12013/qxyjzyj20222-021
Su, X., Zhang, Z., and Ou, L. (2017). Prediction on dust in spring during 2015-2100 over East Asia under A1B scenario. J. Desert Res. 37, 315–320. (in Chinese). doi:10.7522/j.issn.1000-694X.2015.00226
Sugimoto, N., Hara, Y., Shimizu, A., Nishizawa, T., Matsui, I., and Nishikawa, M. (2013). Analysis of dust events in 2008 and 2009 using the lidar network, surface observations and the CFORS model. Asia-Pac. J. Atmos. Sci. 49, 27–39. doi:10.1007/s13143-013-0004-3
Tao, M., Chen, L., Wang, Z., Wang, J., Che, H., Xu, X., et al. (2017). Evaluation of MODIS Deep Blue aerosol algorithm in desert region of East Asia: Ground validation and intercomparison. J. Geophys. Res. Atmos. 122, 10357–10368. doi:10.1002/2017jd026976
Tian, L., Zhang, W., Chang, Z., Mu, J., Cao, N., and Ma, S. (2018). Influence of spring dust aerosol on radiation over the arid area in Hexi Corridor. Arid. Land Geogr. 41, 923–929. (in Chinese). doi:10.12118/j.issn.1000-6060.2018.05.03
Tummon, F., Solmon, F., Liousse, C., and Tadross, M. (2010). Simulation of the direct and semidirect aerosol effects on the southern Africa regional climate during the biomass burning season. J. Geophys. Res. Atmos. 115, D19206. doi:10.1029/2009JD013738
Wang, M., Su, J., Li, X., Wang, C., and Ge, J. (2019). Parameterization of the single-scattering properties of dust aerosols in radiative flux calculations. Atmosphere 10, 728. doi:10.3390/atmos10120728
Wang, T., Han, Y., Huang, J., Sun, M., Jian, B., Huang, Z., et al. (2020). Climatology of dust-forced radiative heating over the Tibetan Plateau and its surroundings. J. Geophys. Res. Atmos. 125, e2020JD032942. doi:10.1029/2020JD032942
Wang, W. C. (2013). Observation study of dust aerosols’ transport and climate effect. Lanzhou: Lanzhou University.
Wang, W., Huang, J., Zhou, T., Bi, J., Lin, L., Chen, Y., et al. (2013). Estimation of radiative effect of a heavy dust storm over northwest China using Fu–Liou model and ground measurements. J. Quant. Spectrosc. Ra. 122, 114–126. doi:10.1016/j.jqsrt.2012.10.018
Wang, X., Huang, J., Zhang, R., Chen, B., and Bi, J. (2010). Surface measurements of aerosol properties over northwest China during ARM China 2008 deployment. J. Geophys. Res. Atmos. 115, D00K27. doi:10.1029/2009JD013467
Wang, X., Liu, J., Che, H., Ji, F., and Liu, J. (2018). Spatial and temporal evolution of natural and anthropogenic dust events over northern China. Sci. Rep. 8, 2141. doi:10.1038/s41598-018-20382-5
Watson, J. G., Bachmann, J. D., Wierman, S. S., Mathai, C., Malm, W. C., White, W. H., et al. (2002). Visibility: Science and regulation. J. Air Waste Manage. Assoc. 52, 973–999. doi:10.1080/10473289.2002.10470844
Wu, C., Lin, Z., Liu, X., Li, Y., Lu, Z., and Wu, M. (2018). Can climate models reproduce the decadal change of dust aerosol in East Asia? Geophys. Res. Lett. 45, 9953–9962. doi:10.1029/2018GL079376
Xie, X., Wang, T., Yue, X., Li, S., Zhuang, B., Wang, M., et al. (2019). Numerical modeling of ozone damage to plants and its effects on atmospheric CO2 in China. Atmos. Environ. 217, 116970. doi:10.1016/j.atmosenv.2019.116970
Yan, H., and Wang, T. (2020). Ten years of aerosol effects on single-layer overcast clouds over the US Southern Great Plains and the China Loess Plateau. Adv. Meteorol. 6719160, 1–15. doi:10.1155/2020/6719160
Yan, L., Liu, X., Yang, P., Yin, Z., and North, G. (2011). Study of the impact of summer monsoon circulation on spatial distribution of aerosols in East Asia based on numerical simulations. J. Appl. Meteorol. Climatol. 50, 2270–2282. doi:10.1175/2011JAMC-D-11-06.1
Zakey, A. S., Solmon, F., and Giorgi, F. (2006). Implementation and testing of a desert dust module in a regional climate model. Atmos. Chem. Phys. 6, 4687–4704. doi:10.5194/acp-6-4687-2006
Zhang, J., Li, Y., Wu, Z., Chen, Z., and Yang, Y. (2018). Projected climate change in Guizhou during 2018-2050. Meteorological Sci. Technol. 46, 1165–1171. (in Chinese).
Zhang, L., Song, G., Fan, F., Wu, H., Zou, Y., Zhou, Z., et al. (2022). Diagnosis of sandstorm weather process and analysis of sand pollution transportation in northern China from 14th to 16th, March 2021. Acta Sci. Circumstantiae 42, 351–363. doi:10.13671/j.hjkxxb.2021.0452
Zhao, C., Li, Y., Zhang, F., Sun, Y., and Wang, P. (2018). Growth rates of fine aerosol particles at a site near Beijing in June 2013. Adv. Atmos. Sci. 35, 209–217. doi:10.1007/s00376-017-7069-3
Zhao, J., Ma, X., Wu, S., and Sha, T. (2020). Dust emission and transport in northwest China: WRF-chem simulation and comparisons with multi-sensor observations. Atmos. Res. 241, 104978. doi:10.1016/j.atmosres.2020.104978
Zhou, C., Liu, Y., He, Q., Zhong, X., Zhu, Q., Yang, F., et al. (2022a). Dust characteristics observed by unmanned aerial vehicle over the Taklimakan Desert. Remote Sens. 14 (4), 990. doi:10.3390/rs14040990
Keywords: black storm, AOD (aerosol optical depth), radiative forcing (RF), RegCM 4.6, Xinjiang
Citation: Huang G, Zhou Y, Guo Z, Liu X, Chen Y, Liu Q, Ta Z, Wang P, He Q, Gao J and Zhang Y (2023) The influence of dust aerosols on solar radiation and near-surface temperature during a severe duststorm transport episode. Front. Environ. Sci. 11:1126302. doi: 10.3389/fenvs.2023.1126302
Received: 17 December 2022; Accepted: 15 February 2023;
Published: 28 February 2023.
Edited by:
Haofei Yu, University of Central Florida, United StatesReviewed by:
Sanjeevi Nagalingam, University of California, Irvine, United StatesYang Zhang, Chengdu University of Information Technology, China
Xiefei Zhi, Nanjing University of Information Science and Technology, China
Copyright © 2023 Huang, Zhou, Guo, Liu, Chen, Liu, Ta, Wang, He, Gao and Zhang. This is an open-access article distributed under the terms of the Creative Commons Attribution License (CC BY). The use, distribution or reproduction in other forums is permitted, provided the original author(s) and the copyright owner(s) are credited and that the original publication in this journal is cited, in accordance with accepted academic practice. No use, distribution or reproduction is permitted which does not comply with these terms.
*Correspondence: Yonghang Chen, yonghangchen@126.com