Coupling coordination degree and influencing factors of green science and technology innovation efficiency and digital economy level: Evidence from provincial panel data in China
 Zhang Mingkai1
  Yang Guangming
- 1Faculty of Management and Economics, Kunming University of Science and Technology, Kunming, China
- 2School of Business Administration, Chongqing Technology and Business University, Chongqing, China
- 3School of Management, Chongqing University of Technology, Chongqing, China
Green innovation and the digital economy are the new engine and driving force for Chinese high-quality development and will become the mainstream of China’s high-quality development. Therefore, it is of great significance to explore the interaction between the two for the formulation of economic development policies. This paper constructed an evaluation system of green science and technology innovation efficiency (GSTIE) and digital economy level (DEL) based on 30 provinces in China. Through the corrected coupling coordination degree (CCD) model, this paper measured the coupling coordination degree of green science and technology innovation efficiency and DEL and analyzed its provincial differences and spatial effects. By employing the fuzzy set Qualitative Comparative Analysis (fsQCA) method, this paper further explored the influencing factors configuration affecting the coupling coordination degree of GSTIE and DEL. The research results are as follows. Compared with the development of green science and technology innovation, the development of the digital economy was relatively backward. The coupling coordination degree between China’s provincial GSTIE and DEL showed an overall increasing trend year by year, and there was obvious spatial heterogeneity in which the eastern region was the highest, followed by the western and central regions. A single influencing factor does not constitute a necessary condition for a high coupling coordination degree. There were four paths that improve the coordinated development level between GSTIE and DEL: HC + RD + OP-jointly driven, RD + OP-dual driven, HC + GS-dual driven, and GS-oriented. Finally, based on the research conclusions, this paper proposed corresponding policy suggestions.
1 Introduction
Since the reform and opening up, China’s economy has developed and grown rapidly and made remarkable achievements. The major strategic evidence that China’s economy has entered a stage of high-quality development from a stage of high-speed development was clearly highlighted in the meeting of the Political Bureau of the Central Committee of the Communist Party of China. However, pursuing rapid economic development has caused numerous problems, including resource shortage and environmental degradation, which have restricted the sustainable development of the economy and environment in China (Tang and Li, 2022). To solve these problems and achieve high-quality development, China should take the path of green development and rely on the implementation of an innovation-driven development strategy (Wang Q. et al., 2022). Unlike traditional innovation, green innovation, with innovation-driven and green development two special characteristics, is a combination of technology innovation and environmental protection (Dai et al., 2021). As an important carrier to promoting green development, green science and technology innovation is a kind of technology innovation, which focuses on environmental management and highlights the concept of sustainable development (Zheng et al., 2021). The improvement of green science and technology innovation efficiency (GSTIE) is an important way to accelerate the realization of green and sustainable development (Zhou et al., 2020). With green sustainable development becoming increasingly popular, GSTIE is gradually becoming a hot topic that is studied in academia and practice (Hosan et al., 2022). At the same time, with the rapid development and wide application of digital technology, the digital economy came into being, which is a new type of economy different from the traditional agricultural and industrial economy (Li et al., 2023). The new round of scientific and technological revolution represented by the digital economy has led human society into the era of digital economy (Zhao T. et al., 2020). According to the White Paper on China’s Digital Economy (2022) released by the China Institute of Information and Communication, the scale of China’s digital economy has reached 45.5 trillion yuan in 2021, with a year-on-year nominal growth of 16.2%, accounting for 39.8% of the proportion of GDP. The rapid rise of the digital economy provides not only opportunities for China to build new national competitive advantages but also an important path for China’s green innovation development. Digital technology, represented by big data, artificial intelligence and the Internet, has the advantages of high intelligence, which can provide favorable environmental support and factor supply for green technology innovation (Wang F. et al., 2022). Green science and technology innovation and digital economy will become the mainstream of China’s economic development. It can be seen that both green science and technology innovation and the digital economy perform an essential role in promoting the green development in China. At present, improving GSTIE and DEL is the strategic focus in China. According to systems theory, both green science and technology innovation and the digital economy are constantly developing and perfect dynamic systems. What is the coupling relationship between the two subsystems in the same social market environment? What is the degree of coupling development of the two and what factors jointly affect their coordinated development? To answer these questions, this study explores the coordinated development of GSTIE and the digital economy level (DEL) subsystems and its influencing factors, which is conducive to the formulation of a two-way driving strategy and the formation of a virtuous cycle between the two subsystems.
The remaining parts of this paper are arranged as follows: Section 2 reviews relevant literature; Section 3 introduces the construction of indicator system, data sources, and research methods; Section 4 reports the measurement results, temporal and spatial dynamics, and spatial correlation; Section 5 provides information on variable selection and discusses the influencing factors of the coupling coordination degree (CCD); Section 6 summarizes the research results and proposes policy recommendations.
2 Literature review
In academia, many researchers have studied the efficiency of technology or science and technology, whereas there is still a lack of research on GSTIE. Based on the content, the existing literature can be mainly classified into the aspects outlined below. In studies that evaluated GSTIE, most of the researchers built evaluation index systems that contain multiple indicators based on the perspective of input-output and used data envelopment analysis (DEA) (Luo et al., 2019; Wang et al., 2020; Liu B. et al., 2021), stochastic frontier analysis (Faria et al., 2019), and other methodologies to measure or evaluate the innovation efficiency. In addition, some scholars measured the efficiency of green innovation by applying the super-efficiency slack-based measure (SBM) model (Peng et al., 2021). The super-efficient SBM model, which was developed by Tone after making improvements based on the traditional DEA model, could effectively overcome the problem that the undesired output was ignored by the traditional DEA model, as well as achieve the comparison of multiple effective decision units (Zhao P. et al., 2020). It has become a mainstream method widely used by academic researchers to evaluate innovation efficiency.
Other studies focused on the spatial difference of GSTIE. For instance, using the method of the Dagum Gini coefficient and its subgroup decomposition, kernel density estimation, and the spatial Markov chain, Yao et al. (2022) discussed the convergence characteristics and dynamic evolution rule of industrial green technology innovation efficiency in 110 cities of the Yangtze River Economic Belt from 2006 to 2020 (Yao et al., 2022). Utilizing the combination of the global Super-Epsilon-based measure (EBM) model, vector autoregression model, block model, and Moran index, Wang and Zhang (2021) conducted an empirical study on the spatial-temporal features of the green innovation efficiency of China’s 30 provinces and analyzed its spatial heterogeneity and spatial correlation network characteristics (Wang and Zhang, 2021). Moreover, some scholars have conducted studies on the spatial differences in green innovation efficiency using different scales. For example, Peng et al. (2019) studied the green innovation efficiency in the Yangtze River Economic Belt, and their results showed that the green innovation efficiency levels of the upper, middle, and lower reaches of the Yangtze River were substantially different (Peng et al., 2019). Besides, Liu et al. (2020), taking China’s high-tech industry as the research object, conducted an empirical study on the regional differences and influencing factors of the green technology innovation efficiency of China’s high-tech industry clusters, the results revealed that the factors affecting the green innovation efficiency of high-tech industry varied by cluster area (Liu et al., 2020).
In studies on the influencing factors of GSTIE, scholars selected indicators such as economic development level, research and development (R&D) investment in science and technology, education level, government subsidies, and environmental regulation and conducted empirical research and quantitative analysis on the factors influencing green innovation efficiency in combination with econometric models (Yi et al., 2020). Furthermore, other scholars studied the influence of carbon trading policies (Liu B. et al., 2021), upgrading industrial structure (Du et al., 2021), and green finance (Lee and Lee, 2022) on green innovation efficiency.
Moreover, studies on the digital economy paid particular attention to the definition, measurement, and influential mechanism of the digital economy. The digital economy was first formally defined by American scholar Tapscott (1996) as a virtual economic system developed by relying on information infrastructure such as the Internet and e-commerce. At the Hangzhou G20 Summit held in China in 2016, the leadership of all the countries gave a unified definition of the digital economy: an economic activity, in which digital knowledge and information were taken as a key factor of production, the modern information network was regarded as an important carrier, and the effective use of information and communication technology was taken as an important driving force for the improvement of efficiency and optimization of economic structure. Bukht and Heeks (2018) understood the digital economy as a proportion of economic output, which is generated based on digital technology, the digital sector, and platform services (Bukht and Heeks, 2018).
In terms of research methods, increasingly diverse research methodologies have been used for the measurement of DEL in the academic world. Most scholars chose the entropy method (Li and Liu, 2021; Luo and Zhou, 2022), whereas a few scholars chose principal component analysis and the coefficient of variation method based on sub-analysis to conduct relevant studies on the measurement of DEL. Regarding the measurement method, the academic community mainly adopts the comprehensive measurement method of constructing the evaluation system of the digital economy, composed of multiple dimension indicators such as infrastructure construction and internet level (Li and Liu, 2021; Luo and Zhou, 2022; Zhang et al., 2022). At present, there has not yet reached a unified standard on the comprehensive evaluation index system for the development of the digital economy. In the research on the impact mechanism of the digital economy, previous studies paid particular attention to the social and economic impact of the digital economy. Scholars have conducted studies on the impact of the digital economy on green development efficiency (Luo K. et al., 2022), carbon emission performance (Zhang, et al., 2022), resource consumption (Pouri, 2021), regional sustainable development (Yang Q. et al., 2022), and high-quality green development (Ma and Zhu, 2022).
As shown above, the academic community has generated fruitful research achievements related to the construction and measurement of green science and technology innovation index systems; temporal and spatial differentiation or evolution pattern; influencing factors; and the connotation, measurement, and impact mechanism of the digital economy; however, there is still a lack of studies that directly linked green science and technology innovation with the digital economy, and the research on the relationship between the two is still in the stage of further exploration. Although some researchers have studied the relationship between the digital economy and green innovation or green technology innovation (Cao et al., 2021; Lin and Ma, 2022; Ma and Zhu, 2022), most of them have only studied the one-way influence between the two. A few scholars have regarded the two as separately developed but mutually influencing systems and applied the coupling coordination theory to quantitatively study the coupling and coordinated relationship between the two subsystems.
Based on the above, by selecting China’s 30 provinces as the research objects, this paper directly connected green science and technology innovation and the digital economy on the foundation of the perspective of coupling and aimed to reveal the coupling and coordinated relationship between the two subsystems and its influencing factors by constructing an index system to evaluate GSTIE and DEL. The innovations of this study mainly lie in the following three aspects. First, this research introduced the “coupling” theory and focused on studying the coupling and interaction between GSTIE and DEL in China’s provinces, broadening the research perspective of green science and technology innovation and the digital economy, and further enriching the research results on the relationship between the two subsystems. Second, this study analyzed the evolution characteristics of Chinese provincial GSTIE and DEL from the two dimensions of time and space, which is of benefit to enrich the theoretical system of the research on GSTIE and DEL. Third, in this study, the configuration influencing factors that can affect the CCD between GSTIE and DEL were studied by means of the fuzzy set Qualitative Comparative Analysis (fsQCA) methodology, which could have a more comprehensive relationship with the development of provincial green science and technology innovation, the development of the digital economy, and even the coupling and coordinated relationship between the two subsystems in China.
3 Data and methodology
3.1 Construction of index system
Following systematic, scientific, feasible, and comparable principles, we constructed the evaluation index systems of GSTIE and DEL (Table 1). In this study, to measure the GSTIE of provinces, by referring to the previous research on the construction of a green science and technology innovation evaluation index system (Wang et al., 2020), the GSTIE subsystem was divided into three aspects on the basis of the perspective of input-output: green innovation input, green innovation desired output, and unexpected output. For the green innovation input evaluation, this study chose three indicators: the full-time equivalent of R&D personnel, the internal spending on R&D, and the new product development funds of industrial enterprises above the designated size. The indicators of the turnover of the technological market, the number of domestic patent applications granted, and the sales revenue of new products in industrial enterprises above the designated size were chosen as the expected output indicators of GSTIE. The indicators of undesired output mainly included the total emission of industrial wastewater, emission of industrial sulfur dioxide, and emission of industrial smoke and dust.
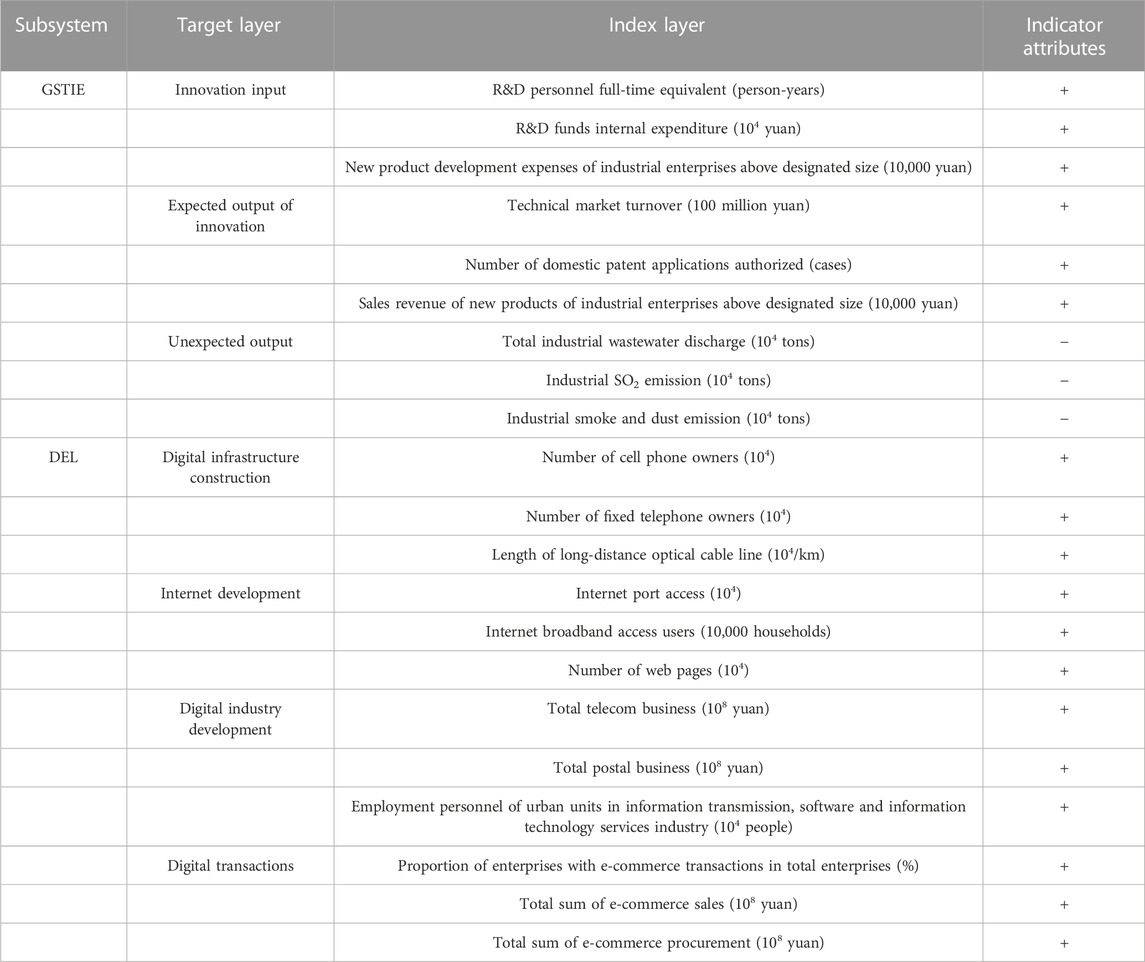
TABLE 1. GSTIE and DEL index system.
Scholars and organizations at home and abroad have carried out many explorations and studies on the measurement of DEL and proposed statistical indicators and measurement methods from multiple dimensions; however, no unified evaluation index system has been developed. Therefore, with reference to the existing literature (Chen and Miao, 2021; Wang J. et al., 2022; Xu et al., 2022) and considering the data availability, 12 index factors were selected from the four dimensions of the digital infrastructure, internet development, the development of the digital industry, and the digital transactions, to construct an evaluation index system for measuring DEL of China’s provinces. In this study, the evaluation indicators of the number of cell phone users, the number of fixed phone users, and the length of long-distance optical cable lines were selected to measure the level of digital infrastructure development (Li and Liu, 2021). Regarding Internet development, the Internet is the carrier and bedrock of the development of the digital economy (Han and Zhang, 2019). This study selected three evaluation indicators: internet port access, internet broadband access users, and web pages (Ding et al., 2021). Digital industry development is generally used to measure the development of digital production in the digital context, including industrial income and the number of industry practitioners. Therefore, in this study, the total amount of telecom businesses, total postal business, and the number of urban unit employees who are working in information transmission, software, and information technology service industries were selected to measure and reflect the development of the Chinese digital industry (Luo and Zhou, 2022). In this research, we chose three evaluation indicators to reflect the development level of digital transactions: the proportion of enterprises with e-commerce transactions activities, e-commerce sales, and e-commerce purchases (Liu et al., 2020).
3.2 Data sources
In this paper, the objects of study were 30 provinces in mainland China (considering the availability of data, excluding Tibet, Hong Kong, Macao, and Taiwan), and the time span was 2013–2019. All the index data are from the China Statistical Yearbook, China Environmental Statistical Yearbook, China Science and Technology Statistical Yearbook, China Internet Network Information Center, and the National Bureau of Statistics from 2013 to 2019 (http://www.stats.gov.cn/), as well as statistical yearbooks of provinces. In addition, to ensure the availability and scientificity of the research data, the missing data in a few years and provinces are supplemented by linear interpolation during the research process.
3.3 GSTIE evaluation model
Data envelopment analysis (DEA) is a powerful non-parametric technical efficiency evaluation method first proposed by Charnes in 1978 (Charnes et al., 1978). The method is suitable for evaluating the relative efficiency of decision-making units (DMUs) with multiple input and output indicators (Shang et al., 2020). There are different DEA models proposed for different purposes. However, conventional DEA models are radial and fail to consider the slack of inputs and outputs. To solve this problem, Tone (2001) proposed a non-radial SBM-DEA model with slack variables, which perfectly solves the impact of slack variables on the measurement value. The non-radial SBM-DEA model can only calculate the efficiency value of the effective DMUs equal to 1, and cannot further evaluate multiple effective DMUs (Li and Du, 2021), Tone (2002) proposed the super-efficiency SBM-DEA model to remedy this defect. The model can make the efficiency value of the decision unit not limited by the (0, 1) and can more accurately calculate the DMUs with an efficiency value of 1 (Jiang et al., 2021). To significantly reflect the provincial differences in GSTIE, this study constructed a super-efficiency SBM-DEA model based on undesirable output. The specific model is as follows:
where n represents the number of decision units; m, r, and p denote inputs, expected outputs, and unexpected outputs involved in each DMU, respectively; x,
3.4 Coupling coordination measurement model
3.4.1 Revised CCD model
Coupling refers to the phenomenon by which two or more systems influence each other through interactive mechanisms, and the coupling degree reflects the degree of mutual dependence and mutual restriction among systems (Zhang et al., 2023). However, it cannot reflect the coordinated development level among systems (Sun and Cui, 2018). For example, the coupling degree between GSTIE and DEL is high while the overall level of development is low, which is not the best state of high-quality development. CCD is used to reflect the degree of mutual balance and coordination between different systems (Dong et al., 2021; Yang et al., 2022a). Because traditional CCD has errors in writing, coefficient, weight and model, Wang Shujia and others revised the model, which improves the scientificity and rationality of the research (Wang et al., 2021). Therefore, this paper applied the revised CCD model to assess the coupling coordination development level of the two subsystems of GSTIE and DEL in China’s provinces. The specific calculation formula of the revised CCD model is:
where C represents the coupling degree, and
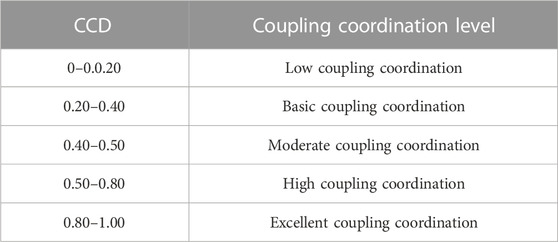
TABLE 2. Grade division of CCD between GSTIE and DEL.
3.4.2 Spatial autocorrelation model
The spatial autocorrelation model can observe the degree of aggregation in the study area of an attribute value, mainly including global spatial autocorrelation and local spatial autocorrelation (Yang et al., 2022b). This study applied global spatial autocorrelation to reflect the global spatial association pattern of CCD of the GSTIE and DEL subsystems in the whole research area to determine whether there is a spatial correlation in the space. Global Moran’s I is generally used for the calculation. The specific calculation formula is:
where
As the global spatial autocorrelation analysis can only reflect the overall situation of spatial correlation and difference of the study area and cannot sufficiently reflect the coupling and coordinated relationship between local elements and adjacent elements (Yang et al., 2022c; Li et al., 2022). The local spatial autocorrelation analysis can effectively identify the spatial dependence and heterogeneity of CCD. The calculation formula is:
where
3.4.3 Fuzzy set qualitative comparative analysis
On the basis of the perspective of configuration, by utilizing the fsQCA method, this study explored how the seven factors—human capital, R&D investment, openness, industrial structure, economic development, environmental regulation, and government subsidies—interacted to jointly affect the coupling and coordinated development between GSTIE and DEL in each province and identified the condition configuration that can achieve the coordinated development of the two subsystems. Unlike traditional statistical analysis and qualitative analysis methodologies, QCA can analyze the complex causal relationship between different combinations of antecedents and results (Liu et al., 2017). As one of the QCA techniques, fsQCA is a novel research methodology between variable and case orientation and goes beyond qualitative and quantitative research (Guo, and Lin, 2022). This method can be effectively applied to explore the synergy and linkage between various factors and can identify different causal paths leading to the same result by comparing and analyzing multiple causal conditions in each case (Mercado-Caruso et al., 2022).
In this study, fsQCA was applied to identify the factors influencing the provincial CCD, which was mainly based on the following considerations. The coupling coordinated development between GSITE and DEL is comprehensively affected by multiple factors, conforming to the basic assumption of fsQCA. Moreover, traditional research methods are mainly applicable for analyzing the net effect of a single influencing factor, whereas fsQCA can explore the complex non-linear and asymmetric causal relationship between multiple factors and results (Sun et al., 2022). In this paper, 30 provinces are taken as research samples, with small sample size, and fsQCA is the best method to perform a comparative analysis of small and mid-sized samples (Yifan and Bei, 2022). Furthermore, in this study, we aim to investigate the influence of different combinations of seven factors of the CCD between GSITE and DEL, as well as the multiple driving paths behind the coordinated development of the two subsystems, and fsQCA can effectively identify the equivalent paths that have different antecedent condition configurations leading to the same result; therefore, it is more suitable to explore the differentiated driving paths of the coordinated development of GSTIE and DEL in various areas.
4 Analysis of the spatio-temporal evolution of the CCD between GSTIE and DEL
4.1 Analysis of GSTIE and DEL
4.1.1 Spatio-temporal analysis of GSTIE
The measurement results presented in Table 3 indicate that during the research period, the overall level of GSTIE across the country presented an overall upward trend, and the efficiency value rose from 0.684 at the beginning of the period to 0.734 at the end of the period, with an increase of 7.35%. The overall level was high, and the change range was small. This indicates that the development of green science and technology innovation, as an increasingly important topic of national green innovation, has been accelerating in recent years, and its role in promoting energy conservation, emission reduction, and sustainable economic development has become increasingly significant.
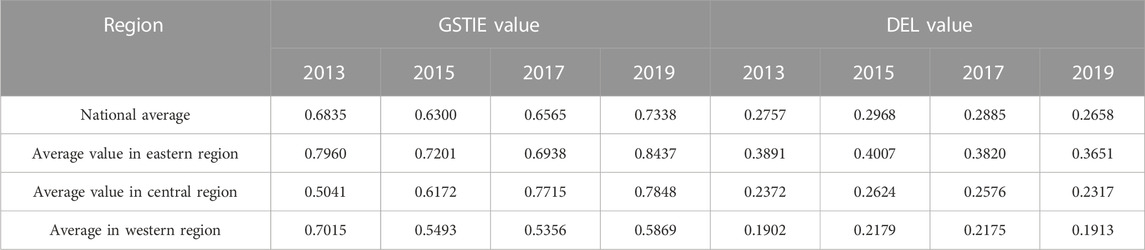
TABLE 3. Measurement results of GSTIE and DEL.
To reflect their spatial distribution differences more intuitively, ArcGIS software has been utilized to visualize GSTIE in representative years, as shown in Figure 1. As observed in Figure 1, the spatial change characteristics of GSTIE in 2013, 2015, 2017, and 2019 were relatively similar, showing a spatial distribution pattern of a low level of GSTIE in western provinces and cities and a high level of GSTIE in central and eastern provinces in China. During the investigation period, the efficiency values of GSTIE in Beijing, Jiangsu, Zhejiang, and Qinghai remained unchanged at the level of 1.00, whereas the efficiency values in other provinces and cities fluctuated. Specifically, in 2013, the efficiency values of GSTIE in Hebei, Fujian, Shanxi, Jilin, Henan, Inner Mongolia, Guangxi, Xinjiang, and other regions were below 0.40. By 2015, the efficiency value of Yunnan dropped to below 0.40, and the efficiency values of Liaoning, Anhui, and Heilongjiang rose from below 0.60 to above 0.60. In 2017, the efficiency values of Shanxi, Jilin, and Guangxi broke through the low-efficiency level of below 0.40, and the efficiency values of Jilin and Guangxi reached 1.00, whereas the efficiency values of Hainan and Ningxia decreased from 1.00 to low-efficiency level of below 0.40. By 2019, the efficiency values of Guangxi and Chongqing dropped from 1.00 to below 0.40, those of Hebei, Hainan, and Xinjiang rose from below 0.40 to above 0.40, and those of Hebei and Xinjiang reached 1.00.
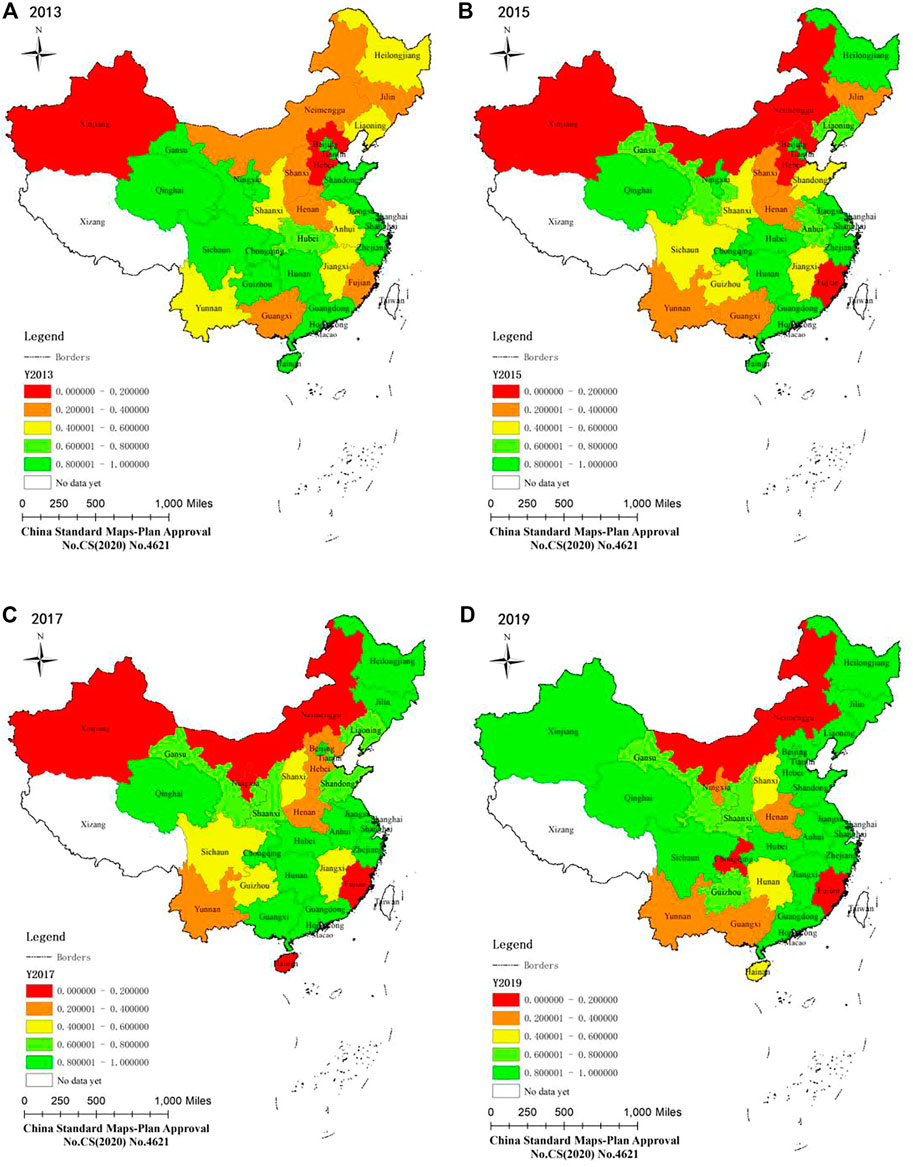
FIGURE 1. Spatial changes in China’s provincial GSTIE in representative years.
4.1.2 Spatio-temporal analysis of DEL
As shown in Table 3, from 2013 to 2019, the overall DEL of China showed a decreasing trend, decreasing from 0.2757 in 2013 to 0.2658 in 2019, a decrease of 3.59%, and the average annual decline rate was around 1.00%, suggesting that the development of China’s digital economy lagged behind the development of green technology innovation during the investigation period. From the regional perspective, there was a regional imbalance in DEL, and during the investigation period, DEL in the eastern region was always higher than DEL in the central and western regions, and even far higher than the national average level. This is mainly due to the fact that areas in the east have a relatively superior economic foundation and technological R&D, which provides a good growth environment for the development of the digital economy, and therefore DEL is the highest in this region.
From the perspective of the spatial evolution characteristic of DEL (see Figure 2), China’s DEL showed a similar spatial distribution pattern throughout the study period, and in the four representative years, DEL shows a decreasing trend in the eastern, central, and western regions in succession. During the research period, the DEL of provinces in China was generally at a low level, and there was much room for improvement.
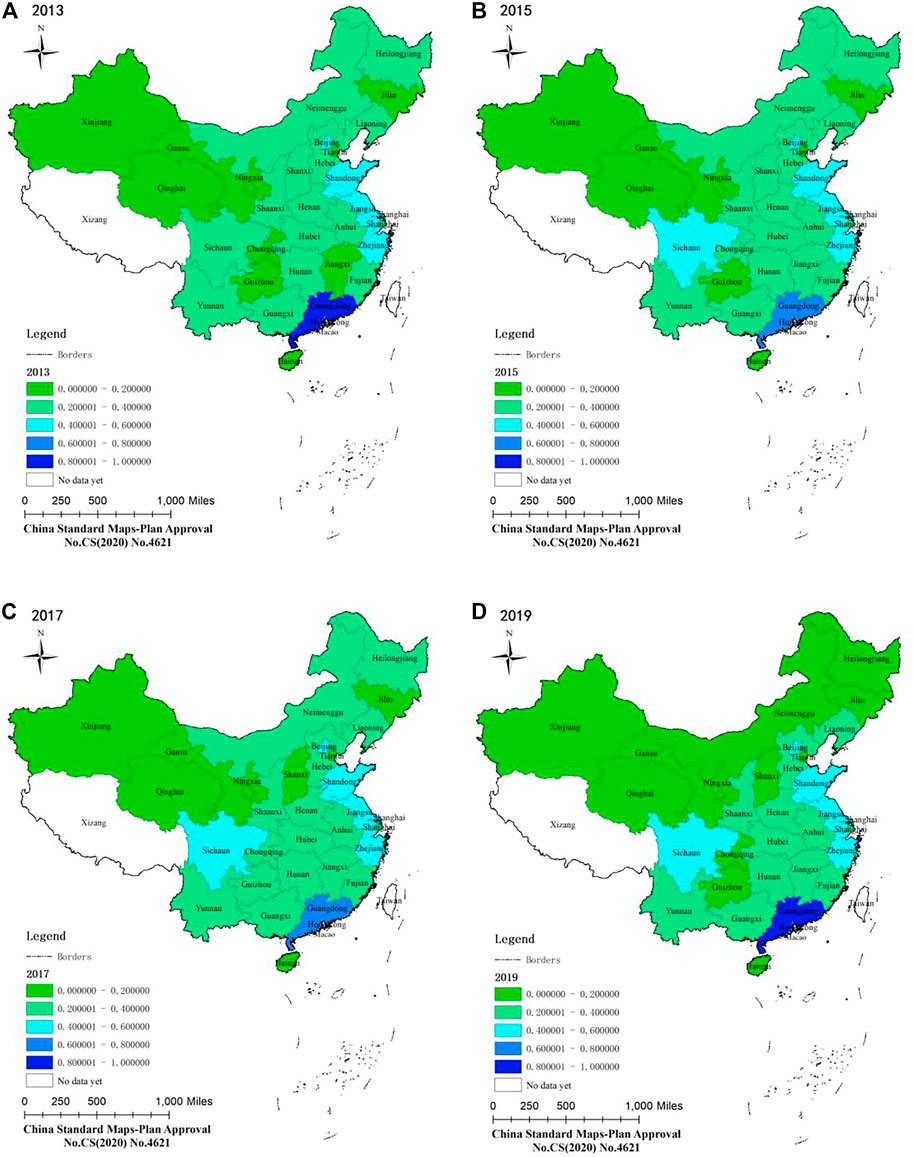
FIGURE 2. Spatial change of China’s provincial DEL in representative years.
Provinces and cities with high DEL are mainly in Guangdong in the eastern region, while provinces and cities with low DEL are mainly located in Xinjiang, Qinghai, Ningxia, and Gansu in the western region and Jilin in the central region. On the whole, in the four periods, Beijing, Jiangsu, Zhejiang, Shandong, and Guangdong in the eastern region occupy the dominant position in DEL. DEL in these provinces and cities has always been at the forefront of the country. However, for the remaining provinces, DEL is at or below 0.40, and around half is at a low level of 0.20∼0.40.
4.2 Analysis of the CCD between GSTIE and DEL
4.2.1 Analysis of the coupled coordination between GSTIE and DEL in provinces
As can be seen from the calculation results, the average CCD of each province has been classified into five grades, as shown in Table 4. The results revealed that there were certain differences in the CCD among provinces, and most provinces and cities were concentrated in the moderate and high coordination stage, with 22 in total, of which there were 15 high coordination provinces and 7 moderate coordination provinces. High-coordination provinces and cities have the potential to develop into high-quality coordinated provinces and cities, and there is much room for improvement. Only Beijing, Jiangsu, Zhejiang, and Guangdong have been in the stage of high-quality coordination. Inner Mongolia, Hainan, Ningxia, and Xinjiang were in the basic coordination stage; however, there were no low-coordination provinces. On the whole, from 2013 to 2019, the average CCD between GSTIE and DEL in each province was above the level of medium coordination, indicating there has been a good development trend, and mainly showed the distribution situation of “more in the middle, less at both ends,” that is, the number of provinces in the middle state of moderate coordination and high coordination was the highest and there were fewer provinces at both ends of basic coordination and high-quality coordination. In the future, we need to strengthen the relevant construction of GSTIE and DEL of basic and moderate coordination provinces and cities, improve their coupling and coordination level to improve the overall level of CCD in the whole country, and let more provinces and cities develop towards the stage of high coordination and high-quality coordination. In addition, more attention should be paid to the sustainable development of high-coordination provinces so that these provinces can develop into high-quality coordination provinces as soon as possible.
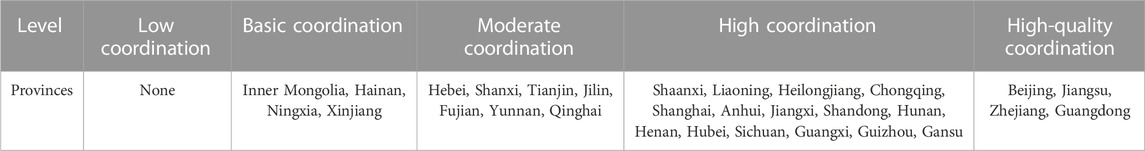
TABLE 4. Mean level of CCD of China’s provinces from 2013 to 2019.
This study selected the starting and ending years and the middle years in the research period, namely, the values of CCD in 2013, 2015, 2017, and 2019, and utilized ArcGIS software to conduct spatial visualization processing to further explore the inter-provincial spatial distribution characteristics of the CCD of GSTIE and DEL (Figure 3).
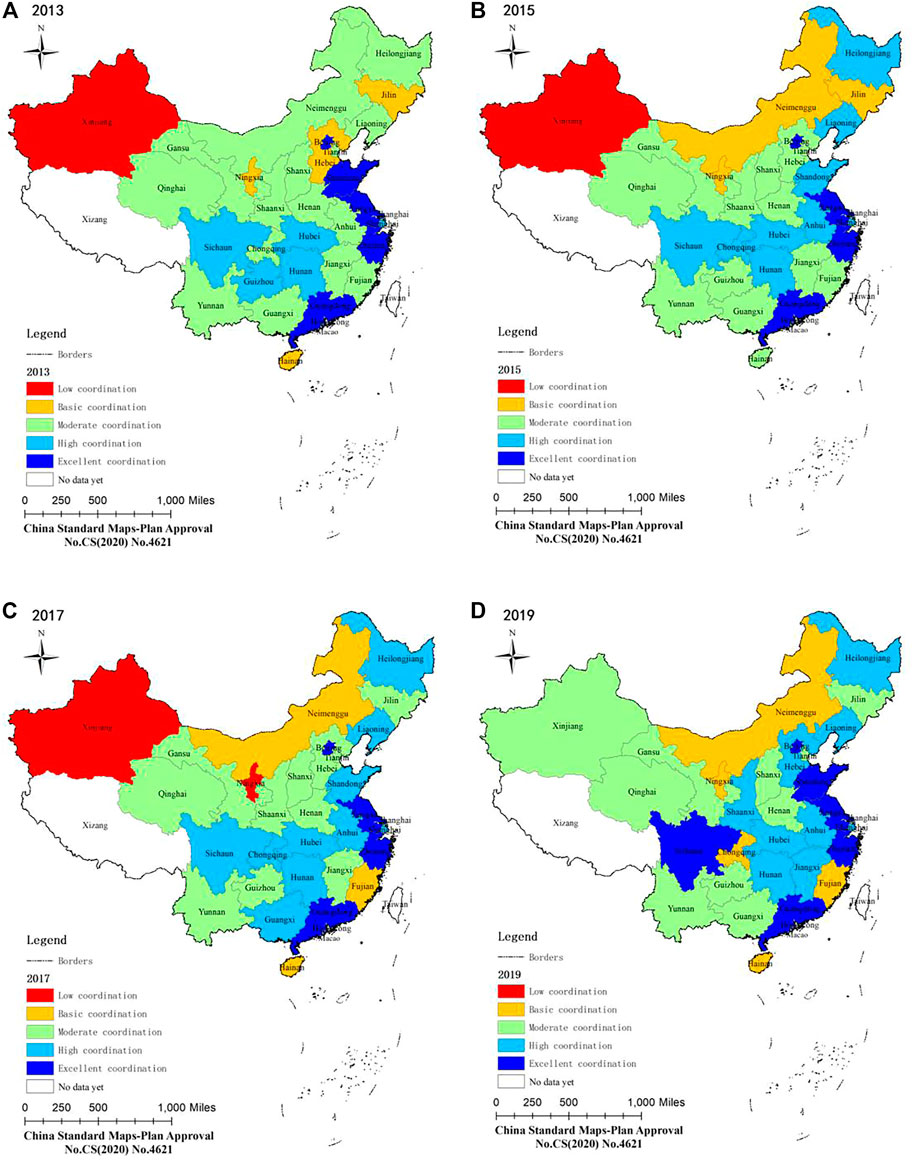
FIGURE 3. Spatial distribution map of the CCD between GSTIE and DEL in China.
As illustrated in Figure 3, overall, the national CCD between GSTIE and DEL showed a steadily increasing trend (Figure 3). The spatial distribution of the coupling and coordinated development between GSTIE and DEL was unbalanced, showing the distribution pattern of east > west > central. During the investigation period, the spatial pattern of the CCD of China’s provincial GSTIE and DEL changed significantly, and the CCD in most regions was at or above the level of moderate coordination, which indicated that GSTIE in most provinces and cities of China was well coordinated with DEL. Specifically, in 2013, half of the provinces were in the moderate coordination stage, five provinces were in the stage of high-quality coordination, five provinces were in the stage of high coordination, four provinces—Jilin, Hebei, Ningxia, and Hainan—were in the basic coordination stage, and only Xinjiang in the west was in the low coordination stage and remained unchanged until 2019 when it moved from the low coordination stage and entered the medium coordination stage. In 2015, the number of high-coordination provinces increased by five: Hebei, Shandong, Hainan, Chongqing, Anhui, and Heilongjiang. At the same time, Guizhou moved from the highly coordinated stage and entered the moderate coordination stage. In 2017, there was relatively little change in the spatial distribution pattern of coupling and coordination. Guangxi had two periods of moderate coordination and then entered the high coordination stage. Jilin left the basic coordination stage and entered the moderate coordination stage. In 2019, the number of excellent coordination provinces increased from four to six—Beijing, Jiangsu, Zhejiang, Guangdong, Sichuan, and Shandong—Hebei and Jiangxi rose from a moderate coordination stage in 2017 to a high coordination stage, and Guangxi and Chongqing dropped to the stage of moderate coordination and basic coordination, respectively. At the same time, Xinjiang and Ningxia left the low coordination stage, and there was no low coordination province, which suggested that the CCD of GSTIE and DEL in the two provinces had been improved to a certain extent, and the relationship between the two had become slightly closer.
4.2.2 Analysis of the regional CCD between GSTIE and DEL
This paper drew the point map and ridge map of CCD of GSTIE and DEL subsystems of provinces in China (see Figure 4) to further explore the regional distribution characteristics of CCD between the two subsystems.
FIGURE 4. Zoning map of CCD between GSTIE and DEL.
In Figure 4, it can be seen that there was an imbalance in the coupling and coordinated development between GSTIE and DEL among regions. The regional CCD from high to low was: East China, Central China, South China, Southwest China, Northeast China, North China, and Southwest China, and for every region, there is still substantial room for improvement of the coupling coordination relationship between GSTIE and DEL.
According to the distribution of CCD between GSTIE and DEL among provinces in each region, there was a big difference in the CCD of the provinces and cities in East China, of which the CCD in Jiangsu and Zhejiang provinces was the largest, and the level of CCD in the two provinces fluctuated slightly every year, maintaining the same level. Furthermore, there was a big difference in the CCD among the provinces in North China. The CCD in Beijing fluctuated slightly every year and remained at a high level of 0.80–0.90, and the level of the CCD was the highest in this region and the lowest in Inner Mongolia. There was a small difference in the CCD in the four provinces and cities of Southwest China, among which Sichuan had a higher level than that the other three provinces in this region. Conversely, there was a big difference in the CCD among provinces in Northwest China. The CCD in Ningxia fluctuated sharply every year, followed by Xinjiang, and the level of coupling coordination in the other three provinces showed small fluctuations every year. There was a large difference in the CCD between GSTIE and DEL in the three provinces of Southern China, among which the CCD in Guangdong had a small fluctuation annually and was in the highest position and far higher than that in Guangxi and Hainan, with a maximum gap of 0.76. The CCD was relatively different in the three provinces of Central China, and the CCD in Henan was the lowest, but it was rising as a whole. The CCD in Hubei grew slowly during the investigation period and exceeded that of Hunan. There was a small difference in the CCD among provinces in Northeast China, among which Liaoning and Heilongjiang had small fluctuations in the CCD every year.
4.3 Analysis of the spatial autocorrelation of CCD
In this paper, we explored the coupling and coordinated evolution of GSTIE and DEL in different provinces, but cannot fully understand the whole picture of China’s provincial GSTIE and DEL. Therefore, the spatial autocorrelation model was applied to further explore the correlation among provinces and deepen the research on the development of China’s provinces, so as to provide a reference for the coordinated development of China’s provinces (Yang et al., 2022a).
Based on the CCD of GSTIE and DEL during the period 2013–2019, this paper calculated the global Moran’s I index by applying ArcGIS 10.2 software (Table 5). The results showed that in all four representative years of the sample selection, the global Moran’s I values of the CCD were larger than 0 except for 2013 but did not pass the test of significance, indicating that there was positive spatial autocorrelation in CCD, but its global spatial autocorrelation was not significant. In addition, the results also revealed that the global Moran’s I index showed an upward trend over time, which indicates that the spatial autocorrelation of the CCD is gradually increasing.
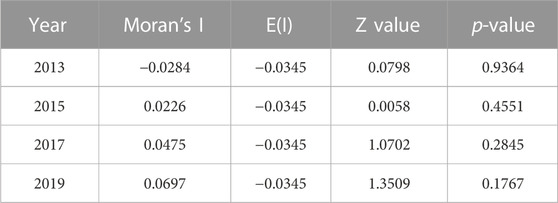
TABLE 5. Global Moran’s I of CCD of GSTIE and DEL in China.
The local spatial autocorrelation index can specifically describe the local spatial agglomeration characteristics of the CCD between GSTIE and DEL among provinces. Therefore, this paper calculated the local Moran’s I index of the CCD between GSTIE and DEL of China’s provinces in 2013, 2015, 2017, and 2019, and used ArcGIS 10.2 software to spatially process the results, obtaining the LISA cluster map of CCD between China’s provincial GSTIE and DEL, as shown in Figure 5.
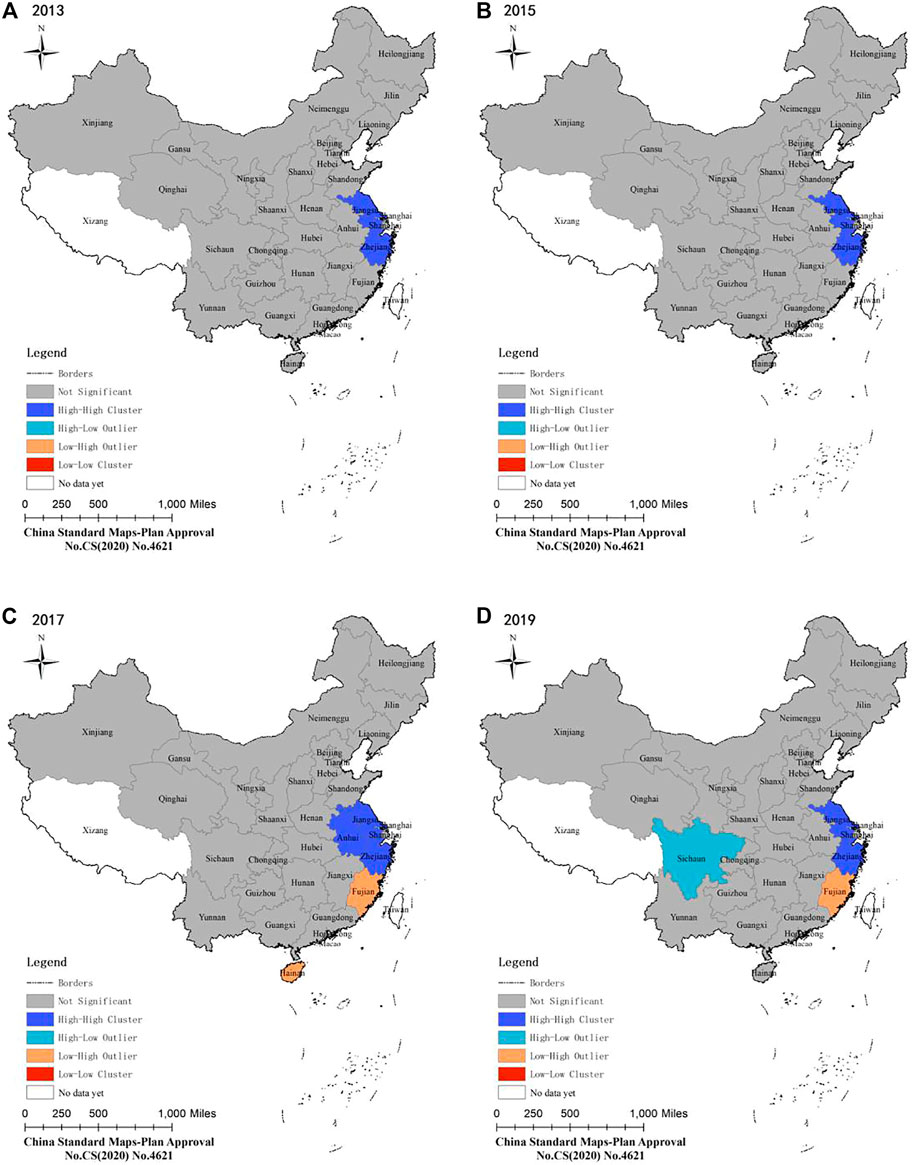
FIGURE 5. LISA cluster diagram of the CCD between GSTIE and DEL of China’s 30 provinces.
It can be seen from the LISA agglomeration map that from 2013 to 2019, there were three types of agglomeration regions, namely, High-High, High-Low, and Low-High, but there was no Low-Low.
High-high concentration areas (H-H). The CCD in the areas and its surrounding areas is high, and the internal difference in space is small. As shown in Figure 5, this type of province existed in all four-time nodes. In general, the number of provinces in the high-high concentration area was at most 4 and at least 2, and all of them were distributed in the east. In 2013, the high-high concentration areas included Shanghai, Jiangsu, and Zhejiang, forming a linkage region that was adjacent to and promoted each other. In this region, both GSTIE and DEL were at a high level, and the region has taken a leading position in the development of green innovation, which has an important position in driving the integration and development of GSTIE and DEL in China and was an important growth factor to drive the development of other provinces and cities. In 2015, due to its limited radiation capacity and the negative impact of other provinces and cities, Shanghai temporarily left the high-high concentration area, leaving only Jiangsu and Zhejiang. In 2017, under the radiation of Jiangsu and Zhejiang, Anhui and Shanghai joined the high-high cluster type, and both left the cluster in 2019. By 2019, Shandong had joined the high-high concentration areas and become a region with its own radiation capacity.
High-low concentration areas (H-L). In this region, the CCD is higher but lower in its surrounding neighborhood, and the spatial internal heterogeneity is large. It can be seen from Figure 5 that there was no province or city in high-low concentration areas in the three-time nodes of 2013, 2015, and 2017, while there was only Sichuan in 2019. Before 2019, the local agglomeration characteristics of the CCD in Chongqing were not significant. From the distribution perspective, this type of province was located in the western region. In the process of coupling and coordinated development between GSTIE and DEL, it did not drive the surrounding provinces and cities to improve the level of the CCD. Therefore, it should strengthen the connection and interaction with cities, play the role of spatial linkage, and improve the overall CCD in the region.
Low-high concentration areas (L-H). This type of region has a low CCD, while the CCD in its surrounding areas is high and the spatial internal heterogeneity is large. As shown in Figure 5, this type of province existed only in 2017 and 2019 among the four-time nodes. In 2017, there were two provinces and cities, Hainan and Fujian. In 2019, Hainan, under the reverse influence of other provinces and cities, moved from the low-high concentration areas, leaving only Fujian. The CCD of such provinces was at a low level, whereas that of their surrounding provinces and cities was high and mainly distributed near high-high agglomeration areas. It is most likely to receive the radiation and driving effect of the surrounding provinces’ coupling and coordination development. Therefore, the areas are more likely to develop into high-high concentration areas.
From the perspective of the overall evolution pattern, high-high concentration areas and high-low concentration areas were mainly distributed in eastern China, and low-high agglomeration areas were closely followed by high-high agglomeration areas. In addition, in the study period, the local spatial agglomeration characteristics of the CCD between GSTIE and DEL in most provinces and cities in China were not significant, which indicated that the synergy effect between GSTIE and DEL needed to be strengthened. Therefore, there was a certain spatial structure problem in the overall coupling coordination between China’s GSTIE and DEL at this stage. We should build more high-high concentration areas as soon as possible and make the most of the radiation and driving effect of high-high clustering areas to drive the low-high clustering areas closely distributed to develop into high-high clustering areas to improve the level of CCD of China’s GSTIE and DEL. To solve the problem of regional imbalance in CCD and reduce differences among regions, it is necessary to further explore the factors affecting the development of the coupling coordination between the two subsystems.
5 Analysis of the influencing factors of the coupling and coordinated development of GSTIE and DEL
5.1 Variable design and calibration
5.1.1 Variable selection and setting
Before using fsQCA for analysis, variables need to be classified into two categories: result variables and conditional variables. With reference to the research of Luo L. et al. (2022), all the indicator data included in the variables are the average value of relevant statistical data from 2013 to 2019 (Luo L. et al., 2022).
The coupling and coordinated development between GSTIE and DEL can be affected by a variety of factors. Based on previous research and the actual situation, human capital, capital investment, openness, economic development, industrial structure, government subsidies, and environmental regulation were determined as the conditional variables. The full-time equivalent of R&D personnel is a universal indicator that is applied for the measurement of human capital (HC). Therefore, in this study, the full-time equivalent of R&D personnel of each province was selected as the specific evaluation indicator of human capital. R&D investment is commonly used as an indicator reflecting the financial resource investment in technological innovation, and considering the difference in the scale of economic development in various regions, the proportion of internal R&D expenditure in the gross domestic product (GDP) was selected for the measurement of R&D investment (RD). In this study, the amount of foreign direct investment (FDI) was selected as the proxy variable of the level of openness (OP) (Song et al., 2021). GDP per capita was chosen for the measurement of the economic development (ED) level (Yang et al., 2021). The industrial structure (IS) was measured using the proportion of the value of the tertiary industry value to GDP as a specific measure (Hao et al., 2020). The index of “the proportion of government funds in the internal expenditure of R&D funds” was selected to represent the strength of government subsidies (GS). Environmental regulation (ER) represents the intensity of local environmental regulation in a region. To quantitatively evaluate environmental regulation, this study selected the proportion of industrial pollution control investment in the secondary industry as the proxy variable (Li et al., 2020). The descriptive statistics of all the variables are presented in Table 6.
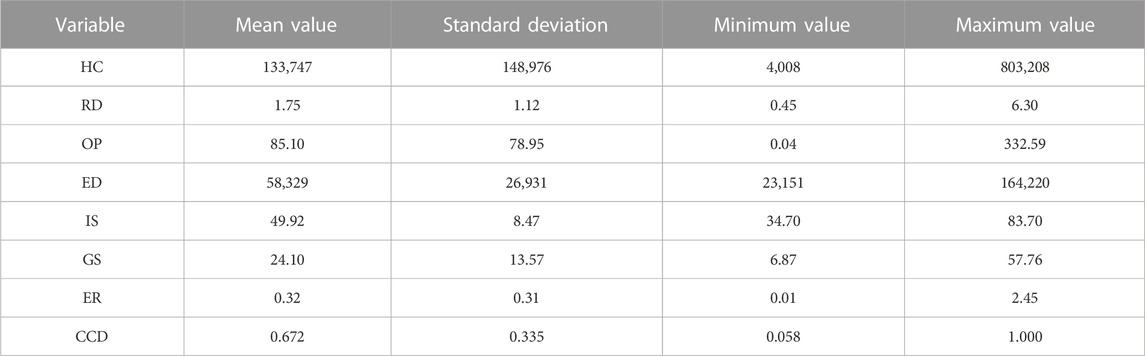
TABLE 6. Descriptive statistics of variables.
5.1.2 Calibration for variables
Calibration, the first step of fsQCA, refers to the process of assigning set membership to a case (Huang et al., 2022). This study calibrated the relevant variables to a fuzzy set by using the direct calibration method. Referring to existing studies (Romero-Castro et al., 2022), the 75%, 50%, and 25% quantile value of the resulting variable and the conditional variable were selected as the three qualitative anchor points of full subordination, intersection, and non-subordination, respectively. The calibration results are presented in Table 7.
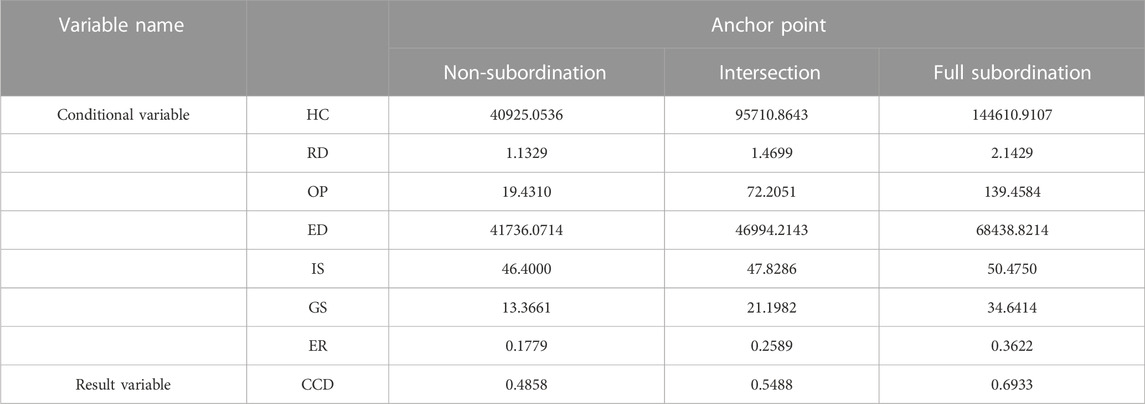
TABLE 7. Calibration anchor point for variables.
5.2 Single-factor necessity analysis
Before performing configuration analysis, the single-factor necessity test in QCA was used to determine whether a single antecedent variable is a necessary condition for leading to the particular result (Jiao et al., 2020). A single condition with a consistency level greater than 0.90 can be considered a necessary condition (Jiao et al., 2020; Huang et al., 2022). As shown in Table 8, the values of the consistency level of all conditions do not exceed 0.90, and therefore there was no necessary condition producing high CCD or non-high CCD of GSTIE and DEL.
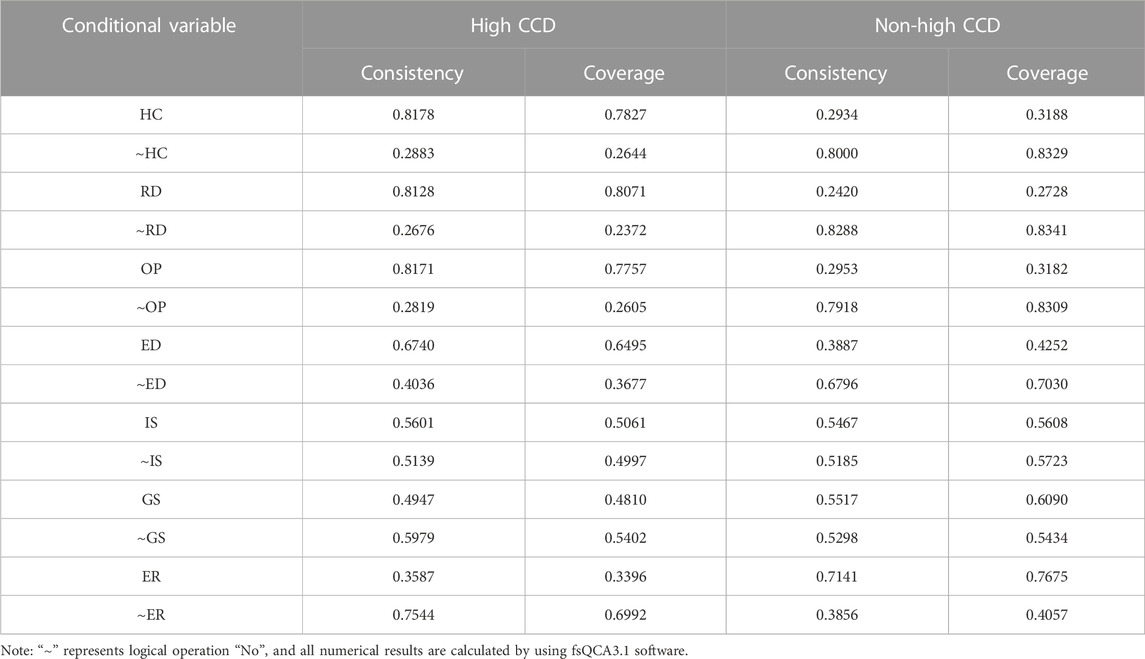
TABLE 8. Single condition necessity analysis results.
5.3 Configuration analysis
In this study, fsQCA 3.1 software was used to further analyze the condition configurations generating the high CCD and non-high CCD between GSTIE and DEL, respectively, and further explore the combination of various conditions influencing the coupling and coordinated development between GSTIE and DEL. In this study, referring to existing research (Mercado-Caruso et al., 2022; Peiró-Signes et al., 2022), the original consistency threshold was set to 0.80, the Proportional Reduction in Inconsistency threshold was set to 0.70, and the case frequency threshold was set to 1. The core conditions of all solutions were identified by comparing the nesting relationship between the intermediate solution and the parsimonious solution, that is, the conditions that appear in both the intermediate solution and the parsimonious solution are the core conditions, whereas those that only appear in intermediate solutions are auxiliary conditions. The results are presented in Tables 9, 10.
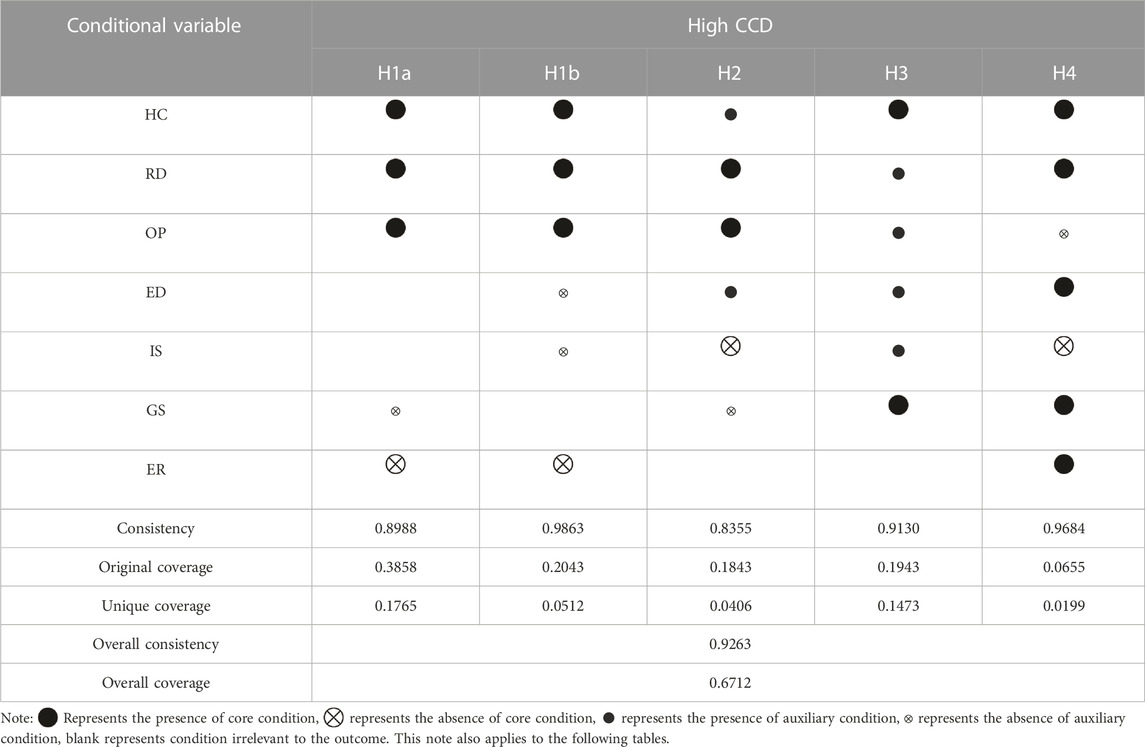
TABLE 9. Configuration of high CCD between GSTIE and DEL.
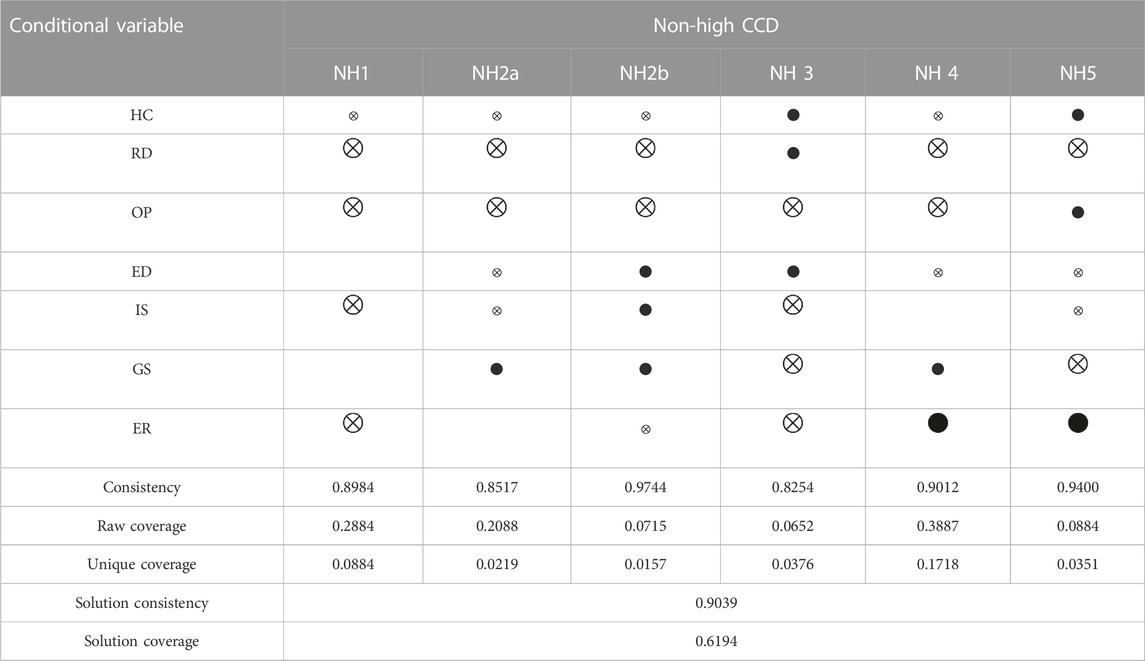
TABLE 10. Configuration of non-high CCD between GSTIE and DEL.
5.3.1 Configuration of high CCD
The results presented in Table 9 reveal that five configurations could generate a high level of CCD between GSTIE and DEL, and the consistency values of these configurations were above the level of 0.90, indicating that all five configurations were sufficient conditions for high CCD between the two subsystems. The consistency level of the solutions was 0.9263, indicating that all the configurations covering most cases were sufficient for high CCD. In addition, the overall coverage of the solutions was 0.6712, which indicated that all the configurations can explain around 67.12% of the cases with high CCD. Configuration H1a had the same core conditions as configuration H1b, and they can form a second-order equivalent configuration. Accordingly, this paper summarized four configuration paths that can produce the high CCD between GSTIE and DEL.
(1) HC + RD + OP-jointly driven. In configuration H1 (H1a and H1b), the core conditions are HC, RD, and OP, so it was named HC + RD + OP-jointly driven. Configuration H1a showed that the conditional configuration with high HC, high RD, high OP, and non-high ER as core conditions and non-high GS as the edge condition can generate high CCD between GSTIE and DEL. H1a indicated that the areas with insufficient GS and weak ER, relying on rich HC, high RD and high OP, and through independent R&D and introduction and absorption, can achieve high CCD between GSTIE and DEL. In this configuration, the values of consistency and unique coverage were 0.8988 and 0.1765, respectively, which indicated that the configuration could explain around 89.88% of the cases, and around 17.65% of the cases should be interpreted only by this configuration path. The provinces and cities represented by this route include Jiangsu, Zhejiang, Anhui, Guangdong, Hunan, and Hubei. Taking Guangdong as an example, the original driving data showed that the full-time equivalent of R&D personnel in this province ranked first in the whole country, with prominent advantages in HC, and RD and OP ranked among the top five in the country. However, Guangdong was ranked lowest in the country in terms of GS and ER. This showed that the provinces and cities represented by Guangdong, under low GS and weak ER, relying on high HC, high RD and high OP, can drive the coupling coordinated development between GSTIE and DEL, which conformed to the typical characteristics of the configuration solution of HC + RD + OP-co-driven. In configuration H1b, the core conditions included high HC, high RD, high OP, and non-high ER, and the marginal conditions were non-high ED and non-high IS, which indicated that if the level of regional ED is not high, IS is not advanced and ER is not high, it could realize the coordinated development between GSTIE and DEL through the combination of high HC, high RD, and high OP. In this configuration, the consistency value was around 0.9863, and the unique coverage was around 0.0512, meaning that the configuration path could explain approximately 98.63% of the cases, and around 5.12% of the cases could be interpreted only by this configuration path. Provinces with such typical characteristics included Anhui and Sichuan. Taking Sichuan as an example, the original data showed that ED level, advanced IS and the intensity of ER of Sichuan were in the bottom 50% of the country, but in terms of HC, RD, and OP, it ranked in the top 50% of the country, and the CCD of Sichuan ranked sixth in the country. This showed that the provinces represented by Sichuan mainly relied on the combination of high HC, high RD and high level of OP to produce the high level of coupling coordination development between GSTIE and DEL, which conformed to the typical characteristics of the configuration solution of HC + RD + OP-jointly driven.
(2) RD + OP-dual driven. In configuration H2, high RD, high OP and non-high IS were the core conditions, high HC, high ED, and non-high GS were the marginal conditions, and ER was an independent variable. Since RD and OP had a central role in this configuration, this configuration was named RD + OP-dual driven. H2 showed that regions with low IS and low GS, through high RD and OP, supplemented by higher HC and higher ED, could achieve the coupling and coordinated development between GSTIE and DEL. Under this path, strong or weak ER was not necessary to produce a high CCD between the two subsystems. In this configuration, the consistency and unique coverage were 0.8355 and 0.0406, respectively, that is, it could explain around 83.55% of the cases, and around 4.06% of the cases could be interpreted only by this configuration path. The representative provinces were Hubei and Shandong. In Shandong, for example, the original driving data showed that the level of HC, RD, OP, and ED ranked among the top ten in China, of which RD and OP ranked among the top six, whereas the level of IS and GS ranked among the bottom ten in the country. The provinces represented by Shandong reflected the typical characteristics of high coupling coordination between GSTIE and DEL driven by R&D investment and openness.
(3) HC + GS-dual driven. In configuration H3, high HC and high GS were the core conditions, high RD, high OP, high ED, and high IS were the auxiliary conditions, and ER was an independent variable. As HC and GS played a central role in this configuration, it was named HC + GS-dual driven. H3 showed that regions with high ED, through HC and sufficient GS, and with the help of higher RD and higher IS, could achieve high CCD between GSTIE and DEL. In this configuration, the values of consistency and unique coverage were 0.9130 and 0.1473, respectively, that is, the configuration explained around 91.3% of the cases, and around 14.73% of the cases could only be explained by this configuration path. Beijing and Shanghai were the typical provinces for this type of configuration. In Shanghai, for example, the original driving data showed that Shanghai was at the national leading level in terms of HC, RD, OP, ED, IS, and GS, and the CCD of the province’s GSTIE and DEL ranked seventh in the country, with a high CCD. Therefore, in addition to ER, Shanghai has few weaknesses in all aspects. It mainly relied on high HC and high GS as the core driving force and other multiple conditions to achieve high CCD between GSTIE and DEL. This showed that the provinces represented by Shanghai conformed to the typical characteristics of the dual-driven configuration solution of HC and GS.
(4) GS-oriented. In configuration H4, high HC, high RD, high ED, high GS, high ER, and non-high IS were the core conditions, and complementary non-high OP was the marginal condition, which could produce the coordinated development between GSTIE and DEL. H4 showed that areas where the level of OP is not high and the IS is not advanced enough, relying on rich HC, high intensity RD, high ED, high GS, and high-intensity ER, could produce high CCD of GSTIE and DEL. In this configuration, the consistency value was 0.9684 and the unique coverage value was 0.0199, which meant that this configuration path could explain around 96.84% of the cases, and around 1.99% of the cases could be explained only by this configuration path. The representative province was Shaanxi. According to the original driving data, Shaanxi’s HC, RD, ED, GS and ER were among the top ten in the country, whereas its OP level was ranked 17th in the country, and the advanced degree of IS was ranked third from the bottom in the country. It was revealed that OP and IS were the development shortcomings in Shaanxi. As GS had obvious development advantages, this configuration was named GS-oriented.
5.3.2 Configuration of non-high CCD
This study also tested the configurations that produced non-high CCD between GSTIE and DEL, and the results are presented in Table 10. The results showed that six configurations generated non-high CCD, the consistency of the solution was 0.9039, and the coverage was 0.6194, indicating that the interpretation of these six configurations was 90.39% and explained around 61.94% of the cases with non-high CCD.
NH1 showed that non-high RD, non-high OP, non-high IS and non-high ER were the core conditions, indicating that in areas with low RD and OP levels, if the IS was not advanced and ER was weak, even if the HC level was low, it would be impossible to achieve high CCD of GSTIE and DEL. NH2a and NH2b had the same core conditions, namely, non-high RD and non-high OP. NH2a showed that irrespective of whether ER was strong, the lack of high HC, high RD, high OP, high ED, and high IS would not produce high CCD even if there was high GS. NH2b showed that the lack of high HC, high RD, high OP and high ER would not achieve high CCD even though DE, IS and GS were high. In NH3, non-high OP, non-high IS, non-high GS, and non-high ER were the core conditions, and high HC, high RD and high ED were the marginal conditions. NH3 showed that areas with a low level of OP and weak ER, where the IS was not advanced enough and GS were insufficient, even if the ED level was high, and even with a high level of HC and a high level of RD, high CCD between GSTIE and DEL would not be achieved. In NH4, non-high RD and non-high OP were the core conditions, and non-high HC, non-high ED, and high GS were the marginal conditions, which showed that in areas with low levels of OP and ED, the lack of adequate RD and HC, even with high GS and high ER, would still lead to non-high CCD between GSTIE and DEL. NH5 showed that the lack of high RD, high ED, high IS and high GS would eventually lead to non-high CCD between GSTIE and DEL even if HC, OP and ER were high.
6 Discussion
Considering environmental pollution and resource constraints, promoting the coordinated development of green scientific and technological innovation and digital economy is the direct embodiment of the core competitiveness of the economy and society, and is also the new focus of high-quality development. This study has the following theoretical and practical values. For theoretical values, on one hand, from the perspective of coupling development, this paper evaluated the coupling and coordinated development of GSTIE and DEL at the provincial level in China, which is a theoretical supplement to the existing research on green innovation and digital economy and expands the idea of studying green innovation and digital economy from the perspective of coupling. On the other hand, considering the causal complexity of the influencing factors, this paper further explored the influencing factors of CCD by using the fsQCA method to reveal the impact of various configurations on the coupling and coordinated development of GSTIE and DEL, which not only complements the studies on the influencing factors of CCD in terms of methods and conclusions but also provides a quantitative basis for the design of the targeted coordinated development policies in various regions. For practical values, first, the evaluation results are conducive to objectively reflecting the current situation and differences in the development of green science and technology innovation and the digital economy in each province, as well as the strength of the coupling coordination relationship between GSTIE and DEL. Second, from the perspective of coupling and configuration, the research results of this study can broaden the direction of regional policymaking and provide a reference for local governments to accurately implement policies to improve the DEL and promote high-quality development.
However, there are still some limitations: First, limited by the availability of public data, the indicator system for measuring GSTIE and DEL may not be comprehensive and accurate enough. Further research can enrich the construction of the indicator system to improve the accuracy of evaluation results (Liu et al., 2022). Secondly, limited by the number of cases, although this study has integrated as many as possible seven important elements that affect the coupling and coordinated development between GSTIE and DEL, it does not include all possible influencing factors. In the future, we can adopt a new analysis perspective or incorporate more influencing factors to study, so as to supplement and enrich the research conclusions of this paper. Third, this paper used static panel data without considering the time effect. It should be the focus of future research to dynamically discuss the configuration relationship by combining QCA and other analysis methods (Luo L. et al., 2022; Sun and Liu, 2022).
7 Conclusion and policy recommendations
7.1.1 Research conclusion
This paper selected 30 provinces and cities as research objects and constructed the CCD index system of GSTIE and DEL. Using the super-efficiency SBM-DEA model to calculate GSTIE, this paper revealed the distribution characteristics of GSTIE and DEL in China’s provinces and cities from the perspective of time and space and assessed the coupling coordination level of GSTIE and DEL in various provinces and cities. In addition, the fsQCA method was used to explore the influencing factors of CCD from the perspective of configuration, revealing the differential driving path of the coupling and coordinated development in various provinces and cities. The main conclusions of this study are as follows:
According to the evaluation results, it can be concluded that the level of the digital economy is generally low, and the comprehensive score of China’s provincial DEL system has always been lower than that of the GSTIE system, indicating that the provincial DEL system has always been lagging behind the GSTIE system, which is basically consistent with the conclusion of previous studies (Zhao & Meng, 2022). Beijing, Jiangsu, Zhejiang, Shandong, and Guangdong are high-value areas of the DEL, which may be because there is a large scale of digital economy development.
From the CCD evaluation results, it could be found that there were spatial differences in the coupling coordination between GSTIE and DEL systems, showing a spatial characteristic of the eastern region > western region > central region. The coupling coordination of GSTIE and DEL in most provinces has reached a medium or higher level, but the imbalance in some provinces is still obvious. In addition, the results of spatial autocorrelation analysis showed that the local spatial agglomeration characteristics of the CCD between GSTIE and DEL in most provinces and cities were not significant, indicating that it is necessary to strengthen the synergy effect between GSTIE and DEL.
The single-factor necessity test results show that there is no single factor by itself that can lead to the coupling and coordinated development of GSTIE and DEL. However, there are multiple pathways that drives the coordinated development of GSTIE and DEL, each representing a condition configuration composed of different influencing factors. The configuration analysis results showed that five conditional configurations could produce high CCD between GSTIE and DEL, and these five configurations could be categorized into four types: HC + RD + OP-jointly driven, RD + OP-dual driven, HC + GS-dual driven, and GS-oriented.
7.1.2 Policy recommendations
To improve the level of coordinated development of GSTIE and DEL, this research proposes the following policy recommendations on the basis of the above research conclusions.
It is necessary to understand the essence of coordinated development and promote the coordinated development between GSTIE and DEL. First, provinces and cities need to improve their technological innovation capabilities, optimize the innovation environment, and gather innovative talents and innovative capital; increase the R&D funds investment, accelerate the construction of innovation platforms, and provide the essential support for training innovative talents and gathering innovative resources. Second, all provinces and cities should comprehensively optimize the digital economy development environment, improve infrastructure construction of the digital economy, accelerate the deployment of network and information communication facilities, provide policy preferences for the core industries of the digital economy, improve the status quo of the low level of regional digital economy development, and reverse its predicament of lagging behind green science and technology innovation. In addition, the government should effectively control the investment in technology resources, attach importance to the transformation and application of effective invention patent achievements, drive the deep integration of green science and technology innovation and industrial development, and empower digital economic development.
Furthermore, it is necessary to overcome regional barriers and strengthen transregional cooperation. All provinces should strengthen cooperation and exchanges on the green science and technology innovation efficiency and the development of the digital economy and jointly build a regional cooperation mechanism for resource sharing to improve China’s overall level of coordinated development. We should encourage the eastern region with excellent performance in coordinating the development of GSTIE and DEL to play the role of radiation, guidance, and assistance by improving the incentive mechanism to drive the development of the surrounding areas with a low coupling and coordination level. The central and western regions with a low level of CCD should strengthen cooperation with the eastern developed provinces, draw on excellent experience, conduct appropriate exploration according to their own development status, change the situation where most regions in China have no significant spatial characteristics, and strive for cross-regional linkage cooperation.
Moreover, attempts should be made to give full play to the synergistic role of various elements, and according to local actual conditions, a suitable coordinated development path should be chosen. The linkage and synergy effect of multiple conditions fully reflects the complexity of the coupling and coordinated development of GSTIE and DEL. This means that all regions should, from the overall perspective, establish an effective coordinated, united and unified development mechanism and strengthen the deep integration and optimal allocation of various elements. Additionally, each region should carefully select different coordinated development paths and targeted measures on the basis of its own development status and resource endowment to drive the coupling and coordinated development of green science and technology innovation efficiency and the digital economy.
Data availability statement
The original contributions presented in the study are included in the article/supplementary material, further inquiries can be directed to the corresponding author.
Author contributions
Conceptualization, ZM; Data curation, CX and YG; methodology, ZM; resources, CX; writing—review and editing, ZM and YG; visualization, YG; project administration, YG; funding acquisition, YG. All authors have read and agreed to the published version of the manuscript.
Funding
This research was funded by the Science and Technology Research Program of Chongqing Municipal Education Commission (Grant No. KJQN202101122 and No. KJQN201904002), Chongqing Higher Education Society Project (Grant No. CQGJ21B057), Chongqing Postgraduate Education and Teaching Reform Research Project (Grant No. yjg223121), Chongqing University of Technology Higher Education Research Project (Grant No. 2022ZD01), Undergraduate Education Reform Project of Chongqing University of Technology (Grant No. 2021YB21), Strategy Research on Campus Culture Construction of Chongqing University of Technology (2022DJ307), China National Business Education Subjects 14th Five-Year Plan 2022 (Grant No. SKKT-22015).
Acknowledgments
The authors would like to thank the reviewers for their valuable comments on drafts of this paper.
Conflict of interest
The authors declare that the research was conducted in the absence of any commercial or financial relationships that could be construed as a potential conflict of interest.
Publisher’s note
All claims expressed in this article are solely those of the authors and do not necessarily represent those of their affiliated organizations, or those of the publisher, the editors and the reviewers. Any product that may be evaluated in this article, or claim that may be made by its manufacturer, is not guaranteed or endorsed by the publisher.
References
Bukht, R., and Heeks, R. (2018). Defining, conceptualising and measuring the digital economy. Int. Organ. Res. J. 13 (2), 143–172. doi:10.17323/1996-7845-2018-02-07
Cao, S., Nie, L., Sun, H., Sun, W., and Taghizadeh-Hesary, F. (2021). Digital finance, green technological innovation and energy-environmental performance: Evidence from China's regional economies. J. Clean. Prod. 327, 129458. doi:10.1016/j.jclepro.2021.129458
Charnes, A., Cooper, W. W., and Rhodes, E. (1978). Measuring the efficiency of decision making units. Eur. J. Operational Res. 2 (6), 429–444. doi:10.1016/0377-2217(78)90138-8
Chen, X., and Miao, Z. (2021). Spatial distribution of digital economic growth dynamics and regional income. Dili Xuebao/Acta Geogr. Sin. 76 (8), 1882–1894. doi:10.11821/dlxb202108005
Dai, L., Mu, X., Lee, C., and Liu, W. (2021). The impact of outward foreign direct investment on green innovation: The threshold effect of environmental regulation. Environ. Sci. Pollut. Res. 28 (26), 34868–34884. doi:10.1007/s11356-021-12930-w
Ding, C., Liu, C., Zheng, C., and Li, F. (2021). Digital economy, technological innovation and high-quality economic development: Based on spatial effect and mediation effect. Sustainability 14 (1), 216. doi:10.3390/su14010216
Dong, L., Longwu, L., Zhenbo, W., Liangkan, C., and Faming, Z. (2021). Exploration of coupling effects in the economy–society–environment system in urban areas: Case study of the Yangtze River delta urban agglomeration. Ecol. Indic. 128, 107858. doi:10.1016/j.ecolind.2021.107858
Du, K., Cheng, Y., and Yao, X. (2021). Environmental regulation, green technology innovation, and industrial structure upgrading: The road to the green transformation of Chinese cities. Energy Econ. 98, 105247. doi:10.1016/j.eneco.2021.105247
Faria, A., Barbosa, N., and Bastos, J. (2019). Portuguese regional innovation systems efficiency in the European Union context. Eur. Plan. Stud. 28, 1599–1618. doi:10.1080/09654313.2019.1680611
Guo, Y. A., and Lin, B. B. (2022). Influencing factors and multiple paths of construction ability of digital government: Qualitative comparative analysis based on 31 Chinese provinces. Procedia Comput. Sci. 199, 1213–1220. doi:10.1016/j.procs.2022.01.154
Han, C., and Zhang, L. (2019). Can internet improve the resource misallocation of China:A empirical test based on the dynamic spatial durbin model and threshold effect. Inq. into Econ. Issues 12, 43–55. CNKI:SUN:JJWS.0.2019-12-004.
Hao, Y., Zheng, S., Zhao, M., Wu, H., Guo, Y., and Li, Y. (2020). Reexamining the relationships among urbanization, industrial structure, and environmental pollution in China—new evidence using the dynamic threshold panel model. Energy Rep. 6, 28–39. doi:10.1016/j.egyr.2019.11.029
Hosan, S., Karmaker, S. C., Rahman, M. M., Chapman, A. J., and Saha, B. B. (2022). Dynamic links among the demographic dividend, digitalization, energy intensity and sustainable economic growth: Empirical evidence from emerging economies. J. Clean. Prod. 330, 129858. doi:10.1016/j.jclepro.2021.129858
Huang, Y., Li, S., Xiang, X., Bu, Y., and Guo, Y. (2022). How can the combination of entrepreneurship policies activate regional innovation capability? A comparative study of Chinese provinces based on fsQCA. J. Innovation Knowl. 7 (3), 100227. doi:10.1016/j.jik.2022.100227
Jiang, T., Zhang, Y., and Jin, Q. (2021). Sustainability efficiency assessment of listed companies in China: A super-efficiency SBM-DEA model considering undesirable output. Environ. Sci. Pollut. Res. 28 (34), 47588–47604. doi:10.1007/s11356-021-13997-1
Jiao, J., Zhang, X., and Tang, Y. (2020). What factors determine the survival of green innovative enterprises in China?A method based on fsQCA. Technol. Soc. 62, 101314. doi:10.1016/j.techsoc.2020.101314
Lee, C., and Lee, C. (2022). How does green finance affect green total factor productivity? Evidence from China. Energy Econ. 107, 105863. doi:10.1016/j.eneco.2022.105863
Li, G., Li, X., and Huo, L. (2023). Digital economy, spatial spillover, and industrial green innovation efficiency: Empirical evidence from China. Heliyon 9, e12875. doi:10.1016/j.heliyon.2023.e12875
Li, J., and Du, Y. (2021). Spatial effect of environmental regulation on green innovation efficiency: Evidence from prefectural-level cities in China. J. Clean. Prod. 286, 125032. doi:10.1016/j.jclepro.2020.125032
Li, L., Fan, Z., Feng, W., Yuxin, C., and Keyu, Q. (2022). Coupling coordination degree spatial analysis and driving factor between socio-economic and eco-environment in northern China. Ecol. Indic. 135, 108555. doi:10.1016/j.ecolind.2022.108555
Li, X., Yu, D., and Yu, J. (2020). Spatial spillover effect of heterogeneous environmental regulations on carbon productivity— spatial durbin model. China Soft Sci. 04, 82–96. CNKI:SUN:ZGRK.0.2020-04-008.
Li, Z., and Liu, Y. (2021). Research on the spatial distribution pattern and influencing factors of digital economy development in China. IEEE Access 9, 63094–63106. doi:10.1109/ACCESS.2021.3075249
Lin, B., and Ma, R. (2022). How does digital finance influence green technology innovation in China? Evidence from the financing constraints perspective. J. Environ. Manag. 320, 115833. doi:10.1016/j.jenvman.2022.115833
Liu, B., Sun, Z., and Li, H. (2021). Can carbon trading policies promote regional green innovation efficiency? Empirical data from pilot regions in China. Sustainability 13 (5), 2891. doi:10.3390/su13052891
Liu, C., Gao, X., Ma, W., and Chen, X. (2020). Research on regional differences and influencing factors of green technology innovation efficiency of China’s high-tech industry. J. Comput. Appl. Math. 369, 112597. doi:10.1016/j.cam.2019.112597
Liu, F., Wang, C., Luo, M., Zhou, S., and Liu, C. (2022). An investigation of the coupling coordination of a regional agricultural economics-ecology-society composite based on a data-driven approach. Ecol. Indic. 143, 109363. doi:10.1016/j.ecolind.2022.109363
Liu, T., Song, Q., Lu, J., and Qi, Y. (2021). An integrated approach to evaluating the coupling coordination degree between low-carbon development and air quality in Chinese cities. Adv. Clim. Change Res. 12 (5), 710–722. doi:10.1016/j.accre.2021.08.001
Liu, Y., Mezei, J. O. Z., Kostakos, V., and Li, H. (2017). Applying configurational analysis to IS behavioural research: A methodological alternative for modelling combinatorial complexities. Inf. Syst. J. 27 (1), 59–89. doi:10.1111/isj.12094
Luo, K., Liu, Y., Chen, P., and Zeng, M. (2022). Assessing the impact of digital economy on green development efficiency in the Yangtze River Economic Belt. Energy Econ. 112, 106127. doi:10.1016/j.eneco.2022.106127
Luo, L., Wang, Y., Liu, Y., Zhang, X., and Fang, X. (2022). Where is the pathway to sustainable urban development? Coupling coordination evaluation and configuration analysis between low-carbon development and eco-environment: A case study of the yellow river basin, China. Ecol. Indic. 144, 109473. doi:10.1016/j.ecolind.2022.109473
Luo, Q., Miao, C., Sun, L., Meng, X., and Duan, M. (2019). Efficiency evaluation of green technology innovation of China's strategic emerging industries: An empirical analysis based on Malmquist-data envelopment analysis index. J. Clean. Prod. 238, 117782. doi:10.1016/j.jclepro.2019.117782
Luo, R., and Zhou, N. (2022). Dynamic evolution, spatial differences, and driving factors of China’s provincial digital economy. Sustainability 14 (15), 9376. doi:10.3390/su14159376
Ma, D., and Zhu, Q. (2022). Innovation in emerging economies: Research on the digital economy driving high-quality green development. J. Bus. Res. 145, 801–813. doi:10.1016/j.jbusres.2022.03.041
Mercado-Caruso, N., Segarra-Oña, M., Peiró-Signes, Á., Portnoy, I., and Navarro, E. (2022). Eco-innovation and its economic effect on industrial clusters - an FsQCA analysis. Procedia Comput. Sci. 203, 673–677. doi:10.1016/j.procs.2022.07.099
Peiró-Signes, Á., Cervelló-Royo, R., and Segarra-Oña, M. (2022). Can a country's environmental sustainability exert influence on its economic and financial situation? The relationship between environmental performance indicators and country risk. J. Clean. Prod. 375, 134121. doi:10.1016/j.jclepro.2022.134121
Peng, J., Xu, R., and Fu, L. (2019). The evolution pattern of green innovation efficiency of industrial enterprises in the Yangtze River Economic Belt. China Environ. Sci. 39 (11), 4886. doi:10.19674/j.cnki.issn1000-6923.2019.0570-en
Peng, Y., Fan, Y., and Liang, Y. (2021). A green technological innovation efficiency evaluation of technology-based SMEs based on the undesirable SBM and the malmquist index: A case of Hebei province in China. Sustainability 13 (19), 11079. doi:10.3390/su131911079
Pouri, M. J. (2021). Eight impacts of the digital sharing economy on resource consumption. Resour. Conservation Recycl. 168 (8), 105434. doi:10.1016/j.resconrec.2021.105434
Romero-Castro, N., López-Cabarcos, M. Á., and Piñeiro-Chousa, J. (2022). Uncovering complexity in the economic assessment of derogations from the European industrial emissions directive. J. Innovation Knowl. 7 (1), 100159. doi:10.1016/j.jik.2021.11.001
Shang, Y., Liu, H., and Lv, Y. (2020). Total factor energy efficiency in regions of China: An empirical analysis on SBM-DEA model with undesired generation. J. King Saud Univ. - Sci. 32 (3), 1925–1931. doi:10.1016/j.jksus.2020.01.033
Song, W., Mao, H., and Han, X. (2021). The two-sided effects of foreign direct investment on carbon emissions performance in China. Sci. Total Environ. 791, 148331. doi:10.1016/j.scitotenv.2021.148331
Sun, P., and Liu, K. (2022). High-quality development of strategic emerging enterprises: fsQCA analysis based on TOE extension framework. West. Forum 32 (05), 12–25. Available at: https://kns.cnki.net/kcms/detail/50.1200.c.20221117.1647.002.html.
Sun, Y., and Cui, Y. (2018). Analyzing urban infrastructure economic benefit using an integrated approach. Cities 79, 124–133. doi:10.1016/j.cities.2018.03.001
Sun, Y., Ding, W., and Yang, G. (2022). Green innovation efficiency of China's tourism industry from the perspective of shared inputs: Dynamic evolution and combination improvement paths. Ecol. Indic. 138, 108824. doi:10.1016/j.ecolind.2022.108824
Tang, J., and Li, S. (2022). Can public participation promote regional green innovation? threshold effect of environmental regulation analysis. Heliyon 8 (10), e11157. doi:10.1016/j.heliyon.2022.e11157
Wang, F., Liu, X., Zhang, L., and Cheng, W. (2022). Does digitalization promote green technology innovation of resource-based enterprises? Stud. Sci. Sci. 40 (02), 332–344. doi:10.16192/j.cnki.1003-2053.20210824.001
Wang, J., Luo, X., and Zhu, J. (2022). Does the digital economy contribute to carbon emissions reduction? A city-level spatial analysis in China. Chin. J. Popul. Resour. Environ. 20 (2), 105–114. doi:10.1016/j.cjpre.2022.06.001
Wang, K. L., and Zhang, F. Q. (2021). Investigating the spatial heterogeneity and correlation network of green innovation efficiency in China. Sustainability 13 (3), 1104. doi:10.3390/su13031104
Wang, Q., Tang, K., and Hu, H. (2022). The impact of digital finance on green innovation: Evidence from provinces in China. Innovation Green Dev. 1 (1), 100007. doi:10.1016/j.igd.2022.100007
Wang, S. J., Kong, W., Ren, L., Zhi, D. D., and Dai, B. T. (2021). Research on misuses and modification of coupling coordination degree model in China. J. Nat. Resour. 36 (3), 793–810. doi:10.31497/zrzyxb.20210319
Wang, Y., Pan, J. F., Pei, R. M., Yi, B. W., and Yang, G. L. (2020). Assessing the technological innovation efficiency of China's high-tech industries with a two-stage network DEA approach. Socio-Economic Plan. Sci. 71, 100810. doi:10.1016/j.seps.2020.100810
Xu, W., Zhou, J., and Liu, C. (2022). The impact of digital economy on urban carbon emissions: Based on the analysis of spatial effects. Geogr. Res. 41 (1), 111–129. doi:10.11821/dlyj020210459
Yang, G., Gong, G., and Gui, Q. (2022b). Exploring the spatial network structure of agricultural water use efficiency in China: A social network perspective. Sustainability 14 (5), 2668. doi:10.3390/su14052668
Yang, G., Gong, G., Luo, Y., Yang, Y., and Gui, Q. (2022a). Spatiotemporal characteristics and influencing factors of tourism–urbanization–technology–ecological environment on the yunnan–guizhou–sichuan region: An uncoordinated coupling Perspective. Int. J. Environ. Res. Public Health 19 (14), 8885. doi:10.3390/ijerph19148885
Yang, G., Gui, Q., Zhang, F., Gong, G., and Yang, Y. (2022c). The temporal and spatial characteristics and influencing factors of low-carbon economy efficiency and science and technology development level in China’s provinces from the perspective of uncoordinated coupling. Front. Environ. Sci. 10, 886886. doi:10.3389/fenvs.2022.886886
Yang, G., Zhang, F., Zhang, F., Ma, D., Gao, L., Chen, Y., et al. (2021). Spatiotemporal changes in efficiency and influencing factors of China’s industrial carbon emissions. Environ. Sci. Pollut. Res. 28 (27), 36288–36302. doi:10.1007/s11356-021-13003-8
Yang, Q., Ma, H., Wang, Y., and Lin, L. (2022). Research on the influence mechanism of the digital economy on regional sustainable development. Procedia Comput. Sci. 202, 178–183. doi:10.1016/j.procs.2022.04.025
Yao, M., Duan, J., and Wang, Q. (2022). Spatial and temporal evolution analysis of industrial green technology innovation efficiency in the Yangtze River Economic Belt. Int. J. Environ. Res. public health 19 (11), 6361. doi:10.3390/ijerph19116361
Yi, M., Wang, Y., Yan, M., Fu, L., and Zhang, Y. (2020). Government R& D subsidies, environmental regulations, and their effect on green innovation efficiency of manufacturing industry: Evidence from the Yangtze River Economic Belt of China. Int. J. Environ. Res. Public Health 17 (4), 1330. doi:10.3390/ijerph17041330
Yifan, G., and Bei, L. (2022). Influencing factors and multiple paths of construction ability of digital government: Qualitative comparative analysis based on 31 Chinese provinces. Procedia Comput. Sci. 199, 1213–1220. doi:10.1016/j.procs.2022.01.154
Zhang, W., Liu, X., Wang, D., and Zhou, J. (2022). Digital economy and carbon emission performance: Evidence at China's city level. Energy Policy 165, 112927. doi:10.1016/j.enpol.2022.112927
Zhang, Y., Zhu, T., Guo, H., and Yang, X. (2023). Analysis of the coupling coordination degree of the Society-Economy-Resource-Environment system in urban areas: Case study of the Jingjinji urban agglomeration, China. Ecol. Indic. 146, 109851. doi:10.1016/j.ecolind.2022.109851
Zhao, P., Zeng, L., Lu, H., Zhou, Y., Hu, H., and Wei, X. (2020). Green economic efficiency and its influencing factors in China from 2008 to 2017: Based on the super-SBM model with undesirable outputs and spatial Dubin model. Sci. Total Environ. 741, 140026. doi:10.1016/j.scitotenv.2020.140026
Zhao, T., Zhang, Z., and Liang, S. (2020). Digital economy, entrepreneurial activity and high-quality development: Empirical evidence from Chinese cities. Manag. World 36 (10), 65–76. doi:10.19744/j.cnki.11-1235/f.2020.0154
Zheng, M., Feng, G., Jang, C., and Chang, C. (2021). Terrorism and green innovation in renewable energy. Energy Econ. 104, 105695. doi:10.1016/j.eneco.2021.105695
Keywords: green science and technology innovation, digital economy, coupling coordination, condition configuration, fsQCA
Citation: Mingkai Z, Xinlan C and Guangming Y (2023) Coupling coordination degree and influencing factors of green science and technology innovation efficiency and digital economy level: Evidence from provincial panel data in China. Front. Environ. Sci. 11:1104078. doi: 10.3389/fenvs.2023.1104078
Received: 21 November 2022; Accepted: 13 February 2023;
Published: 23 February 2023.
Edited by:
Shi Yin, Hebei Agricultural University, ChinaReviewed by:
Luigi Aldieri, University of Salerno, ItalyDaniel Balsalobre-Lorente, University of Castilla-La Mancha, Spain
Yang Yu, Hainan University, China
Copyright © 2023 Mingkai, Xinlan and Guangming. This is an open-access article distributed under the terms of the Creative Commons Attribution License (CC BY). The use, distribution or reproduction in other forums is permitted, provided the original author(s) and the copyright owner(s) are credited and that the original publication in this journal is cited, in accordance with accepted academic practice. No use, distribution or reproduction is permitted which does not comply with these terms.
*Correspondence: Yang Guangming, yangguangming@cqut.edu.cn