Estimated discharge of microplastics via urban stormwater during individual rain events
 Matthew S. Ross1*
  Alyssa Loutan1 Tianna Groeneveld1 Danielle Molenaar1 Kimberly Kroetch2† Taylor Bujaczek1 Sheldon Kolter1 Sarah Moon1 Alan Huynh1 Rosita Khayam1 Brian C. Franczak2 Eric Camm3 Victoria I Arnold3 Norma J Ruecker3
- 1Department of Physical Sciences, MacEwan University, Edmonton, AB, Canada
- 2Department of Mathematics and Statistics, MacEwan University, Edmonton, AB, Canada
- 3Water Quality and Regulatory Assurance, The City of Calgary, Calgary, AB, Canada
Urban stormwater runoff is an important pathway for the introduction of microplastics and other anthropogenic pollutants into aquatic environments. Highly variable concentrations of microplastics have been reported globally in runoff, but knowledge of key factors within urban environments contributing to this variability remains limited. Furthermore, few studies to date have quantitatively assessed the release of microplastics to receiving waters via runoff. The objectives of this study were to assess the influence of different catchment characteristics on the type and amount of microplastics in runoff and to provide an estimate of the quantity of microplastics discharged during rain events. Stormwater samples were collected during both dry periods (baseflow) and rain events from 15 locations throughout the city of Calgary, Canada’s fourth largest city. These catchments ranged in size and contained different types of predominant land use. Microplastics were found in all samples, with total concentrations ranging from 0.7 to 200.4 pcs/L (mean = 31.9 pcs/L). Fibers were the most prevalent morphology identified (47.7 ± 33.0%), and the greatest percentage of microplastics were found in the 125–250 µm size range (26.6 ± 22.9%) followed by the 37–125 µm size range (24.0 ± 22.3%). Particles were predominantly black (33.5 ± 33.8%), transparent (22.6 ± 31.3%), or blue (16.0 ± 21.6%). Total concentrations, dominant morphologies, and size distributions of microplastics differed between rain events and baseflow, with smaller particles and higher concentrations being found during rain events. Concentrations did not differ significantly amongst catchments with different land use types, but concentrations were positively correlated with maximum runoff flow rate, catchment size, and the percentage of impervious surface area within a catchment. Combining microplastic concentrations with hydrograph data collected during rain events, we estimated that individual outfalls discharged between 1.9 million to 9.6 billion microplastics to receiving waters per rain event. These results provide further evidence that urban stormwater runoff is a significant pathway for the introduction of microplastics into aquatic environments and suggests that mitigation strategies for microplastic pollution should focus on larger urbanized catchments.
1 Introduction
Microplastics [plastic particles less than 5 mm in one dimension; (Hartmann et al., 2019)], are persistent and globally pervasive pollutants. Microplastics represent a diverse array of solid contaminants (Rochman et al., 2019) formed from the degradation of larger plastic items (Andrady 2011) and their definition includes other anthropogenic particles such as textile fibers, tire wear particles, and polymer-based road markings (Hartmann et al., 2019). Microplastics are found widely in marine (Eriksen et al., 2014), freshwater (Dris et al., 2015a; Horton et al., 2017a), and terrestrial environments (de Souza Machado et al., 2018), as well as remote areas such as the arctic (Obbard 2018; Bergmann et al., 2022) and deep sea sediments (Van Cauwenberghe et al., 2013; Woodall et al., 2014). The presence of microplastics in the environment is concerning due to the potential harmful effects they may have on wildlife and ecosystems. Although the long term ecotoxicological effects and risks posed by microplastics remain unclear, microplastic ingestion can elicit harmful effects on organisms (Cole et al., 2013; Wright et al., 2013; Au et al., 2015) and may also be causing deleterious effects at population and ecosystem levels (Bucci et al., 2020).
Urbanization is an important factor affecting microplastic abundances in aquatic ecosystems, with quantities of microplastics in waterways and biota having been shown to increase with proximity to urban centers (Yonkos et al., 2014; Baldwin et al., 2016; Peters and Bratton 2016). Microplastics in surface waters can originate from several sources within urban environments, including deposition from the atmosphere (Dris et al., 2015b; Dris et al., 2018; Sun et al., 2022), effluent from wastewater treatment plants (WWTPs) (Estahbanati and Fahrenfeld 2016; Mason et al., 2016), and stormwater runoff (Werbowski et al., 2021). Although WWTP effluent, in particular, has been identified as an important point source of microplastics (Mason et al., 2016; Horton et al., 2017b; Sun et al., 2019), recent studies have identified atmospheric deposition as a potentially larger source to receiving waters (Chen et al., 2022). The microplastics in atmospheric fallout may settle onto impervious surfaces, where they are washed off during rain events and transported to receiving waters by stormwater runoff. Microplastic concentrations in receiving waters increase following rain events (Hitchcock 2020; Forrest et al., 2022) and with proximity to stormwater outfalls (Horton et al., 2017a), suggesting that runoff is an important pathway to mobilize and transport microplastics from urban environments into aquatic ecosystems (Sutton et al., 2016; Horton et al., 2017b). This hypothesis has been supported by reports of high concentrations of microplastics in runoff. Concentrations of microplastic in stormwater are highly variable, ranging from 1.3 to 6,000 pcs/L (Grbić et al., 2020; Järlskog et al., 2020; Piñon-Colin et al., 2020; Sang et al., 2021; Sun et al., 2023), and may exceed concentrations in treated WWTP effluent (Sutton et al., 2019) and nearby aquatic environments (Grbić et al., 2020). In Shanghai, China, it is estimated that 333.5 tons/yr of microplastics flow into nearby waterways via stormwater runoff (Chen et al., 2022), representing 10.4% of the total microplastic flow. Furthermore, it is estimated that runoff contributes more than 40% of the microplastic loadings to European rivers (Siegfried et al., 2017), primarily in the form of tire wear particles. These studies highlight the importance of stormwater runoff as a transmission pathway for microplastics in urban areas.
Despite these findings, global measurements of microplastics in stormwater are limited relative to other matrices. Key knowledge gaps exist with respect to identifying catchment characteristics that may influence microplastic concentrations in stormwater (Wang et al., 2022; Österlund et al., 2023). Of the potential causal factors, land use has been the most widely studied. Industrial areas have been linked to increased microplastic concentrations in runoff and waterways (Liu et al., 2019; Sutton et al., 2019; Chen et al., 2020), although other studies provide conflicting conclusions on the influence of land use (Bond et al., 2022). Other potential factors, such as the amount of impervious surface area within catchments, have received less attention and their influence remains largely unknown (Österlund et al., 2023). The identification of contributing catchment characteristics is necessary for future microplastic management within urban areas.
There exists a limited number of quantitative emissions estimates of microplastics via stormwater, although such data is critical for understanding the magnitude of stormwater runoff as a microplastic source. Emissions estimates have been made based on direct measurement of microplastics in runoff combined with different modeled scenarios to produce annual and city-wide emissions estimates (Sutton et al., 2019; Piñon-Colin et al., 2020; Chen et al., 2022). However, concentrations and characteristics of microplastics in stormwater vary between storms and within individual storm events (Treilles et al., 2021; Boni et al., 2022; Sun et al., 2023), which may be reflected in the temporal variability of microplastics observed in urban surface water (Hitchcock 2020; Wei et al., 2022). To better understand the influence of stormwater on changes in concentrations of microplastics in surface waters, an improved understanding of microplastic discharge during individual rain events is needed.
This study sought to assess the concentrations, sizes, and morphology distributions of microplastics in stormwater from a large urban center during both wet and dry weather conditions. Samples were collected from catchments of differing sizes and land use activities to better understand the factors influencing microplastic concentrations in stormwater. Using hydrograph data collected during sampling, we developed quantitative estimates of microplastic discharges via stormwater during storm events. The results provide insight into the factors affecting microplastic concentrations and distributions in stormwater from a large urban center and are amongst the first estimates of microplastics loadings to receiving waters via urban stormwater runoff.
2 Materials and methods
2.1 Study location
Calgary is the largest city in the province of Alberta and the fourth largest city in Canada, with a population of 1.2 million (2017 census). The city has a land area of 825 km2, of which 44% is covered with impervious surfaces (City of Calgary 2018). Located in a temperate environment, Calgary received on average 450.5 mm of precipitation per year between 1996 and 2020, with most of the precipitation occurring as rainfall between April and October (Environment Canada 2022). Stormwater and sewage are transported in separate pipe networks, with stormwater largely being discharged directly (i.e., without treatment) to freshwater environments, including the Bow and Elbow Rivers, from approximately 450 stormwater outfalls throughout the city.
2.2 Sample collection
Fifteen sites (Figure 1; Supplementary Table S1) throughout Calgary were sampled during the summer of 2017. Rain event samples (n = 51) were collected using flow-triggered autosamplers (6712 full size portable samplers, Teledyne ISCO, Lincoln, NE, United States), with 400–450 mL samples collected throughout the hydrograph at predetermined flow-paced (i.e., every 6–600 m3) or time-paced (i.e., every 5 min) intervals, depending on site characteristics. Samples were collected into 1 L polypropylene (PP) bottles and then manually composited into a 10 L LDPE carboy. Subsamples were collected from composited samples into 1 L pre-cleaned amber glass bottles with PTFE-lined polypropylene caps for microplastics analysis. Baseflow samples (n = 30) were manually collected into 1 L pre-cleaned amber glass or 4 L HDPE bottles and subsampled into 1 L amber glass bottles in the lab. All samples were stored at 4°C until analysis.
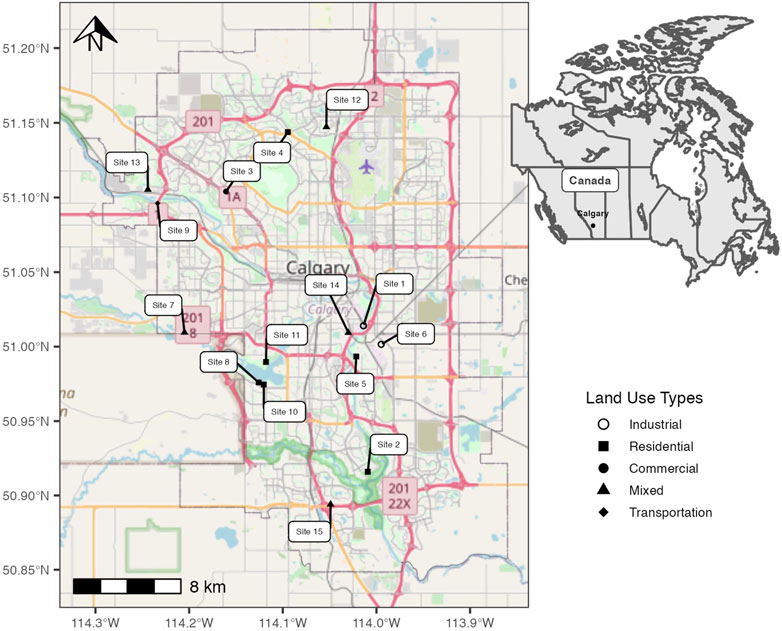
FIGURE 1. Map of Calgary, Alberta, showing stormwater sampling locations throughout the city.
2.3 Microplastic extraction
To assess recoveries, all samples were spiked with a mixture containing a known number of fluorescent polyethylene microbeads (Cospheric™, California, United States) varying in size and density (Supplementary Table S3) (Bujaczek et al., 2021). Samples were then filtered through a 37 μm stainless steel sieve to isolate suspended particulates, transferred to a 250 mL Erlenmeyer flask and dried overnight in an oven at 70°C. Organic materials were removed by wet peroxide oxidation (Masura et al., 2015) on a shaker plate at 90 rpm and 50°C for 60 min. An additional 20 mL aliquot of H2O2 was added if visible organic material remained and the reaction was continued for an additional 30 min. Initial extraction experiments found that samples were sufficiently low in suspended materials that subsequent visual analysis was not impacted; therefore, in order to improve recoveries of microplastics and to retain more dense anthropogenic materials (e.g., tire wear particles) no density separation was carried out. Following chemical digestion, samples were transferred to a stainless steel sieve stack and fractionated into the following size classes: >1,000 µm, 1,000-500 μm, 500-250 μm, 250-125 μm, and 125-37 μm. Sieve contents were individually transferred to 0.45 μm gridded nitrocellulose filters (Ahlstrom-Munksjö, Helsinki, Finland), dried by vacuum filtration, enclosed in petri slides (Analyslide, Pall Corp., New York, United States), and stored in the dark until analysis.
2.4 Microplastic quantification and identification
Visual identification and enumeration of microplastics was carried out by brightfield microscopy with either a stereo microscope (Olympus SZ61) or a compound microscope (Olympus CX41) under magnification ranging from 2X to 40X. Microplastic morphologies were categorized as spheres, films, fragments, or fibers (Lusher et al., 2020). All particulates visually identified as microplastics were required to be homogenous in color throughout and free of any cellular structures (Hidalgo-Ruz et al., 2012). Fragments were identified by having a discernible fractured edge. Fibers were defined as having a length substantially greater than the width and were required to be of consistent diameter throughout their entire length. Spheres were spherical in shape with no readily identifiable major or minor axis and no identifiable fractures or discernable fragmentation. Films were flat in one dimension with the two other dimensions being substantially larger. Microplastics were further categorized based on color and placed into the following groups: blue, red, clear, black, green, or other.
Chemical identification was carried out using Raman microspectroscopy on a representative subset of samples (7 rain event samples). For each sample, all particles identified visually as microplastics in each size fraction were analyzed, resulting in a total of 259 particles examined (10.4% of the total particles quantified in this study). Raman spectra were acquired with a Bruker SENTERRA I Raman microscope (Bruker Optics Ltd., Milton, ON, Canada) over the range of 200–2,500 cm−1 using a laser wavelength of 785 nm, a laser intensity of 10 mW, a 5 s integration time, and 5 co-additions. Settings were adjusted for some individual particles to acquire stronger spectra or to prevent decomposition. All spectra were baseline corrected and min-max normalized prior to library matching using Opus 6.5 software (Bruker Optics Ltd., Milton, ON, Canada). Chemical identities were determined by spectral matching to spectra contained in the SLoPP/SLoPP-E (Munno et al., 2020) microplastic libraries. For spectral matching, a hit quality >750 was required (where HQ = 1,000 is a perfect match and 0 indicates no correlation at all) and all spectral matches were further confirmed by manual comparison of the spectra. Particles not matched to library spectra were classified as either “Unknown” or “Unknown (Anthropogenic)” if they were colored (indicative of anthropogenic dye). Acquisition of useable spectra from some particles was impossible due to thermal decomposition or fluorescence (classified as “No Spectra”).
2.5 Quality control and quality assurance
To reduce contamination, all reagents were filtered through a 1 µm glass fiber filter and all glassware was thoroughly washed with filtered (0.22 µm) nanopure water (>18 MΩ-cm, Milli-Q RG, Millipore Corp., Ann Arbor, MI) prior to use. All openings and equipment were covered during sample preparation with pre-combusted aluminum foil to prevent contamination from airborne microplastics, and all procedures were carried out in a fumehood to further minimize airborne contamination.
Blanks (see Supplementary Material for descriptions) were used to assess background contamination and included laboratory procedural blanks (n = 9), sub-sampling blanks (n = 3), and field equipment blanks (n = 9). All blanks were prepared from filtered (0.22 µm) nanopure water and were extracted and analyzed identically to samples, with at least one blank being extracted and analyzed with every 10 samples. To reduce bias, analysts were blind as to whether they were extracting and analyzing a sample or a blank.
Microplastics were found in all blanks, although there were no differences amongst types of blanks with respect to quantity, size, color, or morphological distribution (one-way ANOVA, p > 0.05). Mean quantities in blanks (30.3 ± 23.4 pcs) were significantly lower than in samples (W = 900, p = 0.021); nonetheless, sample concentrations were blank corrected by subtracting the mean number of particles within each size/morphology combination (e.g., 125–250 µm fibers) in the blanks from the number of particles in the same category in each sample (Rochman et al., 2019; Brander et al., 2020).
2.6 Catchment characteristics
Land use statistics were obtained using ArcGIS (ESRI, Toronto, Canada) by overlaying catchment shapefiles with a City of Calgary land use geodatabase. Total intersecting land areas were summed and the percentages of each land use within the catchment were calculated. Sites having catchments composed of >70% of a single land use type were placed into one of the following land use groups: industrial, commercial, residential, or transportation corridor/roadways. All other sites were categorized as mixed land use (Supplementary Table S1). A subset of 5 sites with a more extensive set of geospatial data were selected to investigate the influence of additional catchment characteristics (Supplementary Table S2), including: total impervious surface area, percent impervious surface area, number of buildings, and population density (as measured by number of buildings per km2). Most sites within this subset of samples were classified as predominantly residential and/or parks, except for one site (Site 9) which is classified as a transportation corridor (99% transportation). All data on land use and catchment characteristics were provided by The City of Calgary.
2.7 Discharge of microplastics via stormwater
For 21 rain events across 8 sites (Supplementary Table S6), stormwater flow rates (m/s) were measured every 1 or 5 min throughout the event with a Triton X flow monitor (ADS, Huntsville, AL, United States). Depth (m) and volumetric flow rate (L/s) were measured concomitantly, enabling the generation of hydrographs for each event. The total discharge volume (in L) from each outfall during rain events was quantified by integrating the area under the hydrograph using the trapezoidal integration function in the PKNCA and PRACMA packages in R (Denney et al., 2015; Borchers 2021). The total discharge of microplastics (pcs) for each rain event was determined as the product of the total microplastic concentration (pcs/L) and the total discharge volume.
2.8 Data analysis
All statistical analyses were carried out using the R statistical environment (R Core Team 2020). Normality was assessed by visual analysis of QQ plots and application of the Shapiro-Wilks test to each investigated data set. Unless otherwise noted, Kruskal-Wallis tests followed by Dunn’s Multiple Comparison test with Bonferroni correction were performed to compare median concentrations or percentages of each microplastic characteristic (i.e., size, morphology, color, chemical composition) amongst land use types, and a Wilcoxon rank sum test was used to compare baseflow and storm events. Associations between land use type and both size and morphology were further explored using chi-square independence tests (Supplementary Table S4), although for tests involving shape, spheres were excluded due to their low counts. A 5% significance level was used for all analyses and all data is presented as mean ±1 standard deviation unless otherwise noted.
Linear regressions were used to investigate relationships between total microplastic concentrations and antecedent dry days, cumulative rainfall per event, flow rates, total suspended solids (TSS), percentage land use type, and the following catchment characteristics: total catchment area, total impervious surface area, percent impervious surface area, number of buildings, and population density (determined as number of buildings per square kilometer). Rainfall data was obtained through The City of Calgary’s open data portal (City of Calgary 2021).
3 Results
3.1 Quality assurance and recoveries
Recoveries of fluorescent microbeads ranged from 21.6% to 87.2% (mean = 57.5 ± 32.2%; Supplementary Table S3) and differed significantly amongst the different microbead categories, except between red and green beads (Supplementary Figure S1). Recoveries were not dependent on density (Pearson R = 0.056, p = 0.19), but recovery percentage increased with increasing bead size (Pearson R = 0.61, p = 2 × 10–16).
3.2 Concentrations and characteristics of microplastics in stormwater runoff
Microplastics were identified in all samples investigated, with blank corrected concentrations ranging from 0.7 to 200.4 pcs/L (mean = 31.9 ± 34.0 pcs/L; median = 17.0 pcs/L) across all sites and event types (Figure 2). Fibers were the most prevalent morphology identified (47.7 ± 33.0%), followed by fragments (42.5 ± 33.7%). The greatest percentage of microplastics were found in the 125–250 µm size range (26.6 ± 22.9%) followed by the 37–125 µm size range (24.0 ± 22.3%). Particles were predominantly black (33.5 ± 33.8%), transparent (22.6 ± 31.3%), or blue (16.0 ± 21.6%).
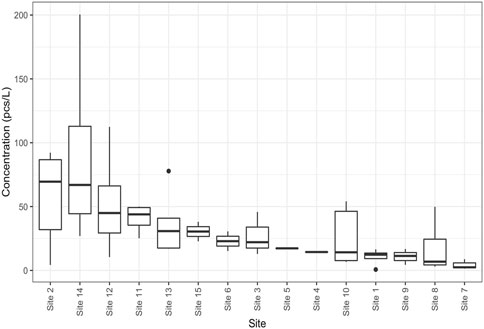
FIGURE 2. Boxplots of blank-corrected concentrations of microplastics in stormwater from Calgary.
Most (67.8%) of the particles visually identified as microplastics were confirmed as being anthropogenic based on Raman spectroscopy. Overall, cotton was the most prevalent type of anthropogenic particle identified (18.5%), followed by Unknown-Anthropogenic (13.8), carbon black (12.3%) and polyethylene (10.8%). Chemical composition was morphology dependent (Supplementary Figure S2). Fragments were primarily identified as carbon black (17.4%), polyethylene (14%) and polypropylene (9.1%), with an additional 13.2% of fragments identified as anthropogenic based on color, but with no spectral match due to interference by dyes (Unknown-Anthropogenic). Amongst fibers, cotton was the dominant type identified (34.8%), followed by polyester (23.2%) and Unknown-Anthropogenic (10.1%).
3.3 Baseflow vs. runoff
Microplastic concentrations were significantly higher in samples collected during rain events than in samples collected under baseflow conditions (W = 251.5, p = 0.0001332; Figure 3A), with rain events having an average concentration of 33.5 ± 26.1 pcs/L compared to baseflow with an average concentration of 19.1 ± 15.2 pcs/L. Compared to baseflow samples, rain event samples contained a greater percentage of fragments (W = 537.5, p = 0.03491) and 125–250 µm particles (W = 537.5, p = 0.03489). In contrast, a greater percentage of films (W = 1,003, p = 0.01013) and larger (500–1000 µm) particles (W = 1,104.5, p = 0.0004028) were present in baseflow samples (Figures 3B–D).
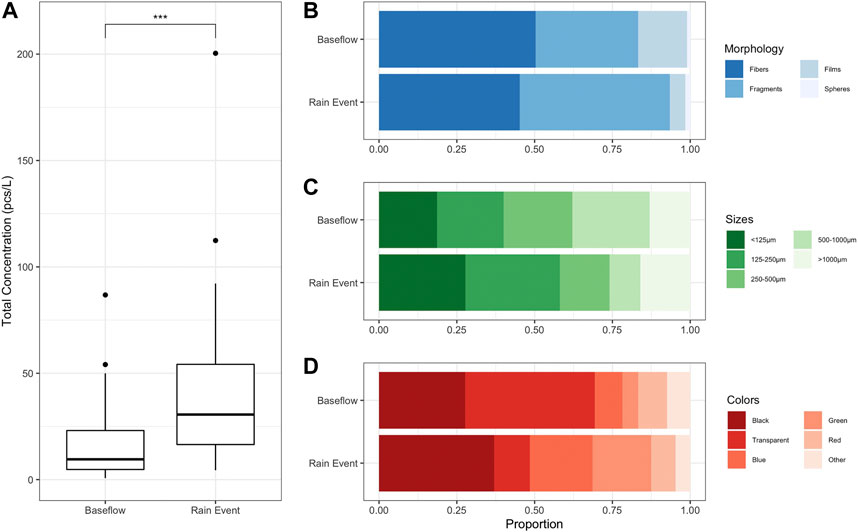
FIGURE 3. (A) Boxplots of microplastic concentrations in stormwater collected during baseflow and rain events. * represents a significant difference with p < 0.001. Right side shows the average percent composition of microplastics in different morphological categories (B), size classes (C), and colors (D) in stormwater during baseflow and rain events.
3.4 Relationships to environmental factors and catchment characteristics
The highest microplastic concentrations were found in stormwater from residential and mixed land use catchments (Figure 4A), although there were no significant differences amongst land use types (H(4) = 7.0873, p = 0.1313) nor any relationship between the total microplastics concentration and the percentage of land use types within a catchment. However, differences in morphology, size, and color distributions were apparent between different land use types (Figures 4B–D). A dependence between site type and morphology was found (Supplementary Table S4; χ2(8) = 238.4, p < 2.2 × 10⁻¹⁶), with stormwater from residential and transportation catchments associated with lower levels of fragments, but higher levels of films and fibers, respectively. Industrial sites were associated with lower levels of fibers and higher levels of fragments, while mixed sites were associated with lower levels of both fibers and films and higher levels of fragments.
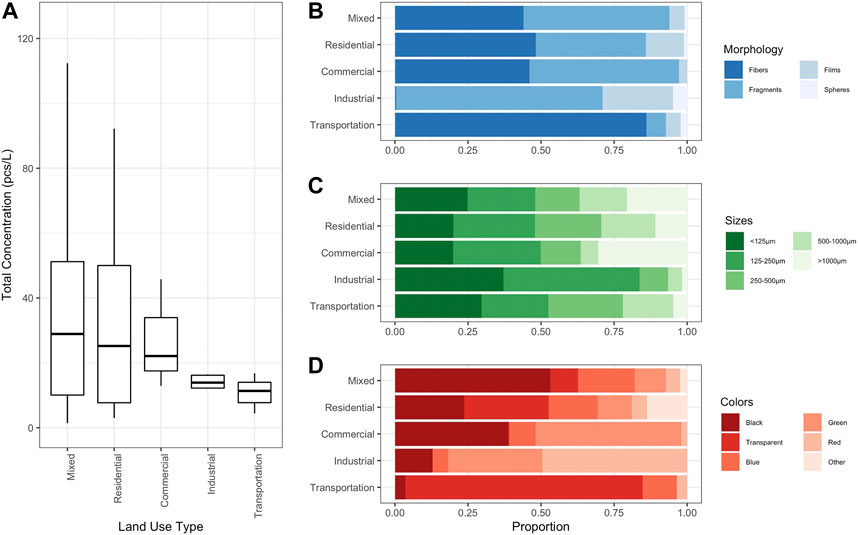
FIGURE 4. (A) Boxplot of microplastic concentrations in stormwater collected from catchments of differing predominant land use. Right side shows average percent composition of microplastics in different morphological categories (B), size classes (C), and colors (D) in stormwater collected from catchments of differing land use types.
The predominant land use type within catchments was also associated with particle size (Supplementary Table S4; χ2 (51) = 52.094, p = 1.058 × 10–05). The industrial sites were associated with fewer microplastics greater than 1000 µm, but more microplastics <125 μm. The commercial sites were associated with fewer microplastics between 500 and 1000 µm and more microplastics within the 125–250 μm category. Residential sites were associated with more microplastics within the 250–500 μm category, whereas the mixed sites were associated with more microplastics greater than 1000 µm, but fewer microplastics between 250 and 500 μm.
There were no relationships between total concentrations and cumulative precipitation during a rain event (Supplementary Figure S3). A positive relationship between total concentration and antecedent dry days was found for rain event samples but not baseflow (Supplementary Figure S4). A significant positive relationship was also found between total concentrations and maximum flow rate for rain event samples (Supplementary Figure S5). No relationship was found between total microplastics concentration and total suspended solids (TSS) concentration.
Across all samples, a weak, albeit significant, positive relationship was found between microplastics concentrations and total catchment area (Figure 5A); however, when separated by sample type, the positive relationship remained only for rain event samples and no relationship existed under baseflow conditions (Supplementary Figure S6). For the subset of five sites there was a significant positive correlation with percent impervious area (Figure 5B), but no significant relationships were found for other investigated catchment characteristics (i.e., population density).
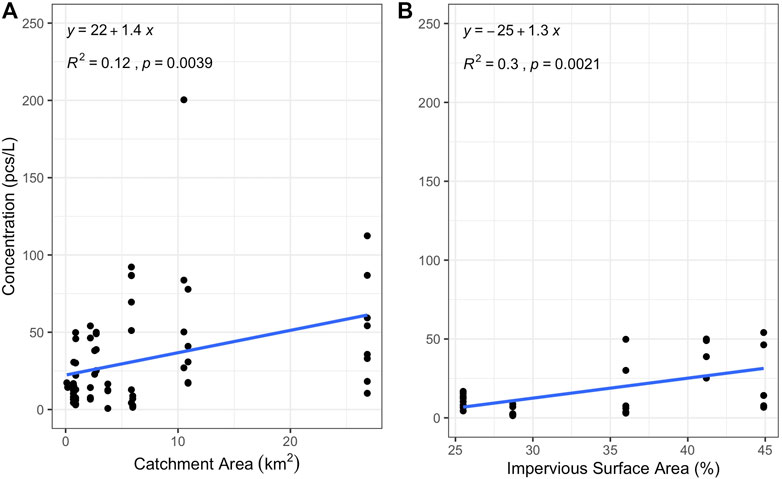
FIGURE 5. Linear regression between (A) microplastic concentrations and total catchment area for all samples and (B) the total concentration of microplastics in stormwater from a subset of five outfalls and the percent impervious surface area within the catchment.
3.5 Discharge of microplastics via stormwater
Total stormwater discharge ranged from 1.41 × 10⁵ L to 1.15 × 10⁸ L per rain event, resulting in a total quantity of microplastics discharged from individual outfalls during single rain events of 1.89 × 10⁶ pcs to 9.64 × 10⁹ pcs (mean = 6.55 × 10⁸ ± 2.05 × 10⁹ pcs; Supplementary Table S6). A positive relationship was found betwen total discharge of microplastics and total catchment area (Figure 6).
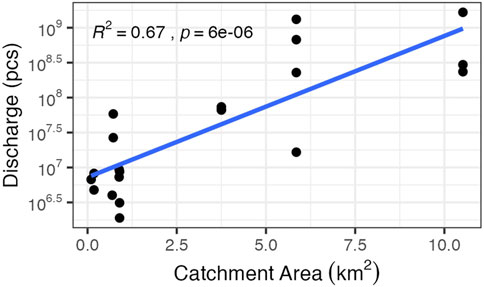
FIGURE 6. Linear regression between microplastic discharge and total catchment area.
4 Discussion
4.1 Concentrations and characteristics of microplastics in stormwater runoff
Urban runoff is recognized as a potentially significant pathway by which microplastics enter the aquatic environment (Sutton et al., 2019), although direct measurements of microplastic abundances in stormwater runoff remain limited compared to other matrices. Reported abundances in stormwater vary widely and range over three orders of magnitude (Wang et al., 2022), with concentrations reported herein being at the lower end of this range. Concentrations of microplastics in Calgary stormwater are generally similar to those reported in stormwater from the San Francisco Bay Area [mean: 9.2 pcs/L: (Sutton et al., 2019)], Wuhan, China [2.75–19.04 pcs/L; (Sang et al., 2021)], and Toronto, Canada [15.4 pcs/L; (Grbić et al., 2020)]; however, they are lower than reported in street runoff from Tijuana, Mexico [66-191 pcs/L; (Piñon-Colin et al., 2020)], at the inlet of a stormwater bioretention facility in Toronto, Canada [186 ± 173 pcs/L; (Smyth et al., 2021)], or at a single site in Gothenburg, Sweden, where total microplastics (including paint fragments) ranged from 1,500 to 6,000 pcs/L for particles greater than 20 μm (Järlskog et al., 2020). Although differences in stormwater microplastic concentrations amongst studies could potentially be attributable to location specific differences amongst studied sites, direct comparisons are difficult due to methodological variations. For example, the minimum reported particle size varies from 20 µm to 125 µm, which may contribute to the higher abundances reported elsewhere (Covernton et al., 2019; Järlskog et al., 2020; Piñon-Colin et al., 2020). Other methodological differences amongst studies include the use of density flotation to isolate microplastics (Sutton et al., 2019; Grbić et al., 2020; Piñon-Colin et al., 2020; Smyth et al., 2021), which may not extract higher density particles, e.g., tire wear particles (Järlskog et al., 2020). Development of harmonized sampling and analytical methodologies for microplastics analysis should be extended to stormwater to improve comparability between studies.
A suite of fluorescent microbeads was added to each sample to assess size and density dependent recoveries. Acceptable recoveries were observed for beads >250 µm, however, smaller beads were recovered less well, with <50% recoveries for beads <150 µm in diameter (Supplementary Table S2; Supplementary Figure S1). The lower recoveries for smaller beads was likely due to increased adhesion to glassware and losses during sample transfer between vessels. Although we did not correct reported concentrations for losses, the low recoveries suggest that the quantities of small microplastics in Calgary stormwater may be underestimated. Although more work is necessary to better validate the use of internal standards, particularly the applicability across morphologies, we suggest the inclusion of internal standards in analyses moving forward to assess size-specific recoveries and recovery variability across large data sets with multiple analysts, which may not be accounted for with typical spike and recovery experiments.
It should also be noted that fluorescence and decomposition of samples during Raman spectroscopy is common, leading to an inability to acquire a suitable spectrum for library matching. We were unable to confirm that 32.2% of the particles examined by Raman were in fact polymers or anthropogenic. As we did not correct our overall concentrations for these percentages, the concentrations reported here may be overestimates of the actual microplastic concentrations.
Fibers and fragments composed more than 90% of the microplastics identified in Calgary stormwater, with fibers being the most prevalent morphology identified. The preponderance of fibers is consistent with other observations in stormwater (Grbić et al., 2020; Piñon-Colin et al., 2020; Werbowski et al., 2021) and surface waters (Dris et al., 2015a; Baldwin et al., 2016; Miller et al., 2017). Fibers may enter urban environments through shedding of synthetic clothing or other textiles (Acharya et al., 2021), emissions from clothing dryers (Kapp and Miller 2020), or the degradation of fibrous litter such as cigarette butts (Grbić et al., 2020; Shen et al., 2021). Fibers make up the largest proportion of microplastics observed in urban atmospheric fallout (Dris et al., 2015b; Cai et al., 2017; Wright et al., 2020) and road dust (Abbasi et al., 2017; Su et al., 2020), therefore they may enter stormwater through atmospheric deposition (Smyth et al., 2021) and subsequent wash off from surfaces, or through wet deposition during storm events (Sun et al., 2022).
The intrusion of raw sewage into storm sewer systems may also introduce microplastic fibers into stormwater, as raw sewage contains elevated levels of microplastic fibers. Combined sewer overflows (CSOs), which collect both stormwater and raw sewage in the same sewer network, have been shown to have higher microplastic concentrations than stormwater alone and a higher proportion of fibers due to the presence of sewage (Dris et al., 2018). Although in Calgary stormwater and sewage are transported within separated pipe networks, as much as 10% of the stormwater volume within the storm sewer system is assumed to be raw sewage due to cross-connections or deteriorating infrastructure within the system (Government of Alberta 2021). To determine whether sewage contributes significantly to fragment and fiber abundances in Calgary’s stormwater, it was assumed that 10% (by volume) of the stormwater flow was composed of sewage that contained 21.5 pcs/L of fibers [as no concentrations of microplastics in Calgary sewage are available, this value is the average concentration of fibers in WWTP influent from Vancouver, Canada; (Gies et al., 2018)]. Based on these assumptions, the estimated total concentration of fibers attributable to raw sewage intrusion was less than 15% of the total found in Calgary stormwater and suggests that other sources (e.g., atmospheric deposition, surface runoff) may be greater contributors to fiber quantities in separated sewer systems.
The majority of fragments were black, elongated, and twisted, consistent with the morphology of tire wear particles (Kreider et al., 2010), although they could not be conclusively identified as such. Tire wear particles produce non-specific Raman spectra and conclusive identification requires pyrolysis-GC/MS (Wagner et al., 2018), which was not available for this study. Most black particles examined generated Raman spectra identified as carbon black (Supplementary Figure S7), which makes up 20%–35% of tires by weight (Hüffer et al., 2019). The spectra were also consistent with those used to identify tire wear particles in stormwater ponds (Braga Moruzzi et al., 2020). Black fragments made up 34% of the particles from which no spectrum was obtained (i.e., the “No Spectrum” category) in this study, which may be a result of melting of the rubber particles by the Raman laser, and this may indicate a greater contribution of tire wear particles than could be ascertained from the Raman results alone. Overall, however, black fragments made up less than 15% of all microplastics in Calgary’s stormwater and the abundance of non-black particles exceeded black particles by a ratio of 3 to 1, lower than the 42% of fragments being composed of black particles reported in runoff from San Francisco (Zhu et al., 2021). However, Werbowski et al. report sites within their study area (also the San Francisco bay area) that contain as much as 97% fibers or 64% black rubbery fragments (Werbowski et al., 2021). Such differences in chemical or morphological composition may be driven by site specific characteristics or sampling time, as shifts in microplastic compositions may change in stormwater throughout a rain event (Sugiura et al., 2021; Treilles et al., 2021).
Other polymer types identified as fragments included polyethylene and polypropylene, which are amongst the most widely produced polymers in the world (Geyer et al., 2017). These polymers are widely used in consumer materials such as plastic packaging and single use items (Geyer et al., 2017); thus fragments in stormwater may originate from breakdown of larger littered plastic items (Andrady 2011; Chamas et al., 2020).
4.2 Microplastics in baseflow vs. rain events
Rain events increase microplastic concentrations in receiving waters (Hitchcock, 2020; Forrest et al., 2022); thus stormwater sampling during rain events or shortly after have been the focus of most studies to date. Stormwater samples collected during rain events contained greater concentrations of microplastics than baseflow samples. However, average concentrations in baseflow runoff still exceeds microplastic concentrations reported for some WWTP effluent (Grbić et al., 2020) and regional surface waters (Bujaczek et al., 2021). This data suggests that the sustained baseflow drainage that occurs between rain events is an additional pathway by which microplastics may continuously be discharged to the environment.
No relationship was found between microplastic concentrations and total rainfall (Supplementary Figure S3), but consistent with previous studies (Hitchcock 2020; Piñon-Colin et al., 2020; Smyth et al., 2021), a positive relationship between microplastic abundance and the number of antecedent dry days was found (Supplementary Figure S4). Microplastics that build up on urban surfaces during dry periods may be washed into storm sewer systems during precipitation events, therefore, the length of time microplastics and other anthropogenic particles build up on impervious surfaces prior to wash off contributes to the elevated concentrations in stormwater.
Other studies, however, have not found relationships between concentrations and rainfall or antecedent dry days (Werbowski et al., 2021; Boni et al., 2022), suggesting that additional factors may contribute the concentrations observed in stormwater. Microplastics and anthropogenic particles are subject to transport processes within the sewer pipes, such as deposition and resuspension, and particles that settle into storm sewer sediment will remain there until water velocities are sufficiently high to remobilize them (Hurley et al., 2018; Ockelford et al., 2020; Sang et al., 2021). In Calgary microplastic concentrations were correlated to the maximum runoff flow rate during rain events (Supplementary Figure S5), but not rainfall, suggesting remobilization of microplastics from within the sewer system. Therefore, in addition to wash off from surfaces, storm sewer sediments may act as an additional source of microplastics during rain events (Ockelford et al., 2020) and potentially obscure relationships between microplastic abundances and rainfall or antecedent dry days.
The predominant morphology shifted from fibers and larger particles under baseflow conditions to fragments and smaller particles during rain events (Figure 3). Baseflow in Calgary is predominantly comprised of groundwater intrusion, rather than urban runoff, and flow rates are lower than during rain events. The larger microplastics observed under baseflow conditions are predominantly fibers (Figure 3B), which have slower settling velocities than particles of comparable size (Waldschläger and Schüttrumpf 2019). The fibers may not settle as quickly, or may be more easily remobilized during lower energy baseflow conditions (Hoellein et al., 2019), leading to higher proportions in baseflow. Runoff over impervious surfaces and higher flow rates in the drainage system during rain events may mobilize smaller microplastics, contributing to the higher total concentrations and the observed shift from predominantly fibers and larger particles under baseflow conditions to fragments and smaller particles during rain events.
It is germane to note that the different sampling methodologies between baseflow and rain event samples also may have influenced the observed differences in total concentrations and/or morphologies. Although validated for sampling suspended sediment (Clark et al., 2009), autosampler inlets are affixed to pipe bottoms and may not adequately sample floating particles like low density plastics or fibers, leading to bias in the size, quantity, or type of microplastic particles collected, particularly at lower flow rates (e.g., during smaller, less intense rain events) when less turbulent mixing occurs. Although autosamplers are an excellent tool for capturing rain events, which are difficult to predict, additional work should be aimed at better understanding the potential biases introduced by automated sampling methods.
4.3 Relationships to environmental factors and catchment characteristics
Land use activities may influence total microplastic concentrations in runoff (Sutton et al., 2019; Chen et al., 2020; Werbowski et al., 2021) and stormwater retention ponds (Liu et al., 2019). Most studies have found the highest concentrations in catchments composed of industrial land use (Chen et al., 2020; Piñon-Colin et al., 2020; Werbowski et al., 2021). In contrast, there were no differences in microplastic concentrations in runoff originating from catchments with different land use types (Figure 4A) in Calgary, although microplastic abundances were generally higher in stormwater from mixed and residential catchments. These differences may be due to increased number of people using mixed and residential areas, or from unique site specific differences discussed below.
Morphology, size, and color distributions of microplastics in runoff did, however, differ amongst catchments with different predominant land use types (Figures 4B–D), suggesting that source specific signatures may exist even if differences in abundances do not. The proportion of fragments was greatest within industrial sites, although the source of these fragments is unclear, as no fragments indicative of industrial activities (e.g., pre-production pellets) were identified. Fibers were the principal morphology identified at the single transportation site, although runoff at this site is channeled through a dry pond area prior to discharge, potentially resulting in retention of more dense particles (i.e., tire wear particles) and highlighting the site-specific nature of microplastic abundances and morphologies in runoff. The proportions of fibers and fragments were similar amongst residential, commercial, and mixed sites, indicating that microplastic sources in these catchments are diverse and diffuse.
In addition to land use activities, other catchment characteristics may be important in understanding microplastic concentrations stormwater. A weak, albeit significant, relationship was found between microplastic abundance and total catchment area (Figure 5A), although this trend was only observed for rain event samples and not baseflow samples (Supplementary Figure S6). Likewise, concentrations in runoff from a subset of 5 sites were also correlated to the percentage of impervious surface area within the catchment (Figure 5B). Similarly, microplastic abundances in stormwater have been positively correlated with the percentage of impervious surface area in twelve catchments from the San Francisco Bay area (Werbowski et al., 2021) and with total road areas in Toronto (Grbić et al., 2020). Although this specific relationship was not investigated here, it stands to reason that an increase in urban catchment area would concomitantly increase total road area within the catchment. These finding suggest that larger and more urbanized catchments facilitate the transfer of higher amounts of microplastics to stormwater and subsequently into urban surface waters. These catchments should therefore be given priority for management activities, such as green infrastructure or bioretention facilities (Smyth et al., 2021; Werbowski et al., 2021), to reduce microplastic concentrations in stormwater. Given the variety of sources and the diffuse nature of microplastic pollution within urban areas, identifying additional factors that influence concentrations in stormwater is imperative to developing targeted and meaningful remediation approaches to limit microplastic emissions.
4.4 Discharge of microplastics via stormwater
From the measured microplastic concentrations and hydrograph data, an estimated 1.89 × 10⁶ to 9.64 × 10⁹ particles were discharged from individual outfalls per rain event, with an average discharge of 6.86 × 10⁸ particles per event (Supplementary Table S6). There is, however, considerable variability in the estimated quantity of microplastics discharged, driven largely by the wide range of microplastic concentrations in stormwater, the overall event intensity (i.e., maximum and average flow rates), and the duration of the storm, with longer or more intense storms resulting in the discharge of larger quanties of microplastics. The quantity of microplastics discharged was positively correlated with total catchment area (Figure 6), likely due both to the increased microplastic concentration (Figure 5) and the increased flow associated with larger catchment areas.
Few studies have estimated the discharge of microplastic to the environment through runoff. Piñon-Colin et al. (2020) estimated that between 5.7 × 10⁵ and 8.8 × 10⁶ pcs/ha are discharged during individual rain events through stormwater. When catchment areas are accounted for, this equates to 1.7 × 10⁸ and 1.8 × 10⁹ pcs per rain event, comparable to the discharges reported here. City-wide estimates of annual microplastic discharges range from 1.08 × 10¹¹ to 2.19 × 10¹³ pcs year−1 in Wuhan, China (Chen et al., 2020), while 7.2 × 10¹² microplastics were estimated to be discharged to San Francisco Bay per year based on calibrated runoff models and measured concentrations (Sutton et al., 2019). Given the limited number of sites for which microplastic discharge could be estimated (only 8 of the over 450 outfalls in Calgary), no attempt was made to extrapolate individual outfall discharges to annual city-wide discharges. Furthermore, as much of Calgary’s stormwater passes through stormwater ponds, which may lower quantities of microplastics prior to discharge (Olesen et al., 2019), any city-wide annual emissions estimates would likely be significant overestimates of annual discharges.
Wastewater treatment plants are widely regarded as point sources of microplastic pollution (Estahbanati and Fahrenfeld 2016; Mason et al., 2016; Vermaire et al., 2017). It was reported that the average emissions from 17 WWTPs throughout the United States was 4.4 × 10⁶ particles/day (Mason et al., 2016) and the median daily discharge from 22 studies globally was 2 × 10⁶ particles/day (Sun et al., 2019). However, the discharge of microplastics via stormwater estimated herein (average = 6.86 × 10⁸ particles per event) exceeds estimated discharges from treated WWTP effluent by two orders of magnitude. This data suggests that individual rain events can discharge from a single outfall microplastic quantities equivalent to 100 days worth of WWTP effluent. This is consistent with previous estimations that annual stormwater loadings exceed that from WWTPs by 300 times (Sutton et al., 2019) and further demonstrates that untreated stormwater runoff from urban centers represents a significant source of microplastics and anthropogenic particles to aquatic environments.
5 Conclusion
Microplastics were found in all stormwater samples at levels comparable to other urban areas. Results suggest that increased concentrations of microplastics in stormwater may be due to increased build-up of microplastics on impervious surfaces during dry periods, as well as resuspension of microplastics within storm sewers during high-flow rain events. Although microplastic concentrations in stormwater were higher during storm events, baseflow runoff was shown to be an additional source of microplastics to local surface waters. An estimated 1.9 million to 9.6 billion microplastics were discharged from individual outfalls per rain event, providing further evidence that stormwater is a significant pathway for the introduction of microplastics to aquatic ecosystems. Given the large quantities of anthropogenic particles discharged during rain events, strategies aimed at reducing microplastic and fiber emissions via runoff are needed, with particular attention being paid to larger and more developed catchments. In particular, engineered solutions, such as stormwater retention ponds (Olesen et al., 2019) or bioretention facilities and rain gardens (Gilbreath et al., 2019; Smyth et al., 2021; Werbowski et al., 2021), have been effective at reducing the quantity of microplastics discharged and should be further investigated.
Data availability statement
Publicly available datasets were analyzed in this study. This data can be found here: https://borealisdata.ca/dataset.xhtml?persistentId=doi:10.5683/SP3/OGZSPD.
Author contributions
MR helped conceptualize the study, secured funding for the study, performed data analysis and manuscript writing. AL, TG, DM, TB, SK, SM, AH, and RK all performed sample analysis and data collection. KK and BF contributed to the statistical analysis of data and manuscript preparation. EC compiled land use data and contributed to data analysis. VA and NR also helped conceptualize the study and provided resources, samples, and contributed to manuscript preparation. All authors contributed to the article and approved the submitted version.
Funding
This work was funded by the MacEwan University Office of Research Services and the Natural Science and Engineering Research Council of Canada through a Strategic Grant (funding reference number EGP 514607-17) and Discovery Grant (funding reference number RGPIN-2015-04852) to MSR. In-kind support and the provision of samples and additional data was provided by The City of Calgary.
Conflict of interest
The authors declare that the research was conducted in the absence of any commercial or financial relationships that could be construed as a potential conflict of interest.
Publisher’s note
All claims expressed in this article are solely those of the authors and do not necessarily represent those of their affiliated organizations, or those of the publisher, the editors and the reviewers. Any product that may be evaluated in this article, or claim that may be made by its manufacturer, is not guaranteed or endorsed by the publisher.
Supplementary material
The Supplementary Material for this article can be found online at: https://www.frontiersin.org/articles/10.3389/fenvs.2023.1090267/full#supplementary-material
References
Abbasi, S., Keshavarzi, B., Moore, F., Delshab, H., Soltani, N., and Sorooshian, A. (2017). Investigation of microrubbers, microplastics and heavy metals in street dust: A study in bushehr city, Iran. Environ. Earth Sci. 76 (23), 798. doi:10.1007/s12665-017-7137-0
Acharya, S., Rumi, S. S., Hu, Y., and Abidi, N. (2021). Microfibers from synthetic textiles as a major source of microplastics in the environment: A review. Text. Res. J. 91, 2136–2156. doi:10.1177/0040517521991244
Andrady, A. L. (2011). Microplastics in the marine environment. Mar. Pollut. Bull. 62 (8), 1596–1605. doi:10.1016/j.marpolbul.2011.05.030
Au, S. Y., Bruce, T. F., Bridges, W. C., and Klaine, S. J. (2015). Responses of Hyalella azteca to acute and chronic microplastic exposures: Effects of Microplastic Exposure on Hyalella azteca. Environ. Toxicol. Chem. 34 (11), 2564–2572. doi:10.1002/etc.3093
Baldwin, A. K., Corsi, S. R., and Mason, S. A. (2016). Plastic debris in 29 great lakes tributaries: Relations to watershed attributes and hydrology. Environ. Sci. Technol. 50 (19), 10377–10385. doi:10.1021/acs.est.6b02917
Bergmann, M, Collard, F, Fabres, J, Gabrielsen, GW, Provencher, JF, Rochman, CM, et al. (2022). Plastic pollution in the Arctic. Nat. Rev. Earth Environ. 3, 323–337. doi:10.1038/s43017-022-00279-8
Bond, C., Li, H., and Rate, A. W. (2022). Land use pattern affects microplastic concentrations in stormwater drains in urban catchments in perth, western Australia. Land 11 (10), 1815. doi:10.3390/land11101815
Boni, W., Arbuckle-Keil, G., and Fahrenfeld, N. L. (2022). Inter-storm variation in microplastic concentration and polymer type at stormwater outfalls and a bioretention basin. Sci. Total Environ. 809, 151104. doi:10.1016/j.scitotenv.2021.151104
Borchers, H. W. (2021). Cran. Available from: https://CRAN.R-project.org/package=pracma.
Braga Moruzzi, R., Galileu Speranza, L., Tomazini da Conceição, F., Teodoro de Souza Martins, S., Busquets, R., and Cintra Campos, L. (2020). Stormwater detention reservoirs: An opportunity for monitoring and a potential site to prevent the spread of urban microplastics. Water 12 (7), 1994. doi:10.3390/w12071994
Brander, S. M., Renick, V. C., Foley, M. M., Steele, C., Woo, M., Lusher, A., et al. (2020). Sampling and quality assurance and quality control: A guide for scientists investigating the occurrence of microplastics across matrices. Appl. Spectrosc. 74 (9), 1099–1125. doi:10.1177/0003702820945713
Bucci, K., Tulio, M., and Rochman, C. M. (2020). What is known and unknown about the effects of plastic pollution: A meta-analysis and systematic review. Ecol. Appl. 30 (2), e02044. doi:10.1002/eap.2044)
Bujaczek, T., Kolter, S., Locky, D., and Ross, M. S. (2021). Characterization of microplastics and anthropogenic fibers in surface waters of the North Saskatchewan River, Alberta, Canada. FACETS 6 (1), 26–43. doi:10.1139/facets-2020-0057
Cai, L., Wang, J., Peng, J., Tan, Z., Zhan, Z., Tan, X., et al. (2017). Characteristic of microplastics in the atmospheric fallout from dongguan city, China: Preliminary research and first evidence. Environ. Sci. Pollut. Res. 24 (32), 24928–24935. doi:10.1007/s11356-017-0116-x
Chamas, A., Moon, H., Zheng, J., Qiu, Y., Tabassum, T., Jang, J. H., et al. (2020). Degradation rates of plastics in the environment. ACS Sustain. Chem. Eng. 8 (9), 3494–3511. doi:10.1021/acssuschemeng.9b06635
Chen, H., Jia, Q., Sun, X., Zhou, X., Zhu, Y., Guo, Y., et al. (2022). Quantifying microplastic stocks and flows in the urban agglomeration based on the mass balance model and source-pathway-receptor framework: Revealing the role of pollution sources, weather patterns, and environmental management practices. Water Res. 224, 119045. doi:10.1016/j.watres.2022.119045
Chen, H., Jia, Q., Zhao, X., Li, L., Nie, Y., Liu, H., et al. (2020). The occurrence of microplastics in water bodies in urban agglomerations: Impacts of drainage system overflow in wet weather, catchment land-uses, and environmental management practices. Water Res. 183, 116073. doi:10.1016/j.watres.2020.116073
City of Calgary (2021). Historical rainfall data. Available from: https://data.calgary.ca/Environment/Historical-Rainfall/d9kv-swk3 (Accessed March 16, 2022).
City of Calgary (2018). Municipal development plan/calgary transportation plan 2018 monitoring progress report. Available from: https://pub-calgary.escribemeetings.com/filestream.ashx?DocumentId=56271 (Accessed May 3, 2021).
Clark, S. E., Siu, C. Y. S., Pitt, R., Roenning, C. D., and Treese, D. P. (2009). Peristaltic pump autosamplers for solids measurement in stormwater runoff. Water Environ. Res. 81 (2), 192–200. doi:10.2175/106143008X325737
Cole, M., Lindeque, P., Fileman, E., Halsband, C., Goodhead, R., Moger, J., et al. (2013). Microplastic ingestion by zooplankton. Environ. Sci. Technol. 47 (12), 6646–6655. doi:10.1021/es400663f
Covernton, G. A., Pearce, C. M., Gurney-Smith, H. J., Chastain, S. G., Ross, P. S., Dower, J. F., et al. (2019). Size and shape matter: A preliminary analysis of microplastic sampling technique in seawater studies with implications for ecological risk assessment. Sci. Total Environ. 667, 124–132. doi:10.1016/j.scitotenv.2019.02.346
de Souza Machado, A. A., Kloas, W., Zarfl, C., Hempel, S., and Rillig, M. C. (2018). Microplastics as an emerging threat to terrestrial ecosystems. Glob. Change Biol. 24 (4), 1405–1416. doi:10.1111/gcb.14020
Denney, B., Buckeridge, C., and Duvvuri, S. (2015). Simple, automatic noncompartmental analysis: The PKNCA R package. J. Pharmacokinet. Pharmacodynamics 42 (1), 11–107. doi:10.1007/s10928-015-9432-2
Dris, R., Gasperi, J., Saad, M., cile Mirande, C., and Tassin, B. (2015b). Synthetic fibers in atmospheric fallout: A source of microplastics in the environment? Mar. Pollut. Bull. 104 (1–2), 290–293. doi:10.1016/j.marpolbul.2016.01.006
Dris, R., Gasperi, J., and Tassin, B. (2018). “Sources and fate of microplastics in urban areas: A focus on paris megacity,” in Freshwater microplastics. V. 58. Editors M. Wagner, and S. Lambert (Cham: Springer International Publishing). doi:10.1007/978-3-319-61615-5_4
Dris, R., Imhof, H., Sanchez, W., Gasperi, J., Galgani, F., Tassin, B., et al. (2015a). Beyond the ocean: Contamination of freshwater ecosystems with (micro-) plastic particles. Environ. Chem. 12 (5), 539–550. doi:10.1071/EN14172
Environment Canada (2022). Historical climate data. Available from: https://climate.weather.gc.ca/historical_data/search_historic_data_e.html (Accessed May 1, 2021).
Eriksen, M., Lebreton, L. C. M., Carson, H. S., Thiel, M., Moore, C. J., Borerro, J. C., et al. (2014). Plastic pollution in the world’s oceans: More than 5 trillion plastic pieces weighing over 250, 000 tons afloat at sea. PLoSONE 9 (12), e111913. doi:10.1371/journal.pone.0111913
Estahbanati, S., and Fahrenfeld, N. L. (2016). Influence of wastewater treatment plant discharges on microplastic concentrations in surface water. Chemosphere 162, 277–284. doi:10.1016/j.chemosphere.2016.07.083
Forrest, S. A., McMahon, D., Adams, W. A., and Vermaire, J. C. (2022). Change in microplastic concentration during various temporal events downstream of a combined sewage overflow and in an urban stormwater creek. Front. Water 4, 958130. doi:10.3389/frwa.2022.958130
Geyer, R., Jambeck, J. R., and Law, K. L. (2017). Production, use, and fate of all plastics ever made. Sci. Adv. 3 (7), e1700782. doi:10.1126/sciadv.1700782
Gies, E. A., LeNoble, J. L., Noël, M., Etemadifar, A., Bishay, F., Hall, E. R., et al. (2018). Retention of microplastics in a major secondary wastewater treatment plant in Vancouver, Canada. Mar. Pollut. Bull. 133, 553–561. doi:10.1016/j.marpolbul.2018.06.006
Gilbreath, A., McKee, L., Shimabuku, I., Lin, D., Werbowski, L. M., Zhu, X., et al. (2019). Multiyear water quality performance and mass accumulation of PCBs, mercury, methylmercury, copper, and microplastics in a bioretention rain garden. J. Sustain. Water Built Environ. 5 (4), 04019004. doi:10.1061/JSWBAY.0000883
Government of Alberta (2021). Public health guidelines water reuse stormwater use. Available from: https://open.alberta.ca/dataset/6a57d29c-d437-4dd9-94e3-d96bedc01bb4/resource/d533afcb-2933-43da-9199-eea030148c00/download/health-public-health-guidelines-water-reuse-stormwater-use-2021.pdf (Accessed March 29, 2021).
Grbić, J., Helm, P., Athey, S., and Rochman, C. M. (2020). Microplastics entering northwestern Lake Ontario are diverse and linked to urban sources. Water Res. 174, 115623. doi:10.1016/j.watres.2020.115623
Hartmann, N. B., Hüffer, T., Thompson, R. C., Hassellöv, M., Verschoor, A., Daugaard, A. E., et al. (2019). Are we speaking the same language? Recommendations for a definition and categorization framework for plastic debris. Environ. Sci. Technol. 53 (3), 1039–1047. doi:10.1021/acs.est.8b05297
Hidalgo-Ruz, V., Gutow, L., Thompson, R. C., and Thiel, M. (2012). Microplastics in the marine environment: A review of the methods used for identification and quantification. Environ. Sci. Technol. 46 (6), 3060–3075. doi:10.1021/es2031505
Hitchcock, J. N. (2020). Storm events as key moments of microplastic contamination in aquatic ecosystems. Sci. Total Environ. 734, 139436. doi:10.1016/j.scitotenv.2020.139436
Hoellein, T. J., Shogren, A. J., Tank, J. L., Risteca, P., and Kelly, J. J. (2019). Microplastic deposition velocity in streams follows patterns for naturally occurring allochthonous particles. Sci. Rep. 9 (1), 3740. doi:10.1038/s41598-019-40126-3
Horton, A. A., Svendsen, C., Williams, R. J., Spurgeon, D. J., and Lahive, E. (2017b). Large microplastic particles in sediments of tributaries of the River Thames, UK – abundance, sources and methods for effective quantification. Mar. Pollut. Bull. 114 (1), 218–226. doi:10.1016/j.marpolbul.2016.09.004
Horton, A. A., Walton, A., Spurgeon, D. J., Lahive, E., and Svendsen, C. (2017a). Microplastics in freshwater and terrestrial environments: Evaluating the current understanding to identify the knowledge gaps and future research priorities. Sci. Total Environ. 586, 127–141. doi:10.1016/j.scitotenv.2017.01.190
Hüffer, T., Wagner, S., Reemtsma, T., and Hofmann, T. (2019). Sorption of organic substances to tire wear materials: Similarities and differences with other types of microplastic. TrAC Trends Anal. Chem. 113, 392–401. doi:10.1016/j.trac.2018.11.029
Hurley, R., Woodward, J., and Rothwell, J. J. (2018). Microplastic contamination of river beds significantly reduced by catchment-wide flooding. Nat. Geosci. 11 (4), 251–257. doi:10.1038/s41561-018-0080-1
Järlskog, I., Strömvall, A-M., Magnusson, K., Gustafsson, M., Polukarova, M., Galfi, H., et al. (2020). Occurrence of tire and bitumen wear microplastics on urban streets and in sweepsand and washwater. Sci. Total Environ. 729, 138950. doi:10.1016/j.scitotenv.2020.138950
Kapp, K. J., and Miller, R. Z. (2020). Electric clothes dryers: An underestimated source of microfiber pollution. PLOS ONE 15 (10), e0239165. doi:10.1371/journal.pone.0239165
Kreider, M. L., Panko, J. M., McAtee, B. L., Sweet, L. I., and Finley, B. L. (2010). Physical and chemical characterization of tire-related particles: Comparison of particles generated using different methodologies. Sci. Total Environ. 408 (3), 652–659. doi:10.1016/j.scitotenv.2009.10.016
Liu, F., Vianello, A., and Vollertsen, J. (2019). Retention of microplastics in sediments of urban and highway stormwater retention ponds. Environ. Pollut. 255, 113335. doi:10.1016/j.envpol.2019.113335
Lusher, A. L., Bråte, I. L. N., Munno, K., Hurley, R. R., and Welden, N. A. (2020). Is it or isn’t it: The importance of visual classification in microplastic characterization. Appl. Spectrosc. 74 (9), 1139–1153. doi:10.1177/0003702820930733
Mason, S. A., Garneau, D., Sutton, R., Chu, Y., Ehmann, K., Barnes, J., et al. (2016). Microplastic pollution is widely detected in US municipal wastewater treatment plant effluent. Environ. Pollut. 218, 1045–1054. doi:10.1016/j.envpol.2016.08.056
Masura, J., Baker, J., Foster, G., and Arthur, C. (2015). Laboratory methods for the analysis of microplastics in the marine environment. Available from: https://marinedebris.noaa.gov/technical-memorandum/laboratory-methods-analysis-microplastics-marine-environment.
Miller, R. Z., Watts, A. J. R., Winslow, B. O., Galloway, T. S., and Barrows, A. P. W. (2017). Mountains to the sea: River study of plastic and non-plastic microfiber pollution in the northeast USA. Mar. Pollut. Bull. 124 (1), 245–251. doi:10.1016/j.marpolbul.2017.07.028
Munno, K., De Frond, H., O’Donnell, B., and Rochman, C. M. (2020). Increasing the accessibility for characterizing microplastics: Introducing New application-based and spectral libraries of plastic particles (SLoPP and SLoPP-E). Anal. Chem. 92 (3), 2443–2451. doi:10.1021/acs.analchem.9b03626
Obbard, R. W. (2018). Microplastics in Polar Regions: The role of long range transport. Curr. Opin. Environ. Sci. Health 1, 24–29. doi:10.1016/j.coesh.2017.10.004
Ockelford, A., Cundy, A., and Ebdon, J. E. (2020). Storm response of fluvial sedimentary microplastics. Sci. Rep. 10 (1), 1865. doi:10.1038/s41598-020-58765-2
Olesen, K. B., Stephansen, D. A., van Alst, N., and Vollertsen, J. (2019). Microplastics in a stormwater pond. Water 11 (7), 1466. doi:10.3390/w11071466
Österlund, H., Blecken, G., Lange, K., Marsalek, J., Gopinath, K., and Viklander, M. (2023). Microplastics in urban catchments: Review of sources, pathways, and entry into stormwater. Sci. Total Environ. 858, 159781. doi:10.1016/j.scitotenv.2022.159781
Peters, C. A., and Bratton, S. P. (2016). Urbanization is a major influence on microplastic ingestion by sunfish in the Brazos River Basin, Central Texas, USA. Environ. Pollut. 210, 380–387. doi:10.1016/j.envpol.2016.01.018
Piñon-Colin, T. D. J., Rodriguez-Jimenez, R., Rogel-Hernandez, E., Alvarez-Andrade, A., and Wakida, F. T. (2020). Microplastics in stormwater runoff in a semiarid region, Tijuana, Mexico. Sci. Total Environ. 704, 135411. doi:10.1016/j.scitotenv.2019.135411
R Core Team (2020). The R project for statistical computing. Available from: https://www.R-project.org/.
Rochman, C. M., Brookson, C., Bikker, J., Djuric, N., Earn, A., Bucci, K., et al. (2019). Rethinking microplastics as a diverse contaminant suite. Environ. Toxicol. Chem. 38 (4), 703–711. doi:10.1002/etc.4371
Sang, W., Chen, Z., Mei, L., Hao, S., Zhan, C., Zhang, W., et al. (2021). The abundance and characteristics of microplastics in rainwater pipelines in Wuhan, China. Sci. Total Environ. 755, 142606. doi:10.1016/j.scitotenv.2020.142606
Shen, M., Li, Y., Song, B., Zhou, C., Gong, J., and Zeng, G. (2021). Smoked cigarette butts: Unignorable source for environmental microplastic fibers. Sci. Total Environ. 791, 148384. doi:10.1016/j.scitotenv.2021.148384
Siegfried, M., Koelmans, A. A., Besseling, E., and Kroeze, C. (2017). Export of microplastics from land to sea. A modelling approach. Water Res. 127, 249–257. doi:10.1016/j.watres.2017.10.011
Smyth, K., Drake, J., Li, Y., Rochman, C., Van Seters, T., and Passeport, E. (2021). Bioretention cells remove microplastics from urban stormwater. Water Res. 191, 116785. doi:10.1016/j.watres.2020.116785
Su, L., Nan, B., Craig, N. J., and Pettigrove, V. (2020). Temporal and spatial variations of microplastics in roadside dust from rural and urban Victoria, Australia: Implications for diffuse pollution. Chemosphere 252, 126567. doi:10.1016/j.chemosphere.2020.126567
Sugiura, M., Takada, H., Takada, N., Mizukawa, K., Tsuyuki, S., and Furumai, H. (2021). Microplastics in urban wastewater and estuarine water: Importance of street runoff. Environ. Monit. Contam. Res. 1 (0), 54–65. doi:10.5985/emcr.20200006
Sun, J., Dai, X., Wang, Q., van Loosdrecht, M. C. M., and Ni, B-J. (2019). Microplastics in wastewater treatment plants: Detection, occurrence and removal. Water Res. 152, 21–37. doi:10.1016/j.watres.2018.12.050
Sun, J., Peng, Z., Zhu, Z-R., Fu, W., Dai, X., and Ni, B-J. (2022). The atmospheric microplastics deposition contributes to microplastic pollution in urban waters. Water Res. 225, 119116. doi:10.1016/j.watres.2022.119116
Sun, X., Jia, Q., Ye, J., Zhu, Y., Song, Z., Guo, Y., et al. (2023). Real-time variabilities in microplastic abundance and characteristics of urban surface runoff and sewer overflow in wet weather as impacted by land use and storm factors. Sci. Total Environ. 859, 160148. doi:10.1016/j.scitotenv.2022.160148
Sutton, R., Franz, A., Gilbreath, A., Lin, D., Miller, L., Sedlak, M., et al. (2019). “Understanding microplastic levels, pathways, and transport in the san Francisco bay region,” in SFEI contribution No. 950 (Richmond, CA: San Francisco Estuary Institute). Available from: https://www.sfei.org/documents/understanding-microplastics (Accessed May 3, 2021).
Sutton, R., Mason, S. A., Stanek, S. K., Willis-Norton, E., Wren, I. F., and Box, C. (2016). Microplastic contamination in the san Francisco bay, California, USA. Mar. Pollut. Bull. 109 (1), 230–235. doi:10.1016/j.marpolbul.2016.05.077
Treilles, R., Gasperi, J., Gallard, A., Saad, M., Dris, R., Partibane, C., et al. (2021). Microplastics and microfibers in urban runoff from a suburban catchment of Greater Paris. Environ. Pollut. 287, 117352. doi:10.1016/j.envpol.2021.117352
Van Cauwenberghe, L., Vanreusel, A., Mees, J., and Janssen, C. R. (2013). Microplastic pollution in deep-sea sediments. Environ. Pollut. 182, 495–499. doi:10.1016/j.envpol.2013.08.013
Vermaire, J. C., Pomeroy, C., Herczegh, S. M., Haggart, O., and Murphy, M. (2017). Microplastic abundance and distribution in the open water and sediment of the Ottawa River, Canada, and its tributaries. FACETS 2 (1), 301–314. doi:10.1139/facets-2016-0070
Wagner, S., Hüffer, T., Klöckner, P., Wehrhahn, M., Hofmann, T., and Reemtsma, T. (2018). Tire wear particles in the aquatic environment - a review on generation, analysis, occurrence, fate and effects. Water Res. 139, 83–100. doi:10.1016/j.watres.2018.03.051
Waldschläger, K., and Schüttrumpf, H. (2019). Effects of particle properties on the settling and rise velocities of microplastics in freshwater under laboratory conditions. Environ. Sci. Technol. 53 (4), 1958–1966. doi:10.1021/acs.est.8b06794
Wang, C., O’Connor, D., Wang, L., Wu, W-M., Luo, J., and Hou, D. (2022). Microplastics in urban runoff: Global occurrence and fate. Water Res. 225, 119129. doi:10.1016/j.watres.2022.119129
Wei, Y., Dou, P., Xu, D., Zhang, Y., and Gao, B. (2022). Microplastic reorganization in urban river before and after rainfall. Environ. Pollut. 314, 120326. doi:10.1016/j.envpol.2022.120326
Werbowski, L. M., Gilbreath, A. N., Munno, K., Zhu, X., Grbic, J., Wu, T., et al. (2021). Urban stormwater runoff: A major pathway for anthropogenic particles, black rubbery fragments, and other types of microplastics to urban receiving waters. ACS ES&T Water 1 (6), 1420–1428. doi:10.1021/acsestwater.1c00017
Woodall, L. C., Sanchez-Vidal, A., Canals, M., Paterson, G. L. J., Coppock, R., Sleight, V., et al. (2014). The deep sea is a major sink for microplastic debris. R. Soc. Open Sci. 1 (4), 140317. doi:10.1098/rsos.140317
Wright, S. L., Thompson, R. C., and Galloway, T. S. (2013). The physical impacts of microplastics on marine organisms: A review. Environ. Pollut. 178, 483–492. doi:10.1016/j.envpol.2013.02.031
Wright, S. L., Ulke, J., Font, A., Chan, K. L. A., and Kelly, F. J. (2020). Atmospheric microplastic deposition in an urban environment and an evaluation of transport. Environ. Int. 136, 105411. doi:10.1016/j.envint.2019.105411
Yonkos, L. T., Friedel, E. A., Perez-Reyes, A. C., Ghosal, S., and Arthur, C. D. (2014). Microplastics in Four Estuarine Rivers in the Chesapeake Bay, U.S.A. U.S.A. Environ. Sci. Technol. 48 (24), 14195–14202. doi:10.1021/es5036317
Keywords: urban microplastics, stormwater runoff, tire wear particles (TWPs), microplastic loadings, microplastic sources, internal standards, recoveries
Citation: Ross MS, Loutan A, Groeneveld T, Molenaar D, Kroetch K, Bujaczek T, Kolter S, Moon S, Huynh A, Khayam R, Franczak BC, Camm E, Arnold VI and Ruecker NJ (2023) Estimated discharge of microplastics via urban stormwater during individual rain events. Front. Environ. Sci. 11:1090267. doi: 10.3389/fenvs.2023.1090267
Received: 05 November 2022; Accepted: 09 January 2023;
Published: 20 January 2023.
Edited by:
Rajendra Prasad Singh, Southeast University, ChinaCopyright © 2023 Ross, Loutan, Groeneveld, Molenaar, Kroetch, Bujaczek, Kolter, Moon, Huynh, Khayam, Franczak, Camm, Arnold and Ruecker. This is an open-access article distributed under the terms of the Creative Commons Attribution License (CC BY). The use, distribution or reproduction in other forums is permitted, provided the original author(s) and the copyright owner(s) are credited and that the original publication in this journal is cited, in accordance with accepted academic practice. No use, distribution or reproduction is permitted which does not comply with these terms.
*Correspondence: Matthew S. Ross, rossm48@macewan.ca
†Present address: Kimberly Kroetch, Department of Statistics and Actuarial Science, Simon Fraser University, Burnaby, BC, Canada