The influence of digital development on China’s carbon emission efficiency: In the view of economic and environmental balance
 Yuan Ding1*
  Yalan Yang2
- 1Hult International Business School, Cambridge, MA, United States
- 2Longe School of Business, Lasell University, Newton, MA, United States
Introduction: With the worsening global climate problem, carbon peak and carbon neutrality have become crucial objects to realize sustainable development. Regarded as the engine of economic development in the new era, it is worth exploring whether digitalization could contribute to carbon goals. Meanwhile, carbon reduction should not be advocated at the cost of economic recession and contains the risk of reversal when the economy renews in growth.
Material and Methods: This paper evaluates carbon efficiency using the total factor non-radial directional distance function, which reflects the economic performance and environmental performance of 246 China’s prefecture-level cities during 2011–2019. Fixed effect and mediation effect models are used to explore the non-linear relationship and transmission channels between digital development and carbon efficiency.
Results: It is found that: 1) digital development would hinder carbon efficiency first and then promote it after reaching a certain level; 2) digital development could indirectly affect carbon efficiency through industrial agglomeration, industrial structure upgrading, and industrial electricity productivity in non-linear ways. 3) Heterogeneity exists in the relationship between digital development and carbon efficiency due to different regions and development types.
Discussion: Due to digital development itself having high carbon-negative externalities at the initial stage, its impact on carbon efficiency is complex and non-liner even when decomposing through multiple channels. A well-structured development strategy is needed during the digitalization process in order to prompt carbon efficiency.
1 Introduction
Global warming, caused by the emission of massive amounts of greenhouse gas such as carbon dioxide, is a huge challenge for human beings. It has brought a series of problems including accelerated melting of global glaciers, rising sea levels, and polarization of droughts and floods. Responding to the increasingly serious global climate problem through the promotion of low-carbon development has become a consensus within all sectors (Zhang and Feng, 2021). As the world largest manufacturing and export country, China also emits the most carbon dioxide, more than that of all developed countries taken together (Li Z. Z. et al., 2021; Liu et al., 2022). To fulfill its responsibility as a major power in the fight against climate change, China has committed to peak its carbon emission around 2030 and reduce its carbon intensity by more than 60% compared to 2005 (Liu et al., 2017; Zhao et al., 2018). A shift is also taking place in China’s economic development strategy from the pursuit of high growth rates to the pursuit of high growth quality (Li and Liu, 2022). This is not to say that China is slowing the pace of economic development to meet its environmental protection goals. In fact, there is no contradiction between environmental protection and economic growth, nor between carbon reduction and economic growth, as achieving long-term sustainable development requires more efficient production processes that can break environmental constraints (Chen Z. et al., 2018; Liu and Zhang, 2022). Digital technologies and industries have made major contributions along the path to achieving these goals. In this new era, they are seen as essential infrastructures for the new generation, as their impact permeates every corner of modern life. According to the White Paper on China’s Digital Economy (2021), the total scale of the digital-related economy has reached around one-third of the total GDP in China. It is changing the conduction of all economic activities fundamentally under the background of rising technologies such as artificial intelligence and robotics (Ma et al., 2022). The rapid development of the digital economy presents opportunities to improve lifestyles, production, and governance, thus providing the ground of the growth for new businesses, industries, and the methods to achieve low-carbon development. This has attracted many scholars to explore the following questions: 1) how exactly does digital development affect carbon emissions? 2) Can digital development reach a proper balance of economic growth and environmental protection? 3) Is digital development contributing to carbon efficiency? 4) What are the internal mechanisms by which digital development affects carbon efficiency? In the current situation where the traditional economic growth model has shown weakness, and environmental problems are becoming more and more severe, it is of great practical and theoretical significance to clarify these questions.
Existing studies have mainly focused on exploring the nexus between digital development and the amount of carbon emissions at the provincial level in China. The absence of measuring economic performance and economic efficiency may lead to some distorted results. For example, Wang et al. (2022a) stated that digital economy could mitigate carbon emission by promoting production efficiency. Xu et al. (2022) emphasized the impact of digitalization on reducing carbon emission through better resources allocation. At the same time, Dong et al. (2022) and Tchamyou et al. (2019) found that digital development could significantly increase economic growth and financial development by boosting economic scale and production, which can consequently contribute to more energy consumption and increased carbon emissions. Wang and Wang (2022) also called for caution against the current negative externalities of the digital economy itself with high carbon emissions. As can be seen, these opposing arguments overlap and contradict each other, as the transmission channels supported in both arguments, such as production efficiency and economic growth, also tend to reinforce each other. To avoid contradictions, it makes more sense to discuss the impact from digital development by placing economic performance and environmental performance in the same framework. Guan et al. (2018), who found that China experienced a structural decline in CO2 emission between 2013 and 2016, suggested the importance of identifying which factors contribute to higher carbon efficiency; this is because if the decline in carbon emission is the result of a decline in economic activity and development, then when the economy grows again, pollution may increase again. However, few studies have considered carbon efficiency, especially at the prefectural city level. Zhang W. et al. (2022) tried to explore the nexus between the digital economy and carbon emission performance, but the performance measurements were more focused on the environmental aspect, and the impact mechanism needs further study.
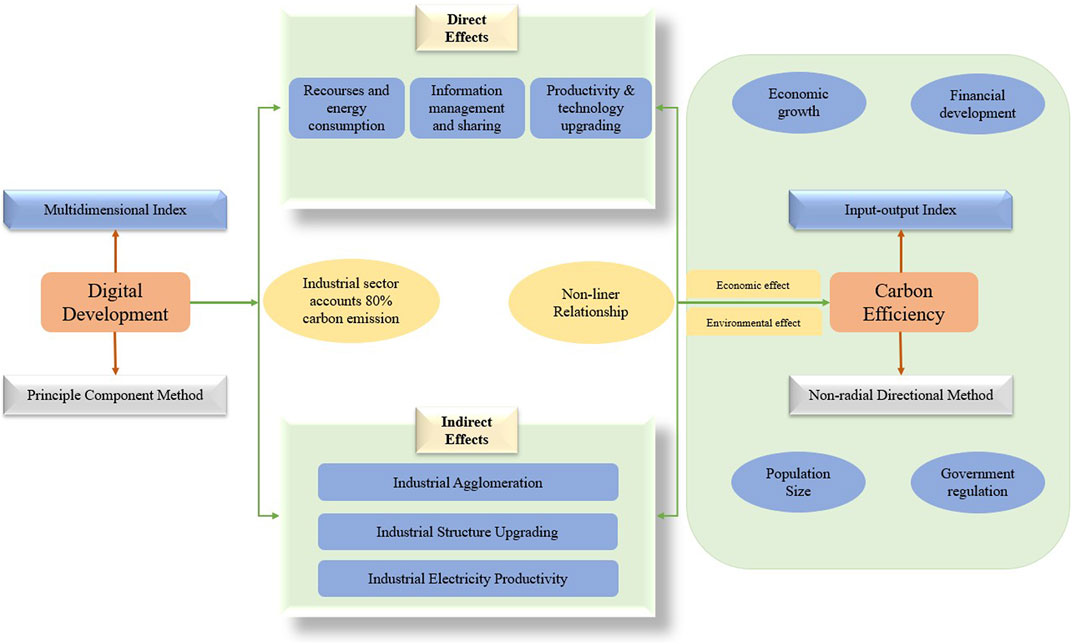
This paper uses the total factor non-radial directional distance function (TFNDDF) proposed by Zhang et al. (2014) to evaluate the carbon emission efficiency as the unified efficiency accounting method for evaluating the economic and environmental performance of 246 Chinese prefecture-level cities. Mediation effect models are built using the efficiency index to explore the possible impact mechanisms from digital development to carbon efficiency. Three paths, namely, industrial agglomeration (INSA), industrial structure upgrading (INSU), and industrial electricity productivity (IEP) are explored and tested in this paper. The focus is on the industrial sector because more than 80% of CO2 emissions are contributed by the industrial sector, with 39% of those emissions coming from electricity generation (Shan et al., 2017).
Many studies have benchmarked carbon emission efficiency based on production efficiency. Widely used measurements include the total factor efficiency that takes capital, labor, and energy as the input factors. The stochastic frontier method (SFA) and data envelopment method (DEA) are the most popular parametric and non-parametric methods. While SFA is often criticized due to difficulties in calculation and the reflection of multi-output, DEA is also questioned because it requires the same proportional and radial change on input and output factors (Zhang et al., 2014; Wang and Du, 2019; Luo et al., 2022). To reflect real-world carbon efficiency, scholars have proposed improved approaches to deal with undesirable output and flexible changes, such as the super efficiency DEA model (Tang et al., 2014), the SBM-undesirable output (Sun et al., 2016; Deng and Zhang, 2021; Zhang, 2022), and the global supper efficiency EBM model (Zhang W. et al., 2022). However, few have paid attention on the use of the non-radial directional distance function (NDDF). Compared to the DEA model, NDDF allows factors to change in several different directions and with different proportions during the measurement (Zhou et al., 2012). This enables NDDF to measure the carbon efficiency in terms of increasing GDP output while reducing carbon dioxide emissions and also avoid the problem of overestimating the efficiency when there are slacks. In addition, using the total factor NDDF model proposed by Zhang et al. (2014) makes it possible for this paper to evaluate carbon efficiency containing both environmental and economic performance factors by setting different weights for all factors involved. This contributes to more accurate and realistic measurement for the unified efficiency used in this paper.
When selecting input factor data, scholars have mainly used the perpetual inventory method to calculate capital input. However, because several key variables such as depreciation rate are not yet agreed on, and this method is mainly used at the province level in previous studies, the results may vary greatly when replicating the same process to estimate capital input at prefecture-level cities (Sun et al., 2016). This paper selects the annual fixed investments, which could be directly referred from the Statistical Yearbook, as the capital input and deflates it by the annual price index available at the province level using 2011 as the baseline year.
The major contributions of this paper are as follows: 1) this paper explores the impact of digital development in a more comprehensive way by considering carbon efficiency as a dependent variable. By doing so, more weight is given to economic performance than in previous studies. This avoids compensating for samples that achieve emission reduction at the cost of economic decline. The results of the analysis can better reveal the effectiveness of digital economy on carbon reduction from a sustainable growth perspective. 2) With reference to the total factor NDDF method, a unified production efficiency for prefecture-level municipalities is constructed, allowing researchers to set different weight vectors and directional vectors based on different policy goals. As the method is mainly used to evaluate the performance of a single industry such as power generation, there is little practice in using the method to evaluate the overall efficiency of society. 3) This paper not only focuses on the non-linear relationship and curvilinear effects between digital development and carbon efficiency but also on the transmission channels and conducts a multi-dimensional analysis of the industrial sector. 4) A feasible and robust method is explored and used to test the validation of non-linear mediation effect model. The findings can further clarify the impact of the digital development on carbon emission efficiency and provide suggestions and theoretical basis for structural policy design, enhance flexibility in policy implementation, and refine the standards and scope in the context of a quality development economy.
The rest of this paper is organized as follows: Section 2 presents the literature review and research hypotheses. Section 3 introduces measurement models and empirical models. Section 4 shows the empirical results and discussions. Section 5 concludes the paper and demonstrates specific policy recommendations.
2 Literature review and research hypothesis
2.1 The nexus between digital development and carbon efficiency
The debate on whether digital development exerts a positive or negative impact on carbon emissions continues. Wang et al. (2022b) investigated the effect of digital economy and its sub-indicators on carbon emissions and found a significant negative correlation when scale effects, structural effects, and technology effects were taken into account. Zhang et al. (2022) and Lin and Zhou (2021) pointed out the emerging improvements in the effectiveness of energy systems brought about by digital technologies, such as accurate measurement and real-time detection of power supply and demand, and more efficient information transmission and analysis. They emphasized that the positive effects that the digital economy posed on energy structure and utilization could further exert a mitigation effect on carbon emissions. Yang et al. (2021a) discussed the effectiveness that internet development contributes to haze governance based on provincial panel data in China from 2006 to 2017. They found that by improving environmental monitoring, intellectual management, and the availability of wider public participation in supervision, the development of internet technology could effectively curb the worsening of haze pollution in China. Wu et al. (2021) constructed a comprehensive internet development index and explored its impact on green total factor energy efficiency (GTFEE) that considered a series of industrial and domestic waste as undesirable output. The result showed that GTFEE has a significant positive space spillover effect, and internet development could directly and indirectly improve GTFEE. Deng and Zhang (2021) examined digital finance to demonstrate its significant reduction in carbon intensity and improvement in carbon efficiency and supplemented that the breadth of coverage, depth of use, and increased digitization of digital finance improve carbon emission performance. Other scholars have explored the mediation role of green innovation and technology progress and found that digitalization could provide more advanced tools for R&D, allocate resources more effectively, and shorten the process of practical application of technology (Wang et al., 2022b; Guo et al., 2022; Ma et al., 2022). Researchers have also demonstrated that improving and maintaining digitalization can consume massive amount of electricity and increase emissions (Malmdin and Lundén, 2018; Avom et al., 2020). Evidence presented by Lee and Brahmasrene (2014), Salahuddin and Alam (2015), and Asongu (2018) suggested that the adoption of ICT and the construction of digital facilities require large scale of resources input and may cause more pollution. Ding et al. (2022) and Dong et al. (2022) also found that low level of digital development is not beneficial for energy efficiency improvement and can result in more carbon emissions.
As can be seen from the aforementioned research, the carbon mitigation impact of the digital economy are mainly based on a certain level of scale and development, but a large number of resources and energy must be invested to reach such a scale and development level. Along the path of building a mature digital society, moving to a digital economy could bring only limited improvement to environmental performance, especially in places where digitalization is still at an initial stage (Danish et al., 2018; Ding et al., 2022; Yin et al., 2022). Therefore, the development of the digital economy will first have a negative impact due to its high cost and emissions with low output. Then, it will gradually turn positive due to efficiency gains from scale and structural effects. To consider the question from a non-linear perspective, Li and Wang (2022) and Miao et al. (2022) advocated an inverted U-shape relationship between digital development and carbon emissions. Danish et al. (2019) also demonstrated that the influence of ICT industry on environmental quality depends on the country’s development level. Based on the aforementioned literature and analysis, the following hypothesis is proposed:
Hypothesis 1:. Digital development has a U-shaped non-linear relationship on carbon efficiency, exerting a negative effect in the initial stage and turning positive as the scale and effectiveness increases.
2.2 Mediating effect through industrial agglomeration
In recent years, the Chinese government has emphasized the development strategy of industrial agglomeration to achieve high-quality economic growth. Although its impact on economic performance has been well explored, its impact on environmental performance remains contradictory (Chen Z. et al., 2018). Criticizers mainly claim that industrial agglomeration leads to serious environmental pollution due to the increasing enterprise scale and use of fossil energy (Virkanen, 1998; Verhoef and Nijkamp, 2002; Duc et al., 2007). In contrast, Chen and Hu (2008) indicted that industrial agglomeration can improve the technology progress of a region, thus promoting its environmental performance. Zeng and Zhao (2009) proved that the accumulation of industry could help to relieve the problem of “Pollution Paradise.” From an environmental efficiency perspective, Chen Z. et al. (2018) demonstrated that INSA could reduce carbon intensity through a scale economy and technology spillover. Li and Liu (2022) found an inverted U-shaped relationship between INSA and carbon emissions and a positive mediating effect through technological progress.
Many economic theories and practices prove that factors of production inevitably tend to concentrate in particular regions with higher marginal output, as rational people always tend to maximize expected returns. To make such decisions, people need to access enough information. The more complete the information, the faster the decision is made. Therefore, the level and the speed of the agglomeration are largely affected by the level of information efficiency and symmetry in a fair market. The efficient market hypothesis presented by Fama (1970) proposed a framework for how information affects the efficiency and timeliness of decisions. In this new era, digital technologies improve information efficiency to an unprecedented high level. As a result, the development of the digital economy is thought to have a positive effect on industrial agglomeration. However, when considered from a longer-term basis, the distinction may not be as clear. While agglomeration can lead to higher marginal returns, it is limited by the local resources such as land, electricity supply, and environmental tolerance. The process of agglomeration cannot last forever. Just like the process of manufacturing outflows from developed countries in recent years, within China, production lines and factories will transfer to other locations where resources are cheaper. In those regions with higher levels of digital development, where high-value-added industries are densely distributed, many companies and industries are squeezed out due to unaffordable costs (Fang et al., 2020; Li X. et al., 2021; Wang et al., 2022c). Therefore, digital development in places where the digitalization level is already high may accelerate the process of company and industry outflow, thus decreasing the degree of industrial agglomeration. This leads to the following hypothesis:
Hypothesis 2:. Digital development will promote industrial agglomeration in the early stage and then turn to reduce the agglomeration level, with a non-linear impact on carbon efficiency through INSA.
2.3 Mediating effect through industrial structure upgrading
When exploring the impact of the digital economy on the environment, the upgrading of industrial structure is a frequently discussed intermediary channel. First, the development of the digital economy brings about more efficient information communications, R&D activities, and technology spillovers (Ren et al., 2021). This not only helps traditional companies to optimize the production process, operating patterns and business models (Zhou et al., 2022) but also encourages the emergence of new industries by expanding new markets and demands (Xue et al., 2022). Second, as discussed in the introduction, most of the carbon emission comes from industrial production activities. By providing an unbounded virtual environment, digital development significantly reduces the cost of searching for and integrating information and resources (Ren et al., 2021). More resources will flow to technology-intensive industries with higher marginal returns and lower environmental pollution. In this process, human capital and technological factors rather than natural resources will contribute to more output. However, breaking down the information barriers will increase the level of specialization and division of labor, thus limiting the structural change in single-industry cities. At the same time, resources will transfer from less developed to more developed regions. Consequently, regional differences are widened, and the lack of penetration of digital technology in underdeveloped regions may hinder the process of INSU due to the outflow of resources (Duan and Shao, 2020). This gives rise to the following hypothesis:
Hypothesis 3:. A higher level of INSU would result in higher carbon efficiency. However, INSU is hindered at the low level of digital development and turns to positive growth with an increasing level of digital development.
2.4 Mediating effect through industrial electricity productivity
Under this topic, many scholars have discussed the mediating role of energy intensity or energy productivity. However, few studies have explored the impact in terms of the efficiency of electricity usage. In recent years, electricity generation has accounted for around one-third of total CO2 emissions globally (IEA, 2019). At the same time, the growth of the digital economy is considered to be highly power-hungry and is predicted to account for half of global electricity consumption by 2030 (Andrae and Edler, 2015). The construction of digital facilities such as data centers, base stations, and network equipment will significantly increase the consumption of resources and energy (Zhang L. et al., 2022). After reaching a certain scale, the technology spillover effect and innovation progress from digitalization can help to accelerate the growth of productivity. The emerging digital technologies will improve automation, connectivity, and flexibility in production (Mawson and Hughes, 2019; Borowski, 2021; Zhang L. et al., 2022), thus increasing the output per unit of electricity consumption. The integration brought about by standardized digitalization will help to realize intelligent management and real-time monitoring during the production process and energy supply and demand (Plageras et al., 2018; Zekic-Susac et al., 2021; Zhang L. et al., 2022). This organic interconnection of production, transmission, storage, and consumption makes up a smart energy system that can help to mitigate the positive effect on carbon emission brought by energy misallocation and also promote the development of clean energy, thus realizing higher production with less carbon emissions (Yang et al., 2021b). Collard et al. (2005) also found in France that while ICT capital tends to increase the intensity of electricity use in the service sector, the intensity decreases with the spread of communication equipment. The aforementioned analysis leads to the following final hypothesis:
Hypothesis 4:. Digital development initially reduces IEP, but after a certain scale is reached, productivity will increase. Industrial electricity productivity brings a positive mediating effect to carbon efficiency.
3 Data and methods
3.1 Variables and data
3.1.1 Explained variable: Carbon efficiency (ce)
Based on the total factor non-radial directional distance functions proposed by Zhang et al. (2014), the carbon efficiency was evaluated by incorporating inefficiencies for all the input and output factors. By unifying the economic and environmental efficiency,
where T is expected to satisfy two assumptions: The weak-disposability assumption in which CO2 reduction takes a proportional decline on GDP as a price, and the null-jointness assumption implying that CO2 emission is unavoidable, and the only way to eliminate CO2 emission is to stop all economic activities (Faere et al., 1989). The assumptions are expressed as follows:
i)
ii)
After identifying the production technology, the total factor NDDF can be defined as (Zhou et al., 2012):
where
Here,
3.1.2 Explanatory variables: Digital development (pdigd/edigd)
The core explanatory variable is digital development. By considering the data availability and consistency, this paper adopts indicators from five aspects: Telecom business volume per capita the average the number of internet broadband access users per 100 people in prefecture-level cities, the proportion of employees in the computer services and software industry in urban units, the number of mobile phone users per 100 people, and the digital inclusive financial index. To determine the weights, principal component analysis was adopted to construct
3.1.3 Mediating variables
To avoid the influence of the real estate sector, both employees and added value from the real estate sector were removed from the calculation of
Industrial agglomeration (insa): This paper referred to the location entropy method used by Li and Liu (2022)to calculate industrial agglomeration. It is defined as the share of industrial employees of the total number of employees in the city divided by the share of industrial employees of the total number of employees in China. Industrial agglomeration at the city level is expressed as
where
Industrial structure upgrading (insu): Scholars have demonstrated that the impact of INSU on both economic development and carbon emissions is significant (Zhang W. et al., 2022). The industrial structure upgrading index is estimated as the ratio of the added value of the tertiary sector to the value added of the secondary sector:
where
Industrial electricity productivity (iep): Industrial electricity productivity focuses on the efficiency of utilizing electricity during the production process. It is measured as a simple ratio of regional industrial outputs divided by the electricity used in industrial production.
3.1.4 Control variables
Economic growth (eg): Economic growth is defined as the annual variation of regional GDP. This indicator has a direct impact on carbon efficiency as the energy is a crucial driving factor of economic development, and the consumption of fossil fuel energy will inevitably increase carbon emissions (Acheampong, 2018). The higher the economic growth, the more GDP is generated compared to the previous year, which will contribute to carbon efficiency if the input and undesirable output remain fixed.
Financial development (fin): Financial development is measured by the ratio of total deposits and loans of financial institutions to GDP at the end of the year. Financial development has a significant effect on carbon emission through better allocating resources and promotion of investment and construction (Tchamyou et al., 2019).
Population density (pop): Population density is adopted as the logarithm of residences per square kilometer. Researchers have revealed that the contribution of the household sector to CO2 emissions cannot be underestimated, and the population density is an appropriate measure for this sector (Xu et al., 2014).
Environment regulation (er): According to Chen Z. M. et al. (2018), environmental regulation is calculated by the frequency and proportion of environment-related terms in government work reports at the prefecture city level. Government interventions on carbon efficiency can be multi-path, and it is difficult to capture the full picture by considering only a few indicators. Therefore, by choosing the frequency of relevant terms in government reports, it is possible to show how much importance local governments attach to environmental regulation, regardless of the tools they may utilize.
Government spending (gover): Government spending is the logarithm of the expenditure within the local government’s general budget. It is a supplement of
The aforementioned data were mainly obtained from the China City Statistical Yearbook (2011–2019), the China Energy Statistical Yearbook (2011–2019), the Statistical Yearbooks of various provinces and prefecture cities (2011–2019), and the Carbon Emission Accounts and Datasets. The variables are described in detail in Table 1. In total, 1831 observations were collected. As shown in Table 1, relevant variables are all transformed into logarithmic form, and, thus, their standard deviations are relatively low. P5 and P95 represent the 5% and 95% quantiles, respectively.
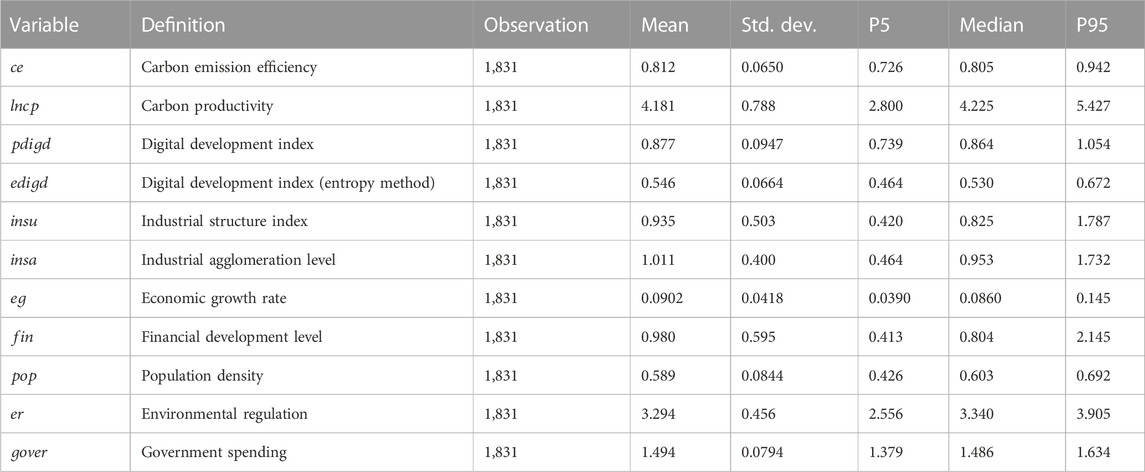
TABLE 1. Descriptive statistics.
3.2 Methods and models
3.2.1 Two-way fixed effect model
Considering the individual differences and time effects present in the panel data of carbon efficiency, a two-way fixed effects model is constructed to control for individual and time effects (Zhang W. et al., 2022). The basic model is represented as
where
3.2.2 Mediation effect model
To test the transition channel of digital development on carbon efficiency, the following model is constructed using the classical stepwise approach (Wen et al., 2014):
Eq. 6 tests the significance of the non-linear relationship between digital development and industrial upgrading, and the coefficient
4 Results and discussion
4.1 Baseline estimation result
The results of basic model and the endogenous treatment are presented in Table 2. The results show that digital development has a U-shape relationship with the local carbon efficiency of Chinese prefecture-level cities, first showing a negative impact and then turning positive after a certain point. This relationship is significant at the 99% confidence level, regardless of the presence of the control variables. The outcome is consistent with Hypothesis 1 and the finding of Li and Wang (2022), which pointed to an inverted U-shape relationship between digital economy and carbon emissions. The outcome is unlike the findings of Wang et al. (2022a), where digital economy directly and indirectly reduces carbon emission in a linear way. This is because economic performance and carbon emission performance are equally weighted when conducting the evaluation of carbon efficiency in this paper. The positive influence of digital development on the environment is diminished by any setbacks in the economic sector. The construction costs and energy consumption in the early stages of development and the carbon emissions generated by digital development are more significant than the effects of digital development in improving environmental conditions (Miao, et al., 2022). After reaching a certain level of scale and development, the increasing efficiency of digital development will amplify its positive impact in promoting production upgrading, providing more accurate and timely information on energy generation and usage, and empowering enterprises’ emission control and social governance on pollution. Therefore, after crossing the inflection point (0.89 of
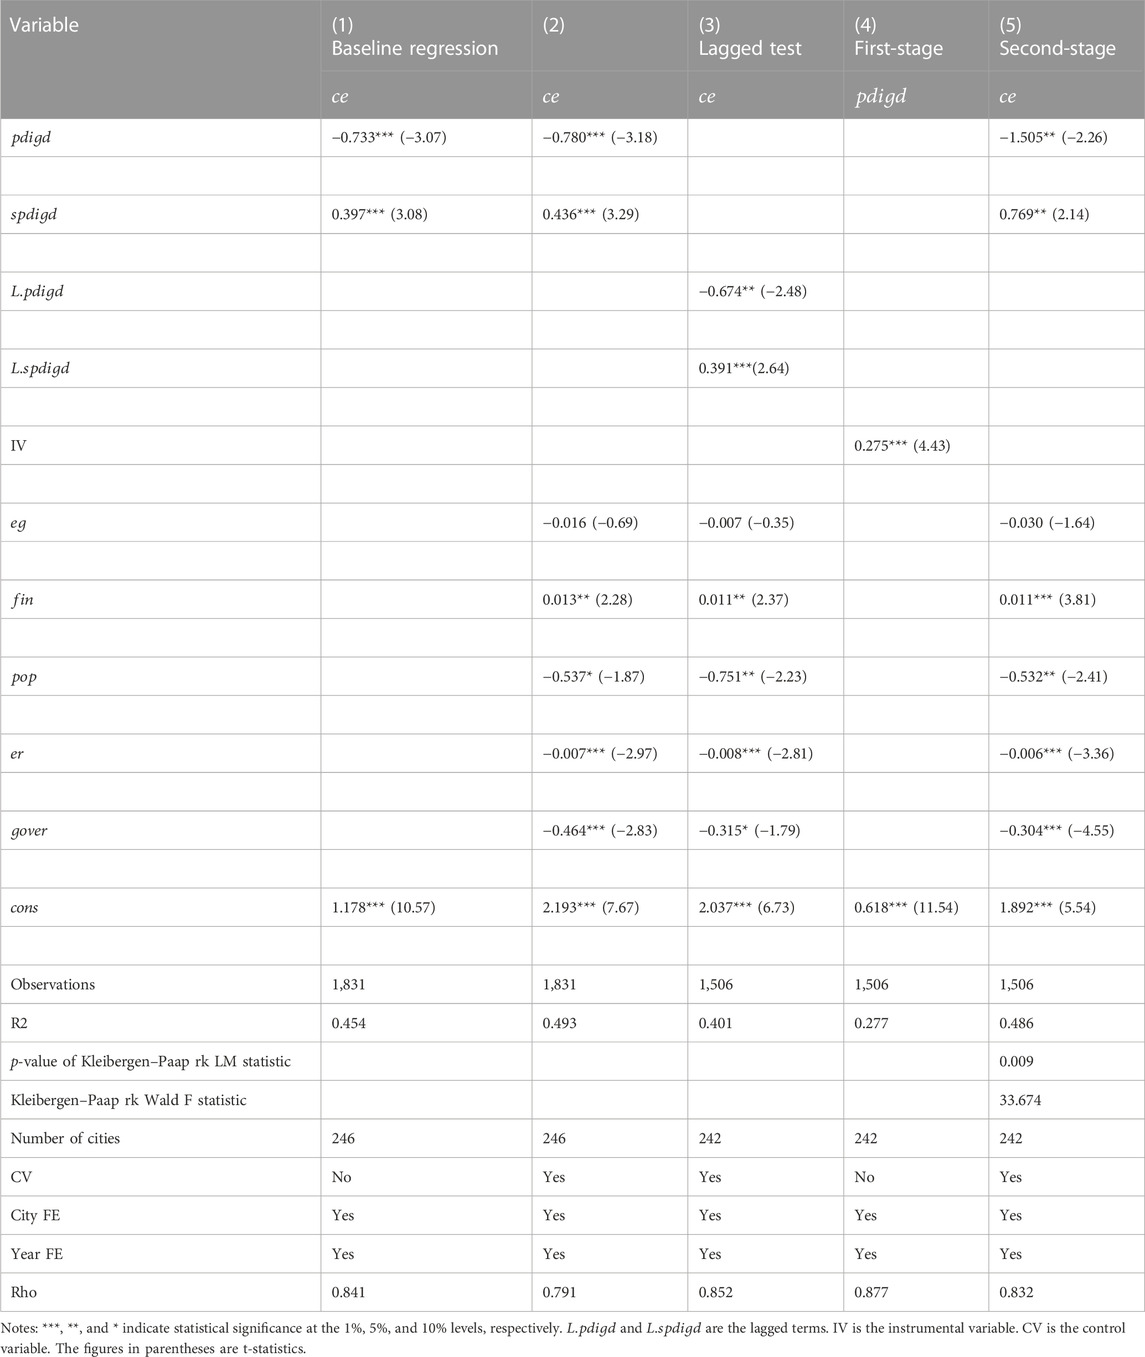
TABLE 2. Baseline regression and endogenous test results.
Among the control variables, the effect on carbon efficiency is evident for all variables except economic growth. Similar to the aforementioned reason, although economic growth is supposed to negatively affect the environment by emitting more emissions, it is also highly correlated with economic performance, making its impact on carbon efficiency unclear. Financial development shows a significant positive effect on carbon efficiency. This is because a higher level of financial development can not only boost economic development through better resources allocation but also indirectly eliminate outdated production capacity that generates more emissions than average through financing prices and financial markets (Hussain et al., 2022). Population density shows a negative relationship with carbon efficiency. The reason for this is that higher density comes with higher urbanization and household clustering, which is shown to increase local carbon emissions (Hussain et al., 2022; Chen Z. M. et al., 2018). In contrast, higher population density does not necessarily lead to better local economic conditions. Both environmental regulation and government spending have been tested to have a significant negative impact on carbon efficiency. This can be explained in that the focus of environment protection in China between 2011 and 2019 was mainly on hazardous emissions such as SO2. At the same time, production restrictions and penalties tend to reduce the profitability of the relevant industries. According to Zhang and Wei (2014), environmental regulation tools available to governments are usually accompanied by economic cost. This result is also consistent with the finding of Wang and Du (2019), which suggests that the economic cost of environmental regulations and policies outweighs their effectiveness on CO2 emissions reduction between 2011 and 2019.
4.2 Endogenous treatment
The issue of endogeneity cannot be ignored when exploring the mechanisms of influence between factors with ambiguous causality. As presented in Zhang et al. (2022)’s paper, digital development and carbon efficiency might have reverse causality in that cities with a higher level of carbon efficiency and information transparency would also take the lead in developing the digital economy. In addition, the complexity of the impact mechanism also increases the risk of omitted variables or unobservable factors in the model. The lagged variable and instrumental variable methods are adopted to deal with the endogeneity issue. Column (3) shows that this model passes the lagged variable test, and the relationship remains significant after substituting the digital development index with the lagged one. As for the instrumental method, a “Bartik instrument” is built as the product of the previous year’s digital development
4.3 Robustness test
(1) Quantile regression results. After replacing the estimation method with quantile regression, different settings of 25%, 50%, and 75% were tested. Columns (1)–(3) of Table 3 show that the coefficients of digital development and its square term are significant in three scenarios. The t statistics are all larger than 10, indicating a stronger significance than the baseline mode. This result proves the robustness of Hypothesis 1 in this study.
(2) Substitution of the explained variable. By referring to Murshed et al. (2022), carbon productivity (cp) refers to the volume of GDP generated from each unit of CO2 emitted. As an indicator that considers both environmental sustainability and economic sustainability, carbon productivity is an appropriate robust alternative to carbon efficiency discussed in this paper. Considering the order of magnitude, the logarithm term is used in the regression. Column (4) of Table 3 shows that after replacing the explained variable, there is still a significant U-shaped relationship between digital development and carbon performance at the 95% confidence level. The decrease in significance is mainly caused by fewer factors being taken into account when calculating carbon productivity. The carbon efficiency index in the original model also considers the efficiency of input factors such as labor, capital, and energy consumption.
(3) Substitution of the explanatory variable. In this step,
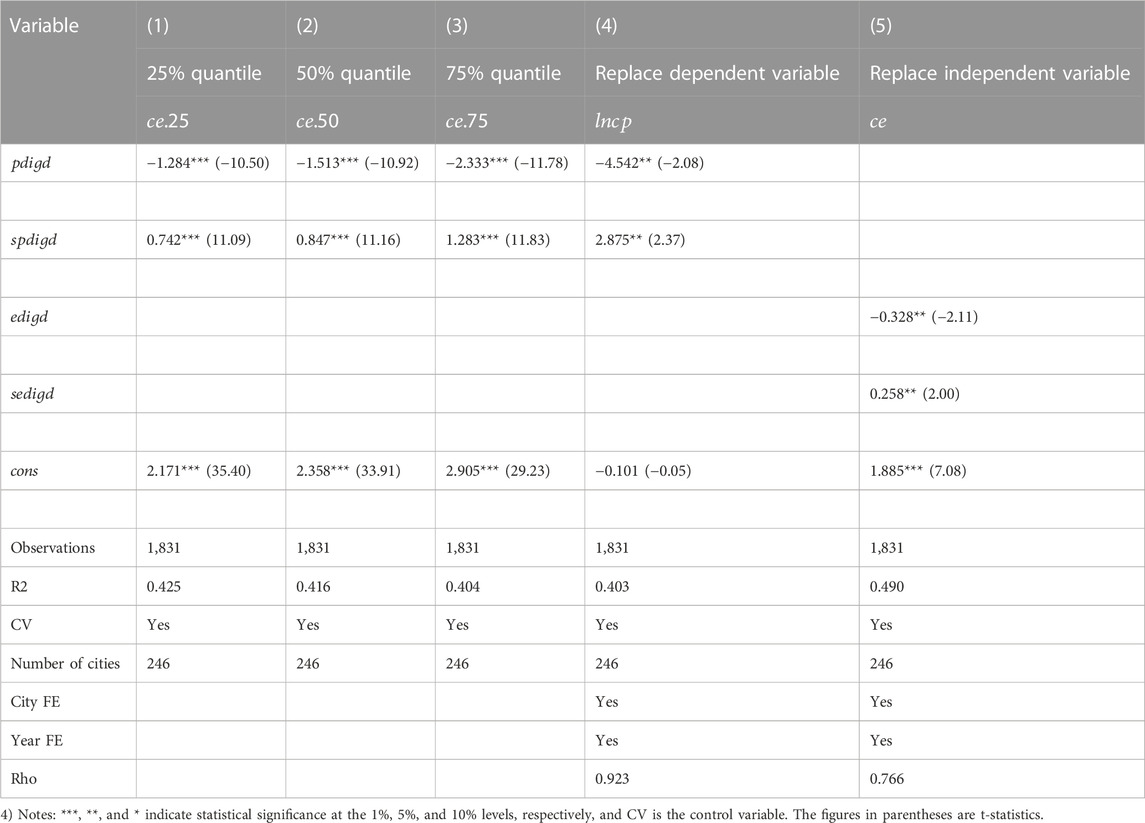
TABLE 3. Robustness test results.
4.4 Heterogeneity test
Considering that digital development in China displayed a great disparity among different regions during the period of 2011–2019, a heterogeneity test was conducted based on regional differences. The findings of the test are shown in Columns (1)–(4) of Table 4. As a leading region in economic development, technology progress, and human capital resources, the eastern region shows the most significant relationship between digitalization and carbon efficiency. More than half of the sample cities in this region have a pdigd higher than 0.92, which is the inflection point presented in the baseline model. This number is around one-third in the western region, leading to a lower significance level and a higher inflection point. Most of the sample cities in the northeast and central regions have not yet reached the turning point, and therefore, the relationship between digital development and carbon efficiency remains ambiguous.
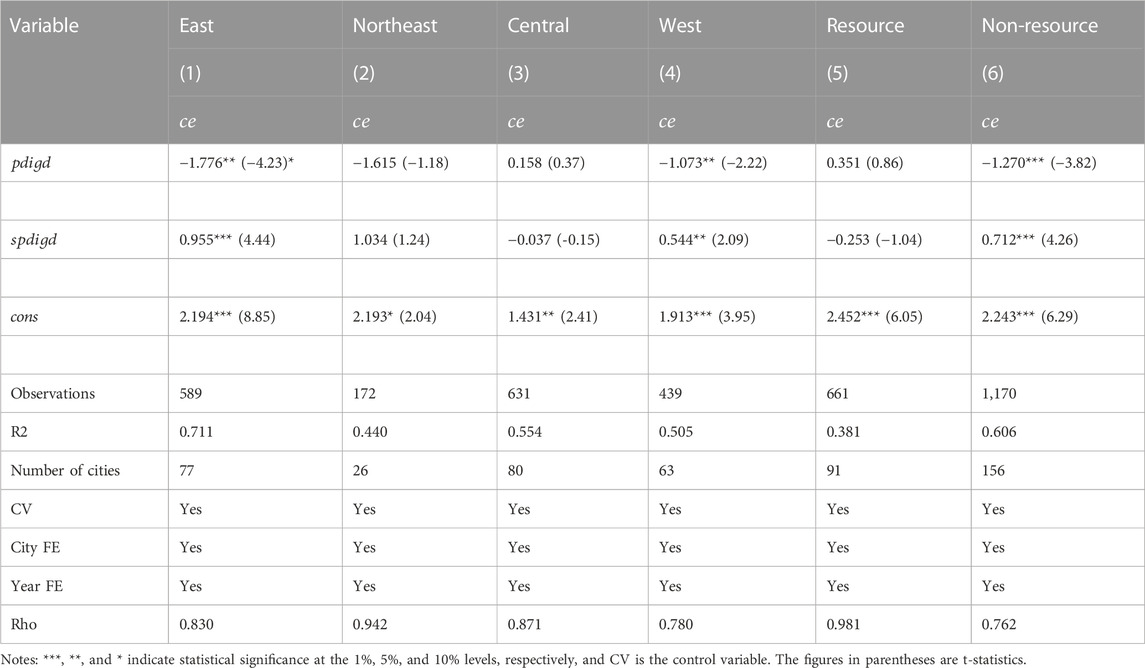
TABLE 4. Heterogeneity test results.
In addition to regional heterogeneity, digitalization may also present different effects on carbon efficiency depending on the type of development. This paper refers to the list published by the State Council of China in 2013 and divides sample cities into resources-based and non-resources-based cities. The results are shown in Columns (5) and (6). The relationship for non-resource-based cities is found to be significant at the 99% confidence level, with an inflection point of 0.89. This indicates that in cities with low resource dependency, digitalization can achieve its contribution to carbon efficiency earlier. On the other hand, resources-based cities are dependent on a single or several industries for economic growth, and these industries are usually accompanied by high levels of pollution. The industrial structure of these places is relatively simple and hard to change, even with the help of digital technologies. As a result, digital development in resources-based cities is still at a lower level, and its impact on economic and environmental performance is limited.
4.5 Mediating effect test
To fulfill the gap and build on existing research to further clarify the mechanisms of how digital development affects carbon efficiency, this paper uses a mediating effect model to test this empirically. The stepwise causal method proposed by Baron and Kenny (1986) was used to test and present the intermediary effects, as shown in Table 5. The coefficients were then double-tested for robustness using the bootstrap method with reference to the study by Wen et al. (2014). Lastly, each path of the mediating effect was explored using the bootstrapping coefficient product test, further improving the robustness of the model.
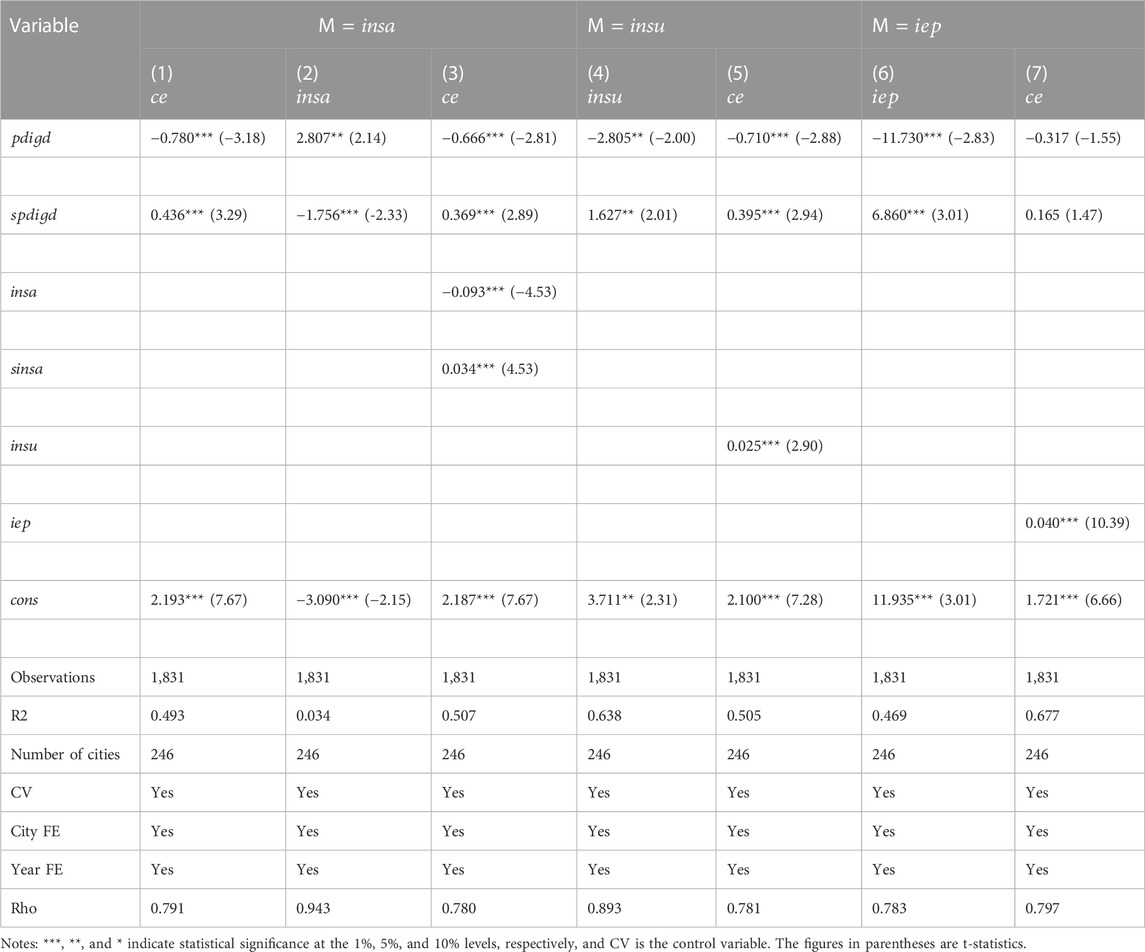
TABLE 5. Mediation effect test results.
4.5.1 Industrial agglomeration
Columns (2) and (3) examine the transmission channel through industrial agglomeration. As can be seen, digital development is found to have an inverted U-shape relationship with INSA. In the early stage of digital development, an increased level of information flow helps drive resource flows to higher value-added areas due to positive economic of scale. This process speeds industrial agglomeration and further widens the gap between regions (Duan and Shao, 2020). However, as digital development and industrial agglomeration increase, the marginal effect of moving from DD to INSA will diminish and slow the rate of INSA in developed areas. This is because the marginal benefit of incoming resources such as labor and capital decline while the cost of land, electricity, and other local resources increases sharply. Column (3) reveals a partial mediating effect between INSA and carbon efficiency and finds that the relationship between them is U-shaped. This is consistent with Hypothesis 3, the finding by Li and Liu (2022), and the research of Chen et al. (2022). Initially, most of China’s industries were processing, resembling, and resources extraction, were still on the path of transformation from labor-intensive to capital-intensive, and were characterized as low added value, high pollution, and high energy consumption. The industrial agglomeration at this stage was non-environmentally efficient (Li and Liu, 2022). Although the economic growth rate was quite high, it came at the cost of the environment. After the agglomeration reaches a certain level, the spillover effect of the knowledge alongside the transition to technology-intensive helps to increase the added value and reduce the emissions, thus improving carbon efficiency (Chen et al., 2022).
4.5.2 Industrial structure upgrading
Columns (4) and (5) show the non-linear relationship between digital development and INSU and the positive linear impact of INSU on carbon efficiency, respectively. A one-unit change in INSU will lead to a 0.025 increase in the local carbon efficiency index. Digital development would accelerate INSU when
4.5.3 Industrial electricity productivity
The transmission channel through IEP is explored in Columns (6) and (7). A U-shaped relationship is found between digital development and IEP, with a linear positive effect on carbon efficiency. The development of digital facilities is highly expensive and consumes large amounts of energy. More than 10% of global electricity is channeled to the ICT sectors (Walsh, 2013). This is the reason that digital development exerts a negative impact on IEP in the early stage. When the digital economy develops to a certain point, increased information efficiency and technological advances make companies more productive, and each unit of electricity consumed will produce more output than before (Li and Wang, 2022). Compared to other channels, the increase in IEP is more closely connected with the performance in carbon emissions. The direct impact of digital development on carbon emissions is found to be insignificant in this equation. In previous studies, researchers have typically defined this as the full mediator, meaning that the original factor is the only channel that theoretically influences the explanatory variable; however, this practice was shown to be inadequate because a series of other mediators were also found to be significant. Preacher and Hayes (2008) called to end the practice of judging a full or partial mediator based on the coefficient significance of original factors in the mediation regression. The reasons are as follows: a strong multicollinearity problem may exist in the third step of the stepwise test method, thus lowering the significance of the direct effect; data quality and sample size play crucial roles in testing the direct effect, and the coefficient may transfer from insignificant to significant with the increase of sample size (see Column (4) in Table 5). To solve this problem and further test the robustness of the mediating effect, this paper refers to the bootstrap method suggested by Preacher and Hayes (2004), Wen et al. (2014), and Lin and Feng (2022). In the next section, equations containing the original factor and mediators are tested again using the bootstrapping method, and then confidence intervals of coefficient products are tested.
4.5.4 Bootstrapping test results
Table 6 gives the results of the double test of the mediating equations by bootstrapping using a sample size of 5,000. In all four paths, the coefficients remain significant at the 99% confidence level. The only differences are a decrease in standard errors and an increase in the t-value, which indicates that the level of confidence increases as the sample size increases.
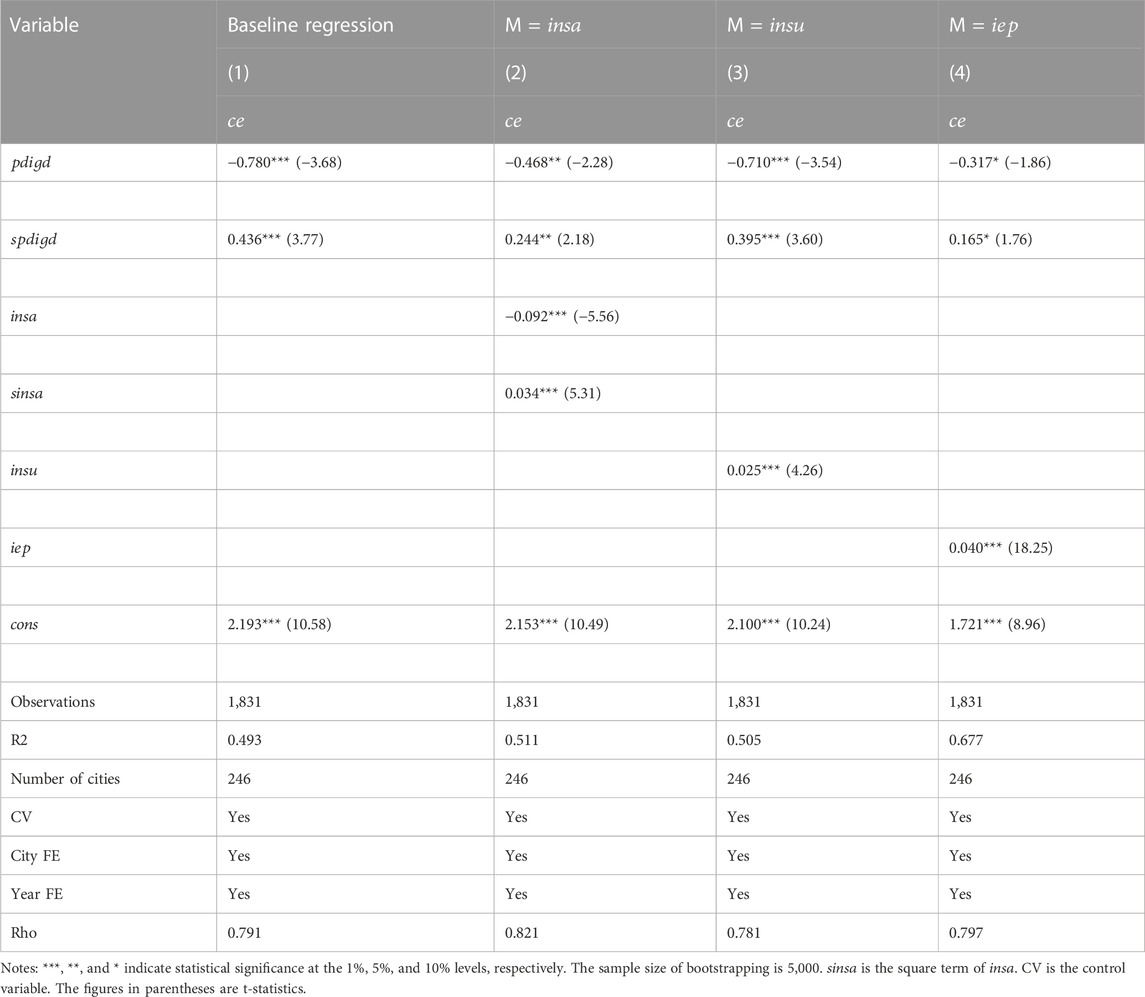
TABLE 6. Bootstrap test results.
Table 7 shows the results of bootstrap tests for coefficient products involving square terms. Hayes (2009) demonstrated the practice and credibility of testing the robustness of the mediation model by checking whether the confidence interval of the coefficient of indirect effect contains zero or not. Lin and Feng (2022) further extended this method in a mediation model that contains non-linear terms. As shown in Table 6, the square term of digital development was used in the models for INSA, INSU, and IEP to capture the non-linear relationship between them, while the primary term of digital development was used in the model of ICTA due to their linear relationship. The primary term of ICTA, INSU, and IEP was used in the model as its mediating effects were found to be linear, while the square term of INSA was adopted due to the U-shaped relationship with carbon efficiency. The results show that all mediating effects are significant at the 95% confidence level. The zero point is not included in the 95% confidence interval for the percentile and bias correction. All four paths pass the bootstrapping test, and the robustness of the mediation model is further proved.
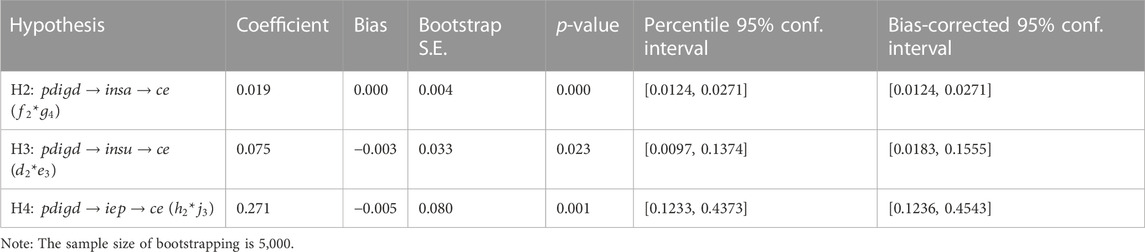
TABLE 7. Coefficient products of bootstrap results.
5 Conclusion and policy implication
Using a series of quantitative methods and panel data from 246 prefecture-level cities in China from 2011 to 2019, this paper explores the impact of digital development in the view of sustainable development and provides structural policy recommendations for the cooperation between digitalization strategy and the goal of a carbon generalized system of preferences and carbon neutrality. First, to derive a carbon efficiency that takes into account both economic and environmental performance, a total factor NDDF method was used to calculate the unifying efficiency. Second, this paper constructs an index to measure the level of digital development in each city using five digitization-related indicators easily collected from prefecture city yearbooks as inputs for the principle component approach. Third, fixed effect regression and intermediary effect models are built to investigate the influence of China’s digital development on carbon efficiency and transmission channels.
The following conclusions can be drawn: 1) the impact of digital development on carbon efficiency is U-shaped. When the level of digitalization is low, carbon efficiency is negatively correlated with digital development. Once a certain level is exceeded, carbon efficiency will be boosted by digitalization. 2) Digital development has an inverted U-shaped relationship with INSA. In the early stage, the accumulation of resources-based and heavily polluted sectors worsens the local environment conditions, while after the transition to technology-intensive industries, local carbon efficiency can benefit from technology spillover and scale effects. 3) Digitalization may hinder the development of INSU at the beginning but will have an accelerating positive impact after a certain level is reached. Through INSU, the tertiary sector will contribute more output than before, conducive to the increase of carbon efficiency by bringing higher productivity and lower emissions. 5) A U-shaped relationship has also been identified between digital development and IEP. While early-stage digital development may result in significant increases in electricity consumption due to extensive facility construction and production of digital equipment, a high level of digitalization has a significant technology spillover effect that allows other industries to explore more efficient production processes, thus improving the overall IEP.
Some policy suggestions are proposed based on the conclusions.
First, policymakers should pay attention to the fact that the current digital economy itself has high carbon-negative externalities. In the fourth industrial revolution driven by digitalization, proper regulations and evaluations should be proposed to avoid excessive heating that wastes resources and energy. For example, it is reasonable to decide what size digital facilities to build based on the size of the population and the needs of the industry.
Second, local government could encourage the agglomeration of ICT while being cautious about the agglomeration of other industrial sectors. Because of to the connection between the economic development and the performance measurement for local officials, some local governments in China may compete with each other by adopting ill-considered policies to attract businesses and develop digital facilities. The mismatch between subsidies and concessions for businesses and the requirement for sustainable and high-quality development may have a negative impact on carbon efficiency. Policies could be established to 1) retain and support highly efficient agglomerations that are beneficial to industrial scale, production upgrades and energy productivity; 2) build a unified sewage system in local industrial parks to share the cost and improve the management efficiency; and 3) introduce comprehensive guidelines and standards to evaluate whether an enterprise matches sustainable development before offering subsidies.
Third, while allowing the free flow of resources and market liberalization, attention should be paid to regional differentiation and the division of production, and the risk of excessive regional disparities leading to an accelerated deterioration of environmental conditions in some regions needs to be noted. The central government can set goals for cities with a high level of digital development, guide and assist less developed cities to become digital, and subsidize emerging digital companies that empower the construction and production process in underdeveloped areas. While this may affect overall efficiency in the short term, narrowing the development gap between regions will provide additional impetus in the long term.
This paper preliminarily explores the impact of digital development on carbon emission efficiency and the intermediary channels. It has some limitations, and more research remains to be carried out. First, much of the digital-related data have only begun to be recorded in recent years, especially at the prefecture level. There are other, more effective methods for assessing the digital development of prefecture-level cities, such as the “Digitalization Evolution Index” published by H3C and the “Digital Transformation Index” by Tencent. However, these datasets only cover data from the last 3 years. A more comprehensive digital development index may be available in the near future and could be used to explore the relationship between digitalization and carbon emission efficiency more deeply. Second, although this paper adopts a rather rigorous verification method to test the robustness of the intermediary relationship in the paper, these relationships are likely to be much more complex in practice. It may still be too simple to explore these relationships in a one-way manner. This is a direction worth exploring further. Third, as shown in this paper and many other studies, there is a significant regional heterogeneity existing in the impact of digital development of carbon emission efficiency. Due to differences in the level of economic development, regional locations, historical reasons, industrial structures, and natural recourses distributions, each province and even city may differ in terms of the impact of digitalization on the local carbon emission efficiency. More in-depth research should be carried out to explore how regions with more successful digital transformation can contribute to the development of the less developed regions.
Data availability statement
The original contributions presented in the study are included in the article/Supplementary Material; further inquiries can be directed to the corresponding author.
Author contributions
YD: conceptualization, methodology, investigation, data collection, data calculation, writing–original draft, and writing–review and editing. YY: methodology, data collection, investigation, writing–original draft, and writing–review and editing.
Conflict of interest
The authors declare that the research was conducted in the absence of any commercial or financial relationships that could be construed as a potential conflict of interest.
Publisher’s note
All claims expressed in this article are solely those of the authors and do not necessarily represent those of their affiliated organizations, or those of the publisher, the editors, and the reviewers. Any product that may be evaluated in this article, or claim that may be made by its manufacturer, is not guaranteed or endorsed by the publisher.
Supplementary material
The Supplementary Material for this article can be found online at: https://www.frontiersin.org/articles/10.3389/fenvs.2023.1075890/full#supplementary-material
References
Acheampong, A. O. (2018). Economic growth, CO2 emissions and energy consumption: What causes what and where? Energy Econ. 74, 677–692. doi:10.1016/j.eneco.2018.07.022
Andrae, A., and Edler, T. (2015). On global electricity usage of communication technology: Trends to 2030. Challenges 6, 117–157. doi:10.3390/challe6010117
Asongu, S. A. (2018). ICT, openness and CO2 emissions in africa. Environ. Sci. Pollut. Res. 25, 9351–9359. doi:10.1007/s11356-018-1239-4
Avom, D., Nkengfack, H., Fotio, H. K., and Totouom, A. (2020). ICT and environmental quality in Sub-Saharan Africa: Effects and transmission channels. Technol. Forecast. Soc. Change. 155, 120028. doi:10.1016/j.techfore.2020.120028
Baron, R. M., and Kenny, D. A. (1986). The moderator-mediator variable distinction in social psychological research: Conceptual, strategic, and statistical considerations. J. Pers. Soc. Psychol. 51, 1173–1182. doi:10.1037/0022-3514.51.6.1173
Bartik, T. (2006). How do the effects of local growth on employment rates vary with initial labor market conditions? Upjohn Inst. Work. Pap. 09, 148. doi:10.2139/ssrn.1372814
Borowski, P. F. (2021). Digitization, digital twins, blockchain, and industry 4.0 as elements of management process in enterprises in the energy sector. Energies 14, 1885. doi:10.3390/en14071885
Chen, J. J., and Hu, C. G. (2008). The agglomeration effect of industrial agglomeration: Theoretical and empirical analysis of the yangtze river delta sub-region. Manag. World Chin. 6, 68–83. doi:10.19744/j.cnki.11-1235/f.2008.06.009
Chen, Y., Zhu, Z., and Cheng, S. (2022). Industrial agglomeration and haze pollution: Evidence from China. Sci. Total Environ. 845, 157392. doi:10.1016/j.scitotenv.2022.157392
Chen, Z., Kahn, M. E., Liu, Y., and Wang, Z. (2018). The consequences of spatially differentiated water pollution regulation in China. J. Environ. Econ. Manag. 88, 468–485. doi:10.1016/j.jeem.2018.01.010
Chen, Z. M., Wu, S. M., Ma, W. B., Liu, X., Cai, B., Liu, J., et al. (2018). Driving forces of carbon dioxide emission for China’s cities: Empirical analysis based on extended STIRPAT model. China Popul. Resour. Environ. 28 (10), 45–54. Available at: https://r.cnki.net/kcms/detail/detail.aspx?filename=ZGRZ201810006&dbcode=WWBJ&dbname=WWBJLAST2019&v=.
Collard, F., F`eve, P., and Portier, F. (2005). Electricity consumption and ICT in the French service sector. Energy Econ. 27 (3), 541–550. doi:10.1016/j.eneco.2004.12.002
Danish, , Khan, N., Baloch, M. A., Saud, S., and Fatima, T. (2018). The effect of ICT on CO2 emissions in emerging economies: Does the level of income matters? Environ. Sci. Pollut. Control Ser. 25 (23), 22850–22860. doi:10.1007/s11356-018-2379-2
Danish, , Zhang, J., Wang, B., and Latif, Z. (2019). Towards cross-regional sustainable development: The nexus between information and communication technology, energy consumption, and CO2 emissions. Sustain. Dev. 27 (5), 990–1000. doi:10.1002/sd.2000
Deng, R. R., and Zhang, A. X. (2021). The impact of urban digital finance development on carbon emission performance in China and mechanism. Resour. Sci. 43 (11), 2316–2330. doi:10.18402/resci.2021.11.14
Ding, C., Liu, C., Zheng, C., and Li, F. (2022). Digital economy, technological innovation, and high-quality economic development: Based on spatial effect and mediation effect. Sustainability 14, 216. doi:10.3390/su14010216
Dong, F., Hu, M., Gao, Y., Liu, Y., Zhu, J., and Pan, Y. (2022). How does digital economy affect carbon emissions? Evidence from global 60 countries. Sci. Total Environ. 852, 158401. doi:10.1016/j.scitotenv.2022.158401
Duan, B., and Shao, C. L. (2020). Does the digital economy exacerbate regional disparities? empirical evidence from 284 prefecture-level cities in China. World Reg. Stud. 29 (4), 728–737. doi:10.3969/j.issn.1004-9479.2020.04.2019141
Duc, T. A., Vachaud, G., Bonnet, M. P., Prieur, N., Loi, V. D., and Anh, L. L. (2007). Experimental investigation and modelling approach of the impact of urban wastewater on a tropical river; a case study of the Nhue River, Hanoi, Vietnam. J. Hydrol. 334 (3), 347–358. doi:10.1016/j.jhydrol.2006.10.022
Faere, R., Grosskopf, S., Lovell, C. A. K., and Pasurka, C. (1989). Multilateral productivity comparisons when some outputs are undesirable: A nonparametric approach. Rev. Econ. Stat. 71 (1), 90–98. doi:10.2307/1928055
Fama, E. F. (1970). Efficient capital markets: A review of theory and empirical work. J. Finance 25 (2), 383–417. doi:10.2307/2325486
Fang, J., Tang, X., Xie, R., and Han, F. (2020). The effect of manufacturing agglomerations on smog pollution. Struct. Chang. Econ. 54, 92–101. doi:10.1016/j.strueco.2020.04.003
Guan, D., Meng, J., Reiner, D. M., Zhang, N., Shan, Y., Mi, Z., et al. (2018). Structural decline in China’s CO2 emissions through transitions in industry and energy systems. Nat. Geosci. 11, 551–555. doi:10.1038/s41561-018-0161-1
Guo, F., Yang, S. G., and Ren, Y. (2022). The digital economy, green technology innovation and carbon emissions—empirical evidence from Chinese city-level data. J. Shanxi Normal Univ. (Philosophy Soc. Sci. Ed. 51 (03), 45–60. doi:10.15983/j.cnki.sxss.2022.0507
Hayes, A. F. (2009). Beyond Baron and Kenny: Statistical mediation analysis in the new millennium. Commun. Monogr. 76 (4), 408–420. doi:10.1080/03637750903310360
Hussain, M., Wang, W., and Wang, Y. W. (2022). Natural resources, consumer prices and financial development in China: Measures to control carbon emissions and ecological footprints. Resour. Pol. 78, 102880. doi:10.1016/j.resourpol.2022.102880
IEA (2019). Global energy and CO2 status report 2019. Available at: https://www.iea.org/reports/global-energy-co2-status-report-2019/emissions.
Lee, J. W., and Brahmasrene, T. (2014). ICT, CO2 emissions and economic growth: Evidence from a panel of ASEAN. Glob. Econ. Rev. 43 (2), 93–109. doi:10.1080/1226508X.2014.917803
Li, H., and Liu, B. F. (2022). The effect of industrial agglomeration on China’s carbon intensity: Evidence from a dynamic panel model and a mediation effect model. Energy Rep. 8, 96–103. doi:10.1016/j.egyr.2022.05.070
Li, X., Xu, Y., and Yao, X. (2021a). Effects of industrial agglomeration on haze pollution: A Chinese city-level study. Energy Pol. 148, 111928. doi:10.1016/j.enpol.2020.111928
Li, Z. G., and Wang, J. (2022). The dynamic impact of digital economy on carbon emission reduction: Evidence city-level empirical data in China. J. Clean. Prod. 351, 131570. doi:10.1016/j.jclepro.2022.131570
Li, Z. Z., Li, R. Y. M., Malik, M. Y., Murshed, M., Khan, Z., and Umar, M. (2021b). Determinants of carbon emission in China: How good is green investment? Sustain. Prod. Consum. 27, 392–401. doi:10.1016/j.spc.2020.11.008
Lin, B., and Zhou, Y. (2021). Does the Internet development affect energy and carbon emission performance? Sustain. Prod. Consum. 28, 1–10. doi:10.1016/j.spc.2021.03.016
Lin, W. P., and Feng, B. Y. (2022). Curvilinear effect and statistical test method in the management research. Nankai Bus. Rev. 25 (1), 155–166. Available at: https://kns.cnki.net/KCMS/detail/detail.aspx?dbcode=CJFD&filename=LKGP202201012.
Liu, C. J., and Zhang, S. H. (2022). The source of living water: Green finance to economic development – deconstruction based on the financial theory perspective. J. Northwest Normal Univ. Soc. Sci. 59 (03), 134–144. doi:10.16783/j.cnki.nwnus.2022.03.015
Liu, Q., Gu, A., Teng, F., Song, R., and Chen, Y. (2017). Peaking China's CO2 emissions: Trends to 2030 and mitigation potential. Energies 10 (2), 209. doi:10.3390/en10020209
Liu, Z., Deng, Z., He, G., Wang, H., Zhang, X., Lin, J., et al. (2022). Challenges and opportunities for carbon neutrality in China. Nat. Rev. Earth Environ. 3, 141–155. doi:10.1038/s43017-021-00244-x
Luo, K., Liu, Y. B., Chen, P. F., and Zeng, M. L. (2022). Assessing the impact of digital economy on green development efficiency in the Yangtze River Economic Belt. Energy Econ. 112, 106127. doi:10.1016/j.eneco.2022.106127
Ma, Q., Tariq, M., Mahmood, H., and Khan, Z. (2022). The nexus between digital economy and carbon dioxide emissions in China: The moderating role of investments in research and development. Technol. Soc. 68, 101910. doi:10.1016/j.techsoc.2022.101910
Malmodin, J., and Lundén, D. (2018). The energy and carbon footprint of the global ICT and E&M sectors 2010–2015. Sustainability 10 (9), 3027. doi:10.3390/su10093027
Mawson, V. J., and Hughes, B. R. (2019). The development of modelling tools to improve energy efficiency in manufacturing processes and systems. J. Manuf. Syst. 51, 95–105. doi:10.1016/j.jmsy.2019.04.008
Miao, T. J., Chen, J., Fan, T., and Lu, Y. (2022). Impact of digital economy development on carbon emissions: Based on panel data analysis of 278 prefecture-level cities. South China Finance 02, 45–57. Available at: http://www.nfjr.gd.cn/CN/Y2022/V1/I2/45.
Murshed, M., Apergis, N., Alam, M. D., Khan, U., and Mahmud, S. (2022). The impacts of renewable energy, financial inclusivity, globalization, economic growth, and urbanization on carbon productivity: Evidence from net moderation and mediation effects of energy efficiency gains. Renew. Energ. 196, 824–838. doi:10.1016/j.renene.2022.07.012
Plageras, A. P., Psannis, K. E., Stergiou, C., Wang, H., and Gupta, B. (2018). Efficient IoT-based sensor big data collection-processing and analysis in smart buildings. Futur. Gener. Comput. Syst. 82, 349–357. doi:10.1016/j.future.2017.09.082
Preacher, K. J., and Hayes, A. F. (2008). Asymptotic and resampling strategies for assessing and comparing indirect effects in multiple mediator models. Behav. Res. Methods. 40 (3), 879–891. doi:10.3758/BRM.40.3.879
Preacher, K. J., and Hayes, A. F. (2004). SPSS and SAS procedures for estimating indirect effects in simple mediation models. Behav. Res. Meth. Instrum. 36, 717–731. doi:10.3758/BF03206553
Ren, S., Hao, Y., Xu, L., Wu, H., and Ba, N. (2021). Digitalization and energy: How does internet development affect China’s energy consumption? Energy Econ. 98, 105220. doi:10.1016/j.eneco.2021.105220
Salahuddin, M., and Alam, K. (2015). Internet usage, electricity consumption and economic growth in Australia: A time series evidence. Telemat. Inf. 32 (4), 862–878. doi:10.1016/j.tele.2015.04.011
Shan, Y., Guan, D., Liu, J., Mi, Z., Liu, Z., Liu, J., et al. (2017). Methodology and applications of city level CO2 emission accounts in China. J. Clean. Prod. 161, 1215–1225. doi:10.1016/j.jclepro.2017.06.075
Sun, X. M., Zhang, H., and Wang, G. (2016). Evaluation of regional carbon emissions performance based on SE-SBM model: Taking shandong province as an example. Ecol. Econ. 32 (5), 68–73. Available at: https://www.cnki.com.cn/Article/CJFDTotal-STJJ201605014.htm.
Tang, L., Guo, D., Wu, J., and Tan, Q. (2014). Program evaluation and its application to equipment based on super-efficiency DEA and gray relation projection method. J. Syst. Eng. Electron. 25, 1037–1042. doi:10.1109/JSEE.2014.00119
Tchamyou, V. S., Erreygers, G., and Cassimon, D. (2019). Inequality, ICT and financial access in Africa. Technol. Forecast. Soc. Change. 139, 169–184. doi:10.1016/j.techfore.2018.11.004
Verhoef, E. T., and Nijkamp, P. (2002). Externalities in urban sustainability: Environmental versus localization-type agglomeration externalities in a general spatial equilibrium model of a single-sector monocentric industrial city. Ecol. Econ. 40 (2), 157–179. doi:10.1016/S0921-8009(01)00253-1
Virkanen, J. (1998). Effect of urbanization on metal deposition in the bay of Töölönlahti, Southern Finland. Mar. Pollut. Bull. 36 (9), 729–738. doi:10.1016/S0025-326X(98)00053-8
Wang, J. D., Dong, X. C., and Dong, K. Y. (2022a). How digital industries affect China’s carbon emissions? Analysis of the direct and indirect structural effects. Technol. Soc. 68, 101911. doi:10.1016/j.techsoc.2022.101911
Wang, J. D., Dong, X. C., and Dong, K. Y. (2022c). How does ICT agglomeration affect carbon emissions? The case of yangtze river delta urban agglomeration in China. Energy Econ. 111, 106107. doi:10.1016/j.eneco.2022.106107
Wang, J. D., Dong, X. C., Dong, K. Y., and Taghizadeh-Hesary, F. (2022b). Assessing the digital economy and its carbon-mitigation effects: The case of China. Energy Econ. 113, 106198. doi:10.1016/j.eneco.2022.106198
Wang, S., and Wang, H. R. (2022). Research on the strategies of healthy development of China's digital economy under the background of carbon peaking and carbon neutrality goals. Contemp. Econ. Manag. 44 (08), 11–16. doi:10.13253/j.cnki.ddjjgl.2022.08.003
Wang, Z. F., and Du, Y. Y. (2019). Spatial-temporal differences and influencing factors of carbon emission efficiency in hunan province based on SBM-DEA model. Sci. Geo. Sin. 39 (5), 797–806. doi:10.13249/j.cnki.sgs.2019.05.011
Wen, Z. L., and Ye, B. J. (2014). Analyses of mediating effects: The development of methods and models. Adv. Psychol. Sci. 22 (5), 731–745. doi:10.3724/SP.J.1042.2014.00731
Wu, H., Hao, Y., Ren, S., Yang, X., and Xie, G. (2021). Does internet development improve green total factor energy efficiency? Evidence from China. Energy Pol. 153, 112247. doi:10.1016/j.enpol.2021.112247
Xu, Q., Zhong, M. R., and Cao, M. Y. (2022). Does digital investment affect carbon efficiency? Spatial effect and mechanism discussion. Sci. Total Environ. 827, 154321. doi:10.1016/j.scitotenv.2022.154321
Xu, S. C., He, Z. X., and Long, R. Y. (2014). Factors that influence carbon emissions due to energy consumption in China: Decomposition analysis using LMDI. Appl. Energy. 127, 182–193. doi:10.1016/j.apenergy.2014.03.093
Xue, Y., Tang, C., Wu, H. T., Liu, J., and Hao, Y. (2022). The emerging driving force of energy consumption in China: Does digital economy development matter. Energy Pol. 165, 112997. doi:10.1016/j.enpol.2022.112997
Yan, M., Wang, C., and Zhang, W. (2021). Nonlinear impacts of information and communications technology investment on industrial structure upgrading: The role of marketization. Appl. Econ. Lett. 30, 336–342. doi:10.1080/13504851.2021.1985066
Yang, X. D., Su, X. F., Ran, Q. Y., Ren, S. Y., Chen, B., Wang, W. L., et al. (2021b). Assessing the impact of energy internet and energy misallocation on carbon emissions: New insights from China. Environ. Sci. Pollut. Res. 29, 23436–23460. doi:10.1007/s11356-021-17217-8
Yang, X. D., Wu, H. T., Ren, S. Y., Ran, Q. Y., and Zhang, J. N. (2021a). Does the development of the internet contribute to air pollution control in China? Mechanism discussion and empirical test. Struct. Chang. Econ. Dyn. 56, 207–224. doi:10.1016/j.strueco.2020.12.001
Yin, S., Zhang, N., Ullah, K., and Gao, S. (2022). Enhancing digital innovation for the sustainable transformation of manufacturing industry: A pressure-state-response system framework to perceptions of digital green innovation and its performance for green and intelligent manufacturing. Systems 10 (3), 72. doi:10.3390/systems10030072
Zekic-Susac, M., Mitrovic, S., and Has, A. (2021). Machine learning based system for managing energy efficiency of public sector as an approach towards smart cities. Int. J. Inf. Manag. 58, 102074. doi:10.1016/j.ijinfomgt.2020.102074
Zeng, D. Z., and Zhao, L. (2009). Pollution havens and industrial agglomeration. J. Environ. Econ. Manag. 58 (2), 141–153. doi:10.1016/j.jeem.2008.09.003
Zhang, H., and Feng, C. (2021). Innovative and low-carbon city: The impact of innovative city construction on carbon emission performance. South China J. Econ. 03, 36–53. doi:10.19592/j.cnki.scje.380220
Zhang, H., and Wei, X. P. (2014). Green paradox or forced emission-reduction: Dual effect of environmental regulation on carbon emissions. China Popul. Resour. Environ. 24 (09), 21–29. Available at: https://www.cnki.com.cn/Article/CJFDTotal-ZGRZ201409004.htm.
Zhang, L., Mu, R. Y., Zhan, Y. F., Yu, J., Liu, L., Yu, Y., et al. (2022b). Digital economy, energy efficiency, and carbon emissions: Evidence from provincial panel data in China. Sci. Total Environ. 852, 158403. doi:10.1016/j.scitotenv.2022.158403
Zhang, N., Kong, F. B., Choi, Y., and Zhou, P. (2014). The effect of size-control policy on unified energy and carbon efficiency for Chinese fossil fuel power plants. Energy Pol. 70, 193–200. doi:10.1016/j.enpol.2014.03.031
Zhang, W., Liu, X. M., Wang, D., and Zhou, J. P. (2022a). Digital economy and carbon emission performance: Evidence at China’s city level. Energy Pol. 165, 112927. doi:10.1016/j.enpol.2022.112927
Zhang, Y. L. (2022). Analysis of China's energy efficiency and influencing factors under carbon peaking and carbon neutrality goals. J. Clean. Prod. 370, 133604. doi:10.1016/j.jclepro.2022.133604
Zhao, X., Liu, C., and Yang, M. (2018). The effects of environmental regulation on China's total factor productivity: An empirical study of carbon-intensive industries. J. Clean. Prod. 179, 325–334. doi:10.1016/j.jclepro.2018.01.100
Zhou, P., Ang, B. W., and Wang, H. (2012). Energy and CO2 emission performance in electricity generation: A non-radial directional distance function approach. Eur. J. Oper. Res. 221, 625–635. doi:10.1016/j.ejor.2012.04.022
Keywords: carbon efficiency, digital development, sustainable growth, NDDF model, mediation effect model
Citation: Ding Y and Yang Y (2023) The influence of digital development on China’s carbon emission efficiency: In the view of economic and environmental balance. Front. Environ. Sci. 11:1075890. doi: 10.3389/fenvs.2023.1075890
Received: 21 October 2022; Accepted: 16 February 2023;
Published: 03 March 2023.
Edited by:
Guo Wei, University of North Carolina at Pembroke, United StatesReviewed by:
Cüneyt Dumrul, Erciyes University, TürkiyeXiaodong Yang, Xinjiang University, China
Som Sankar Sen, University of Burdwan, India
Copyright © 2023 Ding and Yang. This is an open-access article distributed under the terms of the Creative Commons Attribution License (CC BY). The use, distribution or reproduction in other forums is permitted, provided the original author(s) and the copyright owner(s) are credited and that the original publication in this journal is cited, in accordance with accepted academic practice. No use, distribution or reproduction is permitted which does not comply with these terms.
*Correspondence: Yuan Ding, yding2019@student.hult.edu