Spatial–Temporal pattern and evolutionary trend of eco-efficiency of real estate development in the yangtze river economic belt
 Zhenggen Fan1
  Zhikang Deng
 Yawei Qi
- 1School of City Construction, Jiangxi Normal University, Nanchang, China
- 2School of Information Management, Jiangxi University of Finance and Economics, Nanchang, China
The eco-efficiency of real estate development (RED) is an important indicator in evaluating the effectiveness of eco-civilization construction. Thus, analyzing its temporal evolution and spatial spillover effect can help to judge the degree of coordinated development between RED and eco-civilization construction in the Yangtze River Economic Belt (YREB). From an ecology-based angle of RED, the data of 108 cities in YREB from 2006 to 2020 were selected. Then, the Super-SBM model, Moran’s I model, and Markov chain model were used to measure the eco-efficiency value of RED and analyze its spatial–temporal evolutionary characteristics. Research results indicate that the eco-efficiency of RED in YREB increased by 7.3%. Differences were apparent in the regional eco-efficiency of RED, but the gap gradually narrowed, and the range decreased from 0.60 to 0.05. A positive spatial autocorrelation was observed in the eco-efficiency of RED, and the high–high (H-H) cluster areas showed a trend of expansion and transfer. The proportion of H-H cluster cities increased from 11 to 20%, whereas the low–low cluster areas showed a trend of small-scale diffusion. The eco-efficiency of RED exhibited consistently stable and “club convergence” characteristics. When the spatial spillover effect is ignored, the eco-efficiency of RED presents at least 55.1% probability to be maintained in the original state. By contrast, when the spatial spillover effect is considered, the probability can be increased, and the assimilation effect of transferring the eco-efficiency of RED can be enhanced. In the future, the overall eco-efficiency of RED in YREB can be improved by exploring new development technologies, establishing collaborative development mechanisms among cities, and adopting eco-protection-oriented reward and punishment policies.
1 Introduction
Environmental pollution has become a widespread global issue since the 1990s. Real estate development (RED) is considered to be one of the main sources of environmental pollution (Onat et al., 2014), with the construction industry being responsible for 30% of the global carbon emissions (BERCTU, 2016). Among European Union member states, the real estate industry consumes approximately 40% of the social energy (Dall et al., 2012), and the environmental pollution stemming from this industry is more serious in developing countries (Gong and Kong, 2022). Real estate is considerably mature in developing countries, with most enterprises excessively emphasizing on building density and plot ratio, resulting in enormous pressure on the ecological environment (Shen et al., 2017). As the largest developing country in the world, China has a huge population and a great housing demand, especially against the backdrop of vigorously promoting national urbanization since 2000. On this basis, RED not only guarantees that the housing needs of urban residents can be met, but it has also become an important engine of China’s economic growth. However, although RED has the characteristics of high input and high output, it also has some defects, including resource redundancy and extensive development, suggesting that the problem of environmental damage caused by China’s RED is also aggravating day by day (Gong and Kong, 2022). According to the 2021 Research Report on Carbon Emissions of Chinese Real Estate Enterprises, China’s real estate industry ranks third globally in terms of carbon emissions, accounting for 40% of the national total carbon emissions. Furthermore, the country’s carbon emission intensity is more than twice the average of other industries, having seriously deviated from the eco-civilization construction advocated by state leaders. In September 2020, China set a strategic “Double-Carbon” goal (“carbon peak” by 2030 and “carbon neutralization” by 2060). Since then, low carbon and emission reduction have been high on the agenda of local governments (Zhang and Liu, 2022). Consequently, the coordination between RED and environmental protection has given impetus to the effective achievement of the “Double-Carbon” goal, and the key is to accurately grasp the interactions among resource consumption, socioeconomic output, and environmental pollution in the RED process.
The Yangtze River Economic Belt (YREB) is an area in China where copious properties are developed. According to the China Bureau of Statistics, the RED investment and added value of the real estate industry in YREB were 892.392 and 459.8 billion yuan in 2020, accounting for 46 and 43% of the national level, respectively. However, high-intensity RED has led to a surge in regional eco-environmental problems (Zhang et al., 2021). According to the 2018 Program for the Conservation of Aquatic Biodiversity in Key Areas, the percentage of endangered fish species caused by environmental degradation in the upper area of the Yangtze River accounted for 27.6% of the total number. The Bulletin of Soil and Water Conservation in the Yangtze River Basin (2020) also showed that the area of soil and water loss in YREB was as high as 389 000 km2 in 2020, accounting for 19% of the total area. Moreover, the deterioration of the ecological environment contributes to the widening of the development gap between regional cities in YREB. The China Statistical Yearbook of 2021 reported that the per capita GDP in areas along the lower reaches of YREB is 1.9 times that along the upper reaches, with the environmental degradation aggravating the development gap (Liu M. B. et al., 2022). On the basis of the aforementioned problems, this study attempts to explore the degree of coordination between the ecology of RED and ecological environment in YREB to reveal the spatial–temporal pattern and evolutionary characteristics of regional eco-efficiency of RED for promoting the high-quality development of the economic belt.
2 Literature review
Since the proposition of “eco-efficiency,” academic circles have continuously enriched and extended the concept and applied it to different research fields. Eco-efficiency has become an important indicator for measuring the level of eco-civilization construction. The higher the value of eco-efficiency, the higher the level of ecological development (Mavi et al., 2019). The academic research on eco-efficiency is mainly focused on its basic theory, measurement methods, and practical application. In terms of the basic theory, different organizations and scholars have offered different definitions of eco-efficiency. Eco-efficiency was first defined as a type of efficiency that can quantify the relationship between economic growth and environmental impact, and the ratio between them is used to characterize the eco-efficiency level (Yan and Tu, 2021). From a business perspective, the World Business Council for Sustainable Development has defined eco-efficiency as the ability of business firms to obtain maximum value and reduce emission levels with minimum resource input (Carvalhaes et al., 2017). The Organisation for Economic Cooperation and Development has extended the concept of eco-efficiency to industries, governments, and regions, and it views eco-efficiency as a coordinated relationship between environmental loss and maximization of human welfare (Polemis et al., 2021). The definitions of eco-efficiency vary across academic circles, but the basic idea is to regard eco-efficiency as the relationship among input, output, and environmental pollution (Lin et al., 2010). In terms of measurement method, early scholars used the simple ratio method to measure the eco-efficiency value (Huang and Wang, 2017; Liu et al., 2021). With the deepening of research, the measurement method of eco-efficiency has gradually transformed into the utilization of indicator evaluation and model methods, among other tools (Teng and Wu, 2014; Gudipudi et al., 2018). The simple ratio method usually adopts the ratio of economic value to environmental impact for characterizing eco-efficiency; however, it cannot depict the eco-efficiency variations across different environments, and the grades from the calculated results can hardly be distinguished (Zheng et al., 2017). The indicator evaluation method selects a number of indicators to evaluate eco-efficiency according to different research contents. Scholars usually select evaluation indicators based on resources, output, and pollution. Resource indicators mainly include water, electricity, manpower, among others (Moutinho et al., 2017; Coluccia et al., 2020). Output indicators mainly include GDP, enterprise income, industry output value, among others (Robaina-Alves et al., 2015; He et al., 2022). Pollution indicators mainly include wastewater, solid waste, carbon dioxide, among others (Yang et al., 2017; Huang and Hua, 2019). This method comprehensively considers all types of factors, but the indicator needs to be weighted, yet subjectivity is difficult to avoid; therefore, this method is seldom used at present (Wang et al., 2022). The model method mainly includes ecological footprint, data envelopment analysis (DEA), and the extended DEA model (Saling et al., 2005; Shao et al., 2019; Yang and Yang, 2019). Here, DEA and its derivative model are used to measure eco-efficiency based on different indicators. This method does not need to weigh the original indicator and can preserve the original data to a large extent; thus, it has become the mainstream model for measuring efficiency (Ning et al., 2018). In terms of practical application, scholars have conducted numerous research about eco-efficiency in different application fields, including agriculture (Van Grinsven et al., 2019; Chi et al., 2022), industry (Lin et al., 2019; Chen and Lin, 2020), and tourism (Liu et al., 2017; Peng et al., 2017). The study areas cover cities, regions, and countries, focusing mainly on the evaluation indicator design, spatial–temporal evolutionary characteristics, and influencing factors of eco-efficiency (Moutinho et al., 2018; Golas et al., 2020; Xu et al., 2021). In terms of the evaluation indicator design, scholars typically use data about resource consumption, economic output, and pollutant emissions for the characterization (Moutinho and Madaleno., 2021). In terms of the spatial–temporal evolutionary characteristics, scholars mainly analyze the change in eco-efficiency in terms of time and the distribution difference in space (Li et al., 2021). In terms of the influencing factors, scholars usually select the status of economic development, level of urbanization, and intensity of scientific and technological innovation as components of the eco-efficiency analysis system (Zhang, 2020).
The reviewed literature indicates that eco-efficiency can be used to characterize the interactive relationships among resource consumption, social economy, and environmental damage, which is highly consistent with the characteristics of RED. However, the current research on eco-efficiency is focused only on agriculture, industry, or tourism, whereas the literature about the impact of RED on environmental damage is dearth. The encroachment caused by RED on ecological lands in terms of environmental damage has been quantitatively evaluated, and the ecological carrying capacity of RED has been analyzed, but the other properties of RED (i.e., high input and high output characteristics) are hardly fully considered. Aiming to fill the aforementioned gaps, this study attempts to introduce “eco-efficiency” theory into RED.
On the basis of the analyses derived from the aforementioned research, the focus of this study can be summarized as follows. First, the theoretical connotation of the eco-efficiency of RED is comprehensively defined based on its constituent input, output, and pollution characteristics, and the eco-efficiency evaluation indicator system of RED is constructed. The Super-SBM model is employed to measure the eco-efficiency of RED in YREB from 2006 to 2020, and its spatial–temporal pattern distribution characteristics are evaluated. Second, this research studies the spatial clustering characteristics after measuring the eco-efficiency of RED. Global and local spatial autocorrelation models are used to test the spatial spillover effects of the eco-efficiency of RED in the entire area of YREB and between some cities in the economic belt. Finally, this study presents the evolutionary characteristics of the eco-efficiency of RED and uses the traditional and spatial Markov chain models to explore whether the spatial spillover effect will impact the evolution of such eco-efficiency. On the basis of the research results, this study proposes the basic strategies of energy saving and emission reduction for RED in YREB.
3 Theoretical connotation and indicator construction
3.1 Theoretical connotation
Eco-efficiency hinges on the measurement of the relationship among input, expected output, and unexpected output; in other words, the degree of interaction in the “resource–social economy–environment” system is evaluated (Liu S. G. et al., 2022). The differences in the connotation of eco-efficiency across different research fields lie in the varying interpretations of input, expected output, and unexpected output. On the basis of the resource–social economy–environment system, combined with the characteristics of RED, this study designs the theoretical framework of the eco-efficiency of RED (Figure 1).
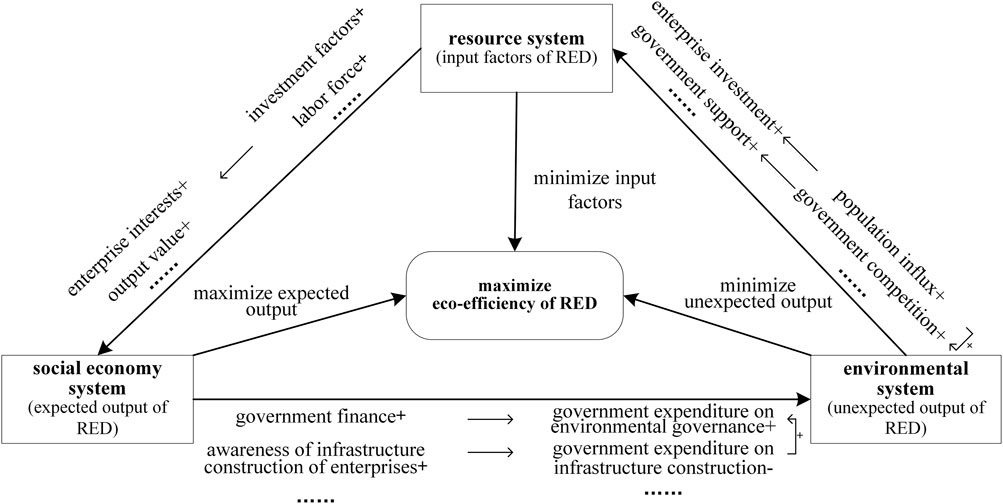
FIGURE 1. Connotation mechanism of the eco-efficiency of RED.
RED is one of the driving forces of China’s economic growth, and it is hoped that the maximum expected output per unit of resource input can be achieved while minimizing the degree of pollution to the ecological environment. In essence, the aim is to pursue the coordination and unity of socioeconomic development and ecological environment, which is consistent with the idea of eco-efficiency. Therefore, this study defines the theoretical connotation of the eco-efficiency of RED in accordance with the resource–social economy–environment system. Given the profit-seeking nature of enterprises, an increase in RED input usually leads to an increase in RED expected output, which generally includes enterprise interest, industry output value, and employees’ salary. Under the condition of increasing output, the financial revenue of the local government can be reinforced, and the methods of increasing financial revenue generally rise with much higher land transfer fees, corporate taxes, and personal taxes (Park and Kim, 2016). The increase in government revenue further leads to more financial support for environmental improvement (Ge et al., 2021). In addition, some RED companies may spontaneously improve the infrastructure around an eco-efficiency-related project (Li and Deng, 2015), thus saving the government’s financial funds for infrastructure construction (i.e., some of the savings may be used for environmental improvement). Local infrastructure and environmental improvement may also lead to population inflow, thus promoting local market consumption and housing demand (Jacobs-Crisioni et al., 2016; Panter et al., 2017). RED enterprises and the government are the beneficiaries; RED enterprises may increase the investment to meet market demand, while the government is expected to support local RED enterprises (Cai et al., 2018). The key to achieving the above interaction is to reduce the excessive loss brought about by RED to the ecological environment while finding a reasonable layout of RED resources, thus achieving a win–win situation with socioeconomic and eco-environmental benefits.
3.2 Indicator construction
On the basis of the theory of the eco-efficiency of RED, this study constructs the corresponding eco-efficiency evaluation indicator system by referring to the methods of existing research (Zhang et al., 2016; Yuan and Yin, 2020), and the specific indicators are shown in Table 1. In terms of input factors, the number of employees in RED, investments completed in RED, and building construction area are selected to characterize the input of labor, economy, and material resources, respectively. In terms of expected output, the value of completed houses and house sales are selected to characterize economic benefits. According to the principle of measurability, some new indicators are added. For instance, the salary of employees in RED is used to characterize social benefits, and the house completion rate and non-vacancy rate of houses are used to characterize the technical benefits1. The reasons for the new indicators can be described as follows. The expected output level of RED is closely related to the local economic level, labor quality, development technology, among others. In general, the local economic level, quality of employees, and development technology are positively correlated with the expected output value of RED. The higher the level of these three parameters, the higher the expected output value of RED. To a certain extent, the salary of employees in RED can be used to reflect the local economic level and labor quality and characterize the social benefits. Meanwhile, the house completion rate and non-vacancy rate of houses reflect the selling ability of RED, and they can be used to characterize the technical benefits. In terms of unexpected output, the existing research lacks quantitative indicators for measuring the environmental pollution degree caused by RED. Ecological footprint is one of the important indicators for evaluating the degree of environmental pollution, and it has been widely used in various research fields (Zafar et al., 2019). Therefore, this study introduces ecological footprint into the whole cycle of RED to measure the ecological footprint of directly occupied ecological lands, building materials, and construction waste in the RED process and subsequently characterize the environmental damage degree caused by RED2. The calculation process of the ecological footprint of RED has been elaborated by Wang (2013) and Gonzalez-Vallejo et al. (2015).
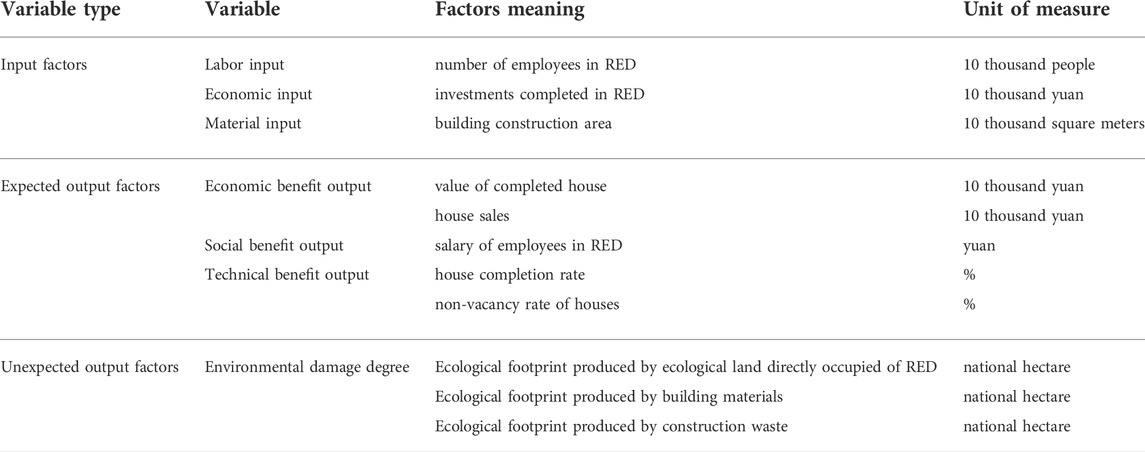
TABLE 1. Evaluation indicator system of the eco-efficiency of RED.
4 Research methods and data sources
4.1 Super-SBM model
The Super-SBM model is a scientific evaluation method adopted by scholars to improve the traditional DEA model according to practical experience, and it has been widely used for ensuring efficiency measurement in various fields. Compared with the traditional DEA model, the Super-SBM model has the following advantages: 1) the unexpected output in the ecological process of RED is included in the evaluation indicator system to demonstrate the true value of the eco-efficiency of RED in a more accurate manner; 2) the slack variable in the efficiency measurement is considered, and the problem of measurement deviation caused by radial and angular differences is addressed; and 3) the efficiency value can be set to greater than 1 as a means of solving the sorting problem that tends to ignore multiple evaluation units with efficiency values of 1 (Liu et al., 2019). Therefore, this study uses the Super-SBM model to measure the eco-efficiency of RED by presetting the variable returns to scale (VRS) for the model constraint. The specific principle can be summarized as follows.
A total of n evaluation units are preset. Here, x and y represent the input and output variables, respectively (ye and yne represent the expected and unexpected output, respectively), and a and b represent the number of input and output variables, respectively (b1 and b2 represent the number of expected and unexpected output variables respectively, i.e.,
where n evaluation units (cities) exist by default;
4.2 Spatial autocorrelation model
Spatial autocorrelation analysis is the mainstream evaluation method used to describe spatial correlation and spatial heterogeneity, including global spatial autocorrelation and local spatial autocorrelation (Fan et al., 2022). Global spatial autocorrelation can be used to judge the spatial correlation characteristics of the eco-efficiency of RED from a global perspective. It can be depicted by global Moran’s I, and the specific expression is given by
where
Global spatial autocorrelation can only reflect the average correlation or difference in the degree of the eco-efficiency of RED in the whole space, but it cannot reflect the specific characteristics of local spatial clustering or differentiation. Nonetheless, local spatial autocorrelation analysis can overcome this deficiency. Therefore, this study uses local Moran’s I to analyze the local spatial correlation effect of the eco-efficiency of RED. The specific expression is given by
where Il represents local Moran’s I. If Il > 0, then the areas with similar values for the eco-efficiency of RED are adjacent to each other, and the local space has high–high (H-H) or low–low (L-L) cluster characteristics. If Il < 0, then the areas with different values for the eco-efficiency of RED are adjacent to each other, and the local space has “high–low” or “low–high” cluster characteristics.
4.3 Markov chain model
This research covers the period between 2006 and 2020, which spans China’s 11th, 12th, and 13th Five-Year Plans. RED is closely related to market supply and demand, government orientation, and technology, depicting obvious inaccuracies and uncertainties, suggesting that the evolutionary characteristics of the eco-efficiency of RED should be a primary focus. The Markov chain model is used to determine the changing trend of all state types of objects through initial probability and mutual transfer probability. This model is often used in environmental science to analyze the dynamic spatial–temporal evolutionary characteristics of objects (Agovino et al., 2019). Here, the traditional Markov chain model is used to construct an N×N Markov probability transfer matrix based on the eco-efficiency of RED and subsequently explore the dynamic evolutionary characteristics of the eco-efficiency of RED in YREB. In particular, Pij is set as the probability that the eco-efficiency of RED in a city can be transferred from state Ei in year t to state Ej in year t+1, and the transfer frequency can be used to represent the transfer probability of the eco-efficiency of RED. The specific expression is given by
where nij represents the total number of cities at level i to level j when the eco-efficiency of RED is transferred from state Ei to state
The spatial Markov chain introduces “spatial lag” into the Markov probability transfer matrix based on the traditional Markov chain. This parameter is used to explore the influence of the same attribute value of adjacent objects in geographical space. By setting the spatial weight matrix, the N×N Markov probability transfer matrix can be decomposed into an N×N×N probability transfer matrix. Then,
where Lag represents the spatial lag value of the evaluation unit
4.4 Overview of the study area
YREB spans the eastern, central, and western parts of China, covering 11 provinces, including Shanghai, Jiangsu, Zhejiang, Anhui, Jiangxi, Hubei, Hunan, Chongqing, Sichuan, Yunnan, and Guizhou. These provinces account for 21.4% of the land area of China. YREB is one of the regions with the greatest comprehensive strength and the greatest strategic support in the country, and it is also one of the regions with the most highly developed real estate industry. According to the China Bureau of Statistics, in 2020, the RED investment and real estate value added in YREB accounted for 46 and 43% of China’s total value, respectively. Furthermore, the average prices of commercial housing in Shanghai, Jiangsu, and Zhejiang were higher than 10 000 yuan/m2 (i.e., the average price of commercial housing was higher than 10 000 yuan in only eight provinces in China). The average prices of commercial housing in four provinces in YREB also ranked among the top 10 in China. However, the development of the local real estate industry aggravated the resource depletion and even has continuously posed an enormous impact on the local ecological environment. Moreover, in 2020, the total energy consumption of the real estate industry in YREB was 93.2 million t of standard coal, and the total consumption of coal reached 6.39 million t. Nonetheless, the real estate industry in YREB greatly promoted the development of its affiliated industries, leading to a surge in energy consumption. For example, the total energy consumption in the furniture manufacturing industry reached 3.93 million t of standard coal. Therefore, aiming to respond to the call for eco-priority and green development implemented via the Outline of the Development Plan of the YREB, we must correctly understand the coupling and coordination between RED and ecological environmental protection and strive to realize the regional eco-civilization construction. On this basis, this study selected 108 prefecture-level cities in YREB as the research object (Figure 2). Then, according to the classification standard of the China Bureau of Statistics, the selected cities were divided into three major areas: those areas along the upper reaches of YREB (31 cities in Chongqing, Sichuan, Guizhou, and Yunnan), those areas along the middle reaches of YREB (36 cities in Jiangxi, Hubei, and Hunan), and those areas along the lower reaches of YREB (41 cities in Shanghai, Jiangsu, Zhejiang, and Anhui).
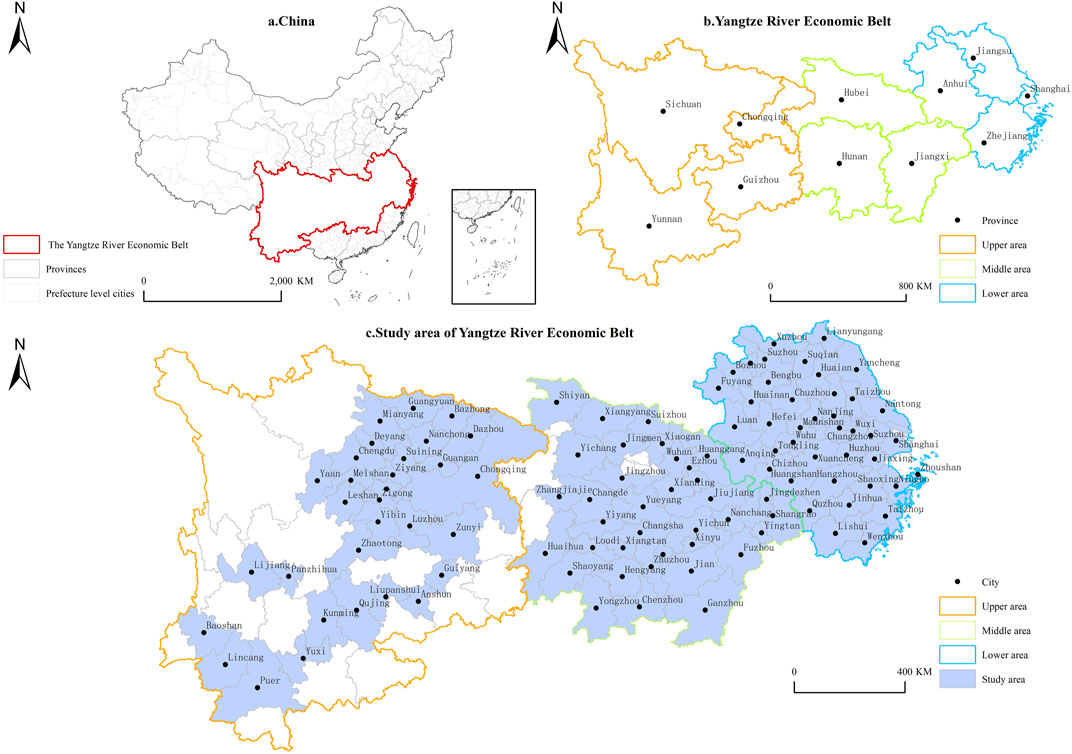
FIGURE 2. The geographical location of study area.
4.5 Data sources
RED is closely related to national policy, depicting obvious periodicity. Thus, this study took the 5-year plan period of China’s national economic and social development as a cycle. The study period of 2006–2020 was set according to the principle of data availability, covering the 11th, 12th and 13th Five-Year Plan periods. The data were retrieved from the China Statistical Yearbook, China Urban Statistical Yearbook, China Regional Economic Statistical Yearbook, China Real Estate Statistical Yearbook, and provincial and municipal statistical yearbooks. Some of the original data on unexpected outputs were obtained from the Ministry of Housing and Urban-Rural Development of the People’s Republic of China and the provincial and municipal natural resource departments. The missing data were filled by means of either application for disclosure or interpolation.
5 Analysis of empirical results
5.1 Temporal evolutionary characteristics of the eco-efficiency of RED
5.1.1 Overall temporal evolutionary characteristics
In this study, VRS was used to produce the production technology constraints on the Super-SBM model, and MATLABR 2018 was used to measure the eco-efficiency of RED in YREB from 2006 to 2020 (Figure 3). On the basis of the quartile division standard (25, 50, and 75%), the eco-efficiency of RED in YREB was divided into four levels: low efficiency, medium efficiency, high efficiency, and very high efficiency.
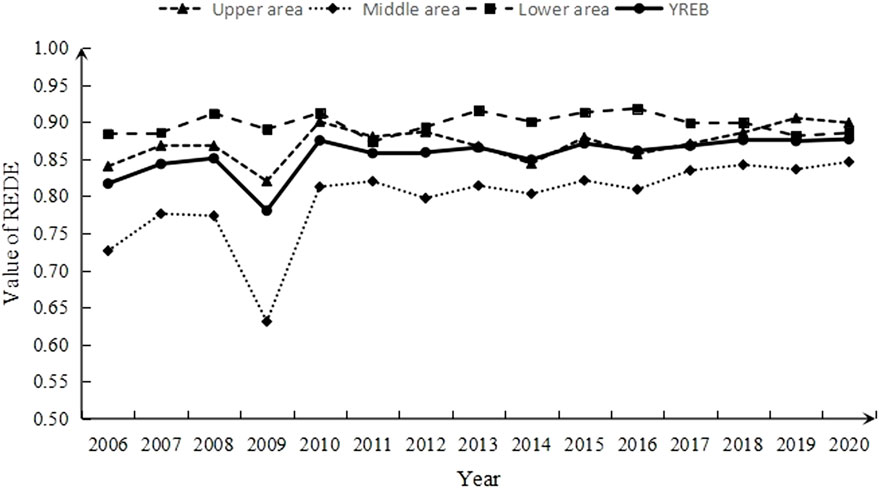
FIGURE 3. Change trend of the eco-efficiency of RED in the study region from 2006 to 2020.
Overall, the eco-efficiency of RED in YREB presented an increasing trend at the medium level from 2006 to 2020. In the time domain of the study, the eco-efficiency of RED fluctuated slightly in the range of 0.78–0.88, with an overall increase of 7.3%. Therefore, in the process of rapid urbanization, the RED in YREB gradually formed a highly efficient and green development model and realized the transformation from manual development to mechanized development and from traditional cast-in-place buildings to prefabricated buildings. These scenarios helped to improve the ratio among input, expected output, and unexpected output3 and achieve a coordinated development of RED and ecological protection. However, redundant input, insufficient expected output, and widespread environmental pollution, among other problems, still exist at the present stage.
5.1.2 Local temporal evolutionary characteristics
From a local point of view, the average annual eco-efficiency of RED in YREB takes the order of lower area > upper area > middle area.
The annual average eco-efficiency of RED in the lower area was 0.90, and the corresponding areas always manifested a leading position in YREB. This phenomenon can be simply ascribed to the developed local real estate industry. However, the eco-efficiency level in the upper area at the later stage of the study period was exceeded by that in the lower area. In terms of the growth trend, the average annual growth rate of the eco-efficiency of RED in the lower area was the lowest, which is similar to the conclusion of Jin et al. (2018). A possible reason is that this region is the leader of RED in YREB. In the early study period, the RED in this region flourished against the backdrop of rapid urbanization in China, and the expected output scale of RED held a safe lead, resulting in a high eco-efficiency of RED in this region. In the later stage of the study period (especially with the implementation of the policy of “houses are for living in, not for speculation”), the limitation of RED weakened the advantage of expected output in the lower area. In addition, the regional ecological environment was seriously damaged, and the resource endowment was poorer than that in the upper area, causing a failure in further improving the eco-efficiency of RED.
The annual average eco-efficiency of RED was 0.87 in the upper area, and it increased at the end of the study period. From 2006 to 2020, the eco-efficiency of RED in the upper area increased from 0.84 to 0.90, realizing the transformation from a medium level to a high level, possibly because most of these areas presented better eco-environmental quality and resource endowment, and tourism economy had a positive effect on eco-environmental protection. The local governments attached great importance to the loss of ecological environment caused by RED and consequently introduced several policies and measures for energy conservation and emission reduction in RED. Chongqing revised and issued the Technical Standard for the Construction of Green Ecological Housing (Green Building); the State Council issued the Experimental Plan for National Eco-civilization Experimental Zone (Guizhou); and Sichuan and Yunnan successively issued the Sichuan Green Building Action Implementation Plan the Yunnan Green Building Innovation Action Implementation Plan, among others. These policy measures helped to balance the ratio among input, expected output, and unexpected output of RED in the area4.
The gap in the eco-efficiency of RED between the middle area and the other two areas was narrowed. From 2006 to 2020, the difference in eco-efficiency of RED decreased from 0.60 to 0.05. This trend can be explained by the middle area encompassing all major agricultural provinces, focusing on the development of the agricultural economy, albeit the real estate industry was insufficiently developed in the early study period, but the ecological advantages of RED gradually loomed owing to the resource endowment conditions and the transformation of the industrial structure in the late study period. The proportion of added value of the primary industry in the middle area decreased from 16% in 2006 to 9% in 2020, whereas the proportion of added value of the real estate industry increased from 4% in 2006 to 8% in2020. Clearly, the gap in the eco-efficiency level of RED between the middle area and the other two areas gradually narrowed.
5.2 Spatial evolutionary characteristics of the eco-efficiency of RED
5.2.1 Overall spatial evolutionary characteristics
Using the spatial analysis module of Geoda, this study selected four time points (2006, 2011, 2016, and 2020) to explore the spatial autocorrelation in the eco-efficiency of RED in YREB (Table 2).
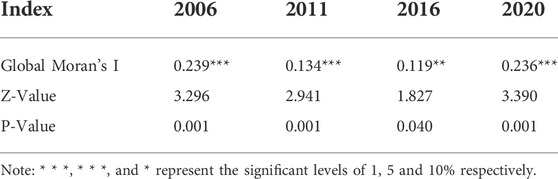
TABLE 2. Global Moran’s I of the eco-efficiency of RED in the study area.
As shown in Table 2, the global Moran’s I of the four time points is greater than 0 and passes the significance test at 5% or higher, indicating a significant positive spatial autocorrelation in the eco-efficiency of RED in YREB. Thus, the distribution of eco-efficiency of urban RED in geographical space has non-randomized characteristics. In the early stage, the global Moran’s I of the eco-efficiency of RED continues to decline; after 2016, an increasing trend can be observed, indicating that the eco-efficiency of RED in YREB has a spatial evolution trend from weak correlation to strong correlation. This trend can be attributed to the great differences in RED among cities in the early stage. However, the differences in the later stage appear to be reduced, which can be attributed to the process of urbanization in China. RED showed obvious sequential characteristics. Even at the early stage, the scale of RED in the developed cities was larger than those of their neighboring less-developed cities, and the circulation of RED factors among the cities was insufficient, leading to a low spatial autocorrelation of the regional eco-efficiency of RED. With the deepening of urbanization, the RED differences among cities were gradually reduced, especially with the implementation of the 13th Five-Year Plan and the Outline of Development Plan for YREB in 2016, and the overall degree of regional development was further improved. In the context of gradually saturated housing demand in the developed cities, RED enterprises started to shift their focus to less developed cities, consequently promoting the flow of factors of RED and increasing the spatial spillover effect of the regional eco-efficiency of RED. In the future, against the backdrop of “Double-Carbon” goal, local governments and RED enterprises in the selected cities attempted to strengthen their exchanges with neighboring cities as a means of fully maximizing the driving effect of high-efficiency cities.
5.2.2 Local spatial evolutionary characteristics
The local spatial autocorrelation model was used to analyze the local evolutionary characteristics of the eco-efficiency of RED. LISA cluster diagrams of the eco-efficiency of RED in YREB in 2006, 2011, 2016, and 2020 were drawn (Figure 4). As shown in Figure 4, the eco-efficiency of RED in YREB presents a significant difference in terms of spatial distribution. In particular, the clustering of cities with high (low) eco-efficiency of RED in terms of geographical space constantly changes over time.
1) In terms of the eco-efficiency of RED in 2006, the H-H and L-L cluster areas showed spatial patterns of single-core clustering and point distribution. The H-H single-core cluster is mainly distributed in eight cities in the east of Jiangsu Province, and the point distribution pattern is mainly distributed in the west of the study area, including Panzhihua and Deyang in Sichuan Province, Yuxi and Lincang in Yunnan Province. By contrast, the L-L single-core cluster is mainly distributed in eight cities in Hunan Province, and the point distribution pattern is composed of Anshun in Guizhou Province and Fuyang in Anhui Province.
2) In terms of the eco-efficiency of RED in 2011, the H-H cluster and L-L cluster areas showed spatial patterns of dual-core and single-core clustering, respectively. The first H-H cluster point further spread to the south of Jiangsu Province with respect to the data for 2006, and four new cities (Huaian and Zhenjiang in Jiangsu Province, Huizhou in Zhejiang Province, and Shanghai) were added. The second H-H cluster point is composed of two cities (Liupanshui and Anshun in Guizhou Province). By contrast, the L-L single-core cluster shifted northward from eight cities in southern Hunan Province in 2006 to six cities in northern Hunan Province and western Hubei Province.
3) In terms of the eco-efficiency of RED in 2016, the H-H cluster areas continued to expand outward, whereas the L-L cluster areas underwent a dispersed spatial distribution. The H-H cluster areas further expanded, from southeastern Jiangsu Province as the core, in 2011, covering 17 cities in Sichuan, Shanghai, Jiangsu, Zhejiang, and Anhui. This pattern indicates that the H-H cluster effect was enhanced. By contrast, the L-L cluster areas showed characteristics of dispersion from the central areas to the surrounding areas, but the number of cities remained unchanged compared with that in 2011.
4) In terms of the eco-efficiency of RED in 2020, the cities in the H-H cluster areas continued to increase, and the L-L cluster areas converged to the north of YREB. The H-H cluster areas shifted downwards with respect to data for 2016, and the cluster scale was further expanded, covering 20 cities in Sichuan, Shanghai, Jiangsu, Hubei, Zhejiang, Jiangxi, and Hunan. By contrast, the L-L cluster areas were generally located in the north of YREB, mainly covering 12 cities in Hubei, Guizhou, and Anhui.
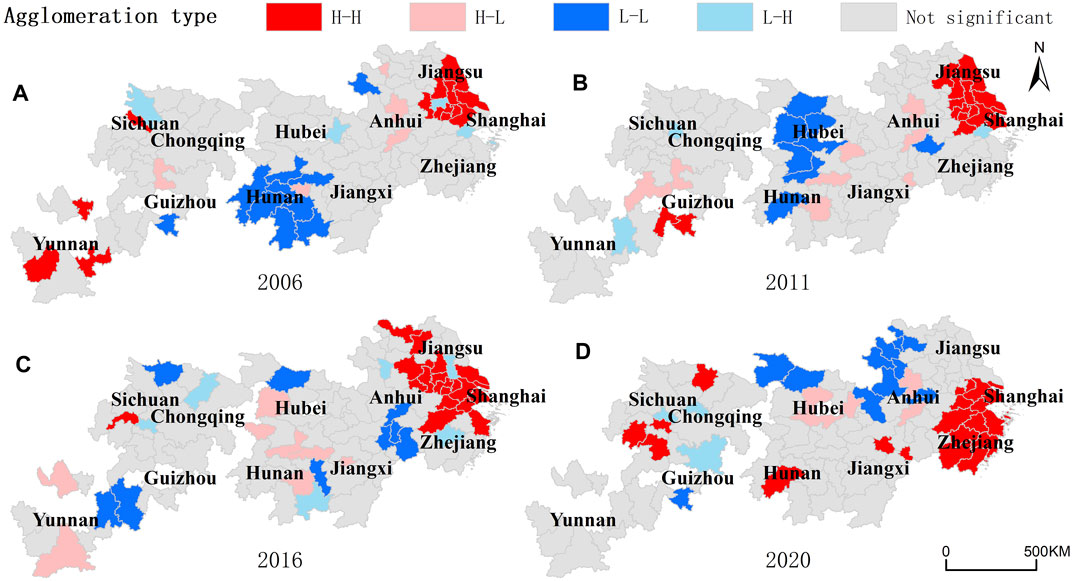
FIGURE 4. LISA cluster diagrams of the eco-efficiency of RED in the study area.
In summary, regarding the eco-efficiency of RED in YREB from 2006 to 2020, the H-H cluster areas showed the characteristics of cluster point expansion and transfer. The cities in the H-H cluster areas increased year by year, from 12 cities in 2006 to 20 cities in 2020, with a growth rate of 67%. This feature indicates that the RED funds, labor, equipment and materials, development technology, and policy measures in the H-H cluster areas played significant driving roles, and the circulation of production factors among the neighboring cities was dense, thus promoting the eco-efficiency level of RED in the underdeveloped cities. Meanwhile, the L-L cluster areas showed the characteristics of small-scale diffusion, indicating a weakening of the clustering effect. However, the number of clustered cities was stable, indicating that the negative spatial spillover effect of YREB was not weakened in the study period.
5.3 Markov chain analysis of the eco-efficiency of RED
5.3.1 Traditional markov chain analysis
The eco-efficiency of RED in 108 cities at the prefecture or above levels from 2006 to 2020 was divided into types based on the quartile division standard: Ⅰ, Ⅱ, Ⅲ, and Ⅳ. The higher the value of each type, the higher the eco-efficiency of RED. The probability transfer matrix based on traditional Markov chain analysis is shown in Table 3.
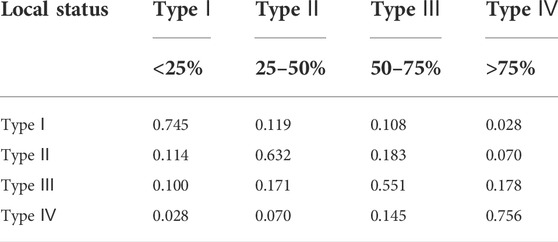
TABLE 3. Traditional Markov chain probability transfer matrix of the eco-efficiency of RED in the study area.
As shown in Table 3, the eco-efficiency of RED in YREB has the characteristics of maintaining stability of the original state, and “club convergence” is apparent in the extreme value. Cross-stage transfer in the short term is difficult to achieve, and the risk of transfer to a low state is low. First, in terms of state preservation, the probability of the four state types on the diagonal is higher than that on the non-diagonal, and the minimum value is 0.551. In other words, at least 55.1% of the eco-efficiency of RED will likely remain stable in the future evolution process. Second, in terms of extreme convergence, the probability of the eco-efficiency of RED at both ends of the diagonal is higher than that in the middle, and the probability is in the order of
5.3.2 Spatial markov chain analysis
According to the spatial autocorrelation analysis, the eco-efficiency of RED in YREB has significant spatial cluster characteristics. Subsequently, the spatial weight matrix based on geographical distance was introduced into the traditional Markov chain, and the spatial Markov chain probability transfer matrix was constructed based on the spatial lag type of each city in the initial year (Table 4). By comparing the transfer probabilities of Tables 3, 4, the following spatial evolutionary characteristics can be obtained:
1) The spatial spillover effect significantly affects the dynamic evolution process of the eco-efficiency of RED. In the context of differences in the eco-efficiencies of RED among neighboring areas, the probability of transfer of these eco-efficiencies in YREB differs from those measured by the traditional Markov chain. For example, in the traditional Markov chain probability transfer matrix, the probability of transfer from type Ⅲ to type IV is the highest [
2) The spatial spillover effect has an important influence on the dynamic transfer of the eco-efficiency of RED. When a city is adjacent to another city with a high eco-efficiency of RED, the probability of transfer of the eco-efficiency of RED to a high state increases. By contrast, when a city is adjacent to another city with low eco-efficiency of RED, the probability of transfer to the low state increases. For example, in the context of high eco-efficiency of RED,
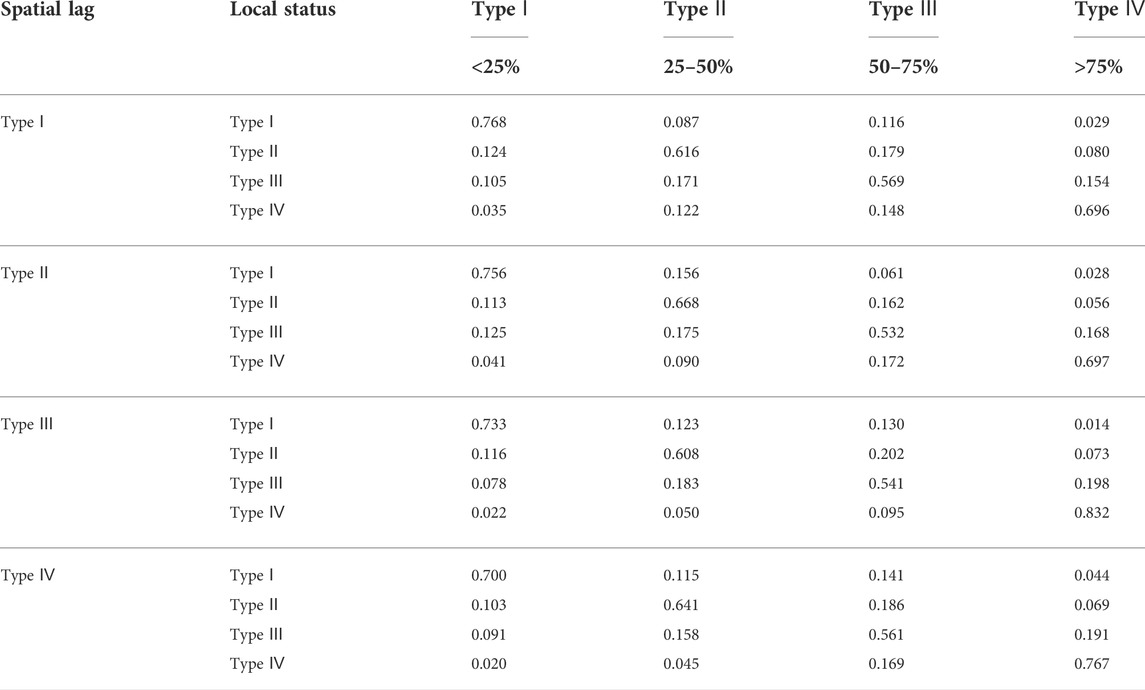
TABLE 4. Markov chain probability transition matrix of the eco-efficiency of RED in the study area.
The above mentioned evolutionary characteristics indicate that when driven by positive and negative spatial spillover effects, the eco-efficiency of RED gradually forms H-H and L-L club convergence in the geographical space of YREB. In accordance with the notion of the eco-efficiency of RED, this parameter is the result of interactions in the combined resource–social economy–environment system, with the resource system acting as the dominant factor. RED investment depends on the direct investment of real estate enterprises and is greatly affected by the influence of government behavior towards enterprises. Therefore, the spatial spillover effect of the eco-efficiency of RED can be viewed as the concrete manifestation of the spatial spillover effect of the real estate enterprises’ investment behavior and the government behavior.
With the improvement of urbanization rate and economic openness and the continuous development of informatization and urban infrastructure, the flow of factors among cities is accelerated. This phenomenon suggests that cities in YREB can obtain the investment experience of other cities, especially the neighboring ones, and consequently adjust the required RED investment behavior and industrial structure. In addition, the effect of government competition can also prompt local governments to adopt favorable low carbon and emission reduction policies to benefit RED, and they may be implemented to local RED enterprises as a means of increasing fiscal revenue and enhancing government achievements. Therefore, driven by the investment behavior of real estate enterprises and government behavior, YREB has gradually formed H-H (L-L) cluster areas in terms of eco-efficiency.
6 Conclusion and discussion
6.1 Conclusion
The RED panel data of 108 cities at the prefecture or above levels in YREB were analyzed, with the research period set from 2006 to 2020. Then, the theoretical notion of the eco-efficiency of RED was defined, and the evaluation indicator system was constructed. Finally, the Super-SBM model was used to measure the eco-efficiency of RED, and the spatial spillover effects and evolution trends of this parameter was determined using the spatial autocorrelation model and the Markov chain model, respectively. The following conclusions can be drawn:
1) In terms of the temporal evolutionary characteristics, the eco-efficiency of RED in YREB presented an increasing trend at the medium level from 2006 to 2020. The average annual eco-efficiency of RED in YREB from 2006 to 2020 takes the following order: lower area > upper area > middle area. The differences in eco-efficiencies across the different regions appeared to gradually narrow.
2) In terms of the spatial evolutionary characteristics, a significant positive spatial autocorrelation was observed for the eco-efficiency of RED in the study area. The degree of spatial autocorrelation presented the characteristics of “falling first and then rising.” In terms of the eco-efficiency of RED, the H-H cluster showed a trend of expansion and transfer, whereas the L-L cluster showed a trend of small-scale diffusion.
3) In terms of the transfer trend characteristics, club convergence was apparent for the eco-efficiency of regional RED. Furthermore, achieving a cross-stage transfer in the short term was difficult, and a low risk of transfer to a low state was established. The spatial spillover effect played an important role in the process of eco-efficiency transfer of RED, and the assimilation effect caused by the spatial spillover effect was significant.
6.2 Discussion
The results depict regional differences and varying spatial spillover effects in the eco-efficiency of RED in YREB. Furthermore, the spatial spillover effects intensified the club convergence of the eco-efficiency of RED. From a practical point of view, the RED behavior of enterprises and the role of the government are the realistic ways for achieving the spatial spillover effect. Therefore, knowing how to successfully exert the spatial spillover effect of high-efficiency cities from these two factors (i.e., behavior and role of enterprises and government) is central in narrowing the regional differences in the eco-efficiency of RED, and they can even determine the improvement in the overall eco-efficiency of YREB. Besides the disparities in urbanization levels and housing demands across the cities, differences are also apparent in the growth and development scales of the varying real estate industries in those cities in the early stage. However, as China’s urbanization is nearing the last phase, both government control and housing demand saturation can slow down the growth of RED (Liu et al., 2018), especially in the developed cities (Cai et al., 2020). These phenomena have led to the apparent narrowing of the regional differences in RED. Thus, apart from allocating RED resources, enterprises and government bodies should also reduce RED-induced pollution from the eco-environmental protection perspective. On the basis of the above mentioned discussions, this study proposes the following policy recommendations:
1) The RED model must be actively transformed in low-efficiency cities, and the circulation of RED factors between high-efficiency and low-efficiency cities should be increased. First, RED enterprises should actively explore the development of energy saving and emission reduction technologies, such as “prefabricated” buildings, AI development, and green building materials. Second, the circulation of RED factors should be increased between low- and high-efficiency cities. In particular, local governments should encourage RED employees to strengthen exchange and learning, and they can also guide local enterprises to pursue cooperative development with non-local enterprises as a means of learning advanced development experience. Finally, RED information sharing among cities should be realized by building a real estate carbon trading market and RED project information management system. In this manner, resource allocation and pollutant release information about the same or similar RED projects in high-efficiency areas can be mastered.
2) High-efficiency cities should further enhance the environmental protection awareness of RED enterprises. On the one hand, local governments can establish a RED incentive system based on eco-environmental protection (i.e., evaluating RED enterprises according to pollutant discharge and rewarding successful enterprises by means of financial support, tax incentives, and licensing) to alter the extensive construction and development behavior of local RED enterprises. On the other hand, local governments can establish a tiered pricing strategy for RED pollution (i.e., charging according to different levels and scales of pollutant release from RED projects) to enhance the consciousness towards low-carbon development of RED enterprises.
Although this study has deeply analyzed the spatial–temporal evolution pattern of the eco-efficiency of RED, two points remain worth discussing.
1) The unexpected output in this study only considered the ecological footprint of RED. Against the backdrop of the “Double-Carbon” goal, future researchers may calculate carbon emission by referring to the building materials consumed by RED in the various cities in YREB. Carbon dioxide produced by a new RED may also be used to characterize the unexpected output, and it is an accurate measurement of the eco-efficiency of RED.
2) This study only expounded the influence mechanism and transfer path of the eco-efficiency of RED in YREB under the spatial spillover effect. Future researchers can further quantify the influence of the spatial spillover effect on the eco-efficiency of urban RED by means of empirical analysis. Finally, this study only determined the spatial spillover effect at the city level, but this topic can be further discussed in depth at the county or lower levels in the future.
Data availability statement
The data presented in this study are available on request from China social and economic data research database, the National Bureau of statistics and the Bureau of housing and urban rural development, further inquires can be directed to the corresponding author.
Author contributions
ZF wrote the original draft preparation. YQ designed the model and conducted empirical research. ZD verified the analytical methods. JP is responsible for literature sorting and data collection. All authors discussed the results and contributed to the final manuscript. All authors have read and agreed to the published version of the manuscript.
Funding
This work was supported by the National Natural Science Foundations of China (71763010), Jiangxi Provincial Social science “14th Five-year” plan project (21YJ05) and the Special fund project for postgraduate innovation in Jiangxi Province in 2022 (YC2022—s239).
Conflict of interest
The authors declare that the research was conducted in the absence of any commercial or financial relationships that could be construed as a potential conflict of interest.
Publisher’s note
All claims expressed in this article are solely those of the authors and do not necessarily represent those of their affiliated organizations, or those of the publisher, the editors and the reviewers. Any product that may be evaluated in this article, or claim that may be made by its manufacturer, is not guaranteed or endorsed by the publisher.
Abbreviations
RED, represents real estate development; YREB, represents Yangtze River Economic Belt.
Footnotes
1This research uses the perpetual inventory method to process the investment completed in RED. The non-vacancy rate of houses is calculated from the area of commercial housing sold and the area of commercial housing to be sold for 3 years or more.
2This research takes “national hectare” (nha) as the measurement unit of ecological footprint. With regard to the calculation of ecological footprint of the ecological land directly occupied, the land area is calculated by the average plot ratio of residential housing (1.55) and the average plot ratio of office building and housing for commercial use (1.65), respectively, according to the project announced by the provincial and municipal land and resources departments in YREB.
3In 2020, the number of employees, completed investments, and area of building construction with respect to RED in YREB decreased by 67%, −41.7%, and −31.8%, respectively, compared with those in 2006. The value of completed houses, house sales, and salary of employees with respect to RED, house completion rate, and non-vacancy rate of houses increased by 340, 808, 267, 64%, and −5%, respectively, compared with those in 2006. The ecological footprint increased by 46% compared with that in 2006.
4Data source: China Statistical Yearbook.
References
Agovino, M., Crociata, A., and Sacco, P. L. (2019). Proximity effects in obesity rates in the us: A spatial Markov chains approach. Soc. Sci. Med. 220, 301–311. doi:10.1016/j.socscimed.2018.11.013
BERCTU (2016). China building energy use 2016. Beijing, China: Tsinghua University. Available at: https://www.researchgate.net/publication/318106589_China_Building_Energy_Use_2016.
Cai, Y., Feng, W., and Shen, K. (2018). Fiscal implications of population aging and social sector expenditure in China. Popul. Dev. Rev. 44 (4), 811–831. doi:10.1111/padr.12206
Cai, Z. Y., Liu, Q., and Cao, S. X. (2020). Real estate supports rapid development of China's urbanization. Land Use Policy 95, 104582. doi:10.1016/j.landusepol.2020.104582
Carvalhaes, B. B., Rosa, R. D., D'agosto, M. D., and Ribeiro, G. M. (2017). A method to measure the eco-efficiency of diesel locomotive[J]. Transp. Res. Part D-Transport Environ. 51, 29–42. doi:10.1016/j.trd.2016.11.031
Chen, X., and Lin, B. Q. (2020). Assessment of eco-efficiency change considering energy and environment: A study of China’s non-ferrous metals industry. J. Clean. Prod. 2020, 123388. doi:10.1016/j.jclepro.2020.123388
Chi, M. J., Guo, Q. Y., Mi, L. C., Wang, G., and Song, W. (2022). Spatial distribution of agricultural eco-efficiency and agriculture high-quality development in China. Land 11 (5), 722. doi:10.3390/land11050722
Coluccia, B., Valente, D., Fusco, G., De Leo, F., and Porrini, D. (2020). Assessing agricultural eco-efficiency in Italian Regions. Ecol. Indic. 116, 106483. doi:10.1016/j.ecolind.2020.106483
Dall’o’, G., Galante, A., and Pasetti, G. (2012). A methodology for evaluating the potential energy savings of retrofitting residential building stocks. Sustain. Cities Soc. 4, 12–21. doi:10.1016/j.scs.2012.01.004
Fan, Z. G., Deng, C., Fan, Y. Q., Zhang, P., and Lu, H. (2022). Spatial-temporal pattern and evolution trend of the cultivated land use eco-efficiency in the national pilot Zone for ecological conservation in China. Int. J. Environ. Res. Public Health 19 (1), 111. doi:10.3390/ijerph19010111
Ge, T., Hao, X. L., and Li, J. Y. (2021). Effects of public participation on environmental governance in China: A spatial durbin econometric analysis. J. Clean. Prod. 2021, 129042. doi:10.1016/j.jclepro.2021.129042
Golas, M., Sulewski, P., Was, A., Kloczko-Gajewska, A., and Pogodzinska, K. (2020). On the way to sustainable agriculture—eco-efficiency of polish commercial farms. Agriculture 10 (10), 438. doi:10.3390/agriculture10100438
Gong, W. Q., and Kong, Y. (2022). Nonlinear influence of Chinese real estate development on environmental pollution: New evidence from spatial econometric model. Int. J. Environ. Res. Public Health 19 (1), 588. doi:10.3390/ijerph19010588
Gonzalez-Vallejo, P., Marrero, M., and Solis-Guzman, J. (2015). The ecological footprint of dwelling construction in Spain[J]. Ecol. Indic. 52, 75–84. doi:10.1016/j.ecolind.2014.11.016
Gudipudi, R., Ludeke, M. K. B., Rybski, D., and Kropp, J. P. (2018). Benchmarking urban eco-efficiency and urbanites' perception. Cities 74, 109–118. doi:10.1016/j.cities.2017.11.009
He, D. W., Deng, X. Z., Jin, G., Wang, X., Zhang, Y., Sun, Z., et al. (2022). Ecological efficiency of grass-based livestock husbandry under the background of rural revitalization: An empirical study of agro-pastoral ecotone. Front. Environ. Sci. 2022, 10. doi:10.3389/fenvs.2022.848134
Huang, H. P., and Wang, L. Y. (2017). EMA-based analysis on the eco-efficiency of carbon emission of energy consumption:A case study of Nanchang. Acta eco. Sin. 37 (12), 4191–4197. doi:10.5846/stxb201606301336
Huang, J. H., and Hua, Y. (2019). Eco-efficiency convergence and green urban growth in China. Int. Regional Sci. Rev. 42 (3-4), 307–334. doi:10.1177/0160017618790032
Jacobs-Crisioni, C., Silva, F. B. E., Lavalle, C., Baranzelli, C., Barbosa, A., and Perpina Castillo, C. (2016). Accessibility and territorial cohesion in a case of transport infrastructure improvements with changing population distributions. Eur. Transp. Res. Rev. 8 (1), 9. doi:10.1007/s12544-016-0197-5
Jin, G., Deng, X. Z., Zhao, X. D., Guo, B., and Yang, J. (2018). Spatiotemporal patterns in urbanization efficiency within the Yangtze River economic belt between 2005 and 2014. J. Geogr. Sci. 28 (8), 1113–1126. doi:10.1007/s11442-018-1545-2
Li, C. J., and Deng, L. (2015). The new urbanization and the sustainable development of the real estate industry in China [J]. Econ. Problems 2015 (01), 119–123. doi:10.16011/j.cnki.jjwt.2015.01.023
Li, Z. J., Sarwar, S., and Jin, T. (2021). Spatiotemporal evolution and improvement potential of agricultural eco-efficiency in Jiangsu province. Front. Energy Res. 9. doi:10.3389/fenrg.2021.746405
Lin, F. Y., Lin, S. W., and Lu, W. M. (2019). Dynamic eco-efficiency evaluation of the semiconductor industry: A sustainable development perspective. Environ. Monit. Assess. 191 (7), 435. doi:10.1007/s10661-019-7598-6
Lin, J. Y., Li, Y., Wang, W., Cui, S., and Wei, X. (2010). An eco-efficiency-based urban sustainability assessment method and its application. Int. J. Sustain. Dev. World Ecol. 17 (4), 356–361. doi:10.1080/13504509.2010.493070
Liu, J., Zhang, J. F., and Fu, Z. B. (2017). Tourism eco-efficiency of Chinese coastal cities – analysis based on the DEA-Tobit model. Ocean Coast. Manag. 148, 164–170. doi:10.1016/j.ocecoaman.2017.08.003
Liu, M. B., Zhang, A. L., and Wen, G. H. (2022). Regional differences and spatial convergence in the ecological efficiency of cultivated land use in the main grain producing areas in the Yangtze Region. J. Nat. Resour. 37 (02), 477–493. doi:10.31497/zrzyxb.20220214
Liu, M. B., Zhang, A. L., and Wen, G. H. (2021). Temporal and spatial pattern and evolution trend of cultivated land use ecological efficiency in the main grain producing areas in the lower Yangtze region[J]. China Land Sci. 35 (02), 50–60. doi:10.11994/zgtdkx.20210128.100237
Liu, S. G., Song, L., and Huang, Y. (2022). Measurement and convergence test of green economic efficiency of the Yangtze River economic belt under different spatial network correlation. Front. Environ. Sci. 10, 14. doi:10.3389/fenvs.2022.828207
Liu, T. Y., Su, C. W., Chang, H. L., and Chu, C. C. (2018). Is urbanization improving real estate investment? A cross-regional study of China[J]. Rev. Dev. Econ. 22 (2), 862–878. doi:10.1111/rode.12373
Liu, W. L., Xia, Y., and Hou, J. L. (2019). Health expenditure efficiency in rural China using the super-SBM model and the Malmquist productivity index. Int. J. Equity Health 18, 111. doi:10.1186/s12939-019-1003-5
Mavi, R. K., Saen, R. F., and Goh, M. (2019). Joint analysis of eco-efficiency and eco-innovation with common weights in two-stage network DEA: A big data approach[J]. Technol. Forecast Soc. Chang. 144, 553–562. doi:10.1016/j.techfore.2018.01.035
Moutinho, V., and Madaleno, M. (2021). A two-stage DEA model to evaluate the technical eco-efficiency indicator in the EU countries. Int. J. Environ. Res. Public Health 18 (6), 3038. doi:10.3390/ijerph18063038
Moutinho, V., Madaleno, M., and Robaina, M. (2017). The economic and environmental efficiency assessment in EU cross-country: Evidence from DEA and quantile regression approach. Ecol. Indic. 78, 85–97. doi:10.1016/j.ecolind.2017.02.042
Moutinho, V., Madaleno, M., Robaina, M., and Villar, J. (2018). Advanced scoring method of eco-efficiency in European cities. Environ. Sci. Pollut. Res. 25 (2), 1637–1654. doi:10.1007/s11356-017-0540-y
Ning, Y. L., Liu, Z., Ning, Z. K., and Zhang, H. (2018). Measuring eco-efficiency of state-owned forestry enterprises in northeast China. Forests 9 (8), 455. doi:10.3390/f9080455
Onat, N. C., Egilmez, G., and Tatari, O. (2014). Towards greening the U.S. Residential building stock: A system dynamics approach. Build. Environ. 78 (8), 68–80. doi:10.1016/j.buildenv.2014.03.030
Panter, J., and Ogilvie, D.Iconnect Consortium (2017). Can environmental improvement change the population distribution of walking?[J]. J. Epidemiol. Community Health 71 (6), 528–535. doi:10.1136/jech-2016-208417
Park, S., and Kim, S. (2016). Can nonprofit enterprises lead to better revenue conditions in local government?[J]. Am. Rev. Public Adm. 46 (6), 700–712. doi:10.1177/0275074015573832
Peng, H. S., Zhang, J. H., Lu, L., Tang, G., Yan, B., Xiao, X., et al. (2017). Eco-efficiency and its determinants at a tourism destination: A case study of huangshan national park, China. Tour. Manag. 60, 201–211. doi:10.1016/j.tourman.2016.12.005
Polemis, M. L., Stengos, T., Tzeremes, P., and Tzeremes, N. G. (2021). Quantile eco-efficiency estimation and convergence: A nonparametric frontier approach. Econ. Lett. 2021, 109813. doi:10.1016/j.econlet.2021.109813
Robaina-Alves, M., Moutinho, V., and Macedo, P. (2015). A new frontier approach to model the eco-efficiency in European countries. J. Clean. Prod. 103, 562–573. doi:10.1016/j.jclepro.2015.01.038
Saling, P., Maisch, R., Silvani, M., and Konig, N. (2005). Assessing the environmental-hazard potential for life cycle assessment, eco-efficiency and SEEbalance (8 pp). Int. J. Life Cycle Assess. 10 (5), 364–371. doi:10.1065/lca2005.08.220
Shao, L. G., Yu, X., and Feng, C. (2019). Evaluating the eco-efficiency of China's industrial sectors: A two-stage network data envelopment analysis. J. Environ. Manag. 247, 551–560. doi:10.1016/j.jenvman.2019.06.099
Shen, L., Zhang, Z., and Long, Z. (2017). Significant barriers to green procurement in real estate development. Resour. Conserv. Recycl. 116, 160–168. doi:10.1016/j.resconrec.2016.10.004
Teng, J. Y., and Wu, X. G. (2014). Eco-footprint-based life-cycle eco-efficiency assessment of building projects. Ecol. Indic. 39, 160–168. doi:10.1016/j.ecolind.2013.12.018
Van Grinsven, H. J. M., Van Eerdt, M. M., Westhoek, H., and Kruitwagen, S. (2019). Benchmarking eco-efficiency and footprints of Dutch agriculture in European context and implications for policies for climate and environment. Front. Sustain. Food Syst. 3. doi:10.3389/fsufs.2019.00013
Wang, G. F., Shi, R., Mi, L. C., and Hu, J. (2022). Agricultural eco-efficiency: Challenges and progress. Sustainability 14 (3), 1051. doi:10.3390/su14031051
Wang, L. (2013). Evaluation of real estate development based on Ecological Footprint[J]. Statistics Decis. 2013 (04), 60–62. doi:10.13546/j.cnki.tjyjc.2013.04.032
Xu, X., Pan, L. C., Ni, Q. H., and Yuan, Q. Q. (2021). Eco-efficiency evaluation model: A case study of the Yangtze River economic belt. Environ. Monit. Assess. 193 (7), 457. doi:10.1007/s10661-021-09228-2
Yan, X., and Tu, J. J. (2021). The spatio-temporal evolution and driving factors of eco-efficiency of resource-based cities in the Yellow River Basin. J. Nat. Resour. 36 (01), 223–239. doi:10.31497/zrzyxb.20210115
Yang, L., Tang, K., Wang, Z. H., An, H., and Fang, W. (2017). Regional eco-efficiency and pollutants' marginal abatement costs in China: A parametric approach. J. Clean. Prod. 167, 619–629. doi:10.1016/j.jclepro.2017.08.205
Yang, L., and Yang, Y. T. (2019). Evaluation of eco-efficiency in China from 1978 to 2016: Based on a modified ecological footprint model. Sci. Total Environ. 662, 581–590. doi:10.1016/j.scitotenv.2019.01.225
Yuan, Q. M., and Yin, S. S. (2020). Evaluation and analysis of stage characteristics of real estate efficiency in three urban agglomerations [J]. Mod. Manag. 40 (05), 31–35. doi:10.19634/j.cnki.11-1403/c.2020.05.007
Zafar, M. W., Zaidi, S. A. H., Khan, N. R., Mirza, F. M., Hou, F., and Kirmani, S. A. A. (2019). The impact of natural resources, human capital, and foreign direct investment on the ecological footprint: The case of the United States. Resour. Policy 63, 101428. doi:10.1016/j.resourpol.2019.101428
Zhang, Q., Hong, K. H., and Luo, J. H. (2016). Comparative analysis of regional real estate input-output efficiency based on super-efficiency DEA model—taking hunan as an example [J]. Econ. Geogr. 36 (04), 120–125. doi:10.15957/j.cnki.jjdl.2016.04.017
Zhang, Q., and Liu, Z. M. (2022). Government intervention and subjectivity of non-state-owned enterprises under “double carbon” target. Wirel. Commun. Mob. Comput. 2022, 1. doi:10.1155/2022/6055851
Zhang, X. L. (2020). Estimation of eco‐efficiency and identification of its influencing factors in China's Yangtze River Delta urban agglomerations. Growth Change 51 (2), 792–808. doi:10.1111/grow.12376
Zhang, Y. Y., Sun, M. Y., Yang, R. J., Li, X., Zhang, L., and Li, M. (2021). Decoupling water environment pressures from economic growth in the Yangtze River Economic Belt, China. Ecol. Indic. 122, 107314. doi:10.1016/j.ecolind.2020.107314
Keywords: real estate development, eco-efficiency, spatial-temporal evolution, yangtze river economic belt, environmental protection
Citation: Fan Z, Deng Z, Qi Y and Pan J (2022) Spatial–Temporal pattern and evolutionary trend of eco-efficiency of real estate development in the yangtze river economic belt. Front. Environ. Sci. 10:996152. doi: 10.3389/fenvs.2022.996152
Received: 17 July 2022; Accepted: 15 August 2022;
Published: 16 September 2022.
Edited by:
Salvador García-Ayllón Veintimilla, Technical University of cartagena, SpainReviewed by:
Baishu Guo, China University of Geosciences Wuhan, ChinaEhsan Elahi, Shandong University of Technology, China
Decai Tang, Nanjing University of Information Science and Technology, China
Yantuan Yu, Guangdong University of Foreign Studies, China
Copyright © 2022 Fan, Deng, Qi and Pan. This is an open-access article distributed under the terms of the Creative Commons Attribution License (CC BY). The use, distribution or reproduction in other forums is permitted, provided the original author(s) and the copyright owner(s) are credited and that the original publication in this journal is cited, in accordance with accepted academic practice. No use, distribution or reproduction is permitted which does not comply with these terms.
*Correspondence: Yawei Qi, qiyawei@jxufe.edu.cn