Emerging and legacy per-and polyfluoroalkyl substances in the rivers of a typical industrialized province of China: Spatiotemporal variations, mass discharges and ecological risks
 Runmei Wang
 Jian Zhang2,3,4
  Chang-Er Chen
 Jianhui Tang
- 1Institute of Oceanology, Chinese Academy of Sciences, Qingdao, China
- 2CAS Key Laboratory of Coastal Environmental Processes and Ecological Remediation, Yantai Institute of Coastal Zone Research, Chinese Academy of Sciences, Yantai, Shandong, China
- 3Shandong Key Laboratory of Coastal Environmental Processes, Yantai, Shandong, China
- 4University of Chinese Academy of Sciences, Beijing, China
- 5Guangdong Provincial Key Laboratory of Chemical Pollution and Environmental Safety and MOE Key Laboratory of Theoretical Chemistry of Environment, Environmental Research Institute/School of Environment, South China Normal University, Guangzhou, China
- 6Yantai Water Conservancy Bureau, Yantai, China
Per- and polyfluoroalkyl substances (PFAS) contamination has drawn considerable attention in the rivers of Shandong, China. However, their seasonal variations have not been well addressed due to the geographic scale. Here, surface waters were collected seasonally at estuaries of 13 major rivers in Shandong to investigate the spatiotemporal variations, mass discharges and ecological risks of PFAS. Two novel perfluoroalkyl ether carboxylic acids, hexafluoropropylene oxide-dimer acid (HFPO-DA) and hexafluoropropylene oxide-trimer acid (HFPO-TA), and 10 legacy PFAS were all detectable and their total concentrations (∑PFAS) ranged largely from 23 to 25,400 ng/L. Elevated levels of all target compounds were found in the Xiaoqing River but Majia and Jiaolai Rivers were also of concern. Perfluorooctanoic acid (PFOA) was dominant in all the rivers. Its concentration in the Xiaoqing River estuary increased 6-fold from 2011 to 2014 and reached a plateau during 2014–2020. The nonsignificant seasonality of the PFAS concentrations in rivers with seasonal flows may indicate their different emission patterns (i.e., higher emission in the wet season and lower emission in the dry season). The ratio of maximum to minimum concentration (Cmax/Cmin) was proposed to characterize the influence of local point sources, with Cmax/Cmin ranging from 10 to 14,000. Xiaoqing and Yellow Rivers discharged ∼98% of ∑PFAS flux to the sea, which was estimated to be 28.0 t in 2020. This study raises attention to the industrial emission patterns of PFAS. Further investigations with higher time resolution were needed to understand the emission patterns of PFAS in Shandong.
Introduction
Per- and polyfluoroalkyl substances (PFAS) are a broad range of synthetic fluorinated chemicals that have been used for over 60 years (Lim, 2019). They are of unique characteristics of water and oil repellency, high surface activity, and thermal stability and therefore have been widely used in industrial and commercial applications, such as surface repellent coatings (e.g., food contact paper, textiles, leather, cookware and upholstery), surfactants (e.g., firefighting foams, mist suppressant and cleaning products), photographic devices and pesticides (Posner, 2012; Liu et al., 2021b).
However, the same properties that make PFAS useful also make them problematic contaminants when released into the environment (Lim, 2019). The global contamination of PFAS has attracted great attention from scientists and regulators (Kwiatkowski et al., 2020). Epidemiological and toxicological studies have linked PFAS exposure to health issues, including cardiometabolic diseases, endocrine disruption, and kidney function damage (Bach et al., 2015; Sunderland et al., 2019). The two most extensively studied PFAS—perfluorooctanoic acid (PFOA) and perfluorooctane sulfonic acid (PFOS)—and their salts have already been recognized as novel persistent organic pollutants (POPs) under Stockholm Convention (Shi et al., 2021).
While traditional POPs can be readily removed from water by sorption processes in the environment or during water treatment, the removal of most PFAS in aquatic environments is very slow because of their high water solubility, low partitioning to organic matter, and extraordinary persistence (Reemtsma et al., 2016). The persistence of PFAS in surface waters is responsible for the exposure of fish, fish-eating birds, and mammals via food-chain bioaccumulation and biomagnification (Houde et al., 2006; Houde et al., 2011). Ultimately, humans are exposed to PFAS through the food web and drinking water (Wang et al., 2020). Thus, PFAS are believed to be of more concern than traditional POPs.
In the context of China’s remarkable progress in industrial development over the past decades, there has been a rapid increase in the production and consumption of PFAS-related products in China since the late 1990s (Wang et al., 2014b). For example, polytetrafluoroethylene (PTFE), the dominant fluoropolymer, accounted for the majority (>50%) of the world fluoropolymer consumption in 2018 (Chemical Economics Handbook, 2019) and its production has been increasing rapidly in China, from 6.6 kt/yr in 1999 to 64 kt/yr in 2012 (Wang et al., 2014b). China has now become the world’s largest producer and consumer of PTFE (Chemical Economics Handbook, 2019). Shandong, sitting on the lower reaches of the Yellow River and bordering the Bohai Sea to the north and the Yellow Sea to the south, is one of the most industrialized provinces in China, with the third-highest regional GDP (7% of GDP) in 2020 (National Bureau of Statistics of China, 2021). With resource-rich and labor-abundant advantages, fluoropolymer industries have rapidly developed in Shandong. Shandong contributed to the largest proportion (>40%) of PTFE production capacity (∼50 kt) in China in 2018 (Liu et al., 2021a; Fang et al., 2021). Inadvertently, PFAS enter the environment as a result of industrial production and use/disposal of products containing precursors and residuals. Studies showed that Shandong has become one of the hotspots of PFAS contamination in China (Pan et al., 2018).
PFAS contamination in surface waters (i.e., rivers) is of particular interest because of the persistence and mobility of PFAS in the aquatic environment. Rivers are major sinks and medium of transport for PFAS (Muir and Miaz, 2021). Research showed that 80%–90% of PFOA/PFOS contamination in the Chinese environment was estimated to come from manufacturing and use facilities mostly via industrial wastewater discharge (Liu et al., 2017). Shandong is home to concentrated fluoropolymer facilities (Wang et al., 2014a). The Bohai and Yellow Seas became the most PFAS contaminated coastal waters globally, with the highest median concentrations of ΣC7−C12 perfluorocarboxylates (PFCAs) and perfluoroalkylsulfonates (PFSAs) reported (Muir and Miaz, 2021). This was linked to the coastal riverine inputs (Wang et al., 2014a; Zhao et al., 2020). In 2018, Shi et al. (2021) investigated 40 rivers along the coast of the Bohai and Yellow Seas, among which 15 rivers of Shandong (average Σ15PFAS = 1,550 ng/L) were notably more contaminated by PFAS than the other rivers (36.2–124 ng/L). The concentration of PFOA in the Xiaoqing River was reported 1.71 mg/L in 2014, which was believed to be the highest ever found in surface waters (Liu et al., 2016).
While studies have reported the occurrence, distribution and sources of selected PFAS in rivers of Shandong, the seasonal variations of PFAS in the rivers have not been well addressed due to the geographic scale. The river flows are seasonally distinct and greatly impacted by rainfall in Shandong, where ∼70% of rainfall occurred in the wet season from July to September. Furthermore, because of climate change or artificial regulation, the river flows changed greatly. Therefore, it is critical to understand the seasonal variations of PFAS in the rivers of Shandong.
The production and usage of C8 homologs have been restricted in developed countries (Zhao et al., 2020) and China was also encouraging to replace them with alternatives (Ministry of Ecology and Environment, 2017; Ministry of Ecology and Environment, 2020). In fluoropolymer manufacturing, emerging per- and polyfluoroalkyl ether carboxylic acids (PFECAs), such as hexafluoropropylene oxide-dimer acid (HFPO-DA) and hexafluoropropylene oxide-trimer acid (HFPO-TA), have been used as alternatives to PFOA (Song et al., 2018). However, a recent study showed HFPO-TA was more bioaccumulative than the legacy PFOA (Pan et al., 2017). It is debatable whether these chemicals are suitable alternatives for PFOA. Studies detected that HFPO-DA and HFPO-TA were up to 3.10 and 6.85 μg/L in the Xiaoqing River (Heydebreck et al., 2015; Pan et al., 2017) while the occurrence of these emerging PFAS in the other rivers of Shandong was hardly known.
In this study, a province-scale investigation of rivers was conducted across Shandong. The objectives of this study were to 1) investigate the spatiotemporal distribution/compositions of emerging and legacy PFAS in surface waters of rivers across Shandong; 2) discuss temporal variations of PFOA and its substitutes in the Xiaoqing River; 3) estimate the mass discharges of PFAS into the Bohai and Yellow Seas; and 4) estimate the environmental risk of PFAS contamination in the typical industrialized province of China.
Materials and methods
Study area and sampling
Shandong is a coastal province in eastern China, bordering Hebei, Henan, Anhui and Jiangsu provinces from north to south (Figure 1). It is a key location for the fluoropolymer industries in China with seven known fluoropolymer facilities (F1−F7 shown in Figure 1) and five of them sitting on the tributaries or canals of the Xiaoqing River (F1−F5) (Wang et al., 2014a). Facility 1 started to produce PTFE in 2001 with an annual production capacity of 3 kt (Dongyue Group Limited, 2012) and has grown into the world's largest manufacturer of PTFE with an annual production capacity of 55 kt in 2021 (Dongyue Group Limited, 2021). Yellow River, running through nine provinces in China, is one of the longest rivers (5460 km) in the world and the riverbed of its section in Shandong is 4–6 m above the land surface (Wang et al., 2016b). Moreover, the Yellow River is an important drinking water source for cities along the river, with >600 drinking water sources and providing 80% of the total water usage (Li et al., 2015). Xiaoqing River (233 km) runs parallel to the Yellow River before emptying into Laizhou Bay of the Bohai Sea and has five major tributaries but many unnamed canals feeding into the main river stream (Heydebreck et al., 2015). Xiaoqing River also receives wastewater from several major cities in which petrochemical, marine chemical, electronic, iron, and steel industries are located (Heydebreck et al., 2015).
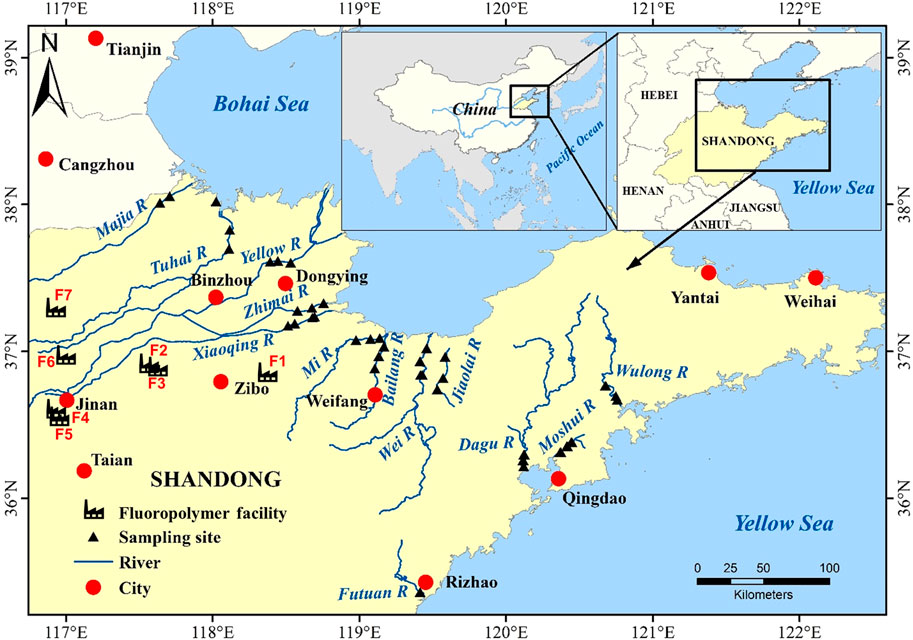
FIGURE 1. Illustration of the sampling sites on the coastal rivers of Shandong, China (only the outmost eastern section of the Yellow River is outlined) and locations of fluoropolymer facilities (F1–F7) achieved from the literature.
The study design was similar to previous studies (Mclachlan et al., 2007; Wang et al., 2016b), using surface water samples taken at river estuaries as an integrated measure of upstream emissions sources. This was based on the assumption that moderately to highly water-soluble PFAS were transported unimpeded to the sea (i.e., they are not retained or degraded). In this study, the annual riverine water flow of all sampled rivers at their estuaries accounted for >85% of the total riverine water flow discharging to estuaries in Shandong (Li and Zhao, 2002). Thirteen rivers were included based on catchment area, river flow and geographic coverage of Shandong: Majia, Tuhai, Yellow, Zhimai, Xiaoqing, Mi, Bailang, Wei, Jiaolai, Wulong, Moshui, Dagu and Futuan River (from the north coast to the south coast of Shandong) (Figure 1).
The sampling campaigns were conducted in both wet (September 19–27) and dry seasons (December 5–11) in 2020. Two to three sampling sites at intervals of 5–10 km were preselected for each river and they were close to the estuary but above the tidal limit (Figure 1). Samples were collected approximately 0.5–1 m below the water surface. Solvent-cleaned polypropylene (PP) bottles were rinsed twice with the river water prior to final collection. Samples were collected from bridges so that they were from the main river flow. A total of 68 water samples were obtained. Two field blanks were included by filling bottles with deionized water and opening for approximately 5 min during the sampling event. Information about the sampling time and site (GPS coordinates) was collected. Basic water quality parameters such as temperature, dissolved oxygen, salinity and pH were measured in situ with a multiparameter water analyzer (YSI, United States). The collected samples were transferred to the laboratory in an ice-box and immediately stored at −20°C before pretreatment in the laboratory within 1 week. Details about the sampling sites, time and water quality data are provided in Supplementary Material (Supplementary Table S1). Real-time river flow data at the sampling sites or the nearest gauging stations were obtained from the Yantai Municipal Bureau of Hydrology (Supplementary Table S2).
Sample preparation
The sample preparation was performed according to previous studies with modifications (Taniyasu et al., 2005; Pan et al., 2018; Zhao et al., 2020). Briefly, water samples were left to stand for 24 h to settle most of the particles and only supernatants were taken for analysis. Water samples (200 ml) were then passed through the preconditioned Oasis WAX cartridges (150 mg, 6 cm3, 30 μm, Waters, United States) after being spiked with a mixture of surrogate internal standards (20 μl, containing 2 ng of each isotopically labeled chemical). The cartridges were preconditioned by the passage of 4 ml of 0.2% NH4OH in methanol, 4 ml of methanol and then 4 ml of deionized water. After water loading, the cartridges were then washed with 15 ml of deionized water. The target analytes were eluted with 8 ml of methanol with 0.2% NH4OH in a PP tube. A clean-up step was performed using ENVI-Carb cartridges (3 ml, 250 mg, Supelco, United States) and particles that appeared in the final solution were removed by centrifugation. The extracts were blown to nearly dry under a gentle nitrogen flow and reconstituted to 200 μl using methanol in PP injection vials. Samples were stored at 4°C before instrumental analysis within 1 week. More information about reagents and materials is provided in the SI.
Instrumental analysis
Target PFAS (detailed information about physicochemical properties and structures shown in Supplementary Table S3 and Supplementary Figure S1), including PFCAs (C4−C10) and PFSAs (C4, C6, C8), were quantified using an Acquity ultrahigh performance liquid chromatography coupled to a Xevo TQ-S triple-quadrupole mass spectrometer (Waters, United States). Another two target PFAS, HFPO-DA and HFPO-TA, were quantified using an API 5500 triple-quadrupole mass spectrometer (AB SCIEX, United States). Chromatographic separation was accomplished using an Acquity BEH C18 column (2.1 mm × 50 mm, 1.7 μm, Waters, United States) with mobile phases of 2 mM ammonium acetate in ultrapure water 1) and acetonitrile 2) at a flow rate of 0.4 ml/min. Multiple reaction monitoring with electrospray ionization in negative mode was used in both mass spectrometers. Further details about the instrument analysis are provided in Supplementary Table S4.
Quality assurance and quality control
A total of 10 isotope-labeled chemicals were used as surrogate internal standards (Supplementary Table S4). The 1/x weighted calibration curve (0.2–200 μg/L) was verified daily and exhibited excellent linearity (R2 > 0.99). Field blanks, procedural blanks, method detection limits (MDL), quality control (QC) samples, and matrix recovery tests were conducted to ensure accurate quantification of PFAS. Instrument limits of quantification (LOQ) were defined as the lowest concentration spiked in matrix blank resulting in a signal-to-noise (S/N) ratio above 10. MDL was defined as the average plus three times the standard deviation of matrix blanks. Most PFAS were not detected in blank samples and MDLs were set as their LOQs. Recoveries were acquired by spiking the target chemicals into deionized water, which ranged from 100.3 ± 2.2% to 105.4 ± 5.0%. During the injection, one solvent blank and two QC samples (10 and 100 μg/L) were added every 10 to 15 samples to monitor the contamination (all below the LOQ) and instrument stability (standard deviations < ±10%). Further details about QA/QC are available in the SI and the data are presented in Supplementary Table S5.
Results and discussion
Spatial distribution and compositions of PFAS in rivers
Ten legacy PFAS (C4−C10 PFCAs and C4, C6, C8 PFSAs) and two emerging ones (HFPO-DA and HFPO-TA) were all detectable in the 68 samples collected from 13 rivers of Shandong, China (data shown in Supplementary Table S6), indicating that all the rivers in the study region suffered from PFAS contamination. As none of the target PFAS showed statistically seasonal differences in concentrations (see discussion about seasonality later), their mean concentrations were used for the following discussion and shown in Figure 2. The ∑12PFAS concentrations ranged largely from 23 to 25,400 ng/L, with a decreasing order at four levels: ① Xiaoqing, Majia, and Jiaolai Rivers (25,400, 1850 and 1,010 ng/L) > ② Zhimai, Mi, Moshui, and Tuhai Rivers (540, 290, 168, and 115 ng/L) > ③ Wulong, Bailang, Dagu, and Wei Rivers (94, 73, 66, and 57 ng/L) > ④ Futuan and Yellow Rivers (23 and 24 ng/L). Rivers belonging to levels ① and ② are mainly located in northern Shandong, implying the influence of the fluoropolymer facilities in this region, while rivers in southern Shandong were less contaminated by PFAS. Wang et al. (2014a) and Zhao et al. (2020) investigated selected PFAS in the river estuaries of this region in 2011 and 2017, respectively, and both of their studies showed the ∑PFAS was three orders of magnitude higher in the Xiaoqing River than that of the other rivers. Our results here, together with above findings, implied long-term serious PFAS contamination in the Xiaoqing River. Relatively higher ∑PFAS in the Majia and Zhimai Rivers were observed in previous study because they were close to the fluorotelomer industrial parks (Zhao et al., 2020). This study also found Jiaolai River could be a potential source of PFAS contamination in this region due to its relatively higher levels of PFAS, although no known point source was found. Yellow River showed the minimum contamination of PFAS in this region, which was consistent with previous studies (Wang et al., 2014a; Shi et al., 2021). There were two explanations: 1) the higher riverbed (4–6 m above the land surface) of the Yellow River limited receiving wastewater from local facilities; and 2) there was more dilution with greater water discharge compared to the other rivers.
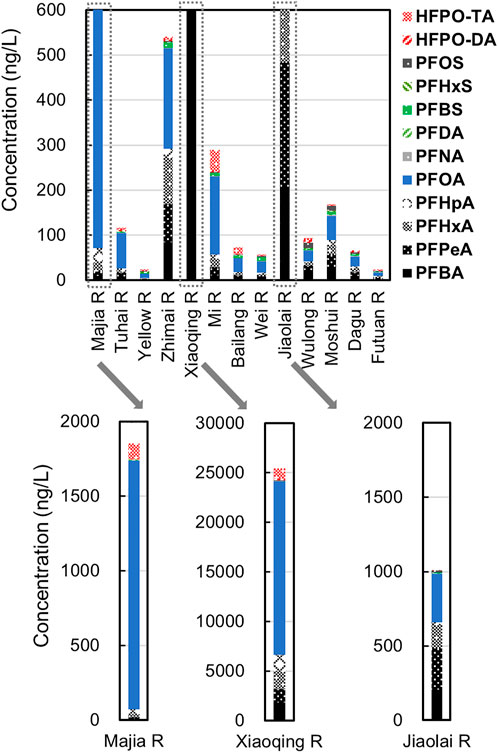
FIGURE 2. Mean concentrations of 12 target PFAS in the coastal rivers (from north coast to the south coast) of Shandong, China.
The composition of PFAS varied greatly among the rivers but there was some consistency (Figure 3). PFOA and short-chain PFCAs (PFBA, PFPeA, PFHxA, and PFHpA) contributed to the majority (58%–98%, mean: 81%) of the ∑12PFAS. Although the concentration of PFOA varied largely in the rivers from 7 (Futuan River) to 17,500 ng/L (Xiaoqing River), it was the dominant PFAS in all the rivers, which contributed to 25%–90% of ∑12PFAS with an average of 46%. High concentrations and the dominance of PFOA reflected the influence of fluoropolymer production, especially PTFE production in this region. In particular, because of the emissions of the fluoropolymer facilities in northern Shandong, the proportions of PFOA in rivers in the north (41%–90% in Rivers of Majia to Wei, except the Yellow River) were higher than that of rivers in the south (25%–33% in Rivers of Jiaolai to Futuan). The proportions of the short-chain PFCAs were on the contrary (i.e., short-chain PFCAs in rivers in the north were lower than that of rivers in the south). For concentrations of long-chain PFCAs (PFNA and PFDA) and all PFSAs, the total contribution was the least, from <1% (Xiaoqing River) to 27% (Yellow River) with an average of 10%. In contrast to PFOA, PFOS only constituted small fractions (<0.1%–12% with an average of 3%) and ranged from 0.60 to 13.7 ng/L with a mean concentration of 4.60 ng/L for all the rivers, similar to the study conducted in 2011 (Wang et al., 2014a).
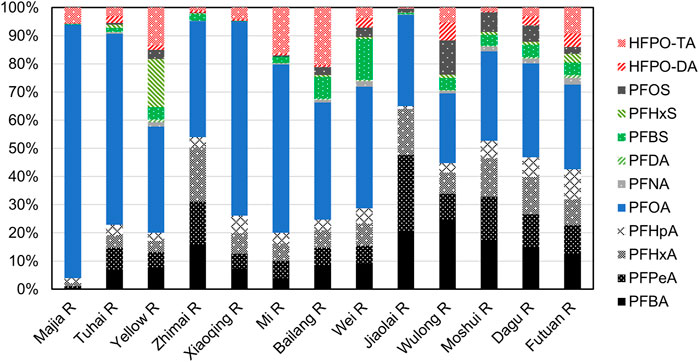
FIGURE 3. Relative contributions of PFAS in the rivers of Shandong, China.
HFPO-DA and HFPO-TA are emerging substitutes for PFOA while their information regarding to annual production and environmental occurrence is scarce. This study first reported the occurrence of HFPO-DA and HFPO-TA in most studied rivers except the Xiaoqing River. As expected, the highest points of HFPO-DA and HFPO-TA were both found in the Xiaoqing River, with average concentrations of 164 and 1,040 ng/L, respectively. HFPO-DA of the remaining rivers was only at single-digit ng/L levels while relatively high levels of HFPO-TA were also found in the rivers of Majia (104 ng/L), Mi (47.1 ng/L) and Bailang (14.9 ng/L). HFPO-TA also accounted for nonnegligible proportions of the ∑12PFAS and was even the second most dominant compound in rivers of Majia (6%), Mi (16%), and Bailang (21%). Compared with the median concentrations (0.95 ng/L for HFPO-DA and 0.21 ng/L for HFPO-TA) reported for river waters from China, Western Europe and North America (Pan et al., 2018), the concentrations of HFPO-DA and HFPO-TA in the investigated rivers were at relatively high levels. Heydebreck et al. (2015) firstly reported the occurrence of HFPO-DA in the Xiaoqing River from samples collected in 2014 and the influence of the point source was clear from the uptrend upstream of F1 and downtrend downstream of F1. Pan et al. (2017) firstly reported the occurrence of HFPO-TA in the Xiaoqing River from samples collected in 2015 and found the same trend as HFPO-DA. The results indicated that there were point sources of both HFPO-DA and HFPO-TA in the catchment of the Xiaoqing River (e.g., fluoropolymer facilities) and there were also point sources of HFPO-TA influencing the rivers of Majia, Mi, and Bailang.
Correlation analysis on the concentrations of the 12 PFAS in rivers showed that all PFCAs and PFBS were significantly associated while PFOS was significantly associated with most compounds except PFOA, PFHxS, HFPO-DA, and HFPO-TA (Spearman correlation coefficients shown in Supplementary Table S7). It revealed that in these rivers PFOA and PFOS came from different sources while most compounds except PFHxS, HFPO-DA, and HFPO-TA shared similar sources with PFOA/PFOS. Local PFOA contamination is derived from fluoropolymer manufacturing and processing while PFOS contamination is usually associated with discharge from industries such as PFOS manufacturing, metal plating, textile treatment and the semi-conductor industry (Liu et al., 2017). It was estimated that 70%–80% of PFOA/PFOS contamination in the Chinese environment came directly from industrial wastewater (Liu et al., 2017). Furthermore, as PFHpA concentrations in atmospheric precipitation were relatively higher than that of surface water, the PFHpA/PFOA ratio was used to trace the atmospheric precipitation sources (Simcik and Dorweiler, 2005). The ratio of PFHpA/PFOA ranged from 0.5 to 0.9 in urban areas and from 6 to 16 in remote areas in surface water samples collected from the midwestern United States (Simcik and Dorweiler, 2005). The relatively low ratio of PFHpA/PFOA (0.01–0.65, mean:0.13) in this study indicated that the primary source of PFAS in the rivers of Shandong was nonatmospheric. Considering the concentrated industries in this region, it was most likely that industrial wastewater was mainly responsible for the contamination of most PFAS, especially PFOA, in the study region.
Characteristic ratio method is generally used to identify the source of contaminants in the environment, such as the PFHpA/PFOA ratio mentioned above. We propose that the ratio of the maximum concentration to the minimum concentration of a PFAS compound (Cmax/Cmin) throughout the rivers could indicate the influence of local point sources on the target compound. Cmax/Cmin ranged from 10 to 14,000 in this study (Supplementary Table S8). PFOA was influenced by local point sources the most, with the highest Cmax/Cmin value (14,000), followed by short-chain PFCAs (including PFBA, PFPeA, PFHxA, PFHpA, 4000–7000), HFPO-DA and HFPO-TA (700), long-chain PFCAs and all PFSAs (including PFNA, PFDA, PFBS, PFHxS, PFOS, 10–100). This was consistent with the correlation analysis above.
Seasonality of PFAS in rivers
The individual and total PFAS concentrations in the rivers in the wet season were slightly higher than or almost equivalent to that of the dry season (taking Xiaoqing River as an example shown in Supplementary Figure S2) but they showed no statistically seasonal difference (p > 0.05). One study compared its results to previously reported values and drew the same conclusion (Chen et al., 2017). It was interesting that seasonal influence (i.e., dilution effect) was not observed although seasonality of the river flow was evident in the study region (Supplementary Table S2). This may be explained by different emission patterns of PFAS (i.e., higher emission in the wet season and lower emission in the dry season) or surface water runoff from the manufacturing facilities. Further investigations with higher time resolution were needed to understand the emission patterns of PFAS in this region.
Temporal variations of PFOA and substitutes in the Xiaoqing River
PFOA was the dominant PFAS in all the investigated rivers while Xiaoqing River was found to be the most contaminated river in this region by this study and many previous studies. Thus, temporal variations of PFOA and its substitutes in the Xiaoqing River were of particular interest. As sampling sites in different studies posed a great influence on the detected concentrations, PFOA concentrations at the Xiaoqing River estuary (or at distances of 20–30 km from the estuary) were obtained from the literature (Wang et al., 2014a; Shi et al., 2015; Wang et al., 2016a; Pan et al., 2017; Li et al., 2018; Joerss et al., 2020; Zhao et al., 2020) and this study (Figure 4 and Supplementary Table S9). It was clear that the mean concentration of PFOA increased 6-fold from slightly over 3000 ng/L in 2011 to over 21,700 ng/L in 2014 and then reached a plateau during 2014–2020. Pan et al. (2018) investigated the concentration levels of PFOA in important rivers/lakes in China, North America, Western Europe and South Korea in 2016. The concentration levels of PFOA in the Xiaoqing River were 3–5 orders of magnitude higher than that of those rivers (<1–50 ng/L). The serious contamination of PFOA in the Xiaoqing River was clearly related to the concentrated fluoropolymer facilities locating its catchment (F1–F5). As China also encouraged to replace PFOA with alternatives, F1 achieved the replacement rate of 70% for PFOA in 2018 (Dongyue Group Limited, 2018) and launched five PTFE products that were free of PFOA in 2019 (Dongyue Group Limited, 2019). Therefore, the concentration of PFOA in the Xiaoqing River is expected to decrease in future years due to decreasing emissions.
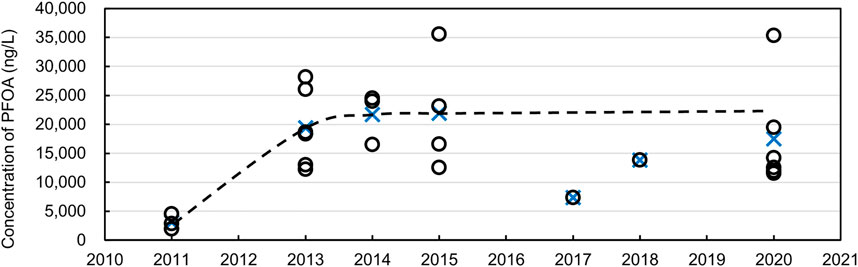
FIGURE 4. Temporal variation of PFOA concentrations in the surface waters of Xiaoqing River estuary in the last decade (blue cross stands for the mean value).
As important substitutes of PFOA, HFPO-DA, and HFPO-TA have drawn increasing concerns. Although the maximum level of 3100 ng/L of HFPO-DA was found in the Xiaoqing River, it fell to ∼80 ng/L when close to the estuary in 2014 (Heydebreck et al., 2015). Again, the maximum level of 2060 ng/L of HFPO-DA was found while it fell to ∼120 ng/L in the estuary in 2015 (Pan et al., 2017). Zhao et al. (2020) reported 663 ng/L HFPO-DA at the Xiaoqing River estuary. Combined with this study, 100–261 ng/L HFPO-DA at the Xiaoqing River estuary, the concentration of HFPO-DA seemed stable in recent years. Only Pan et al., 2017 previously reported the concentration of HFPO-TA in the Xiaoqing River, with ∼6000 ng/L at the estuary. This figure was notably higher than that of the measurement in this study (774–1,449 ng/L) but it is difficult to discuss temporal variations due to limited data. The decrease in the HFPO-TA concentration could also be due to fluctuations in emissions and hydrological conditions.
Riverine inputs of PFAS into the Bohai and Yellow Seas
The estimation of riverine inputs of PFAS into the surrounding Bohai and Yellow Seas is important for understanding the occurrence, distribution and fate of PFAS in these marine environments. The highest global median concentrations of PFAS were found in the Bohai and Yellow Seas mainly because of the input of the coastal rivers (Muir and Miaz, 2021). The river flow rates of this region have changed dramatically in recent years. For example, the Zhangweixin River was a relatively large river [annual flow rate was 7.6 × 10⁸ m3 in 2012 (Wang et al., 2015) and 2.9 × 10⁸ m3 in 2017 (Zhao et al., 2020)] but dried up in the sampling year of 2020. Thus, real-time flow data were used to estimate the riverine input (Supplementary Table S10). The total mass discharge of 12 PFAS was 28.0 t in 2020, with 16.6 t in the wet season and 11.4 t in the dry season. Of the 13 rivers, Xiaoqing River (26.5 t) and Yellow River (0.8 t) contributed ∼95 and ∼3% of the total PFAS mass discharge. Xiaoqing River only contributed to <3% of the annual river flow of the 13 rivers but contributed ≥90% of PFBA (2.0 t of the total riverine input), PFPeA (1.5 t), PFHxA (2.0 t), PFHpA (1.7 t), PFOA (18.8 t), HFPO-DA (0.2 t) and HFPO-TA (1.2 t) to the sea. Yellow River contributed to the major proportions of the riverine inputs of the remaining compounds: PFNA (50% of 25.0 kg), PFDA (80% of 11.7 kg), PFBS (39% of 96.1 kg), PFHxS (96% of 151 kg), and PFOS (58% of 45.1 kg). Although the Yellow River was one of the cleanest rivers in terms of PFAS contamination in this study, it still contributed the second-largest mass discharge of PFAS after the Xiaoqing River because of the large annual river flow (∼90% of the total annual river flow of the 13 rivers).
Comparison of measured concentrations with threshold values
Ecological risk assessment of PFAS is still developing and currently established thresholds available from around the world for the effects of PFAS have been summarized elsewhere (Ankley et al., 2021). The numbers of the studied sites that exceeded the thresholds suitable for this study are listed in Table 1. Concentrations of PFOA of 1.5%–29% of sites exceeded the threshold values. PFOA of one site at the Xiaoqing River exceeded the predicted no-effect concentration for freshwater pelagic organisms (20 μg/L) and rare freshwater minnows (30 μg/L) published by Environment and Climate Change Canada, which indicates that PFAS have or may have an immediate or long-term harmful effect on the environment or its biological diversity (Environment Canada, 2012). PFOA of this site at the Xiaoqing River also exceeded the quality standard (QS) based on direct toxicity to the freshwater pelagic community (30 μg/L) developed according to the European guideline (Valsecchi et al., 2017). PFOA of two sites at the Xiaoqing River exceeded the 99% species protection value for freshwater (19 μg/L) by the Australian and New Zealand Guidelines. A total of 20 sites related to six rivers exceeded the QS for freshwater concentration leading to secondary poisoning in predators (0.1 μg/L) and annual average environmental quality standard (AA–EQS) for river-based specific pollutant (RBSP) at the national level (0.1 μg/L). Concentrations of PFOS of 50%–100% sites exceeded the threshold values. A total of 34 sites related to 10 rivers (most rivers excluding rivers of Tuhai, Yellow, Futuan) exceeded the QS for freshwater concentration leading to secondary poisoning in predators (2 ng/L) by European Commission and 53 sites related to 12 rivers (only excluding Futuan River) exceeded the AA–EQS for freshwater (0.65 ng/L). PFOS of all sites exceeded the 99% species protection value for freshwater (0.23 ng/L) by the Australian and New Zealand Guidelines. Concentrations of PFHxA at all sites of the Xiaoqing River exceeded the AA–EQS for RBSP at the national level (1 μg/L). Thresholds suitable for this study are also available for PFBA, PFPeA, and PFBS but none of the concentrations exceeded the thresholds.
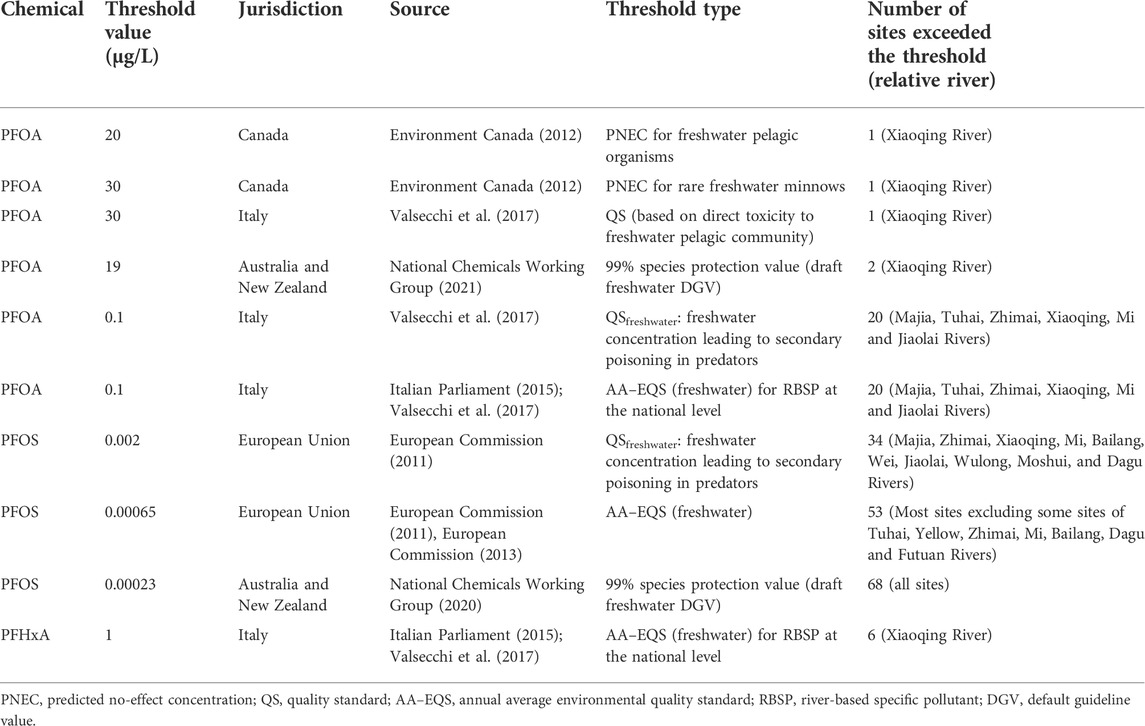
TABLE 1. The numbers of the studied sites exceeded the thresholds for ecological effects from around the world.
PFOA concentrations of 34% of the sampling sites exceeded the newly published standards for drinking water quality of China for PFOA (80 ng/L) (GB 5749–2022), including >50% of the studied rivers (i.e., Majia, Tuhai, Zhimai, Xiaoqing, Mi, Jiailai, and Moshui Rivers). Although the river waters were not used as drinking water in the study region, there is still a large potential risk to the local drinking water system by influencing the underlying groundwater—an important option for drinking water source—by migration downward from river recharge (Liu et al., 2016). Moreover, river water is commonly used for irrigation, which might pose risks due to PFAS in soils and subsequent accumulation into crops and vegetables and eventually accumulation in humans.
Conclusion
In this study, we investigated spatiotemporal variations, mass discharges and ecological risks of emerging and legacy PFAS in rivers of Shandong, China. Several key findings were obtained: 1) the 12 PFAS, including the emerging substitutes of PFOA (i.e., HFPO-DA and HFPO-TA), were all detectable and ranged largely but PFOA was dominant in all the investigated rivers, 2) elevated levels of all target PFAS were found in the Xiaoqing River but Majia and Jiaolai Rivers are also of concern, 3) the nonsignificant seasonality of the PFAS concentrations in rivers with seasonal flows may indicate their different emission patterns. Furthermore, PFOA concentration increased 6-fold from 2011 to 2014 and reached a plateau during 2014–2020. The total annual mass discharge of 12 PFAS was 28.0 t, of which, Xiaoqing and Yellow Rivers contributed ∼98% of the total. There were potential risks of PFAS for freshwater organisms and humans in the study region. The ratio of maximum concentration to minimum concentration (Cmax/Cmin) of a compound was proposed to indicate the influence of local point sources and PFOA was influenced by local point sources the most, with the highest Cmax/Cmin value. Different emission patterns of PFAS (i.e., higher emission in the wet season and lower emission in the dry season) or surface water runoff from the manufacturing facilities may result in the nonsignificant seasonality of the PFAS concentrations in the rivers. Further investigations with higher time resolution were needed to understand the emission patterns of PFAS in this region.
Data availability statement
The original contributions presented in the study are included in the article/Supplementary Material, further inquiries can be directed to the corresponding authors.
Author contributions
JT designed the project and revised the manuscript. RW collected and pretreated the samples, carried out the data statistics, wrote and conceptualized the manuscript. JZ collected the samples. YY, CC, and DZ analyzed the samples. All authors contributed critically to the article and gave final approval for publication.
Funding
This study was supported by the National Natural Science Foundation of China-Shandong Joint Program (U1806207), the Key Deployment Project of Centre for Ocean Mega-Research of Science, Chinese Academy of Sciences (COMS 2019J08), and Shandong Provincial Natural Science Foundation (ZR2021QD021).
Conflict of interest
The authors declare that the research was conducted in the absence of any commercial or financial relationships that could be construed as a potential conflict of interest.
Publisher’s note
All claims expressed in this article are solely those of the authors and do not necessarily represent those of their affiliated organizations, or those of the publisher, the editors and the reviewers. Any product that may be evaluated in this article, or claim that may be made by its manufacturer, is not guaranteed or endorsed by the publisher.
Supplementary material
The Supplementary Material for this article can be found online at: https://www.frontiersin.org/articles/10.3389/fenvs.2022.986719/full#supplementary-material
References
Ankley, G. T., Cureton, P., Hoke, R. A., Houde, M., Kumar, A., Kurias, J., et al. (2021). Assessing the ecological risks of per- and polyfluoroalkyl substances: Current state-of-the science and a proposed path forward. Environ. Toxicol. Chem. 40 (3), 564–605. doi:10.1002/etc.4869
Bach, C. C., Bech, B. H., Brix, N., Nohr, E. A., Bonde, J. P. E., and Henriksen, T. B. (2015). Perfluoroalkyl and polyfluoroalkyl substances and human fetal growth: A systematic review. Crit. Rev. Toxicol. 45 (1), 53–67. doi:10.3109/10408444.2014.952400
Chemical Economics Handbook (2019). Marketing research report: Fluoropolymers. S&P global. Available at: https://ihsmarkit.com/products/fluoropolymers-chemical-economics-handbook.html (Accessed June 15, 2022).
Chen, H., Han, J., Zhang, C., Cheng, J., Sun, R., Wang, X., et al. (2017). Occurrence and seasonal variations of per- and polyfluoroalkyl substances (PFASs) including fluorinated alternatives in rivers, drain outlets and the receiving Bohai Sea of China. Environ. Pollut. 231, 1223–1231. doi:10.1016/j.envpol.2017.08.068
Dongyue Group Limited (2012). Annual report. Available at: http://www.dongyuechem.com/UploadFiles/2013-3/News/20133201940820043.pdf (Accessed June 15, 2022).
Dongyue Group Limited (2018). Annual report. Available at: http://www.dongyuechem.com/UploadFiles/News/2019/04/8ecfce8d-a540-423c-9ca3-5cb700ddc34c.pdf (Accessed June 15, 2022).
Dongyue Group Limited (2019). Annual report. Available at: http://www.dongyuechem.com/UploadFiles/News/2020/04/2100db08-148b-448a-b182-443362981ee7.pdf (Accessed June 15, 2022).
Dongyue Group Limited (2021). Annual report. Available at: http://www.dongyuechem.com/UploadFiles/News/2022/03/e93f0f67-f690-48e0-87f0-cbc8d226041a.pdf (Accessed June 15, 2022).
Environment Canada (2012). Screening assessment: Perfluorooctanoic acid, its salts, and its precursors. Gatineau, QC, Canada: Existing Substances Division. Available on request.
Fang, X., Shi, X., and Gao, W. (2021). Measuring urban sustainability from the quality of the built environment and pressure on the natural environment in China: A case study of the Shandong peninsula region. J. Clean. Prod. 289, 125145. doi:10.1016/j.jclepro.2020.125145
Heydebreck, F., Tang, J., Xie, Z., and Ebinghaus, R. (2015). Alternative and legacy perfluoroalkyl substances: Differences between European and Chinese river/estuary systems. Environ. Sci. Technol. 49 (14), 8386–8395. doi:10.1021/acs.est.5b01648
Houde, M., Martin, J. W., Letcher, R. J., Solomon, K. R., and Muir, D. C. G. (2006). Biological monitoring of polyfluoroalkyl substances: A review. Environ. Sci. Technol. 40 (11), 3463–3473. doi:10.1021/es052580b
Houde, M., De Silva, A. O., Muir, D. C. G., and Letcher, R. J. (2011). Monitoring of perfluorinated compounds in aquatic biota: An updated review. Environ. Sci. Technol. 45 (19), 7962–7973. doi:10.1021/es104326w
Joerss, H., Schramm, T. R., Sun, L., Guo, C., Tang, J., and Ebinghaus, R. (2020). Per- and polyfluoroalkyl substances in Chinese and German river water – point source- and country-specific fingerprints including unknown precursors. Environ. Pollut. 267, 115567. doi:10.1016/j.envpol.2020.115567
Kwiatkowski, C. F., Andrews, D. Q., Birnbaum, L. S., Bruton, T. A., Dewitt, J. C., Knappe, D. R. U., et al. (2020). Scientific basis for managing PFAS as a chemical class. Environ. Sci. Technol. Lett. 7 (8), 532–543. doi:10.1021/acs.estlett.0c00255
Li, H., Xing, J., Sun, Y., Zhou, D., Ma, T., and Zhang, J. (2015). Water quality assessment of drinking water sources of the Yellow River main stem based on combination weighting fuzzy comprehensive evaluation method. J. Hydroecology 36 (5), 44–50. doi:10.15928/j.1674-3075.2015.05.007
Li, Q., Zhang, Y., Lu, Y., Wang, P., Suriyanarayanan, S., Meng, J., et al. (2018). Risk ranking of environmental contaminants in Xiaoqing River, a heavily polluted river along urbanizing Bohai Rim. Chemosphere 204, 28–35. doi:10.1016/j.chemosphere.2018.04.030
Lim, X. (2019). Tainted water: The scientists tracing thousands of fluorinated chemicals in our environment. Nature 566 (7742), 26–29. doi:10.1038/d41586-019-00441-1
Liu, Z., Lu, Y., Wang, T., Wang, P., Li, Q., Johnson, A. C., et al. (2016). Risk assessment and source identification of perfluoroalkyl acids in surface and ground water: Spatial distribution around a mega-fluorochemical industrial park, China. Environ. Int. 91, 69–77. doi:10.1016/j.envint.2016.02.020
Liu, Z., Lu, Y., Wang, P., Wang, T., Liu, S., Johnson, A. C., et al. (2017). Pollution pathways and release estimation of perfluorooctane sulfonate (PFOS) and perfluorooctanoic acid (PFOA) in central and eastern China. Sci. Total Environ. 580, 1247–1256. doi:10.1016/j.scitotenv.2016.12.085
Liu, L. Q., Qu, Y. X., Huang, J., and Weber, R. (2021a). Per- and polyfluoroalkyl substances (PFASs) in Chinese drinking water: Risk assessment and geographical distribution. Environ. Sci. Eur. 33 (1), 12. doi:10.1186/s12302-020-00425-3
Liu, X., Li, L., Gu, L., Hua, Z., Zhang, Y., and Xue, H. (2021b). Distribution and release of perfluorinated compounds (PFCs) in water-sediment systems: The effect of confluence channels. Sci. Total Environ. 775, 145720. doi:10.1016/j.scitotenv.2021.145720
Mclachlan, M. S., Holmström, K. E., Reth, M., and Berger, U. (2007). Riverine discharge of perfluorinated carboxylates from the European continent. Environ. Sci. Technol. 41 (21), 7260–7265. doi:10.1021/es071471p
Ministry of Ecology and Environment (2017). Announcement on issuing the list of chemicals under priority control (the first batch). Ministry of Ecology and Environment of the People's Republic of China. Available at: https://www.mee.gov.cn/gkml/hbb/bgg/201712/t20171229_428832.htm (Accessed June 15, 2022).
Ministry of Ecology and Environment (2020). Announcement on issuing the list of chemicals under priority control (the second batch). Ministry of Ecology and Environment of the People's Republic of China. Available at: https://www.mee.gov.cn/xxgk2018/xxgk/xxgk01/202011/t20201102_805937.html (Accessed June 15, 2022).
Muir, D., and Miaz, L. T. (2021). Spatial and temporal trends of perfluoroalkyl substances in global ocean and coastal waters. Environ. Sci. Technol. 55 (14), 9527–9537. doi:10.1021/acs.est.0c08035
National Bureau of Statistics of China (NBSPRC) (2021). China statistical yearbook 1978–2021. Beijing: China Statistics Press. Available at: http://www.stats.gov.cn/tjsj/ndsj/2021/indexch.htm (Accessed June 15, 2022).
Pan, Y., Zhang, H., Cui, Q., Sheng, N., Yeung, L. W. Y., Guo, Y., et al. (2017). First report on the occurrence and bioaccumulation of hexafluoropropylene oxide trimer acid: An emerging concern. Environ. Sci. Technol. 51 (17), 9553–9560. doi:10.1021/acs.est.7b02259
Pan, Y., Zhang, H., Cui, Q., Sheng, N., Yeung, L. W. Y., Sun, Y., et al. (2018). Worldwide distribution of novel perfluoroether carboxylic and sulfonic acids in surface water. Environ. Sci. Technol. 52 (14), 7621–7629. doi:10.1021/acs.est.8b00829
Posner, S. (2012). "Perfluorinated compounds: Occurrence and uses in products," in Polyfluorinated chemicals and transformation products, Editors T. P. Knepper, and F. T. Lange (Berlin, Heidelberg: Springer Berlin Heidelberg), 25–39.
Reemtsma, T., Berger, U., Arp, H. P. H., Gallard, H., Knepper, T. P., Neumann, M., et al. (2016). Mind the gap: Persistent and mobile rrganic compounds—water contaminants that slip through. Environ. Sci. Technol. 50 (19), 10308–10315. doi:10.1021/acs.est.6b03338
Shi, Y., Vestergren, R., Xu, L., Song, X., Niu, X., Zhang, C., et al. (2015). Characterizing direct emissions of perfluoroalkyl substances from ongoing fluoropolymer production sources: A spatial trend study of Xiaoqing River, China. Environ. Pollut. 206, 104–112. doi:10.1016/j.envpol.2015.06.035
Shi, B., Wang, T., Yang, H., Zhou, Y., Bi, R., Yang, L., et al. (2021). Perfluoroalkyl acids in rapidly developing coastal areas of China and South Korea: Spatiotemporal variation and source apportionment. Sci. Total Environ. 761, 143297. doi:10.1016/j.scitotenv.2020.143297
Simcik, M. F., and Dorweiler, K. J. (2005). Ratio of perfluorochemical concentrations as a tracer of atmospheric deposition to surface waters. Environ. Sci. Technol. 39 (22), 8678–8683. doi:10.1021/es0511218
Song, X., Vestergren, R., Shi, Y., Huang, J., and Cai, Y. (2018). Emissions, transport, and fate of emerging per- and polyfluoroalkyl substances from one of the major fluoropolymer manufacturing facilities in China. Environ. Sci. Technol. 52 (17), 9694–9703. doi:10.1021/acs.est.7b06657
Sunderland, E. M., Hu, X. D. C., Dassuncao, C., Tokranov, A. K., Wagner, C. C., and Allen, J. G. (2019). A review of the pathways of human exposure to poly- and perfluoroalkyl substances (PFASs) and present understanding of health effects. J. Expo. Sci. Environ. Epidemiol. 29 (2), 131–147. doi:10.1038/s41370-018-0094-1
Taniyasu, S., Kannan, K., So, M. K., Gulkowska, A., Sinclair, E., Okazawa, T., et al. (2005). Analysis of fluorotelomer alcohols, fluorotelomer acids, and short- and long-chain perfluorinated acids in water and biota. J. Chromatogr. A 1093 (1), 89–97. doi:10.1016/j.chroma.2005.07.053
Valsecchi, S., Conti, D., Crebelli, R., Polesello, S., Rusconi, M., Mazzoni, M., et al. (2017). Deriving environmental quality standards for perfluorooctanoic acid (PFOA) and related short chain perfluorinated alkyl acids. J. Hazard. Mat. 323, 84–98. doi:10.1016/j.jhazmat.2016.04.055
Wang, P., Lu, Y., Wang, T., Fu, Y., Zhu, Z., Liu, S., et al. (2014a). Occurrence and transport of 17 perfluoroalkyl acids in 12 coastal rivers in south Bohai coastal region of China with concentrated fluoropolymer facilities. Environ. Pollut. 190, 115–122. doi:10.1016/j.envpol.2014.03.030
Wang, Z., Cousins, I. T., Scheringer, M., Buck, R. C., and Hungerbühler, K. (2014b). Global emission inventories for C4–C14 perfluoroalkyl carboxylic acid (PFCA) homologues from 1951 to 2030, Part I: Production and emissions from quantifiable sources. Environ. Int. 70, 62–75. doi:10.1016/j.envint.2014.04.013
Wang, R. M., Tang, J. H., Xie, Z. Y., Mi, W. Y., Chen, Y. J., Wolschke, H., et al. (2015). Occurrence and spatial distribution of organophosphate ester flame retardants and plasticizers in 40 rivers draining into the Bohai Sea, north China. Environ. Pollut. 198, 172–178. doi:10.1016/j.envpol.2014.12.037
Wang, P., Lu, Y., Wang, T., Meng, J., Li, Q., Zhu, Z., et al. (2016a). Shifts in production of perfluoroalkyl acids affect emissions and concentrations in the environment of the Xiaoqing River Basin, China. J. Hazard. Mat. 307, 55–63. doi:10.1016/j.jhazmat.2015.12.059
Wang, T., Vestergren, R., Herzke, D., Yu, J., and Cousins, I. T. (2016b). Levels, isomer profiles, and estimated riverine mass discharges of perfluoroalkyl acids and fluorinated alternatives at the mouths of Chinese rivers. Environ. Sci. Technol. 50 (21), 11584–11592. doi:10.1021/acs.est.6b03752
Wang, P., Lu, Y., Su, H., Su, C., Johnson, A. C., Yu, L., et al. (2020). Managing health risks of perfluoroalkyl acids in aquatic food from a river-estuary-sea environment affected by fluorochemical industry. Environ. Int. 138, 105621. doi:10.1016/j.envint.2020.105621
Keywords: PFAS, Rivers, seasonal variations, mass discharges, ecological risks
Citation: Wang R, Zhang J, Yang Y, Chen C-E, Zhang D and Tang J (2022) Emerging and legacy per-and polyfluoroalkyl substances in the rivers of a typical industrialized province of China: Spatiotemporal variations, mass discharges and ecological risks. Front. Environ. Sci. 10:986719. doi: 10.3389/fenvs.2022.986719
Received: 05 July 2022; Accepted: 07 September 2022;
Published: 18 October 2022.
Edited by:
Prosun Bhattacharya, Royal Institute of Technology, SwedenReviewed by:
Tieyu Wang, Shantou University, ChinaGuijin Su, Research Center for Eco-environmental Sciences (CAS), China
Copyright © 2022 Wang, Zhang, Yang, Chen, Zhang and Tang. This is an open-access article distributed under the terms of the Creative Commons Attribution License (CC BY). The use, distribution or reproduction in other forums is permitted, provided the original author(s) and the copyright owner(s) are credited and that the original publication in this journal is cited, in accordance with accepted academic practice. No use, distribution or reproduction is permitted which does not comply with these terms.
*Correspondence: Jianhui Tang, jhtang@yic.ac.cn