Impacts on Meteorological Parameters and Pollutants by Aerosol Direct Radiative Effect Over Tianjin, China
 Jian Hao
 Ziying Cai3,4*
 - 1Tianjin Institute of Meteorological Science, Tianjin, China
- 2Tianjin Key Laboratory for Oceanic Meteorology, Tianjin, China
- 3Tianjin Environmental Meteorological Center, Tianjin, China
- 4CMA-NKU Cooperative Laboratory for Atmospheric Environment-Health Research, Tianjin, China
- 5Beichen Meteorological Bureau, Tianjin, China
The direct radiative effect (DRE) of anthropogenic aerosols on meteorological elements and pollutants over Tianjin, China, was investigated using a fully coupled meteorology-chemistry model [Weather Research and Forecasting (WRF) model coupled with Chemistry (WRF-Chem)] for the entire year of 2021. The results showed that the ground solar radiation decreased from 208.84 W m−2 to 194.52 W m−2 due to DRE in Tianjin, and the percentage of the reduction was 6.86%. The reduction of ground solar radiation resulted in a 0.90% decrease in temperature, 1.13% decrease in boundary layer height, and 6.01% decrease in visibility, respectively, and a 0.80% increase in relative humidity. Changes in meteorological parameters changed the diffuse conditions of pollutants, leading to an increase of PM2.5. Higher concentration of pollutants leads to stronger DRE, and the percentages of changes caused by DRE on polluted days are higher than those on clean days. The DRE influence on pollutants can be summarized as a weather → aerosol → weather → air quality circulation mechanism. The DRE had more severe influence on meteorological elements and pollutants on foggy days. With the emission reduction of pollutants, the influence of the DRE has declined.
Introduction
The aerosol particles are suspended in the atmosphere. They can reduce atmospheric visibility, impede air quality, and harm human health (Cao et al., 2013; Liu et al., 2014; Gupta et al., 2016; Liang et al., 2016; Syu et al., 2016; Khaefi et al., 2017); they can also affect the earth’s climate directly by scattering and absorbing solar and terrestrial radiation and indirectly by serving as cloud condensation nuclei (CCN) and ice nuclei (IN), whereby influencing the microphysical and radiative properties of clouds (Mccormick and Ludwig, 1967; Twomey, 1974; Twomey, 1977; Albrecht, 1989; Charlson et al., 1992; Ramanathan et al., 2001; IPCC, 2013). The IPCC Fifth Assessment Report AR5 (Myhre et al., 2013) shows that the total (all aerosol types) global aerosol radiative forcing is −0.35 Wm−2 (uncertainty range between −0.85 and +0.15 Wm−2). Compared to the previous AR4, there is a decrease in the negative radiative forcing and an increase in the range, which even includes a positive radiative. This indicates that the effects of aerosols on solar radiation are still not well understood and further research is needed.
The aerosol radiative effect can reduce the occurrence of precipitation, affect the East Asian monsoon, and enhance the fog range (Wu and Han., 2011; Wu and Zhou, 2013; Li et al., 2015). Studies in Eastern China show that due to the large number of pollution emission generated by human activities, a vicious cycle between weather and aerosol is formed under adverse weather conditions (Zhang et al., 2013). That is, when adverse meteorological conditions occur, there are larger amounts of small particles in the air, which reduces the solar radiation reaching the surface through scattering and absorption, thus weakening the atmospheric turbulence and reducing the height of the boundary layer, making the atmosphere more stable and meteorological conditions more unfavorable to the diffusion of pollutants (Liu et al., 2011). In addition, under high-humidity conditions, the presence of a large number of fog condensation nuclei (FCN) in the air on heavily polluted days will prolong the life time and enhance the intensity of fog. A long-time maintenance of the inversion in fog top and light wind weather in the fog area further aggravate the degree of heavy pollution, thus leading to frequent and long-term maintenance of heavy pollution (Deng et al., 2011; Zhang et al., 2011; Zhang et al., 2012).
A lot of studies have been conducted to research the influence of aerosol direct radiative effect through observations (Patadia et al., 2008; Li et al., 2017; Zhang et al., 2019; Kumar et al., 2020; Nojarov et al., 2021) and model simulations (Wang et al., 2015; Das et al., 2016; Sekiguchi et al., 2018; Nguyen et al., 2019). In recent years, with the emergence of online coupled bidirectional feedback weather chemical models, quantitative description of mesoscale weather models has become an option. The Weather Research and Forecasting (WRF) model coupled with Chemistry (WRF-Chem) is a mesoscale online coupled meteorology-chemistry model developed by NCAR, universities, and research institutes. The WRF-Chem model considers the chemical processes of air pollution, advective transport, and turbulent diffusion and wet and dry deposition processes, which is widely used in global air quality forecasts and simulations (Forkel et al., 2012; Forkel et al., 2013; Crippa et al., 2016; Kedia et al., 2016). Liao et al. (2015), Yang et al. (2015), and Cai et al. (2017) used the WRF-Chem model to study the influence of aerosol direct radiative effect on temperature, fog-haze, and pollutants.
Tianjin is the largest open coastal city in north China, west of Beijing. It is located on the west coast of the Pacific Ocean, north of the North China Plain, east of the Bohai Sea, and north of the Yanshan Mountains. With the rapid development of the economy and industrialization process in Tianjin, environmental pollution is still not well controlled, and the aerosol direct radiative effect in Tianjin is not well understood. In this article, the WRF-Chem model was used to simulate the influence of aerosol direct radiative effect on the meteorological parameters and pollutants in Tianjin to provide better conclusions to control air pollution.
Model and Data Description
Monitoring Data
The meteorological data were collected from 13 regional meteorological stations, Tianjin, China, during 01-01-2021 to 31-12-2021, including hourly data of temperature, relative humidity, atmospheric pressure, and precipitation. The pollutant data such as PM2.5, PM10, SO2, CO, and O3 were collected from the Tianjin environmental monitoring center with a time resolution of 5 min during 01-01-2021 to 31-12-2021. The pollutant data were from 20 environmental monitoring stations belonging to the Tianjin environmental monitoring center. The incorrect data were culled, and the pollutant data were calculated into an hourly average.
Model Configurations
The Weather Research and Forecasting (WRF) model coupled with Chemistry (WRF-Chem) version 3.8.1, a fully coupled, online meteorology-chemistry model (Grell et al., 2005), was used to investigate the DRE of anthropogenic aerosol in Tianjin, China. The Carbon Bond Mechanism, version Z (CBMZ), gas-phase chemistry mechanism, and the Model for Simulating Aerosol Interactions and Chemistry (MOSAIC) scheme for aerosol simulation were selected (Fast et al., 2006). Aerosol radiative feedback was coupled with the radiative transfer model (RRTMG) for both shortwave and longwave radiation. The simulations were performed at a 15 km horizontal resolution, covering China and its surrounding areas with 121 × 121 grid cells, the central latitude and longitude being 39N° and 116E°. The 41 vertical layers from the ground level to the top pressure of 50 hPa were used for all grids. The boundary layer parameter scheme used the Yonsei University (YSU) scheme. The land surface parameter scheme used the Noah scheme. The microphysical parameter schemes used the single-moment 5-class microphysics (WSM5) scheme.
Experimental Design
Three cases were designed to study the influence of the DRE on meteorological parameters and pollutants. The DRE was considered in case 1. The Tsinghua University MEIC 2020 anthropogenic emission source inventory was used for the simulation of the entire year of 2021, covering the simulation area except Tianjin, with a resolution of 0.25° × 0.25°. The emission source used over Tianjin was the data from the Tianjin emission census in 2021. In order to discuss the DRE influence, case 2 did not consider the DRE. The emission source was the same as in case 1. Case 3 considered the DRE; the emission was from the Tsinghua University MEIC 2015 anthropogenic emission source inventory. The simulation was also conducted for the entire year of 2021. The emission reduction was conducted since 2015, and the aim of case 3 was to study the influence of emission reduction of pollutants. The initial meteorological fields and boundary conditions were from the 6 h National Centers for Environmental Prediction (NCEP) Final Analysis (FNL) with 1° × 1° spatial resolution. The FNL meteorological initial field was reused every 24 h, and the outputs from previous runs were used as the pollution field initial conditions for the next run.
Results and Discussions
Model Evaluation
Before the discussion of the DRE influence, whether the simulation results can be used should be ensured. As case 1 was more similar to reality, the observation data and simulation results of case 1 are listed in Table 1, including PM2.5, temperature (T), and relative humidity (RH). Their correlation coefficient and the annual mean relative error were calculated. The simulated PM2.5 was at a height of 2–5 m, and the simulated temperature and RH were at a height of 2 m. The simulation result was averaged from 13 regional stations’ simulation results.
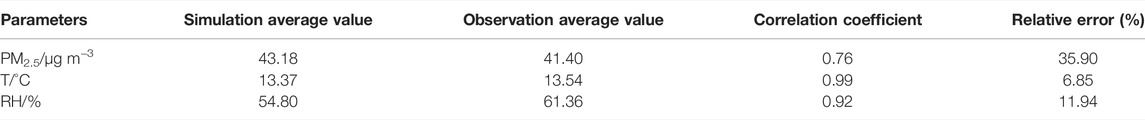
TABLE 1. The statistical correlation between observation data and simulation results of WRF-Chem.
The simulated PM2.5 in 2021 was 43.18 μg m−3, and the PM2.5 observation was 41.20 μg m−3. The bias of the simulated PM2.5 was just 1.78 μg m−3, and the relative error was 35.90%. The correlation coefficient between simulated PM2.5 and PM2.5 observation was 0.76. They were in a positive linear correlation (Figure 1). The bias value of simulated PM2.5 less than 10 μg m−3, 15 μg m−3, 20 μg m−3, and 25 μg m−3 accounted for 44.93%, 65.48%, 75.34%, and 82.19%, respectively, in total samples. Therefore, the PM2.5 simulation results of WRF-Chem were close to the observation data, and the simulation performance was good. The biases of T and RH were 0.17°C and 6.56%, and the correlation coefficients were 0.99 and 0.92. WRF-Chem was more accurate in the simulation of meteorological elements. Overall, the simulation results were reliable, which can prove the performance of WRF-Chem was good.
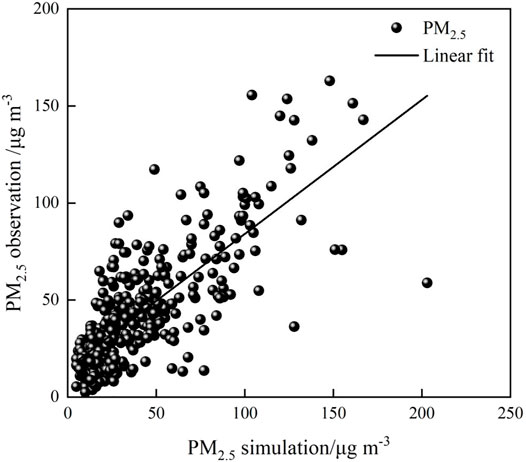
FIGURE 1. Linear relationship between the PM2.5 observation data and PM2.5 simulation result.
The Direct Radiative Effect on Ground Solar Radiation
The DRE is the effect of aerosols affecting the earth’s climate directly by scattering and absorbing solar and terrestrial radiation. The simulation results showed that ground solar radiation (GSR) was reduced due to the DRE in Tianjin, China. The simulated GSR was 194.52 W m−2 in case 1 and 208.84 W m−2 in case 2. The simulated GSR was reduced by 14.32 W m−2 in 2021 in Tianjin due to the DRE, and the percentage of reduction was 6.86%. The reduction and reduction percentage in each month are shown in Figure 2. In March, the decline was most pronounced; the GSR was reduced by 21.72 W m−2 with a percentage of 10.81%. The declines in June and August were also evident, with values of 20.73 W m−2 and 19.03 W m−2, while the reductions in October and December were the most inapparent, with a value of less than 10 W m−2. The GSR decreased most in summer, then spring, and autumn and least in winter. The reduction percentage value was in the range of 5.24%–10.81%. The order of reduction percentage from high to low was winter, autumn, spring, and summer. Although the GSR and its reduction were most in summer and least in winter, the DRE had the most severe influence in winter.
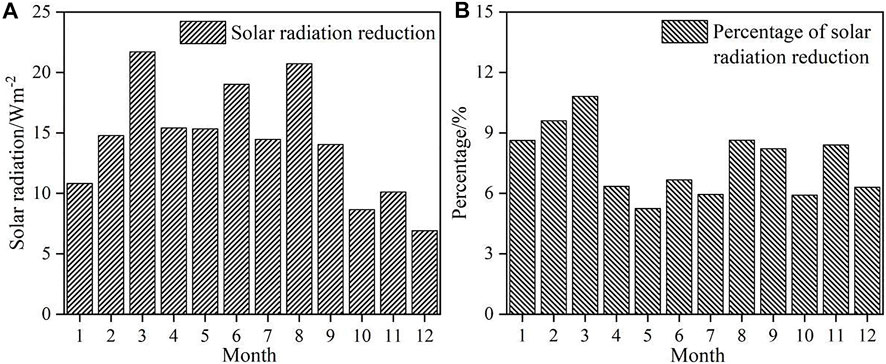
FIGURE 2. Reduction (A) and percentage of reduction (B) of simulated ground solar radiation caused by the DRE in 2021.
The Direct Radiative Effect on Meteorological Parameters
The scattering of aerosol can reduce the incoming solar radiation and lead to a reduction of GSR, and then, the temperature decreases. The black carbon can absorb the incoming radiation and heat the atmosphere. The DRE broke the original thermal and dynamic structure of the boundary layer, further affected the transport of water vapor, turbulence, sensible heat, and latent heat, and then, changed the meteorological elements. As Table 2 shows, the annual temperature decreased by 0.12°C, RH increased by 0.45%, planetary boundary layer height (PBLH) decreased by 14.99 m, and the visibility decreased by 1.61 km. The DRE decreased the temperature firstly, then the evaporation process was weakened, and the RH increased.
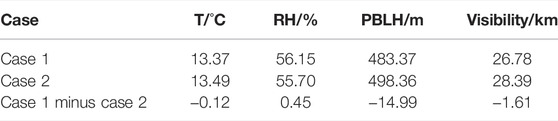
TABLE 2. The DRE on simulated meteorological elements.
The reduction of temperature caused by the DRE in all months is shown in Figure 3. The temperature decreased 0.18°C in February, the highest decrement in the whole year. The reduction in August and January followed February with 0.17°C and 0.15°C, and the temperature decreased less than 0.15°C in all other months. The simulated temperature decreased most in winter, then autumn, and summer and least in spring. The seasonal variation trend of simulated temperature reduction and percentage of GSR reduction was the same. Winter and autumn were more influenced by the DRE than spring and summer. Furthermore, the linear correlation coefficient between these two parameters was 0.69. It means that the effect of DRE on temperature is most direct and significant.
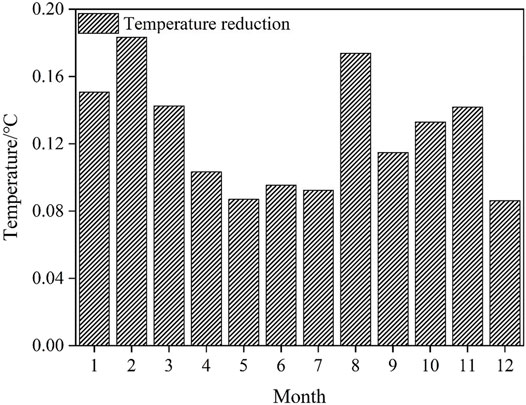
FIGURE 3. Reduction of simulated temperature caused by the DRE in each month of 2021.
PBLH is determined by the solar radiation, weather system, and local terrain. With the variation of GSR, the PBLH also varied. The decrease in simulated PBLH was in the range of 7.98–22.60 m. The reduction percentage of the simulated PBLH was the highest in August with 4.85%, followed by February and March with 4.33% and 4.20% (Figure 4). The seasonal variation trend of simulated PBLH reduction percentage was the same as the reduction of simulated temperature and reduction percentage of GSR. The DRE caused a worse diffusion condition for the pollutants.
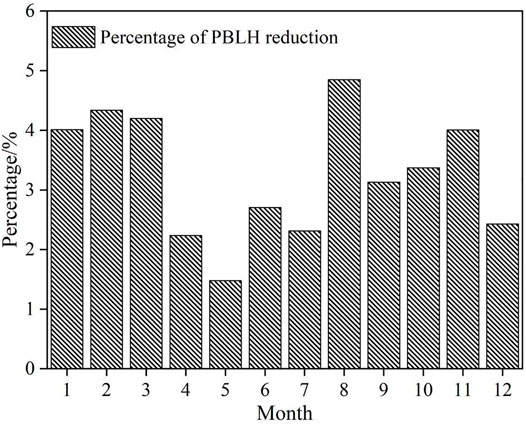
FIGURE 4. Simulated PBLH reduction percentage caused by the DRE in 2021.
Relation Between the Direct Radiative Effect and Pollutants
Simulated PM2.5 caused by the DRE increased by 1.62 μg m−3, and the percentage was 3.75%, while the simulated O3 decreased by 0.97%. As shown in Figure 5, the simulated PM2.5 increased throughout the year. The increment percentage in August was 8.26%, which was the highest in the whole year, and the value in December was the lowest, which was 1.35%. The increase in summer and autumn was higher than in spring and winter. According to the statistics of 365 daily samples throughout the year, the maximum increment was 23.35 μg m−3. The increment in 0.27% of the total simulated days was larger than 20 μg m−3, and the values larger than 10 μg m−3 and 5 μg m−3 accounted for 1.64% and 7.95% of the total simulated days. While on 59.45% of the total days, the feedback of the DRE was not obvious, the increment was less than 1 μg m−3. The DRE changed the atmospheric stability and meteorological diffusion conditions by breaking the radiation balance, thus increasing the aerosol number concentration. The increase in PM2.5 further enhanced DRE and formed a positive feedback, resulting in poor air quality. The DRE affected meteorological elements such as temperature, RH, and PBLH and then changed the diffusion conditions of pollutants, which can be expressed as a cyclic feedback effect of weather → aerosol → weather → air quality.
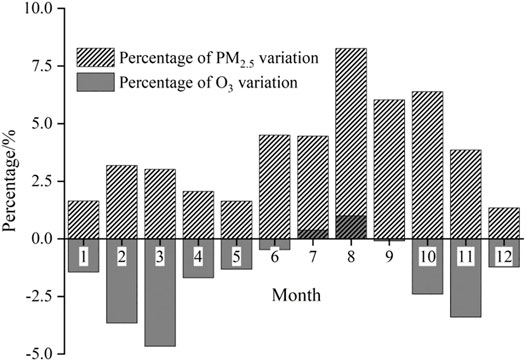
FIGURE 5. Percentage of simulated PM2.5 and O3 variation caused by the DRE in 2021.
The DRE of anthropogenic aerosols mainly inhibited the generation of O3 in the Tianjin area. Except for July and August, the simulated O3 decreased in all other months, with the reduction percentage ranging from 0.09% to 4.66%. The increment percentage in July and August was 0.38% and 1.00%. The reduction percentage was the highest in March and the lowest in September. As a photochemical pollutant, O3 was more sensitive to radiation than diffusion (Gao et al., 2020). As the GSR decreased, the photochemical intensity decreased, resulting in the decrease of O3 concentration.
The days with a daily average observed PM2.5 > 115 μg m−3 were defined as polluted days, and the other days were clean days (Chen et al., 2016); there were 15 polluted days in 2021. Table 3 shows the DRE on meteorological elements and pollutants on polluted days and clean days. As shown in Table 3, the GSR of polluted days was weaker than that of clean days. This is because the pollution cases almost occurred in autumn and winter with weak basic solar radiation. Meanwhile, polluted days were also characterized by low temperature, high RH, and low PBLH (Han et al., 2018a; Han et al., 2018b).
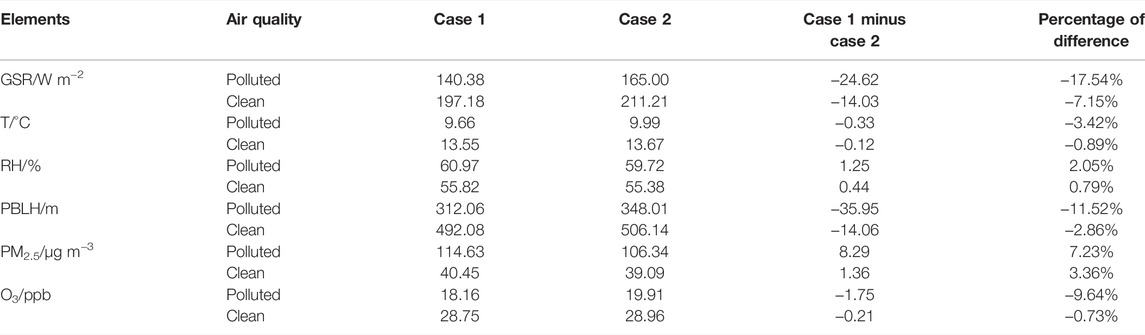
TABLE 3. The DRE on meteorological elements and pollutants on polluted days and clean days.
Table 3 shows that the meteorological parameters and pollutants were influenced strongly on polluted days than on clean days. The GSR decreased by 17.54% due to the DRE on polluted days, 10% higher than on clean days. As the aerosol concentration on polluted days was higher than on clean days, more solar radiation was scattered by aerosol particles at high altitude, leading to more reduction of the GSR, and the DRE was enhanced. The decrement of T was 0.33°C on polluted days and 0.12°C on clean days, the percentage of decrement was 3.42% and 0.89%, and the reduction percentage of T on polluted days was about four times that of clean days. The RH increased 2.05% and 0.79% on polluted and clean days, respectively; the PBLH decreased by 35.95 m on polluted days and 14.06 m on clean days. Due to the DRE, the variation of T, RH, and PBLH was significantly higher on polluted days. PM2.5 increased to 8.29 μg m−3 with a percentage of 7.23% on polluted days and 1.36 μg m−3 with a percentage of 3.36%, which was half of that on polluted days. The DRE decreased O3 by 1.71 and 0.20 ppb on polluted and clean days, respectively, and O3 was almost not affected by the DRE on clean days.
The formation and maintenance of fog are affected by solar radiation and the boundary layer. The DRE can aggravate air pollution, and its influence on foggy days was studied in the following. The definition of foggy days should meet the following three conditions: 1) RH > 90%; 2) visibility < 1 km; and 3) foggy weather had been recorded in more than 50% regional meteorological stations. From the statistics, there were 33 foggy days in 2021.
Table 4 shows the DRE on meteorological elements and pollutants on foggy days and non-foggy days. On foggy days, the temperature was low, RH was high, GSR was weak, and the PBLH was low. The DRE led to a more severe change on foggy days in both the meteorological parameters and the pollutants. T decreased more than two times on foggy days than on non-foggy days, RH and PM2.5 increased two times on non-foggy days, and PBLH and O3 decreased two times and about four times on non-foggy days. On foggy days, the DRE can play a stronger role on the meteorological elements and pollutants which lead to external conditions that are not conductive to fog dissipation. The fog water content (FWC) increased to 1.39 μg kg−1 by a percentage of 22.13% due to the DRE, meaning the concentration of fog droplets increased. The DRE strengthened the intensity of fog by influencing the meteorological conditions and increasing the aerosol concentrations in the atmosphere, and higher concentration of fog condensation nuclei, lower temperature, lower boundary layer height, and higher RH were made for the maintenance and strengthening of fog.
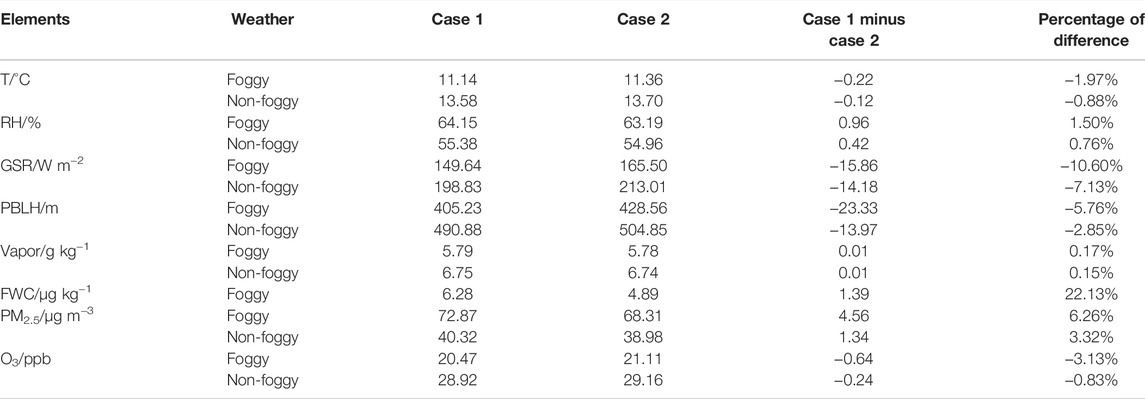
TABLE 4. The DRE on meteorological elements and pollutants on foggy days and non-foggy days.
Influence of Pollution Abatement on the Direct Radiative Effect
The influence of emission reduction is studied through simulation of case 3. In case 3, the emission source is from the year of 2015, and the rest of the parameters were set as in case 1.
The pollutant emission in Tianjin from MEIC 2015 and the Tianjin emission census in 2021 listed in Table 5 was the sum of the whole year. It can be seen that from 2015 to 2021, the emission of all pollutants decreased obviously. The primary emission of PM2.5 in 2015 was 1.65 times that of 2021. Due to the effective control of air pollution in recent years, the simulated PM2.5 decreased from 69.34 μg m−3 in 2015 to 43.18 μg m−3 in 2021 (Table 6), the value in 2015 was 1.61 times that in 2021, and the emission reduction effectively reduced PM2.5 pollution. As a significant emission reduction effect of pollutants, the GSR increased from 184.80 W m−2 in 2015 to 194.52 W m−2 in 2021, with an increment of 9.72 W m−2. Meanwhile, the temperature and PBLH increased 0.05°C and 10.42 m, respectively, while the RH decreased 0.23% influenced by the emission reduction. Overall, the control of air pollution has been very effective.
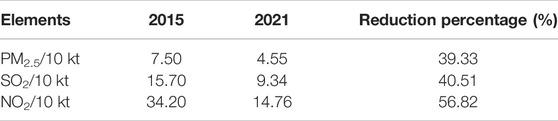
TABLE 5. Pollutant emission in Tianjin in 2015 and 2021.
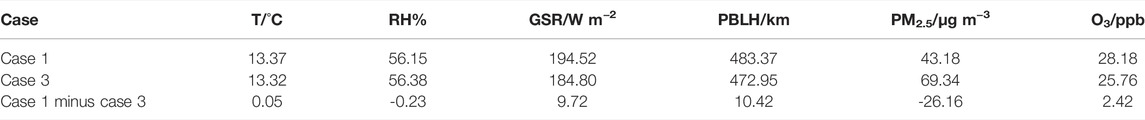
TABLE 6. Effects of emission reduction on meteorological elements and pollutants.
The percentage of the GSR and PBLH increment in each month is shown in Figures 6, 7. In October, the percentages of the GSR and PBLH increment were both the highest of the whole year, and the lowest value of the percentage was shown in May. The emission reduction was most significant in autumn and least significant in spring.
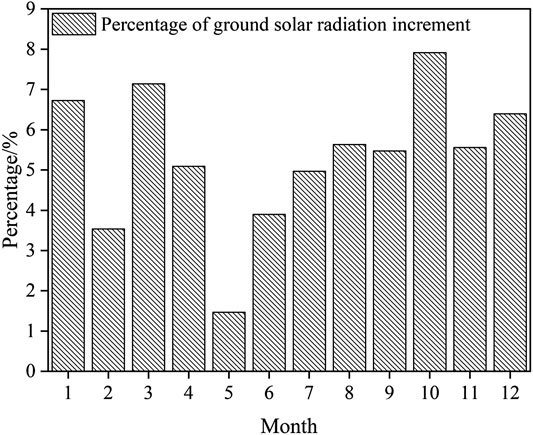
FIGURE 6. Percentage of simulated ground solar radiation increment caused by emission reduction from 2015 to 2021.
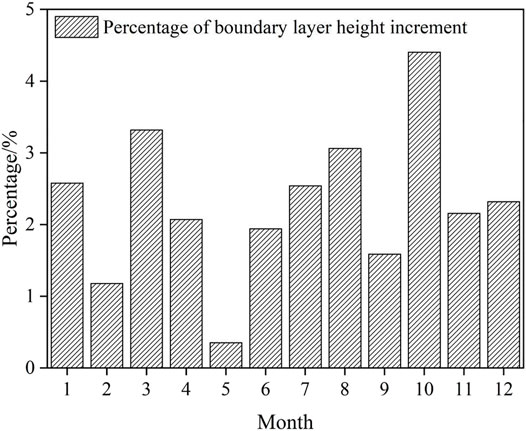
FIGURE 7. Percentage of simulated planetary boundary layer height increment caused by emission reduction from 2015 to 2021.
On foggy days, the effect of emission reduction on meteorological parameters and pollutants was more significant than on non-foggy days except for the RH and PM2.5 (Table 7). That means the improvement of air quality plays a certain role in reducing the occurrence and development of fog.
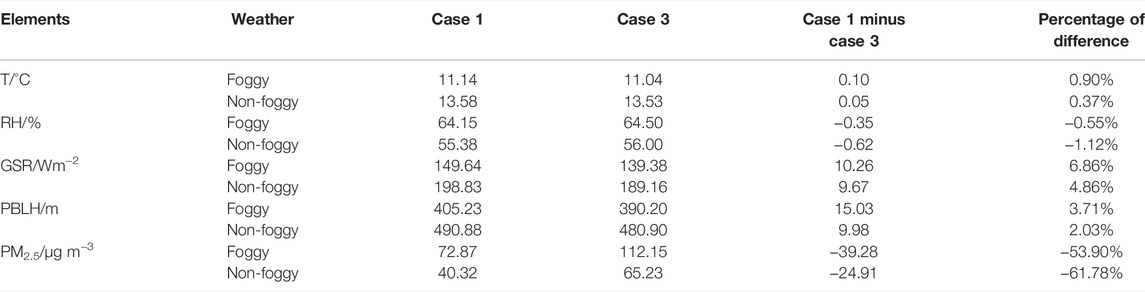
TABLE 7. Simulated meteorological parameters and pollutants on foggy and non-foggy days caused by emission reduction from 2015 to 2021.
Conclusion
Based on the simulation of three cases by WRF-Chem, the direct radiative effect of anthropogenic aerosols on meteorological parameters and pollutants was studied. The direct radiative effect on polluted days and foggy days was analyzed, and the results of emission reduction from 2015 to 2021 were also shown. The results showed the following:
1) Affected by the direct radiative effect, the simulated ground solar radiation in Tianjin decreased to 14.32 W m−2 with a percentage of 6.86% in 2021. The other simulated meteorological parameters such as temperature, boundary layer height, and visibility decreased by 0.12°C, 5.48 m, and 1.61 km, respectively, and the relative humidity increased by 0.45%, which caused a worse diffusion condition for the pollutants. The direct radiative effect was more pronounced in winter and autumn than in summer and spring.
2) A worse diffusion condition caused by the direct radiative effect concentrated the aerosol particles in the boundary layer, leading to an increment of PM2.5. On the opposite, weaker solar radiation was not conducive to photochemical reactions and reduced O3 content. A more polluted environment strengthened the direct radiative effect; all the meteorological parameters and pollutants had greater magnitude of change caused by the direct radiative effect on polluted days. A cyclic feedback effect of weather → aerosol → weather → air quality can be described on polluted days.
3) The emission reduction conducted during 2015–2021 was effective with a reduction percentage of 39.33% in PM2.5. Improvement in air quality increased the temperature by 0.05°C, ground solar radiation by 9.72 W m−2, and boundary layer height by 10.42 m and decreased the relative humidity by 0.23%. The meteorological parameters were beneficial to the diffusion of pollutants, reduction of pollution, and suppression of occurrence and development of fog.
Data Availability Statement
The original contributions presented in the study are included in the article/Supplementary Material; further inquiries can be directed to the corresponding author.
Author Contributions
JH is responsible for full manuscript writing, ZC is responsible for the simulation, SH polished the manuscript, GM and MZ looked for the observation data, and XQ ensured the normal operation of the mode.
Funding
This study was jointly sponsored by the National Natural Science Foundation of China (Grant No. 42130513) and the Bohai Rim Meteorological Science Collaborative Innovation Fund (QYXM202014).
Conflict of Interest
The authors declare that the research was conducted in the absence of any commercial or financial relationships that could be construed as a potential conflict of interest.
Publisher’s Note
All claims expressed in this article are solely those of the authors and do not necessarily represent those of their affiliated organizations, or those of the publisher, the editors, and the reviewers. Any product that may be evaluated in this article, or claim that may be made by its manufacturer, is not guaranteed or endorsed by the publisher.
References
Albrecht, B. A. (1989). Aerosols, Cloud Microphysics, and Fractional Cloudiness. Science 245, 1227. doi:10.1126/science.245.4923.1227
Cai, Z. Y., Yao, Q., Han, S. Q., and Liu, J. L. (2017). The Influence of the Air Quality and Meteorological Field about Aerosol Direct Climate Effect on Tianjin. Chin. Environ. Sci. 37 (3), 908–914. (in Chinese).
Cao, J., Chow, J. C., Lee, F. S. C., and Watson, J. G. (2013). Evolution of PM2.5 Measurements and Standards in the U.S. And Future Perspectives for China. Aerosol Air Qual. Res. 13, 1197–1211. doi:10.4209/aaqr.2012.11.0302
Charlson, R. J., Schwartz, S. E., Hales, J. M., Cess, R. D., Coakley, J. A., Hansen, J. E., et al. (1992). Climate Forcing by Anthropogenic Aerosols. Science 255, 423–430. doi:10.1126/science.255.5043.423
Chen, W., Tang, H., and Zhao, H. (2016). Urban Air Quality Evaluations under Two Versions of the National Ambient Air Quality Standards of China. Atmos. Pollut. Res. 7 (1), 49–57. doi:10.1016/j.apr.2015.07.004
Crippa, P., Sullivan, R. C., Thota, A., and Pryor, S. C. (2016). Evaluating the Skill of High-Resolution WRF-Chem Simulations in Describing Drivers of Aerosol Direct Climate Forcing on the Regional Scale. Atmos. Chem. Phys. 16 (1), 397–416. doi:10.5194/acp-16-397-2016
Das, S., Dey, S., and Dash, S. K. (2016). Direct Radiative Effects of Anthropogenic Aerosols on Indian Summer Monsoon Circulation. Theor. Appl. Climatol. 124, 629–639. doi:10.1007/s00704-015-1444-8
Deng, Z. Z., Zhao, C. S., Ma, N., Liu, P. F., Ran, L., Xu, W. Y., et al. (2011). Size-resolved and Bulk Activation Properties of Aerosols in the North China Plain. Atmos. Chem. Phys. 11 (8), 3835–3846. doi:10.5194/acp-11-3835-2011
Fast, J. D., Gustafson, W. I., Easter, R. C., Zaveri, R. A., and Peckham, S. E. (2006). Evolution of Ozone, Particulates, and Aerosol Direct Radiative Forcing in the Vicinity of Houston Using a Fully Coupled Meteorology-Chemistry-Aerosol Model. J. Geophys. Res. Atmos. 111, D21. doi:10.1029/2005jd006721
Forkel, R., Werhahn, J., Hansen, A. B., Mckeen, S., Peckham, S., Grell, G., et al. (2012). Effect of Aerosol-Radiation Feedback on Regional Air Quality - A Case Study with WRF/Chem. Atmos. Environ. 53, 202–211. doi:10.1016/j.atmosenv.2011.10.009
Forkel, R., Werhahn, J., and Suppan, P. (2013). Case Studies on Aerosol Feedback for Europe with WRF-Chem. EGU General Assembly Conference Abstracts.
Gao, J., Li, Y., Zhu, B., Hu, B., Wang, L., and Bao, F. (2020). What Have We Missed when Studying the Impact of Aerosols on Surface Ozone via Changing Photolysis Rates? Atmos. Chem. Phys. 20, 10831–10844. doi:10.5194/acp-20-10831-2020
Grell, G. A., Peckham, S. E., Schmitz, R., Mckeen, S. A., Frost, G., Skamarock, W. C., et al. (2005). Fully Coupled “Online” Chemistry within the WRF Model. Atmos. Environ. 39, 6957–6975. doi:10.1016/j.atmosenv.2005.04.027
Gupta, G. P., Kumar, B., Singh, S., and Kulshrestha, U. C. (2016). Deposition and Impact of Urban Atmospheric Dust on Two Medicinal Plants during Different Seasons in NCR Delhi. Aerosol Air Qual. Res. 16, 2920–2932. doi:10.4209/aaqr.2015.04.0272
Han, S.-q., Hao, T.-y., Zhang, Y.-f., Liu, J.-l., Li, P.-y., Cai, Z.-y., et al. (2018a). Vertical Observation and Analysis on Rapid Formation and Evolutionary Mechanisms of a Prolonged Haze Episode over Central-Eastern China. Sci. Total Environ. 616-617, 135–146. doi:10.1016/j.scitotenv.2017.10.278
Han, S., Liu, J., Hao, T., Zhang, Y., Li, P., Yang, J., et al. (2018b). Boundary Layer Structure and Scavenging Effect during a Typical Winter Haze-Fog Episode in a Core City of BTH Region, China. Atmos. Environ. 179, 187–200. doi:10.1016/j.atmosenv.2018.02.023
Intergovernmental Panel on Climate Change (IPCC) (2013). “Climate Change 2013: The Physical Science Basis,” in Contribution of Working Group I to the Fifth Assessment Report of the Intergovernmental Panel on Climate Change (Cambridge, United Kingdom and New York, NY, USA: Cambridge University Press).
Kedia, S., Cherian, R., Islam, S., Das, S. K., and Kaginalkar, A. (2016). Regional Simulation of Aerosol Radiative Effects and Their Influence on Rainfall over India Using WRFChem Model. Atmos. Res. 182, 232–242. doi:10.1016/j.atmosres.2016.07.008
Khaefi, M., Geravandi, S., Hassani, G., Yari, A. R., Soltani, F., Dobaradaran, S., et al. (2017). Association of Particulate Matter Impact on Prevalence of Chronic Obstructive Pulmonary Disease in Ahvaz, Southwest Iran during 2009-2013. Aerosol Air Qual. Res. 17, 230–237. doi:10.4209/aaqr.2015.11.0628
Kumar, K. R., Devi, N. L., Khan, R., Kang, N., and Griffith, D. (2020). Multi-year Analysis of Aerosol Optical Properties and Implications to Radiative Forcing over Urban Pretoria, South Africa. Theor. Appl. Climatol. 141 (1-2), 1–15. doi:10.1007/s00704-020-03183-7
Li, Y., Song, J., and Sun, L. (2015). A Numerical Study of Sulfate Aerosol Direct Effect and its Impact on the East Asia Climate. J. Meteorol. Res. Appl. 36 (3), 13–21. (in Chinese). doi:10.3969/j.issn.1673-8411.2015.03.003
Li, J., Jiang, Y., Xia, X., and Hu, Y. (2017). Increase of Surface Solar Irradiance across East China Related to Changes in Aerosol Properties during the Past Decade. Environ. Res. Lett. 13, 034006. doi:10.1088/1748-9326/aaa35a
Liang, D., Wang, Y. Q., Ma, C., and Wang, Y. J. (2016). Variability in Transport Pathways and Source Areas of PM10 in Beijing during 2009–2012. Aerosol Air Qual. Res. 16, 3130–3141. doi:10.4209/aaqr.2015.01.0057
Liao, L., Lou, S. J., Fu, Y., Chang, W. Y., and Liao, H. (2015). Radiative Forcing of Aerosols and its Impact on Surface Air Temperature on the Synoptic Scale in Eastern China. Chin. J. Atmos. Sci. 39 (1), 68–82. (in Chinese). doi:10.3878/j.issn.1006-9895.1402.13302
Liu, X., Xie, X., Yin, Z., Liu, C., and Gettelman, A. (2011). A Modeling Study of the Effects of Aerosols on Clouds and Precipitation over East Asia. Theor. Appl. Climatol. 106 (3), 343–354. doi:10.1007/s00704-011-0436-6
Liu, Y.-J., Zhang, T.-T., Liu, Q.-Y., Zhang, R.-J., Sun, Z.-Q., and Zhang, M.-G. (2014). Seasonal Variation of Physical and Chemical Properties in TSP, PM10 and PM2.5 at a Roadside Site in Beijing and Their Influence on Atmospheric Visibility. Aerosol Air Qual. Res. 14, 954–969. doi:10.4209/aaqr.2013.01.0023
Mccormick, R. A., and Ludwig, J. H. (1967). Climate Modification by Atmospheric Aerosols. Science 156, 1358–1359. doi:10.1126/science.156.3780.1358
Myhre, G., Shindell, D., Br´ eon, F.-M., Collins, W., Fuglestvedt, J., Huang, J., et al. (2013). “Anthropogenic and Natural Radiative Forcing,” in Climate Change 2013: The Physical Science Basis. Contribution of Working Group I to the Fifth Assessment Report of the Intergovernmental Panel on Climate Change. Editors T. F. Stocker, D. Qin, G.-K. Plattner, M. Tignor, S. K. Allen, J. Boschunget al. (Cambridge, United Kingdom and New York, NY, USA: Cambridge University Press).
Nguyen, G. T. H., Shimadera, H., Sekiguchi, A., Matsuo, T., and Kondo, A. (2019). Investigation of Aerosol Direct Effects on Meteorology and Air Quality in East Asia by Using an Online Coupled Modeling System. Atmos. Environ. 207, 182–196. doi:10.1016/j.atmosenv.2019.03.017
Nojarov, P., Arsov, T., Kalapov, I., and Angelov, H. (2021). Aerosol Direct Effects on Global Solar Shortwave Irradiance at High Mountainous Station Musala, Bulgaria. Atmos. Environ. 244, 117944. doi:10.1016/j.atmosenv.2020.117944
Patadia, F., Gupta, P., and Christopher, S. A. (2008). First Observational Estimates of Global Clear Sky Shortwave Aerosol Direct Radiative Effect over Land. Geophys. Res. Lett. 35, L04810. doi:10.1029/2007GL032314
Ramanathan, V., Crutzen, P. J., Kiehl, J. T., and Rosenfeld, D. (2001). Aerosols, Climate, and the Hydrological Cycle. Science 294, 2119–2124. doi:10.1126/science.1064034
Sekiguchi, A., Shimadera, H., and Kondo, A. (2018). Impact of Aerosol Direct Effect on Wintertime PM2.5 Simulated by an Online Coupled Meteorology-Air Quality Model over East Asia. Aerosol Air Qual. Res. 18 (4), 1068–1079. doi:10.4209/aaqr.2016.06.0282
Syu, J.Y., Cheng, Y.C., Kao, Y.Y., Liang, C. S., Yan, Y. L., and Lai, C. Y. (2016). The Horizontal and Vertical Characteristics of Aeolian Dust From Riverbed. Aerosol Air Qual. Res. 16, 3026–3036. doi:10.4209/aaqr.2016.08.0347
Twomey, S. (1977). The Influence of Pollution on the Shortwave Albedo of Clouds. J. Atmos. Sci. 34, 1149–1152.
Twomey, S. (1974). Pollution and the Planetary Albedo. Atmos. Environ. (1967) 8, 1251–1256. doi:10.1016/0004-6981(74)90004-3
Wang, J., Allen, D. J., Pickering, K. E., Li, Z., and He, H. (2015). Impact of Aerosol Direct Effect on East Asian Air Quality during the EAST-AIRE Campaign. J. Geophys. Res. Atmos. 121, 6534–6554. doi:10.1002/2016jd025108
Wu, P. P., and Han, Z. W. (2011). A Modeling Study of Indirect Radiative and Climatic Effects of Sulfate over East Asia. Chin. J. Atmos. Sci. 35 (3), 547–559. (in Chinese). doi:10.3878/j.issn.1006-9895.2011.03.14
Wu, P. P., and Zhou, C. C. (2013). A Review of Indirect Anthropogenic Aerosol Effect (In Chinese). Plate. Mt. Meteorol. Res. 33 (2), 84–92. (in Chinese). doi:10.3969/j.issn.1674-2184.2013.02.015
Yang, Y. L., Tan, J. H., Sun, J. R., Wang, L. L., Wang, X. Y., Zhang, Y. X., et al. (2015). Synoptic Effect of a Heavy Haze Episode over North China (In Chinese). Clim. Environ. Res. 20 (5), 555–570. (in Chinese). doi:10.3878/j.issn.1006-9585.2015.15018
Zhang, Q., Quan, J., Tie, X., Huang, M., and Ma, X. (2011). Impact of Aerosol Particles on Cloud Formation: Aircraft Measurements in China. Atmos. Environ. 45, 665–672. doi:10.1016/j.atmosenv.2010.10.025
Zhang, Q., Meng, J., and Quan, J. (2012). Impact of Aerosol Composition on Cloud Condensation Nuclei Activity. Atmos. Chem. Phys. 12, 3783–3790. doi:10.5194/acp-12-3783-2012
Zhang, X. Y., Sun, J. Y., Wang, Y. Q., Li, W. J., Zhang, Q., Wang, W., G., et al. (2013). Factors Contributing to Haze and Fog in China (In Chinese). Chin. Sci. Bull. Chin. Ver. 58 (13), 1178–1187. doi:10.1007/s11434-012-5460-0
Keywords: direct radiative effect, anthropogenic aerosol, WRF-Chem simulation, west coast of the Bohai Sea, foggy days, emission reduction
Citation: Hao J, Cai Z, Han S, Ma G, Zhang M and Qiu X (2022) Impacts on Meteorological Parameters and Pollutants by Aerosol Direct Radiative Effect Over Tianjin, China. Front. Environ. Sci. 10:947894. doi: 10.3389/fenvs.2022.947894
Received: 19 May 2022; Accepted: 06 June 2022;
Published: 11 July 2022.
Edited by:
Honglei Wang, Nanjing University of Information Science and Technology Nanjing, ChinaReviewed by:
Yue Peng, Chinese Academy of Meteorological Sciences, ChinaDongdong Wang, China Meteorological Administration, China
Copyright © 2022 Hao, Cai, Han, Ma, Zhang and Qiu. This is an open-access article distributed under the terms of the Creative Commons Attribution License (CC BY). The use, distribution or reproduction in other forums is permitted, provided the original author(s) and the copyright owner(s) are credited and that the original publication in this journal is cited, in accordance with accepted academic practice. No use, distribution or reproduction is permitted which does not comply with these terms.
*Correspondence: Ziying Cai, 120078030@163.com