Seasonal variation, sources, and risk assessment of PM2.5-bound PAHs in Nantong, China: A pre- and post-COVID-19 case study
 Xinying Guo
 Feng Chen1,2
 - 1Nantong Center for Disease Control and Prevention, Nantong, China
- 2Nantong Key Laboratory of Food Hygiene, Nantong Food Safety Testing Center, Nantong, China
- 3Nantong Teaching and Research Practice Base of Public Health and Preventive Medicine of Lanzhou University, Nantong, China
Between 2018 and 2022, a total of 231 PM2.5 samples were collected in Nantong, China, and analyzed online for 16 US EPA PAHs utilizing a variety of analytical methodologies, including high-performance liquid chromatography data analysis, principal component analysis, and characteristic ratio analysis. The seasonal variation and pollution characteristics of 16 PAHs in PM2.5 over a long period in Nantong, China, were analyzed, and correlations and traceability changes with a variety of emission sources were established. Additionally, health assessment models for BaP equivalent concentration, daily exposure dose, lifetime excess risk of cancer, and life expectancy loss were constructed for various ages and genders. The results indicated that the total number of days with BaP concentrations less than the national limit standard of 1.0 ng/m3 was 60.17% (139/231), with rates of 25.40%, 35.71%, and 94.05% from 2019 to 2021, respectively; the total concentration range of 16 PAHs demonstrated a downward trend, but pollution was relatively severe in winter. The seasonal variation showed winter > autumn > spring > summer. The detection rates of 4 and 5 rings were generally high and fluctuated between dropping and increasing. Principal factor analysis and characteristic ratio traceability analysis indicated that PAH pollution is primarily caused by local coal-fired sources and traffic emissions, with a new trend of biomass combustion. Furthermore, BaP remains the primary contributor to carcinogenic factors, and the health risk is higher in females than in males, and in adults than in children. A low level of PAHs in the air may have health benefits. Traffic control and flow restrictions, as well as production restrictions, are all part of Nantong’s COVID-19 pandemic prevention and control policies. These policies contributed to PAH risk prevention and control, as well as pollution reduction.
Highlights
1. A five-year longitudinal case study was conducted to investigate the seasonal variation law, environmental traceability analysis, and PAH pollution identification.
2. The concentration of Σ16 PAHs is decreasing, and pollution is primarily caused by local coal-fired and vehicular emission sources, with a growing tendency for biomass combustion.
3. Four indicators are used to build and compare health evaluation models for individuals of various ages and genders.
4. BaP remains the primary source of carcinogenic factors, which are more prevalent in females than males, and adults than in children.
5. Traffic control and work and production restrictions are beneficial for risk prevention and control, as well as pollution reduction of PAHs.
1 Introduction
In China, air pollution is a significant environmental problem. Fine particulate matter (PM2.5) is a significant source of air pollution in cities. PM2.5 pollution is one of the most serious public health issues today (Jia et al., 2017; Maji et al., 2017; Zhao H. et al., 2020). A PM2.5 index is a critical tool for quantifying and controlling air pollution. Due to the small aerodynamic equivalent diameter (≤2.5 μm) of fine particles, they easily penetrate the bronchioles and alveoli, posing a threat to human health. Numerous epidemiological studies have demonstrated that high PM2.5 exposure significantly increases the risk of the immune system, nervous system, cardiopulmonary, cardiovascular, and cerebrovascular diseases, as well as the probability of carcinogenesis, teratogenesis, and mutation (Rotko et al., 2002; Chen et al., 2015; Saini and Sharma, 2019). Meanwhile, because PM2.5 is a persistent aerosol, it readily transports chemical compounds such as organic compounds and heavy metals. Polycyclic aromatic hydrocarbons (PAHs), a significant class of toxic organic pollutants in the atmosphere (Masih et al., 2014; Tchórzewska-Cieślaka et al., 2017), are extremely easily adsorbed on fine atmospheric particles with small particle sizes and are found in high concentrations in the atmosphere (Ma et al., 2019), water (Fehmi et al., 2015), soil (Niu et al., 2020), crops (Oleszczuk and Baran, 2005), and food (Vichi et al., 2007), where they exhibit persistence, toxicity, and bioaccumulation. Since organic pollutants such as PAHs are associated with PM2.5 in the air, their adverse effects on human health cannot be ignored, and they represent a significant health burden for Chinese citizens (Xu et al., 2015; Ying et al., 2018; Zhang et al., 2019).
International scholars have generally researched exposure models and health prediction using atmospheric emission reduction as a means of assessing human risk from PAHs in recent years (Bootdee et al., 2016; Iwegbue et al., 2019; Azimi-Yancheshmeh et al., 2021). While governments from various countries have long been committed to PAH emission reduction and control, recent observations indicate that the atmospheric concentration of PAHs is not declining (Yu et al., 2019). Given the pessimistic outlook for global PAH pollution, it is necessary to conduct long-term monitoring and control. Since China promulgated the ambient air quality standard (GB 3095-2012) in 2012, over 200 stations in the country have been monitoring the atmospheric environment, releasing real-time data, and managing environmental normalization as per the new national environmental standard (Jiang et al., 2018; Wang et al., 2019; Han et al., 2020). China, on the other hand, has a large population base, a densely populated population, and a highly mobile population. Transportation is used by 376 million of the floating population (26.6% of the Chinese population) to migrate and work. It has, however, been harmed by the 2019 novel coronavirus (COVID-19) outbreak that has swept the globe since December 2019. The government has enacted stringent traffic control and stoppage measures, which have had a significant impact on human activity at the local level. Additionally, it enables a greater number of citizens to pay attention to environmental quality and health issues. It is well established that the majority of PAH emission sources are natural (biosynthesis and plant volatilization, etc.) or man-made (incomplete combustion of petroleum fuel and pyrolysis of high molecular organic matter, etc.) (Akyüz and Çabuk, 2010; Yang et al., 2010). Throughout the period of epidemic prevention and control, the primary response mechanism for public health emergencies was quickly established in all parts of China. To accurately prevent and control the epidemic, the Chinese government has collaborated at all levels and adopted a control policy that includes regional closure cycles with Chinese characteristics, travel restrictions, and healthy travel at specific time points and special areas, all of which demonstrate a “China action” against COVID-19. Among them, traffic control and government enterprise renovation policies have had a limited effect on the air pollution emission laws and source changes, which may result in a significant reduction in the frequency of human activities and the intensity of pollution emissions (Chen et al., 2020; Fan et al., 2020; Ye et al., 2021).
Nantong, located at 31°41′–32°43′N, 120°12′–121°55′E, is in Jiangsu Province’s southeast region, northeast of the Yangtze River Delta, relatively close to the Yellow Sea on the east, the Yangtze River on the south, and close to Shanghai on the north. It has a large terrain and an advantageous geographical location, and overall air pollution is low. Nantong, according to China’s National Development and Reform Commission (CNDRC), will be classified as a type II city. However, as one of the China’s fastest growing city clusters, Nantong’s workers’ mobility and transportation volumes are enormous, and the city’s rapid industrialization and urban agglomeration have exacerbated regional air pollution problems. At the end of 2019, Nantong began experiencing the “COVID-19 urban effect” concurrently, and the composition of air pollution, its traceability, and the health risks posed by PAHs also changed significantly. At the moment, domestic scholars’ research on PAHs is primarily focused on the pollution characteristics, source analysis, and health effects of spatial background sites in major cities (Wang et al., 2010; Wang et al., 2020) and the Pearl River Delta (Wang et al., 2011; Yu and Jian, 2012), with a small amount of PM2.5 in the outbreak and blocking stage of COVID-19 research on short-term quality change and health effects (Zhao N. et al., 2020), but there is little research on adjacent cities within the economic radiation circle of major cities. The relevant research on Jiangsu Province’s Yangtze River Delta is primarily concentrated in the two typical regions of Southern Jiangsu and Northern Jiangsu (Xin et al., 2021; Yuan et al., 2021), with Nantong receiving little attention. Previous research directions have concentrated on the environmental fate and pollution sources of PAHs, but there are no reports on comprehensive research on the environmental behavior, seasonal distribution, and population exposure risk of PAHs in gaseous and particulate states, as well as environmental traceability during the COVID-19 epidemic’s special period.
Based on the aforementioned research status, this study is based on 231 monitoring samples and quantitative detection of PAHs in PM2.5 in Nantong City over 5 years (2018–2021). The pollution status, seasonal characteristics, and environmental traceability of 16 PAHs controlled preferentially by the US EPA were investigated during and after the COVID-19 outbreak. The human health status of six different ages and genders in Nantong City was evaluated using four indicators: benzo[a]pyrene equivalent concentration, per capita daily exposure dose, lifetime excess carcinogenic risk, and life expectancy loss. This is to provide a theoretical foundation and data support for the control of atmospheric polycyclic aromatic hydrocarbon pollution in Nantong, as well as to assist decision-making departments in formulating typical air toxic emission reduction measures and assessing regional human health risks.
2 Materials and methods
2.1 Instruments and reagents
PM2.5-ADS-2062 intelligent integrated atmospheric sampler (AMAE international instruments Group Co., Ltd.), PM2.5-JCH-1603 TSP Integrated Sampler (China Shandong Qingdao Group Co., Ltd.), Agilent 1260 Infinity high-performance liquid chromatography system (HPLC, Agilent Technologies, United States), HN10-300D Ultrasonic Thermostatic Cleaner (Shanghai Hanno Instrument Co., Ltd.), mixed standard solution of 16 PAHs (Agilent, 500 mg/L, United States; o2si, 2,000 mg/L, United States), and 1-fluoronaphthalene (1-FN, 100 mg/L, Shanghai ANPEL Laboratory Technologies Co., Ltd.) were used for this study.
2.2 Sampling site and sample collection
The samples were collected from 10 October 2018 to 16 March 2022. The National Treasury site (32°043′N, 120°828′E) has been selected for the simultaneous sampling of PM2.5 in the atmosphere for 7 days in every fixed month. A glass fiber filter membrane (Φ 90 mm or 47 mm) is used for PAH collection. Before use, the filter membrane is wrapped with aluminum foil and heated in a muffle furnace at 400°C for 5 h and then balanced in a constant temperature and humidity box at 25 ± 1°C for 24 h and humidity 50 ± 5% RH. Then, the membrane is weighed and recorded using an analytical balance. The outdoor monitoring height of the sampler is 10–15 m, the sampling time is ≥ 20 h every day, the sampling flow is ≥ 100 l/min, and the measurement error of the flow is ≤ 2%. After sampling is finished, the sampler is weighed again and recorded. The samples to be tested were stored at 4°C under airtight conditions, protected from light, and tested within 24 h. The seasons are divided into spring from March to May, summer from June to August, autumn from September to November, and winter from December to February. A total of 231 samples were collected. PM2.5 sampling period and sampling date are shown in Supplementary Table S1.
2.3 Sample processing
The glass filter membrane was cut and weighed according to the weighing method or the equipartition method. A batch of filter film is cut up and placed in a glass tube; 3.0 ml acetonitrile and 20 μl 50 μg/L 1-fluoronaphthalene standard substitute were added to the glass tube, vortex mixed, ultrasonicated at 20°C for 30 min, and cooled to room temperature. The treatment solution was filtered using a 0.22-μm organic membrane and bottled for testing.
2.4 Sample determination and quality control
Analysis of 16 PAHs was performed using an Agilent 1260 high-performance liquid chromatography apparatus equipped with ultraviolet-visible and fluorescence detectors (HPLC-UV-FLD) and equipped with an Agilent C18 column (4.6 mm × 25 cm, 5 μm), referring to our previous work (Guo et al., 2021). The constituents include naphthalene (NAP), acenaphthylene (ACE), acenaphthene (ACP), fluorene (FLU), phenanthrene (PHE), anthracene (ANT), fluoranthene (FLA), pyrene (PYR), benzo[a]anthracene (BaA), chrysene (CHR), benzo[b]fluoranthene (BbF), benzo[k]fluoranthene (BkF), benzo[a]pyrene (BaP), dibenzo[a,h]anthracene (DahA), benzo[g,h,i]perylene (BghiP), and indeno[1,2,3-c,d]pyrene (IP). The gradient elution program was: 0–19 min, A/B = 60%:40%; 19–25 min, A/B = 0%:100%; and 25–30 min, A/B = 60%:40%. The wavelength excitement and emission (Ex/Em) settings were: 0–11 min, 280/340 nm; 11–13 min, 254/350 nm; 13–19 min, 270/390 nm; 19–25 min, 290/410 nm; and 25–30 min, 305/500 nm. The detection limit of the method is the signal-to-noise ratio ≥ 3, and the quantitative limit of the method is the signal-to-noise ratio ≥ 10. The linear ranges were 0–500 ng/ml, r ≥ 0.999, and the detection limits were 0.002–0.039 ng/m3. The relative standard deviations were 0.09%–3.78%, and the average recoveries ranged 75.61%–114.72%. Sample intra-day relative standard deviation was 0.91%–2.97%. The internal standard substitute 1-fluoronaphthalene (1-FN) was used to carry out the standard addition recovery test, and the whole process recovery rates were in the range of 97.1%–99.6%.
2.5 Source identification
Characteristic ratios based on different components are commonly used as an important tool for pollution traceability. Pollution source identification of PAHs generally includes petroleum combustion, fossil fuel combustion, vegetation or coal combustion, and biomass combustion (Alves et al., 2001; Yunker et al., 2002). In this study, principal factor analysis and six characteristic ratios of ANT/(ANT + PHE), FLU/(FLU + PYR), BaA/(BaA + CHR), BaP/(BaP + CHR), IP/(IP + BghiP), and BaP/BghiP were jointly established to trace and identify different PAH proportions and components.
2.6 Health risk assessment for polycyclic aromatic hydrocarbons
The population of Nantong is divided into male and female according to gender, and six subgroups according to age (infants aged 2–3 years, children aged 4–10 years, immaturity aged 11–17 years, youth aged 18–44 years, middle-aged people 45–59 years, and old-aged people ≥ 60 years). The health risk assessment of 16 PAHs was carried out based on four indicators. Supplementary Table S2 shows related parameters of population classification and risk assessment.
2.6.1 Total carcinogenic equivalent concentration and mutagenic equivalent concentration of benzo[a]pyrene
The toxicity of benzo[a]pyrene is an international evaluation model used as a reference to measure the toxicity of other PAHs. Benzo[a]pyrene equivalent concentration includes the total carcinogenic equivalent concentration (TEQ) and total mutagenic equivalent concentration (MEQ) that were calculated using the evaluation parameters of the United States Environmental Protection Agency and the research data (Nisbet and Lagoy, 1992; Collins et al., 1998; Madill et al., 1999) as the reference carcinogenic equivalent coefficient (TEF) and mutagenic equivalent coefficient (MEF). The calculation adopts the following two equations:
where TEQ is the total carcinogenic equivalent concentration of PAHs, ng/m3; MEQ is the total mutagenic equivalent concentration of PAHs, ng/m3; Ci represents the ith PAHs in PM2.5, ng/m3; TEFi represents the carcinogenic equivalent coefficient of the ith PAH; and MEFi means the mutagenic equivalent coefficient of the ith PAH.
2.6.2 Average daily exposure dose
The respiratory exposure parameter is one of the key parameters in human exposure and health risk assessment. The average daily exposure dose (ADD) refers to the amount of substances that individuals or crowds are exposed during environmental exposure every day.
In the case of accurately quantifying compound concentrations in environmental media, the closer the selection of exposure parameter values to the actual exposure status of the evaluated target population, the more accurate the assessment of exposure dose will be, and the corresponding health risk assessment results will be more accurate. The ADD of benzo[a]pyrene through respiratory exposure is calculated as follows:
where ADD means daily average exposure dose, mg·kg−1·d−1; TEQi represents the ith PAH carcinogenic equivalent concentration, ng/m3; IR represents the respiratory rate, m3/d; ET represents exposure time, h/d; EF represents exposure frequency, d/a; ED represents exposure duration, a; BW represents body weight, kg; and AT represents average contact time, d.
2.6.3 Lifetime excess risk of carcinogenesis
The health risk assessment model is based on the international general evaluation model—the lifetime excess risk of carcinogenesis of non-threshold chemical pollutants caused by non-threshold carcinogenic compound benzo[a]pyrene entering the human body through the respiratory system. The health risk model established using the data of the EPA comprehensive risk information database (IRIS) and the classification system compiled by the World Health Organization (WHO) to evaluate the carcinogenicity of chemical substances was used as the parameters of the population respiratory exposure evaluation model. The calculation basis of lifetime excess risk of carcinogenesis (ILCR) is shown as follows:
where ILCR means lifetime excess risk of carcinogenesis, dimensionless, and q is the carcinogenic intensity coefficient of inhaled benzo[a]pyrene, according to the IRIS information database, q = 3.1 kg d mg−1.
2.6.4 Loss of life expectancy
The loss of life expectancy of the Nantong population was evaluated with reference to the loss of life expectancy of adults under the exposure of unit carcinogenic risk (10−5) pollutants in the ideal state (Gamo et al., 1995; Micheline et al., 2019). The loss of life expectancy caused by carcinogenesis of PAHs in the air is shown as follows:
where LLE means expected life loss, min, and R is the lifetime excess risk of cancer in the population, dimensionless.
3 Results and discussion
3.1 Evolutionary trends of polycyclic aromatic hydrocarbon levels
The total concentration range of Σ16 PAHs during the study period from 10 October 2018 to 16 March 2022 is 1.07–35.23 ng/m3, and the average concentration range is 0.07–2.20 ng/m3. The overall pollution level of PAHs showed a gradual decline, as shown in Figure 1. From 2018 to 2022, the average annual concentration of PAHs ranges from 0.30 to 0.96 ng/m3, which is at a low level. From the annual situation, compared with 2019, the decrease range of ΣPAH concentration from 2020 to 2021 is 20.85%–24.61%. Box line statistics of different PAH concentrations in PM2.5 during the study period are shown in Figure 2. Among the 16 PAHs determined, the content range of BbF was the highest, followed by BaP, CHR, and BghiP. The overall mass concentration and average mass concentration range of 16 PAHs are shown in Tables 1, 2, respectively. In contrast, PAHs with relatively high molecular weight (H-PAHs, 4–6 rings) have a higher content of PAHs than those with low molecular weight (L-PAHs, 2–3 rings), which may be because L-PAHs with a high Henry constant and vapor pressure are mainly in the form of gas, which is difficult to capture and collect, whereas H-PAHs with a low Henry constant and vapor pressure are mainly in the form of solid (Khalili et al., 1995).
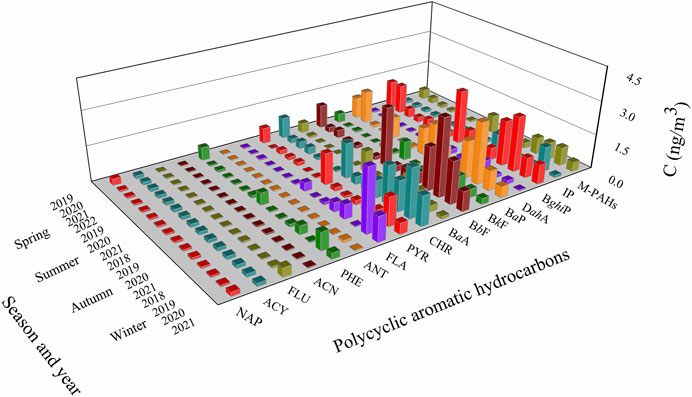
FIGURE 1. Mass concentration of 16 PAHs (ng/m3) during the study period from 2018 to 2022.
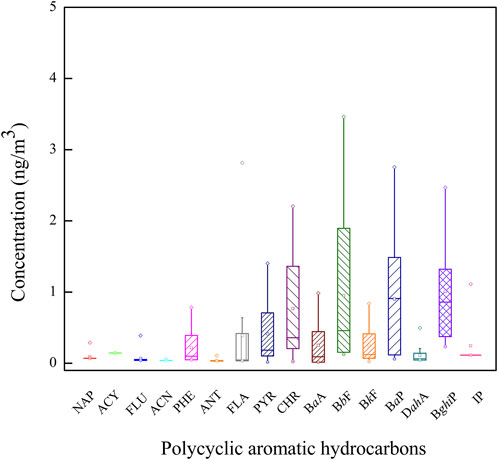
FIGURE 2. Box line statistics of different PAH concentrations in PM2.5 during the study period from 2018 to 2022.
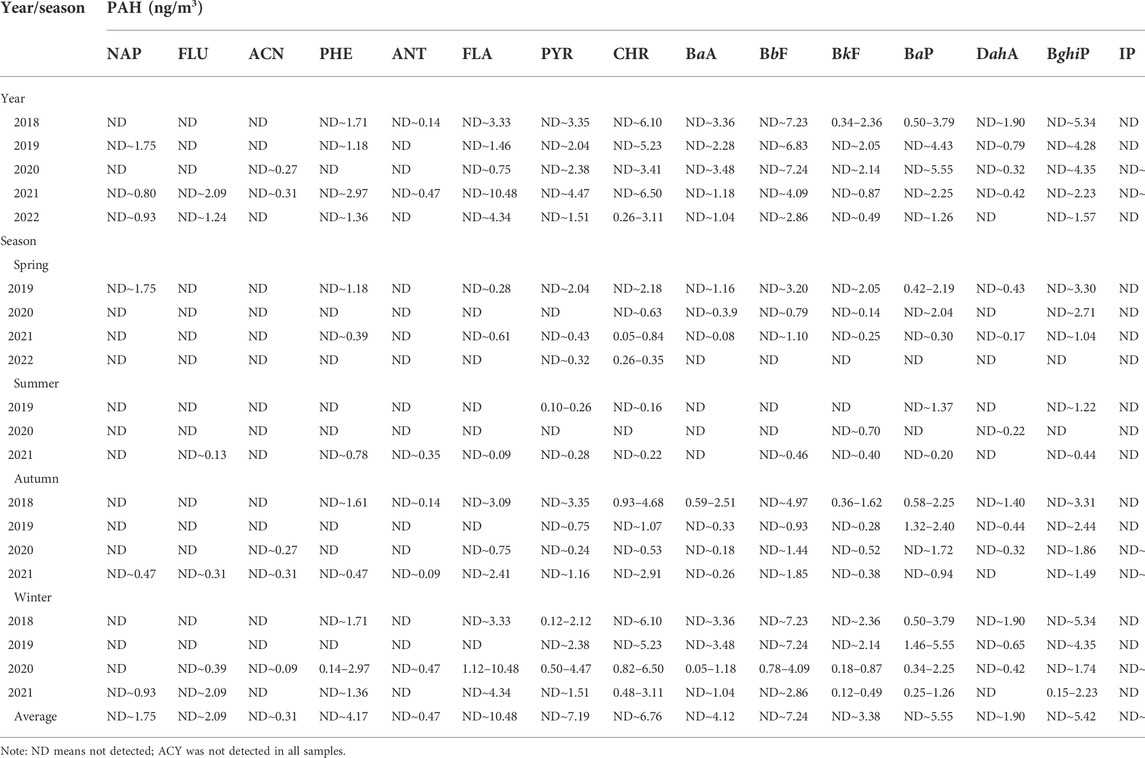
TABLE 1. Total concentration range of PAHs in PM2.5 during the study period from 2018 to 2022 (ng/m3).
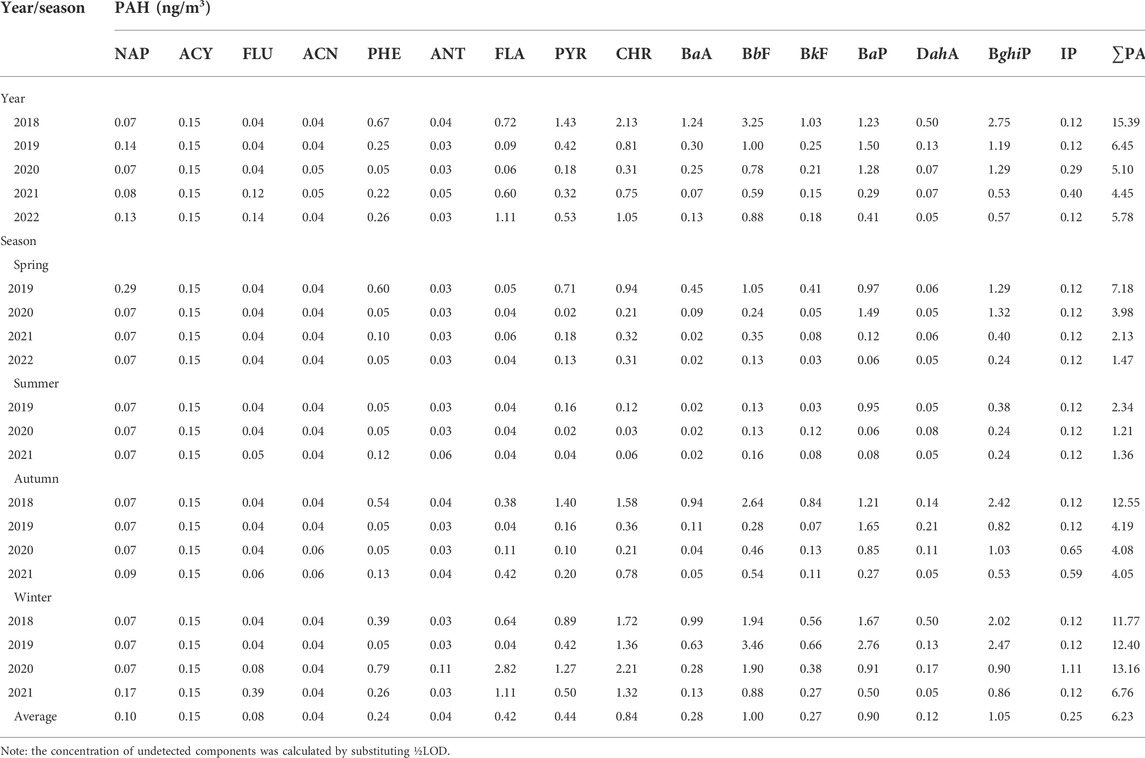
TABLE 2. Average mass concentration (ng/m3) of 16 PAHs in PM2.5 from 2018 to 2022.
BaP is an important pollution detection index of PAHs. It is found that the BaP concentration range during the five-year study period is ND∼4.09 ng/m3, and the average annual concentration of BaP in 2021 is 0.29 ng/m3, which is far lower than 1.50 ng/m3 in 2019 and 1.28 ng/m3 in 2020. During the year 2018–2022, the total number of days lower than 1.0 ng/m3 of China’s national air quality standard accounted for 60.2% (139/231), of which the number of days lower than the limit before the outbreak of the epidemic (before December 2019) accounted for 25.40%–38.10% of the pollution days in the whole year, 35.71% in the year when the outbreak occurred (the year 2020), and 94.05%–95.24% in the year after the outbreak (2021–2022). In total, 60 days were not detected during the study period, of which the number of undetected days from 2019 to 2021 accounted for 3.17%, 21.43%, and 50.00%, respectively. The sharp increase of undetected days of BaP may be related to the improvement of air quality, and the higher detection limit adopted in the BaP test may be another reason. The proportion of undetected days showed an upward trend year by year. The average annual variation trend of concentration of 16 PAHs with BaP as the characteristic index is shown in Supplementary Figure S1. Overall, the pollution level of BaP showed an obvious downward trend during the study period, especially after the outbreak.
The results of classifying PAHs according to the number of rings show that the composition distribution of 16 PAHs from 2018 to 2022 is mainly 4–5 rings, followed by 6 rings, as shown in Supplementary Figure S2B. Among them, the detection rates of 4–6 rings ranged from 30.36% to 78.57%, 41.52% to 67.26%, and 27.78 to 45.24%, respectively. The ratio of PAHs with different ring numbers to the total concentration is as follows: 5 rings (33.07%–45.91%) > 4 rings (32.07%–45.67%) > 6 rings (10.51%–21.39%) > 3 rings (0.63%–15.46%) > 2 rings (0%–1.57%), as shown in Supplementary Figure S3B. The concentration of PAHs with 2–3 rings accounts for only 0.63%–15.96% for a low proportion of Σ16 PAHs. The total detection rate (%) and average detection rate (%) of 16 PAHs during the study period 2018–2022 are shown in Table 3. However, the detection rate and percentage of PAHs with 2–3 rings and other low rings increased significantly during the epidemic prevention and control period and after the outbreak, as shown in Table 4. The reasons for these complex results are not only due to the difference in pollution source emission caused by seasonal changes, sampling frequency, and the influence of meteorological conditions and air mass transportation caused by wind mass dispersion, rainfall, temperature, and humidity changes during the sampling period; it is also related to the epidemic prevention and control policies in the region, such as temporary traffic control. The rainfall and humidity in the summer and autumn of 2021 were higher than those in 2020. Data changes showed that the overall detection rate of PAHs and the detection rate of H-PAHs in 2021, as well as the mean value of PAHs (0.24 ng/m3 in 2019, 0.19 ng/m3 in 2020, and 0.09 ng/m3 in 2021) decreased significantly. This phenomenon is particularly prominent during major holidays such as the National Day in September–October, when temporary traffic control seems to be more effective for PAH pollution. A series of pollution data shows that the air pollution in Nantong has received important attention from relevant local administrative departments. The pollution control measures taken by the local government in recent years, especially the response strategies after the outbreak, are effective for the mitigation of PAHs.
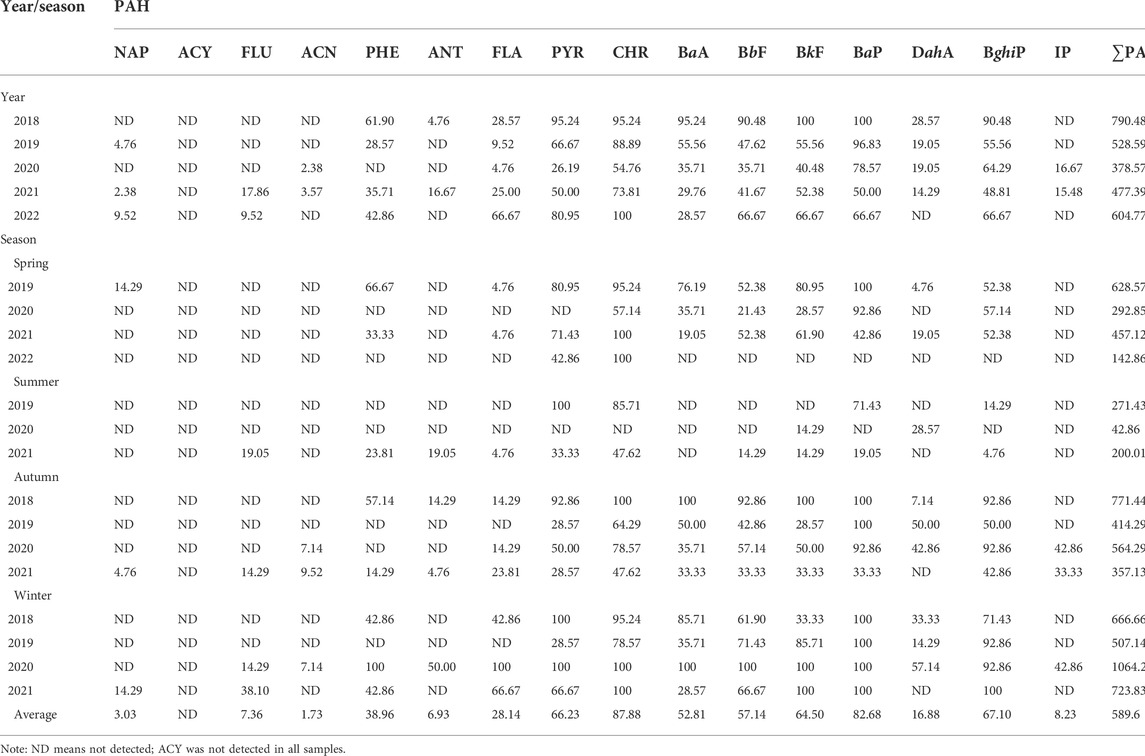
TABLE 3. Total and average detection rates (%) of 16 PAHs during the study period from 2018 to 2022.
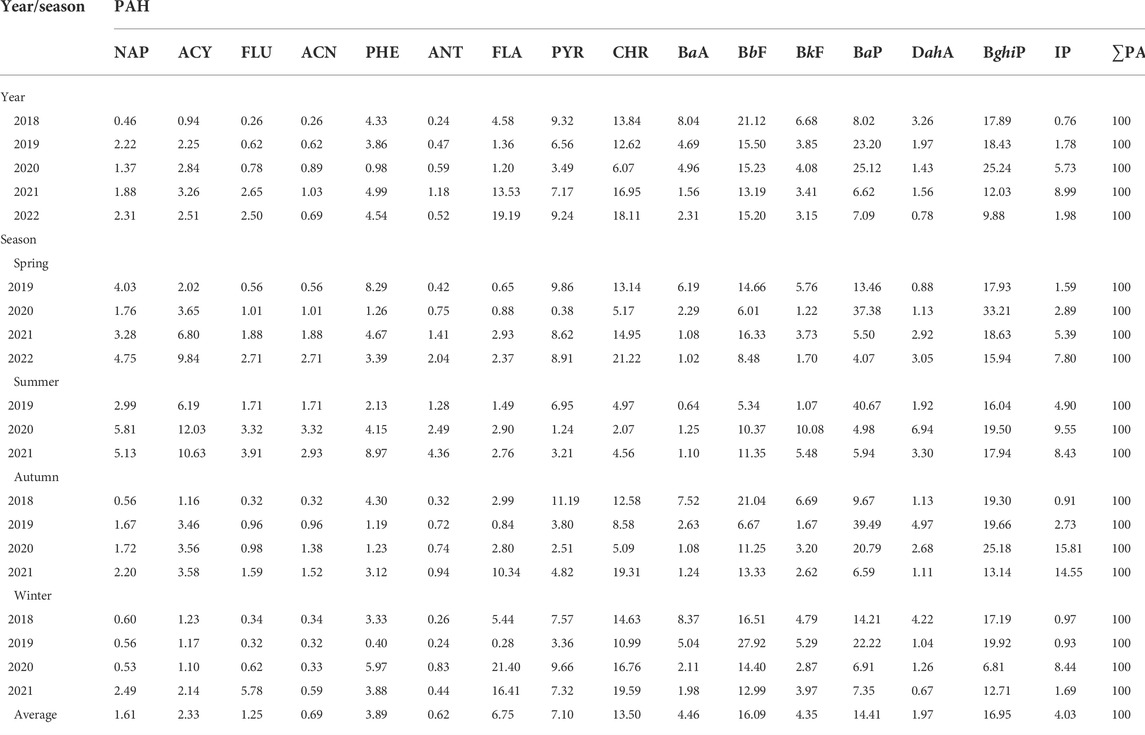
TABLE 4. Percentage of detection rate of 16 PAHs in the study period from 2018 to 2022 (calculated as ∑PAHs accounting for 100%).
3.2 Seasonality of polycyclic aromatic hydrocarbons
During the study period, the average concentration ranges of PAHs in spring, summer, autumn, and winter are 0.09–0.45 ng/m3, 0.08–0.15 ng/m3, 0.25–0.78 ng/m3, and 0.42–0.82 ng/m3, respectively. The pollution is heavy in winter and light in summer, showing the seasonal pattern of winter > autumn > spring > summer. The mass concentration of 16 PAHs in PM2.5 showed obvious seasonal variation. The four seasons’ concentration range after the outbreak for the year 2021–2022 is 0.08–0.50 ng/m3, and the four seasons’ concentration range in the year of the outbreak in 2020 is 0.06–1.49 ng/m3, which also shows an obvious downward trend compared with 0.95–2.76 ng/m3 in 2019. The seasonal characteristics of PAH distribution may be caused by some objective factors. For example, the high-temperature weather in summer is more conducive to the vertical diffusion of PAHs and the transformation of semi-volatile particles in solid–gas, while the additional emission of heating coal from power plants and road traffic tail gas in winter exacerbates the pollution level of PAHs. The outbreak of an epidemic will probably not only affect the objective laws of PAHs in seasonal characteristics but also have a certain impact on the mass concentration in the four seasons.
The pollution level of BaP is significantly different, especially in winter. The average concentration range in the winter for 2018 and 2019 before the epidemic is 1.67 and 2.76 ng/m3, respectively. After the outbreak, the average concentration range in the winter for 2020–2021 decreased to 0.91 ng/m3 and 0.50 ng/m3, with a significant decrease, respectively. The ternary phase diagrams of different ring numbers in different years and seasons are shown in Figure 3. Components from high rings (H-PAHs) play an important role in the pollution level of PAHs, especially 5–6 rings always dominate in the year and four seasons. From the detection of components, the overall detection rate of 4–5 rings is always relatively high. The average detection rates of 4 rings in spring, summer, autumn, and winter are 23.22%–64.29%, 0%–46.43%, 33.33%–76.79%, and 35.72%–100%, respectively. The average detection rates of 5 rings in four seasons are 23.22%–39.88%, 18.45%–36.61%, 45.83%–75.00%, and 33.33%–66.67%, respectively, as shown in Supplementary Figure S2A. The percentages of 4 rings in four seasons were 31.71%–100%, 0%–68.44%, 31.64%–39.81%, and 28.16%–48.57%, and the percentages of 5 rings in four seasons were 0%–48.79%, 23.82%–100%, 28.00%–53.45%, and 33.56%–53.52%, respectively. The percentages of detection rates in different seasons are shown in Supplementary Figure S3A. It is worth mentioning that the first outbreak of COVID-19 was in winter with severe pollution. There were still pollution days in Nantong, and BaP concentration > 2.5 ng/m3 was still observed for 4 days in January 2020 within 7 days of regular monitoring. This aspect may be caused by adverse meteorological conditions, such as low wind speeds and increased relative humidity. In addition, the sampling period is close to the Spring Festival, an important national statutory holiday, and the traffic pressure is still huge (Efe, 2022). In addition, the overall pollution level in 2021 showed a slight upward trend. The pollution level seemed to rebound in the spring of 2021, which may be due to the temporary travel restriction policy. After the relaxation of the May Day holiday policy, the traffic flow picked up. The total detection rate increased slightly in the summer of 2021, which may be because there was a significant increase in summer precipitation during the sampling period of 2021, especially in July. The increase in relative humidity may limit the dispersion of particulate matter and lead to an increase in concentration.
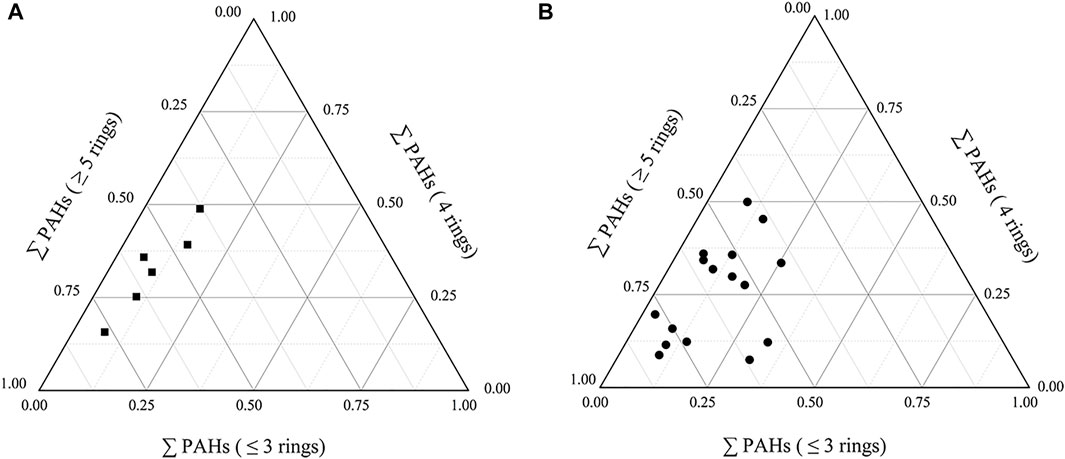
FIGURE 3. Ternary phase diagram of different ring numbers in different years (A) and seasons (B) from 2018 to 2022.
3.3 Pollution traceability analysis
3.3.1 Principal factor analysis
The principal component analysis of PAHs in PM2.5 can identify pollution emission sources through characteristic markers. Factor analysis scores following varimax rotation for single PAH are shown in Supplementary Table S7. Among them, BbF, BkF, BaP, and BghiP are principal component factor 1 accounting for a variance percentage of 43.37%. BbF, BghiP, and IP are used to indicate vehicle emissions such as gasoline and diesel vehicles (Larsen and Baker, 2003; Mabilia et al., 2004; Alkurdi and Dimashki, 2013). Transportation vehicles have a considerable impact on PAH pollution, and the impact intensity is the highest in winter. According to the comprehensive data of motor vehicles released by the Statistical Bulletin of National Economic and Social Development of Nantong City, the number of motor vehicles in Nantong City was 2.1704 million and the number of individual vehicles was 1.3902 million by the end of 2021, with an increase of 22.12% and 15.46%, respectively, compared with 5 years ago, which undoubtedly led to the excess environmental load caused by motor vehicle exhaust emission.
In principal component factor 2, indicators such as PYR, CHR, and BaA in four rings, with its proportion of cumulative variance of 63.94%, are used to indicate coal combustion; so principal component 2 represents the coal-fired emission source (Kulkarni and Venkataraman, 2000; Park et al., 2002; Bragato et al., 2012). The mass concentration of four-ring PAHs continued to rise and even increased year by year, especially in winter. Considering that the four rings represent PAHs with medium molecular weight, semi-volatile, and widely distributed in the gas phase and particle phase and that they will show state transition with temperature, they are the main coal-burning pollution source worthy of major attention.
The indicators in principal component factor 3 are ACE and PHE in 2–3 rings with a proportion of cumulative variance of 74.76%. Previous studies have shown that ACE, PHE, and ANT are used as emission source markers such as wood combustion (Khalili et al., 1995). It may be because of the grain output of rice and wheat in Nantong being relatively high. It should be noted that straw burning in the open air is prohibited in the summer and autumn harvest seasons from 2018 to 2019 so as to prevent the PAH pollution source generated by biomass combustion in the study area. This phenomenon has weakened and showed an improvement after 2020.
However, it is gratifying that from the statistics of the pollution level at the sampling points during the recent five-year study period, the concentration of PAHs from vehicle emission sources shows a downward trend year by year, especially from 9.59 to 2.66 ng/m3 in winter from 2019 to 2021 because the traffic control measures in Nantong are more and more strict during and after the epidemic; the national implementation of new emission standards for heavy-duty diesel engines and the upgrading management measures of oil price and product quality have jointly led to this good result.
3.3.2 Characteristic ratio traceability identification
The composition and proportion of PAHs produced by different fuels and combustion conditions will vary with varying degrees, but the content of several PAHs is relatively stable. Therefore, its pollution source can be judged by the characteristic ratio method (Yunker et al., 2002; De La Torre Roche et al., 2009). In this study, six typical characteristic ratios were selected to judge the pollution source of PAHs. The distribution of characteristic ratios from 2018 to 2022 is shown in Figure 4. The ratio of ANT/(ANT + PHE) is basically between 0.02 and 0.22, indicating that the sources of pollution are petroleum oil and coal combustion. The ratio of FLU/(FLU + PYR) ranges from 0.02 to 0.85, indicating that the pollution sources are related to petroleum oil and the combustion of biomass and coal, but the pollution sources corresponding to each year are different, such as coal combustion in 2019 and mixed pollution sources in 2018 and 2021. The BaA/(BaA + CHR) ratio ranges from 0.01 to 0.97, with the characteristics of petroleum oil and coal-fired sources. Among them, 2021 and 2022 are mainly petroleum sources, 2018 is mainly coal combustion, and 2019–2020 is mixed pollution sources. The ratio of BaP/(BaP + CHR) ranges from 0.02 to 0.98, which has the comprehensive pollution characteristics of oil source, coal source, and biomass combustion. Among them, 2021 and 2022 are mainly the source of oil volatilization, 2018 is mainly the source of petroleum oil and coal combustion, and 2019–2020 is mixed pollution sources. The ratio of IP/(IP + BghiP) ranges from 0.02 to 0.89, indicating that the sources are combustion and motor vehicle emissions, of which 2020 and 2021 are mixed pollution sources, and the rest years are mainly coal combustion sources; the BaP/BghiP ratio ranges from 0.02 to 1.98, indicating that the source is diesel vehicle emission and coal combustion. In brief, PAHs in Nantong mainly come from coal-fired sources and vehicle exhaust emissions and have the characteristics of biomass combustion. Coal combustion has occupied a place before 2020, but the source of pollution from vehicle diesel emissions looks more pronounced during and after 2020.
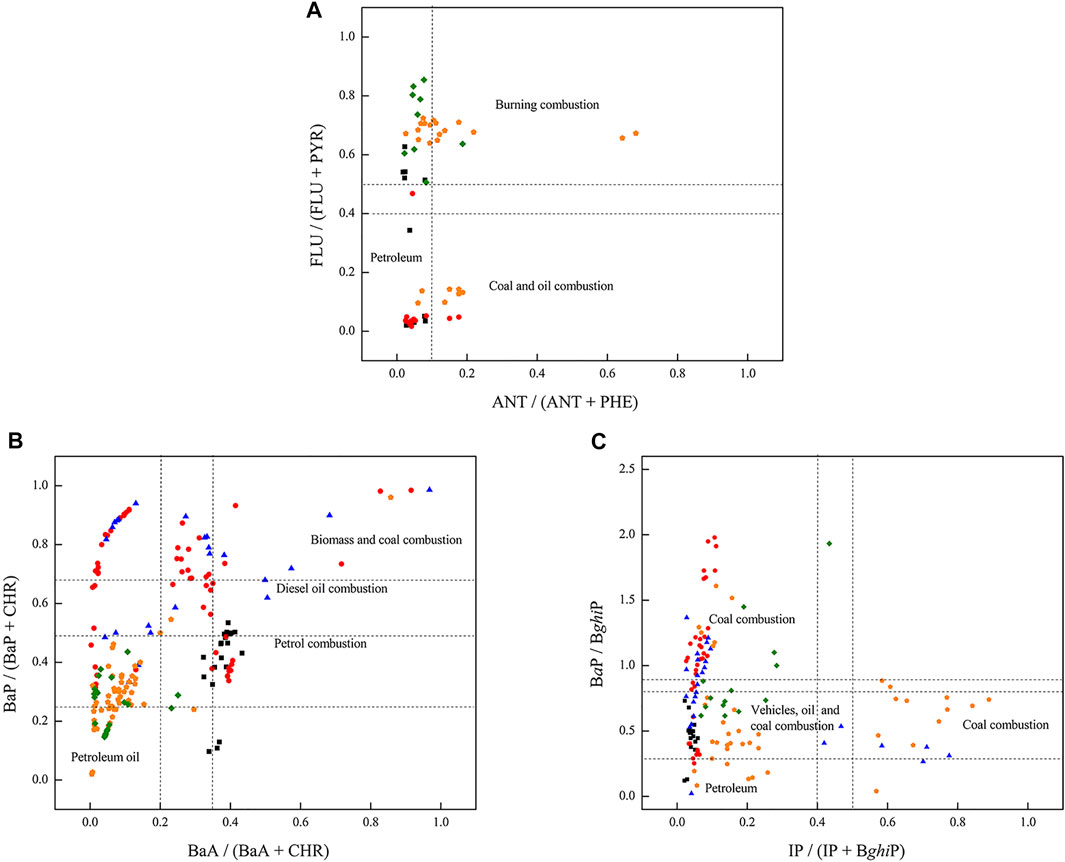
FIGURE 4. Cross plot distribution of PAH characteristic ratios from 2018 to 2022. 2018, black square; 2019, red circle; 2020, blue triangle; 2021, orange pentagon; and 2022, green diamond. (A) FLU/(FLU + PYR) vs. ANT/(ANT + PHE); (B) BaP/(BaP + CHR) vs. BaA/(BaA + CHR); (C) BaP/BghiP vs. IP/(IP + BghiP).
Since the characteristic ratio of PAH components is considered to be a marker of some pollution sources, the high contribution rate of 4–5 rings of PAHs in PM2.5 samples is considered to be directly related to coal combustion and vehicle emissions (Guarieiro et al., 2014; Dat and Chang, 2017). The results show that due to effective epidemic prevention and control policies and pollution prevention measures adapted to local conditions, the pollution degree of PAHs has decreased, and the air has been positively improved. However, with the rapid increase in the number of motor vehicles, we still need to face great challenges in order to achieve significant pollution reduction, especially vehicle exhaust emission reduction.
3.4 Health risk assessment
3.4.1 Total carcinogenic equivalent concentration and mutagenic equivalent concentration of benzo[a]pyrene
The total carcinogenic equivalent concentration (TEQ) and mutagenic equivalent concentration (MEQ) of PAHs are based on the analysis of the carcinogenic toxicity equivalent factor (TEF) and mutagenic toxicity equivalent factor (MEF) of PAHs. The TEQ and MEQ of PAHs in PM2.5 have a downward trend year by year, from 2.20 and 2.86 ng/m3 in 2018 to 0.48 and 0.70 ng/m3 in 2021, according to Supplementary Figure S4. The average value range of TEQ and MEQ of PAHs during 2018–2022 is 0.03–0.15 ng/m3 and 0.09–0.37 ng/m3, respectively. The TEQ and MEQ of 5–6 high rings are significantly higher than those of 2–3 low rings, accounting for more than 91.58% of Σ16 PAHs. The approximate order of TEQ by season is winter (0.04–0.21 ng/m3) > autumn (0.03–0.12 ng/m3) > spring (0.01–0.10 ng/m3) > summer (0.01–0.06 ng/m3), and MEQ by season is winter (0.12–0.54 ng/m3) > autumn (0.09–0.33 ng/m3) > spring (0.02–0.23 ng/m3) > summer (0.03–0.14 ng/m3). The TEQ and MEQ of BaP in winter are 4.42 times and 4.97 times higher than those in summer, respectively. The TEQ and MEQ results of 16 PAHs in different years and seasons from 2018 to 2022 are shown in Supplementary Table S3.
3.4.2 Average daily doses
The average daily exposure dose is the main technical basic data in establishing health risk assessment based on the exposure level of non-threshold carcinogenic compounds in the human body. ADD depends on the PAHs in the environmental medium and the selection of exposure parameter values, so the threshold-free health model can be used to accurately evaluate the actual toxicity. The ADD of 16 PAHs obtained by respiratory exposure was obtained by classifying the ages and genders of different populations in Nantong. Supplementary Table S4 shows the daily average exposure dose of people in the PAH urban area of Nantong City. Among 16 PAHs, BaP was considered high risk, followed by BghiP and BbF. In terms of age, the ADD of youth, middle age, and old age (˃18 years old) was significantly higher than that of infants, children, and immaturity (˂18 years old), with an average range of 1.23 × 10⁻⁶–1.34 × 10⁻⁶ mg kg−1 d−1 and 2.98 × 10⁻⁷–5.50 × 10⁻⁷ mg kg−1 d−1, respectively. This may be because children’s air-breathing volume parameters are inherently lower than those of adults. In terms of gender, the ADD of females is generally higher than that of males, with an average range of 3.05 × 10⁻⁷–1.42 × 10⁻⁶ mg kg−1 d−1 and 2.92 × 10⁻⁷–1.26 × 10⁻⁶ mg kg−1 d−1, respectively. The slightly higher average daily exposure risk of females may be due to their relatively low body weight. In terms of years, the ADD from 2020 to 2021 is significantly lower than that from 2018 to 2019 by about 1.3–3.2 times, which is obviously due to the good result of the reduction of the concentration of 16 PAHs, especially carcinogenic PAHs. In terms of season, the ADD basically shows the trend of winter > autumn > spring > summer, which is almost six times higher in winter than in summer, indicating that the risk of human exposure in winter is the greatest. Supplementary Figure S5 shows the ADD chart of 16 PAHs in PM2.5 of different ages and genders in different years and seasons in Nantong City.
3.4.3 Lifetime excess risk of cancer
ILCR of PAH urban population in Nantong is shown in Supplementary Table S5. Among 16 PAHs, BaP is still at high risk, and the contribution rate in the recent 5 years is in the range of 6.62%–25.11%. There is little difference in the contribution rate from 2019 to 2020, but the contribution rate drops sharply in 2021, which is related to the low mass concentration of BaP in 2021. In terms of age, the ILCR of youth, middle age, and old age (˃18 years old) was significantly higher than that of infant, children, and immaturity (˂18 years old), with an average range of 3.86 × 10⁻⁶–4.21 × 10⁻⁶ mg kg−1 d−1 and 9.37 × 10⁻⁷–1.73 × 10⁻⁶ mg kg−1 d−1, respectively. This is consistent with the change trend of ADD at different ages. In terms of gender, the ILCR of females is generally higher than that of males, with an average range of 9.56 × 10⁻⁷–4.45 × 10⁻⁶ mg kg−1 d−1 and 9.17 × 10⁻⁷–3.97 × 10⁻⁶ mg kg−1 d−1, respectively. The slightly higher risk of cancer in females is also associated with relatively low body weight. From the perspective of years, the ILCR value from 2020 to 2021 is almost the same and is significantly 1–3 times lower than that from 2018 to 2019, which is consistent with the decreasing trend of the concentration of 16 PAHs, especially high ring carcinogenic PAHs. Seasonally, the change trend of ILCR is consistent with that of ADD, which also proves that the air quality in winter is poor and going out is appropriately reduced, especially for middle age and old age. Supplementary Figure S6 shows the ILCR comparison diagram of 16 PAHs in PM2.5 of different ages and genders in different years and seasons in Nantong City. It is known that the acceptable carcinogenic risk index of PAHs recommended by the US EPA is 10−4–10−6, and the maximum acceptable value recommended by the International Commission on Radiation Protection (ICRP) is 5.0 × 10⁻⁵. It can be seen that the lifetime excess risk of carcinogenesis caused by 16 PAHs in the air of Nantong by respiratory route in 2018–2022 is within the normal and acceptable range, not exceeding the maximum acceptable risk level, but higher than daily risk activities (10−6), which should be paid attention to. On the whole, the carcinogenic risk level of PAHs in Nantong is decreasing, especially after the outbreak, indicating that PAH air pollutants are properly controlled in the Nantong region during the special period.
3.4.4 Loss of life expectancy
Loss of life expectancy (LLE) is the loss in expectation of life caused by carcinogenic risk, which is a new environmental health risk assessment technology that normalizes and compares the carcinogenic risk and non-carcinogenic risk caused by environmental pollution. This study applied this method to the loss of life expectancy of people of different ages and genders in Nantong under the carcinogenic risk of 16 PAHs, as shown in Supplementary Table S6. The results showed that with the increase in age, the LLE caused by respiratory exposure to atmospheric PAHs in Nantong increased gradually, and the LLE range was 4.79–21.53 min. LLE decreased significantly from 2019 to 2021, ranging from 4.74% to 20.85%. Affected by gender, LLE in females is slightly higher than that in males, which is not only related to females’ low weight but also affected by the risk of cancer in excess of unit influence of corresponding life loss parameters. Supplementary Figure S7 shows the LLE comparison diagram of 16 PAHs in PM2.5 of different ages and genders in different years and seasons in Nantong City. During the lockdown period of COVID-19 in China in early 2020 and the period after the outbreak of COVID-19, with the improvement of air quality of PAHs in PM2.5 caused by changes in external factors such as vehicle temporary traffic restriction, the LLE of the population has been reduced to a certain extent, and the cost related to human health may increase significantly (Le et al., 2020).
4 Conclusion
To combat the COVID-19 epidemic, all prefectures and cities in China have implemented strict traffic restrictions and self-isolation measures. Several external factors, such as temporary traffic restrictions on vehicles and closed management of some industrial enterprises, have created a unique window of opportunity to conduct the air pollution experiment in urban areas due to the reduction of PAHs and other pollutants, as well as the population health risk assessment model, particularly the change in the level of air carcinogenic organic pollutants represented by PAHs, pollution traceability, lifelong carcinogenic risk, and loss of life. Nantong is on the fast track to Shanghai’s “one-hour economic circle” and has been designated a type II big city by the National Development and Reform Commission in its urban agglomeration development plan for the Yangtze River Delta. This study not only provides theoretical support for the current state of local air quality pollution and pollution prevention and control but also contributes to the strengthening of research on the correlation between pollution levels and environmental traceability in the air circulation circle of large cities surrounding megacities. The research findings can be used by local governments and regulatory agencies to develop mitigation measures for PM2.5 pollution and as a guide for resolving PAH pollution. Additionally, the assessment results of the health risks posed by PAHs are critical for environmental management.
Compared to previous air pollution studies, this one spans the entire five-year pandemic period. The research findings confirm that temporary traffic control during epidemic prevention and control will result in some changes in air quality, which can be attributed to the positive health benefits associated with human activity restrictions and pollution emission intensity reductions during the epidemic prevention process. However, from the perspective of complex pollution traceability, reducing passive emissions caused by coal combustion and power transmission during the epidemic will not effectively reduce the concentrations of various pollutants; additionally, traffic control is not the only factor affecting the concentration of atmospheric PAHs. To continue improving the air quality of PAHs in medium-sized cities, in addition to uncontrollable factors such as high temperature, high humidity, and extreme meteorological conditions, one must also continue to focus on the emission reduction of PAHs and other organic pollutants in the context of the long-term air quality goal and the rationality of emission reduction management policies. Only by implementing multiple measures concurrently will maximize the enormous dividend of air pollution’s effect on the ecological environment and human health.
Of course, due to the single sampling point used in this study, the insufficient number of samples, the low representativeness of regional pollution, particularly the small number of samples in 2018 and 2022, and the mixed effect of resumption of work and production and weather conditions, the PAH research on Nantong requires further investigation using larger samples and multiple periods. As a result, applying the findings of this study directly to quantify the current state of Nantong air pollution and the effectiveness and accuracy of control measures is limited. For instance, routine monitoring data indicate an anomalous increase or decrease in average PAHs between 2018 and 2022. Direct comparison of pollution levels in these 2 years may result in misunderstandings, as the sampling period is not perfect, and the evaluation error in other sampling periods may also be due to the strong influence of air quality on meteorological conditions, particularly local adverse meteorological conditions. Furthermore, Nantong is a growing industrial city with few firms in critical industries, including metallurgy, building materials, and petrochemicals. Only coal, electricity, iron and steel firms, and other light industries provide a means of subsistence for people. Due to Nantong’s industrial nature, production technology, and commitment to ensuring people’s livelihoods, it cannot considerably reduce production, which means that even during an epidemic breakout, the winter heating work during the Spring Festival remains significant. Due to the unique market conditions, the research findings may differ from those obtained in other major industrial cities. However, the case analysis conducted in this study during the specific time of epidemic prevention and control reveals that motor vehicle pollution reduction will continue to be the top priority for continuous improvement of Nantong’s air quality in the future. It could be better for people’s health if they follow the government’s air pollution management plan, keep industrial and automobile exhaust emissions low, and try to travel as environmentally friendly as possible.
Data availability statement
The original contributions presented in the study are included in the article/Supplementary Material. Further inquiries can be directed to the corresponding author.
Author contributions
XG: experimental design, methodology, writing—original draft preparation, and data curation; FC: investigation, validation, data analysis, and writing—reviewing and editing; JL: experimental design and data curation; WZ: experimental design and experiment supervision.
Funding
This work was jointly supported by the China Nantong Municipal Science and Technology Plan Basic Research Fund Project (No. JC2021076), China Jiangsu Science and Technology Development Plan of Traditional Chinese Medicine Project (No. YB2020068), and China Nantong Health Committee Youth Project (No. QA2021054).
Acknowledgments
The authors thank Zhang Lixin, Deputy Chief Technician of Nantong Chongchuan District CDC, and Zhang Hong, Former Deputy Chief Technician of Nantong Gangzha District CDC, for their support in sampling, as well as the liquid phase team members of the CDC Central Laboratory for their support in testing technology.
Conflict of interest
The authors declare that the research was conducted in the absence of any commercial or financial relationships that could be construed as a potential conflict of interest.
Publisher’s note
All claims expressed in this article are solely those of the authors and do not necessarily represent those of their affiliated organizations, or those of the publisher, the editors, and the reviewers. Any product that may be evaluated in this article, or claim that may be made by its manufacturer, is not guaranteed or endorsed by the publisher.
Supplementary material
The Supplementary Material for this article can be found online at: https://www.frontiersin.org/articles/10.3389/fenvs.2022.947705/full#supplementary-material
References
Akyüz, M., and Çabuk, H. (2010). Gas–particle partitioning and seasonal variation of polycyclic aromatic hydrocarbons in the atmosphere of Zonguldak, Turkey. Sci. Total Environ. 408 (22), 5550–5558. doi:10.1016/j.scitotenv.2010.07.063
Alkurdi, K. F., and Dimashki, M. (2013). Characterization, concentrations and emission rates of polycyclic aromatic hydrocarbons in the exhaust emissions from in-service vehicles in Damascus. Atmos. Res. 120-121, 68–77. doi:10.1016/j.atmosres.2012.08.003
Alves, C., Pio, C., and Duarte, A. (2001). Composition of extractable organic matter of air particles from rural and urban Portuguese areas. Atmos. Environ. 35 (32), 5485–5496. doi:10.1016/S1352-2310(01)00243-6
Azimi-Yancheshmeh, R., Moeinaddini, M., Feiznia, S., Riyahi-Bakhtiari, A., Savabieasfahani, M., van Hullebusch, E. D., et al. (2021). Seasonal and spatial variations in atmospheric PM2.5-bound PAHs in Karaj city, Iran: Sources, distributions, and health risks. Sustain. Cities Soc. 72 (1–3), 103020. doi:10.1016/j.scs.2021.103020
Bootdee, S., Chantara, S., and Prapamontol, T. (2016). Determination of PM2.5 and polycyclic aromatic hydrocarbons from incense burning emission at shrine for health risk assessment. Atmos. Pollut. Res. 7 (4), 680–689. doi:10.1016/j.apr.2016.03.002
Bragato, M., Joshi, K., Carlson, J. B., Tenorio, J. A., and Levendis, Y. A. (2012). Combustion of coal, bagasse and blends thereof Part II: Speciation of PAH emissions. Fuel 96 (1), 51–58. doi:10.1016/j.fuel.2011.11.069
Chen, F., Yamashita, K., Kurokawa, J., and Klimont, Z. (2015). Cost-Benefit analysis of reducing premature mortality caused by exposure to ozone and PM2.5 in east asia in 2020. Water Air Soil Pollut. 226 (4), 108. doi:10.1007/s11270-015-2316-7
Chen, K., Wang, M., Huang, C., Kinney, P. L., and Anastas, P. T. (2020). Air pollution reduction and mortality benefit during the COVID-19 outbreak in China. Lancet Planet. Health 4 (6), e210–e212. doi:10.1016/S2542-5196(20)30107-8
Collins, J. F., Brown, J. P., Alexeeff, G. V., and Salmon, A. (1998). Potency equivalency factors for some polycyclic aromatic hydrocarbons and polycyclic aromatic hydrocarbon derivatives. Regul. Toxicol. Pharmacol. 28 (1), 45–54. doi:10.1006/rtph.1998.1235
Dat, N. D., and Chang, M. B. (2017). Review on characteristics of PAHs in atmosphere, anthropogenic sources and control technologies. Sci. Total Environ. 609, 682–693. doi:10.1016/j.scitotenv.2017.07.204
De La Torre-Roche, R. J., Lee, W-Y., and Campos-Diaz, S. I. (2009). Soil-borne polycyclic aromatic hydrocarbons in El Paso, Texas: Analysis of a potential problem in the United States/Mexico border region. J. Hazard. Mater. 163, 946–958. doi:10.1016/j.jhazmat.2008.07.089
Efe, B. (2022). Air quality improvement and its relation to mobility during COVID-19 lockdown in Marmara Region, Turkey. Environ. Monit. Assess. 194 (4), 255. doi:10.1007/s10661-022-09889-7
Fan, Z., Zhan, Q., Yang, C., Liu, H., and Zhan, M. (2020). How did distribution patterns of particulate matter air pollution (PM2.5 and PM10) change in China during the COVID-19 outbreak: A spatiotemporal investigation at Chinese city-level. Int. J. Environ. Res. Public Health 17 (17), 6274. doi:10.3390/ijerph17176274
Fehmi, K., Laurence, A., Syakti, A. D., Piram, A., Malleret, L., Mille, G., et al. (2015). Distribution and risk assessment of hydrocarbons (aliphatic and PAHs), polychlorinated biphenyls (PCBs), and pesticides in surface sediments from an agricultural river (Durance) and an industrialized urban lagoon (Berre lagoon), France. Environ. Monit. Assess. 187, 591. doi:10.1007/s10661-015-4823-9
Gamo, M., Oka, T., and Nakanishi, J. (1995). A method evaluating population risks from chemical exposure: A case study concerning prohibition of chlordane use in Japan. Regul. Toxicol. Pharmacol. 21 (1), 151–157. doi:10.1006/rtph.1995.1019
Guarieiro, A., Santos, J., Eiguren-Fernandez, A., Torres, E. A., da Rocha, G. O., and de Andrade, J. B. (2014). Redox activity and PAH content in size-classified nanoparticles emitted by a diesel engine fuelled with biodiesel and diesel blends. Fuel 116, 490–497. doi:10.1016/j.fuel.2013.08.029
Guo, X., Shi, Y., Gu, J., Chen, F., Xu, H., He, Z., et al. (2021). Polycyclic aromatic hydrocarbons residues and the carcinogenic risk assessment to pregnant women in Nantong, China using QuEChERS method and HPLC—a pilot case study. Biomed. Chromatogr. 35 (11), e5117. doi:10.1002/bmc.5117
Han, F., Guo, H., Hu, J., Zhang, J., Ying, Q., and Zhang, H. (2020). Sources and health risks of ambient polycyclic aromatic hydrocarbons in China. Sci. Total Environ. 698 (1), 134229. doi:10.1016/j.scitotenv.2019.134229
Iwegbue, C., Obi, G., Uzoekwe, S. A., Egobueze, F. E., Odali, E. W., Tesi, G. O., et al. (2019). Distribution, sources and risk of exposure to polycyclic aromatic hydrocarbons in indoor dusts from electronic repair workshops in southern Nigeria. Emerg. Contam. 5, 23–30. doi:10.1016/j.emcon.2018.12.003
Jia, M., Zhao, T., Cheng, X., Gong, S., Zhang, X., Tang, L., et al. (2017). Inverse relations of PM2.5 and O3 in air compound pollution between cold and hot seasons over an urban area of east China. Atmosphere 8 (12), 59. doi:10.3390/atmos8030059
Jiang, N., Li, L., Wang, S., Li, Q., Dong, Z., Duan, S., et al. (2018). Variation tendency of pollution characterization, sources, and health risks of PM2.5-bound polycyclic aromatic hydrocarbons in an emerging megacity in China: Based on three-year data. Atmos. Res. 217 (18), 81–92. doi:10.1016/j.atmosres.2018.10.023
Khalili, N. R., Scheff, P. A., and Holsen, T. M. (1995). PAH source fingerprints for coke ovens, diesel and, gasoline engines, highway tunnels, and wood combustion emissions. Atmos. Environ. 29 (4), 533–542. doi:10.1016/1352-2310(94)00275-p
Kulkarni, P., and Venkataraman, C. (2000). Atmospheric polycyclic aromatic hydrocarbons in Mumbai, India. Atmos. Environ. 34 (17), 2785–2790. doi:10.1016/S1352-2310(99)00312-X
Larsen, R. K., and Baker, J. E. (2003). Source apportionment of polycyclic aromatic hydrocarbons in the urban atmosphere: A comparison of three methods. Environ. Sci. Technol. 37 (9), 1873–1881. doi:10.1021/es0206184
Le, T., Wang, Y., Liu, L., Yang, J., Yung, Y. L., Li, G., et al. (2020). Unexpected air pollution with marked emission reductions during the COVID-19 outbreak in China. Science 369 (6504), 702–706. doi:10.1126/science.abb7431
Ma, W. L., Zhu, F. J., Liu, L. Y., Jia, H. L., Yang, M., and Li, Y. F. (2019). PAHs in Chinese atmosphere: Gas/particle partitioning. Sci. Total Environ. 693 (25), 133623–133629. doi:10.1016/j.scitotenv.2019.133623
Mabilia, R., Cecinato, A., Scianò, M. C. T., di Palo, V., and Possanzini, M. (2004). Characterization of polycyclic aromatic hydrocarbons and carbonyl compounds in diesel exhaust emissions. Ann. Chim. 94 (9-10), 733–740. doi:10.1002/adic.200490091
Madill, R., Brownlee, B., Josephy, P., and Bunce, N. J. (1999). Comparison of the ames Salmonella assay and mutatox genotoxicity assay for assessing the mutagenicity of polycyclic aromatic compounds in porewater from athabasca oil sands mature fine tailings. Environ. Sci. Technol. 33 (15), 2510–2516. doi:10.1021/es981343o
Maji, K. J., Dikshit, A. K., Arora, M., and Deshpande, A. (2017). Estimating premature mortality attributable to PM2.5 exposure and benefit of air pollution control policies in China for 2020. Sci. Total Environ. 612, 683–693. doi:10.1016/j.scitotenv.2017.08.254
Masih, A., Lal, J. K., and Patel, D. K. (2014). Contamination and exposure profiles of persistent organic pollutants (PAHs and OCPs) in groundwater at a terai belt of north India. Water Qual. Expo. Health 6 (4), 187–198. doi:10.1007/s12403-014-0126-6
Micheline, K.-V., Pacchierotti, F., Parry, E. M., Russo, A., Eichenlaub-Ritter, U., Adler, I.-D., et al. (2019). Risks of aneuploidy induction from chemical exposure: Twenty years of collaborative research in Europe from basic science to regulatory implications. Mutat. Research/Reviews Mutat. Res. 779 (C), 126–147. doi:10.1016/j.mrrev.2018.11.002
Nisbet, I. C. T., and Lagoy, P. K. (1992). Toxic equivalency factors (TEFs) for polycyclic aromatic hydrocarbons (PAHs). Regul. Toxicol. Pharmacol. 16 (3), 290–300. doi:10.1016/0273-2300(92)90009-X
Niu, L., Yang, Q., Gelder, P. V., Zeng, D., Cai, H., Liu, F., et al. (2020). Field analysis of PAHs in surface sediments of the Pearl River Estuary and their environmental impacts. Environ. Sci. Pollut. Res. 27 (10), 10925–10938. doi:10.1007/s11356-020-07689-5
Oleszczuk, P., and Baran, S. (2005). Influence of soil fertilization by sewage sludge on the content of polycyclic aromatic hydrocarbons (PAHs) in crops. J. Environ. Sci. Health Part A 40 (11), 2085–2103. doi:10.1080/10934520500232712
Park, S. S., Kim, Y. J., and Kang, C. H. (2002). Atmospheric polycyclic aromatic hydrocarbons in Seoul, Korea. Atmos. Environ. 36 (17), 2917–2924. doi:10.1016/S1352-2310(02)00206-6
Rotko, T., Oglesby, L., Künzli, N., Carrer, P., Nieuwenhuijsen, M. J., and Jantunen, M. (2002). Determinants of perceived air pollution annoyance and association between annoyance scores and air pollution (PM2.5, NO2) concentrations in the European Expolis study. Atmos. Environ. 36 (29), 4593–4602. doi:10.1016/S1352-2310(02)00465-X
Saini, P., and Sharma, M. (2019). Cause and age-specific premature mortality attributable to PM2.5 exposure: An analysis for million-plus Indian cities. Sci. Total Environ. 710 (9), 135230. doi:10.1016/j.scitotenv.2019.135230
Tchórzewska-Cieślaka, Barbara, Włodarczyk-Makułab, Maria, and Raka, Janusz (2017). Safety analysis of the wastewater treatment process in the field of organic pollutants including PAHs. Desalination water Treat. 72, 146–155. doi:10.5004/dwt.2017.20644
Vichi, S., Pizzale, L., Conte, L. S., Buxaderas, S., and Lopez-Tamames, E. (2007). The occurrence of volatile and semi-volatile aromatic hydrocarbons in virgin olive oils from north-eastern Italy. Food control. 18 (10), 1204–1210. doi:10.1016/j.foodcont.2006.07.015
Wang, B., Dong, S., Liu, M., Tao, W., Xiao, B., Zhang, S., et al. (2019). Polycyclic aromatic hydrocarbons in atmospheric PM2.5 and PM10 in the semi-arid city of Xi'an, Northwest China: Seasonal variations, sources, health risks, and relationships with meteorological factors. Atmos. Res. 229, 60–73. doi:10.1016/j.atmosres.2019.06.014
Wang, W., Huang, M., Yuan, K., Wang, H., Anna, O., Leung, W., et al. (2011). Polycyclic aromatic hydrocarbons (PAHs) in urban surface dust of Guangzhou, China: Status, sources and human health risk assessment. Sci. Total Environ. 409 (21), 4519–4527. doi:10.1016/j.scitotenv.2011.07.030
Wang, X. Y., Li, Q. B., Luo, Y. M., Ding, Q., Xi, L. M., Ma, J. M., et al. (2010). Characteristics and sources of atmospheric polycyclic aromatic hydrocarbons (PAHs) in Shanghai, China. Environ. Monit. Assess. 165 (1-4), 295–305. doi:10.1007/s10661-009-0946-1
Wang, Y., Wen, Y., Wang, Y., Zhang, S., Zhang, K. M., Zheng, H., et al. (2020). Four-month changes in air quality during and after the COVID-19 lockdown in six megacities in China. Environ. Sci. Technol. Lett. 7 (11), 802–808. doi:10.1021/acs.estlett.0c00605
Xin, L., Wang, J., Sun, J., Zhang, C., Tong, X., Wan, J., et al. (2021). Cellular effects of PM2.5 from suzhou, China: Relationship to chemical composition and endotoxin content. Environ. Sci. Pollut. Res. 28 (2), 287–299. doi:10.1007/s11356-020-10403-0
Xu, H., Guinot, B., Niu, X., Cao, J., Ho, K. F., Zhao, Z., et al. (2015). Concentrations, particle-size distributions, and indoor/outdoor differences of polycyclic aromatic hydrocarbons (PAHs) in a middle school classroom in Xi'an, China. Environ. Geochem. Health 37 (5), 861–873. doi:10.1007/s10653-014-9662-z
Yang, Y., Guo, P., Zhang, Q., Li, D., Zhao, L., and Mu, D. (2010). Seasonal variation, sources and gas/particle partitioning of polycyclic aromatic hydrocarbons in Guangzhou, China. Sci. Total Environ. 408 (12), 2492–2500. doi:10.1016/j.scitotenv.2010.02.043
Ye, T., Guo, S., Xie, Y., Chen, Z., Abramson, M. J., Heyworth, J., et al. (2021). Health and related economic benefits associated with reduction in air pollution during COVID-19 outbreak in 367 cities in China. Ecotoxicol. Environ. Saf. 222 (10), 112481. doi:10.1016/j.ecoenv.2021.112481
Ying, G., Yang, L., Chen, J., Li, Y., Jiang, P., Zhang, J., et al. (2018). Nitro and oxy-PAHs bounded in PM2.5 and PM10 under different weather conditions at Mount Tai in Eastern China: Sources, long-distance transport, and cancer risk assessment. Sci. Total Environ. 622-623 (1), 1400–1407. doi:10.1016/j.scitotenv.2017.11.200
Yu, H., and Jian, Z. Y. (2012). Polycyclic aromatic hydrocarbons in urban atmosphere of Guangzhou, China: Size distribution characteristics and size-resolved gas-particle partitioning. Atmos. Environ. 54 (7), 194–200. doi:10.1016/j.atmosenv.2012.02.033
Yu, Y., Katsoyiannis, A., Bohlin-Nizzetto, P., Brorstrom-Lunden, E., Ma, J., Zhao, Y., et al. (2019). Polycyclic aromatic hydrocarbons not declining in arctic air despite global emission reduction. Environ. Sci. Technol. 53 (5), 2375–2382. doi:10.1021/acs.est.8b05353
Yuan, Z., He, B., Wu, X., Simonich, S. L. M., Liu, H., Fu, J., et al. (2021). Polycyclic aromatic hydrocarbons (PAHs) in urban stream sediments of Suzhou Industrial Park, an emerging eco-industrial park in China: Occurrence, sources and potential risk. Ecotoxicol. Environ. Saf. 214, 112095. doi:10.1016/j.ecoenv.2021.112095
Yunker, M. B., Macdonald, R. W., Vingarzan, R., Mitchell, R. H., Goyette, D., and Sylvestre, S. (2002). PAHs in the fraser river basin: A critical appraisal of PAH ratios as indicators of PAH source and composition. Org. Geochem. 33 (4), 489–515. doi:10.1016/S0146-6380(02)00002-5
Zhang, L., Xu, H., Fang, B., Wang, H., Yang, Z., Yang, W., et al. (2019). Source identification and health risk assessment of polycyclic aromatic hydrocarbon-enriched PM2.5 in tangshan, China. Environ. Toxicol. Chem. 39 (2), 458–467. doi:10.1002/etc.4618
Zhao, H., Chen, K., Liu, Z., Zhang, Y., Shao, T., and Zhang, H. (2020). Coordinated control of PM2.5 and O3 is urgently needed in China after implementation of the air pollution prevention and control action plan. Chemosphere 270, 129441. doi:10.1016/j.chemosphere.2020.129441
Keywords: PM 2.5 -bound PAHs, pollution identification, daily exposure dose, lifetime excess risk of cancer, life expectancy loss
Citation: Guo X, Chen F, Lu J and Zhang W (2022) Seasonal variation, sources, and risk assessment of PM2.5-bound PAHs in Nantong, China: A pre- and post-COVID-19 case study. Front. Environ. Sci. 10:947705. doi: 10.3389/fenvs.2022.947705
Received: 19 May 2022; Accepted: 11 July 2022;
Published: 19 August 2022.
Edited by:
Nsikak U. Benson, Covenant University, NigeriaReviewed by:
Jheng-Jie Jiang, Chung Yuan Christian University, TaiwanMichael Edward Deary, Northumbria University, United Kingdom
Copyright © 2022 Guo, Chen, Lu and Zhang. This is an open-access article distributed under the terms of the Creative Commons Attribution License (CC BY). The use, distribution or reproduction in other forums is permitted, provided the original author(s) and the copyright owner(s) are credited and that the original publication in this journal is cited, in accordance with accepted academic practice. No use, distribution or reproduction is permitted which does not comply with these terms.
*Correspondence: Weibing Zhang, jsntjkzwb@126.com