Influencing Factors of Green Credit Efficiency in Chinese Commercial Banks
 Xiang Deng
 Haitao Hao
 Mei Chang
 Xiaohang Ren
 Lan Wang3
- 1School of Finance, Zhongnan University of Economics and Law, Wuhan, China
- 2School of Business, Central South University, Changsha, China
- 3Fashion Business School, University Arts of London, London, United Kingdom
This paper is applied the Tobit panel model to analyze the driving factors of green credit efficiency by using Chinese commercial banks’ data from 2009 to 2019. Based on the undesirable-SBM-DEA model, this paper is attempted to construct the green credit evaluation index by incorporating carbon emissions, and evaluating the green credit efficiency of Chinese commercial banks. The result shows that the green credit efficiency of Chinese commercial banks is low currently. Moreover, there is a mutually significant relationship between the efficiency and profitability of commercial banks’ green credit funds. Our findings suggest that the commercial banks should pursue the scale of green credit capital and improve the efficiency of green credits to help China achieve carbon neutrality goals.
1 Introduction
With the frequency of extreme global climate events, increasing number of countries have reached the consensus of reducing environmental pollution and mitigating climate emergencies. In 2002, the Equator Principles was proposed by the International Finance Corporation and the ABN AMRO Bank, which is a benchmark for financial institutions to identify, assess and manage environmental and social risks for financing projects. In recent years, the Chinese government released numerous green finance policies to encourage financial institutions to protect the environment through investments or green credit. For example, China first implemented green credit policies in 2007, which was required commercial banks to take corporate emission reductions account to decide for the loans’ issuance. In 2012, the CBRC issued the “Green Credit Guidelines” to further regulate commercial banks’ green credit and guided financial institutions to invest more in green industries. In the future, the Chinese commercial banks will gradually withdrawal of funds to energy-intensive and heavily polluting industries, and increasingly issuing credit funds to support low-carbon and energy conservation projects.
Based on the guidance of a series of green finance policies, the scale of the Chinese green credit market has been continuously expanding. By the end of 2021, the balance of Chinese green credit was 15.9 trillion RMB yuan, ranking first in the world1. However, according to “The Adaptation Finance Gap Report (2016),” the annual costs of adaptation to climate change in developing countries are range from US$140 billion to US$300 billion by 2030, and between US$280 billion and US$500 billion by 2050 (Puig et al., 2016; Dong et al., 2020). China still needs funds to adapt to climate change. Scholars began to pay attention to the green credit efficiency of banks to analyze whether financial institutions actual efficienctly use green credit or not. For example, Zhang B. et al. (2011) presented that green credit was not fully implemented and the efficiency level of implementation was far from the expectations. However, most studies only focused on the effects of implementing green credit, but had different conclusions (Yao et al., 2021; Zhang et al., 2021; Zhou et al., 2021b; Tian et al., 2022). Analyzing the Influencing factors of China’s green credit efficiency and improving the efficiency is important to banks for green developments. Therefore, this paper constructed an indicator system to evaluate green credit efficiency and considered the carbon emisssion to identify the potential carbon dioxide emission reduction in Chinese commercial banks. We analyzed the influencing factors of green credit efficiency in Chinese commercial banks, such as bank’s return on assets, loan-deposit ratio, capital adequacy ratio and so on. Given on that, we attempt to explore the methods to improve Chinese green credit efficiency.
The academic contributions of this paper are as follows: First, China has implemented many green credit policies but has not formed an evaluation system for its efficiency. Thus, we construct a general indicator system to evaluate green credit efficiency in this paper. Second, the main purpose of green credit is to help commercial banks play a leading role in emission reductions in China. We considered the carbon emissions and applied the Undesirable-Slack-Based Measure-Data Envelopment Analysis (Undesirable-SBM-DEA) model as the most suitable model to evaluate green credit efficiency for Chinese commercial banks. Third, we use the Tobit panel model to analyze the influencing factors of green credit efficiency and to identify methods to improve the green credit efficiency of Chinese commercial banks.
The structure of this paper is as follows. The second part presents the related literature review. The third part proposes the research hypotheses about what factors affect the green credit efficiency in Chinese commercial banks. The fourth part introduces the econometric model and data. The fifth part shows and discusses the empirical results, and the sixth part is the research conclusions.
2 Literature Review
Green credit innovated is aimed to economic development and environmental protection through the rational allocation of credit resources (Zhu et al., 2020; Dong et al., 2022). For commercial banks, it is important to evaluate the efficiency of implementing green credit. By evaluating the efficiency of green credit, the commercial bank could clearly know their shortcomings in the process of implementation and improvement. Therefore, this section first reviewed the existing literature in two key areas: climate change and commercial banks, and appropriate model to evaluate the efficiency of green credits.
2.1 Commercial Banks and Climate Change
Climate change and environmental protection have become hot topics in recent years. According to the FRBSF Economic Letter, climate change is a source of financial risk (Rudebusch, 2021; Ren et al., 2022a; Wang et al., 2022). Banks and other financial institutions may also face different risks caused by climate change, such as valuation risk, credit risk, legal risk, business risk, etc. China has the most dynamic economy and is one of the largest energy consumers and carbon emitters (Tian et al., 2022) in the world. The scope and scale of its industrial activities, assets, and population make financial institutions’ businesses highly exposed to the effects of climate change.
The risks caused by climate change include physical risks and transitional risks. The former usually refers to natural disasters and extreme weather events related to climate change (i.e., typhoons, floods, droughts, hurricanes, and forest fires) (Dikau and Volz, 2021). The latter generally refers to uncertainty related to changes in policies, prices and technologies that may occur in climate change mitigation and carbon emission reduction (Chenet et al., 2021; Semieniuk et al., 2021; Ren et al., 2022b; Wen et al., 2022). Physical risks, the most important risk over the next 30 years (Stroebel and Wurgler, 2021), may directly affect commercial banks, or indirectly affect banks’ operating profit performances through credit risks and collateral depreciation risks of enterprises and insurance companies, which cause enormous economic losses. NGFS (Network for Greening the Financial System) (2019) 2 pointed out that transition risks may lead to capital stranding (asset-grade capital face depreciation risk) or value stranding. For example, when the environmental policy is in transition to net zero, the development of electric vehicles will be likely to disrupt traditional car manufacturers (Krueger et al., 2020). In addition, climate change will limit the growth of bank assets, weaken the growth basis of bank liabilities, and the quality of loans in industries that are strongly affected by climate change tends to deteriorate.
Climate change not only causes threat for individual and social wealth, but also affects the stability of the financial system (Dietz et al., 2016; Dikau and Volz, 2021; Dou et al., 2022; Ren et al., 2022c). Therefore, Chinese commercial banks are facing huge pressures of transition and competition which force them to consider the best way for sustainable development. They need to enhance their “green” awareness as soon as possible to effectively avoid risks. As early as in 2004, Thompson and Cowton (2004) highlighted the need for banks to incorporate environmental factors into their standard processes for offering loans and investment strategies. Commercial banks, as financial intermediaries, should undertake own social responsibilities and actively respond to national policy requirements.
Currently, the Chinese government is actively encouraging commercial banks to develop green credit and the policy has basically similar with international green credit standards (Wen et al., 2021). Green credit is expected to rationally allocate credit funds through differentiated credit services, eventually lead to coordinated progress between finance and environmental protection (He et al., 2019; Deng et al., 2022b; Ren et al., 2022b). It plays an increasingly important role in encouraging the development of environment-friendly enterprises. Cilliers et al. (2011) found green credit helped commercial banks to improve their long-term operating performance, and had a significant effect on the overall core competence of the banking industry (Luo et al., 2021). However, this also is brought stress to banks (Wright and Rwabizambuga, 2006).
2.2 Method Selection
The DEA method has been widely used in energy efficiency and environment efficiency. In energy efficiency, Han et al. (2015) analyzed energy efficiency for ethylene production systems in chemical industry based on the DEA model. In environment efficiency, Bian and Yang (2010) extended Shannon-DEA procedure to comprehensively measure resource and environment efficiencies. Sueyoshi et al. (2017) pointed out that it is important for China to evaluate environmental peformances by using DEA model to its energy policy, environmental policy, and economic planning. Therefore, the DEA method is also very commonly applied in China’s efficiency analysis in recent years, especially in green economic efficiency. Shuai and Fan (2020) applied the super-efficient DEA model to measure China’s green economy efficiency and further examined the impact of environmental regulations on China’s green economic efficiency. Wu D. et al. (2020) used the DEA method to evaluate green economic efficiency in Chinese regions and analyze its dynamic evolution based on panel data from 2008 to 2017. Song et al. (2021) who employed the super-efficiency data envelopment analysis (DEA) and spatial econometric model, found that green credit could improve high-efficiency utilization of energy. Moreover, there are some other studies also on green innovation efficiency (Li and Zeng, 2020; Lv et al., 2021).
Tone (2004) and Zhou et al. (2006) extended the SBM-DEA model to incorporate undesirable outputs. Therefore. some studies began to consider the impact of unexpected outputs in analyzing energy efficiency (Honma and Hu, 2008; Zhang C. et al., 2011; Wu H. et al., 2020; Dong et al., 2021; Duan et al., 2021; Zhou and Li, 2021a) and environmental efficiency (Chen and Jia, 2017). In general, the undesirable outputs refer to the amount of carbon dioxide emission, chemical and pollution substances, and various types of waste discharges (Sueyoshi et al., 2017). For example, Bian et al. (2013) used carbon dioxide as an undesired output to test the potential energy saving and carbon dioxide emission reduction of provinces in China based on the DEA model. Wang et al. (2021) chose sulfur dioxide and carbon dioxide as unexpected output in this study and applied the DEA model to evaluate regional energy efficiency of China based on data from 2007 to 2019. Therefore, we also incorporate the amount of carbon dioxide emission as the undesirable output in this paper.
We found that although there has been a growing number of studies on green finance in recent years, most of them focus on the impact of developing green credit. However, It still has space to explore. For example, the few studies have directly analyzed the potential influencing factors of green credit efficiency in Chinese commercial banks. As a response, in this article, we investigate the green credit efficiency in Chinese commercial banks based on the Undesirable-SBM-DEA model and analyze its influencing factors applying the Tobit panel model. It would be more helpful for China to develop green credit, which will ensure that it achieved the carbon dioxide peaking and carbon neutrality goals as planned.
3 Research Hypothesis
Commercial banks need to assess borrowers’ environmental performances and redeign the loan requirements when implementing green credits. Therefore, green credit involves many subsquence evaluation activites, such as project management, qualification, post-loan management, among many others. These require a great deal of capital, which increase the operating cost for the commercial banks. Moreover, implementing green credit will make commercial banks lose some original customers because of limited credit capital. This will affect their profit. If commercial banks are profit seekers, they may delay provide green credits. However, the commercial banks with higher profitability have stronger awareness of social responsibility and actively to develop green credit (Yin et al., 2021). These banks also have relatively mature management systems and have lots of technical experience, which is better for reducing the costs associated with trial and error and improving green credit efficiency for them. Yin et al. (2021), who took 20 banks in China from 2011 to 2018, pointed out that commercial banks with higher profitability will expand the capital scale of green credit. Based on the above analysis, we select return on assets (ROA) to represent the profitability of commercial banks and propose the following hypotheses:
H1: The profitability of Chinese commercial banks will affect green credit efficiency.
The loan scale is representative by the loan-deposit ratio (LTD), will affect the capital available for green credit businesses in commercial banks. Banks with high LTD ratios have less capital to invest in green credit, because most of their capitals have been already invested in other areas, which will affect their green credit efficiency eventually. The capital adequacy ratio reflects the risk tolerance of commercial banks. The higher the capital adequacy ratio, the stronger is their risk-resistance capacity. One of the reasons for commercial banks to develop green credit is to avoid environmental risks (Campiglio et al., 2018). Therefore, a bank with a higher capital adequacy ratio may have stronger risk-resistance capacity and delay implementing green credit businesses, which will affect green credit efficiency. Meanwhile, bank’s scale will also affect green credit efficiency. Commercial banks with larger scales, which have sufficient credit capital resources, can provide more green credit capitals. Combined with the above analysis, we observe that all kinds of commercial banks do not improve green credit at the same time (Deng et al., 2022a). It is particularly noteworthy that urban or rural commercial banks starting late and lack enough experience in identifying green projects (Luo et al., 2021), will affect green credit efficiency. Based on the above analysis, we propose the following hypotheses:
H2: The loan-deposit ratio of Chinese commercial banks will affect its green credit efficiency.
H3: The capital adequacy ratio of Chinese commercial banks will affect its green credit efficiency.
H4: The total assets of Chinese commercial banks will affect its green credit efficiency.
Green credit efficiency not only reflects the profitability, safety, and liquidity of banks but also increase their environmental benefits. Commercial banks can optimize the structure of borrowers and reduce environmental risks by reducing the scale of credit for polluting companies and increasing it for green companies (Yao et al., 2021). The former may be penalized for created environmental problems, which may lead to their failures to repay the loans and, as a result, bringing credit risks. Therefore, optimizing their customers’ structures can reduce the credit risks of commercial banks.
Moreover, with the continuously stronger of social environmental awareness, commercial banks actively undertake social responsibilities and develop green credit businesses, which can improve their reputation (Zhou et al., 2021b). This can be benefits for the core competitiveness and profitability of commercial banks (Luo et al., 2021). In addition, with the increasingly homogenization of commercial bank businesses, the banks also create more intermediary business and credit products relating to green credits, which could bring new profit growth drivers and improve their financial performances (Jatana and Jain, 2020). Based on the above analysis, we propose the following hypothesis:
H5: Improving green credit efficiency can improve the profitability of banks.
4 Empirical Strategy
4.1 Method
There are many methods to evaluate banks’ efficiency. The frontier analysis method is the main methodology used to analyze efficiency and can be divided into the parametric and non-parametric approaches. The former is estimated efficiency frontier through statistical methods, whereas the latter generated efficiency frontier through linear programming without considering random influence. Charnes, Cooper and Rhodes (1978) first used mathematical programming to apply the data envelopment analysis (DEA) method in the computable non-parametric method. Scholars also developed the DEA model, such as Constant Returns to Scale (CRS) model, Variable Returns to Scale (VRS) model, Slack-Based Measure-Data Envelopment Analysis (SBM).
Furthermore, the profits of commercial banks are from interest and non-interest incomes, and it is difficult to describe it by the production function. Moreover, the main purpose of green credit is to reduce carbon emissions through capital allocation. If commercial banks blindly expand the scale of green credit capital without monitoring, the carbon emissions may continue to increase, which obviously violates the purpose of green credit. While evaluating the green credit efficiency of commercial banks, we choose the amount of carbon emissions representing the undesirable output index in the method of efficiency evaluation. Therefore, the Undesirable-SBM-DEA model is the most appropriate approach to reach our research objective. The specific model is as follows:
We consider a production possibility set containing undesirable output:
where x denotes the input,
where
4.2 Econometric Model
4.2.1 Empirical Analysis on the Influencing Factors of Green Credit Efficiency in Chinese Commercial Banks
According to our research hypothesis, Eq. 3 is our basic regression specification, which tests the influence of various factors on green credit efficiency, as follows:
where,
4.2.2 Empirical Analysis on the Impact of Green Credit Efficiency on Profitability in Chinese Commercial Banks
According to the research hypothesis, Eq. 4 is also our basic regression specification, which analyses the impact of green credit efficiency on the profitability of the commercial banks.
where,
4.3 Variable Selection
Because most of Chinese commercial banks did not disclose their private green credit information, we collected 42 commercial banks’ data after checking all the available information for listed commercial banks’ financial and social responsibility reports. Our observations include six state-owned commercial banks, twelve joint stock commercial banks, and sixteen urban and rural commercial banks from 2009 to 2019. The data is collected from the RESSET data source and commercial bank corporate social responsibility reports.
4.3.1 Green Credit Efficiency Index System
The main purpose of green credit is to control environmental pollution and guide companies to reduce carbon emissions. In order to evaluate the banks’ green credit efficiency, we should consider their economic outputs and the environmental benefits they aim to. No matter how environment friendly companies are, they are all directly or indirectly responsible for carbon emissions. Therefore, we are going to use carbon as the proxy variable to measure the impact of green credit on the environment.
Taking into consideration the current amount of green credit capital, we used the mean of the beginning balance and the ending balance from the commercial banks. Besides providing green credit, commercial banks also have a lot of investments in human capital and equipments to meet the daily operational needs. Therefore, we divided the operational input into three parts: human capital input, capital input, and daily operation input. We used their salaries and welfare payable to denote the human capital input index. Banks’ capital is used not only for issuing loans but also for investing in expansion to set up more branches. The local branches help banks know more about local companies, which contribut to develope the green credit businesses. Therefore, we chose fixed assets as the capital input index. We evaluated the daily operation input index as commission expenses and operating costs tied to the business and management of banks. Table 2 shows the details of the indexes.
Commercial banks should not consider the costs relating to emission reductions as their expenses for their profitability. Thus, we chose net profits as the earning capacity index. It reflects the deposit and loan income, intermediate business income, ability to control cost, and performance levels of commercial banks.
However, Chinese commercial banks do not provide information regarding to all credit capital. They still offer loans to resource-intensive industries with high pollutions and high energy consumptions and industries with overcapacities (two high and one surplus4). These industries emit a large amount of carbon while carrying forward their productions and operations, which will have negative externality in the environment. In addition, the capital available for lending is limited, because the credit capital mainly comes from account holders’ deposits. Therefore, commercial banks should focus on reducing carbon emissions resulting from lending to two high and one surplus industries. Thus, we referred to Bian et al. (2013) to calculate carbon emissions and considered more different types of fossil energies.
The calculation of carbon emissions was based on the measurement method issued by the Intergovernmental Panel on Climate Change (IPCC):
where i was the fossil fuel type of carbonaceous material,
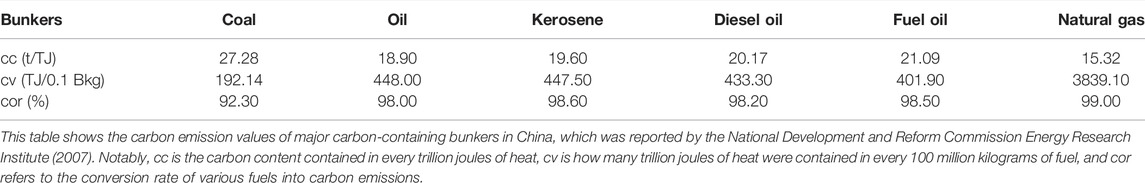
TABLE 1. Carbon emission values of major carbon-containing bunkers in China.
The above was the measurement method of the total carbon emissions per year. Then, the following is about how to measure the annual indirect carbon emissions for each bank. We selected the loan balance of “two high and one surplus” industries to calculate the ratio of each bank, accounting for all banks5. Then, we multiplied this ratio by the total indirect annual carbon emissions of each bank. However, we also found that in the same year, the ratio of two high and one surplus loans multiplied by each bank was the same. Therefore, this paper selected the two high and one surplus loan amount instead, which did not appear to affect the efficiency calculation.
This table shows the carbon emission values of major carbon-containing bunkers in China, which was reported by the National Development and Reform Commission Energy Research Institute (2007). Notably, cc is the carbon content contained in every trillion joules of heat, cv is how many trillion joules of heat were contained in every 100 million kilograms of fuel, and cor refers to the conversion rate of various fuels into carbon emissions.
We obtained data on the balance of two high and one surplus in commercial banks and equated the amount of carbon emissions to that balance multiplied by the bank’s carbon emission intensity. Table 2 is for the specific calculation.
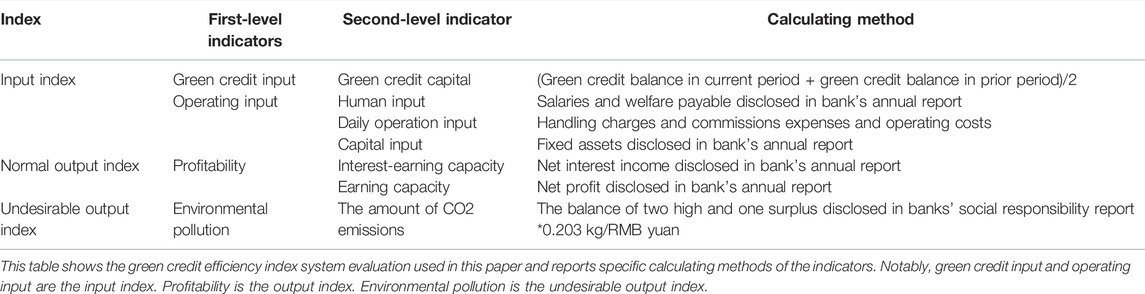
TABLE 2. Green credit efficiency index of commercial bank in China.
4.3.2 Variable Selection of the Empirical Analysis
The list of symbols about the empirical analysis on the impact of green credit efficiency is shown as Table 3.
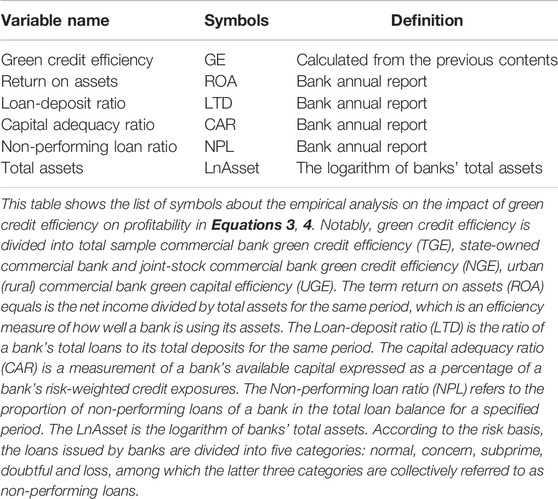
TABLE 3. List of symbols.
4.4 Data
4.4.1 Descriptive Statistics
Table 4 shows the descriptive statistical results of the data. According to the scale and nature of property rights, we classified Chinese commercial banks into three types: state-owned commercial banks (A), joint stock commercial banks (B), and urban(rural) commercial banks (C). Table 4 shows that the sample sizes of A, B, and C are 55, 68, and 84, respectively. Here, C accounts for a substantial proportion of Chinese commercial banks. The mean of A’s fixed assets is 138.9 billion RMB yuan, which is higher than B and C. The scale of Chinese commercial banks is in the following order: A > B > C.

TABLE 4. Descriptive Statistics of input-output Indicators from 2009 to 2019.
In addition, three types of commercial banks have obvious intraclass agglomeration in scale, which can also be found by comparing the payroll payable index and daily operation input index. There are obvious differences among the scale of various kinds of commercial banks. For the green credit capital, the mean of A, B, and C are 457.4 billion RMB yuan, 108.3 billion RMB yuan, and 10.12 billion RMB yuan, respectively. This data shows that although the sample size of A is the smallest, it provides the majority of green credit capital. Comparing the net interest income index and net profit index, we can find that the highest mean is A and the smallest mean is C. This shows that A has the best profitability, B is in the middle, and C is the worst. However, we can also observe the mean of the amount of carbon emissions. To elaborate, C only emits 27.97 million tons, which is far lower than A and B. In general, when A provides most of the green credit capital, the banks will emit a large amount of carbon. Thus, we cannot evaluate green credit efficiency by relying on descriptive statistics alone and need further analysis.
4.4.2 Correlation Analysis
We conducted a correlation analysis on banks’ LTD, CAR, NPL, LnAsset and ROA. Table 5 shows the results of this analysis. From the results, we can observe that the correlation between each regression variable is small and that there is no collinearity problem.
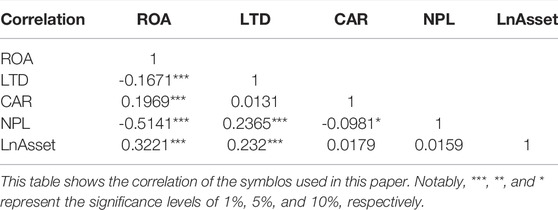
TABLE 5. Correlation analysis results.
5 Results and Discussion
5.1 Results of Green Credit Efficiency
5.1.1 Results of CRS
Due to the policy and geographical restrictions in operations, Chinese commercial banks cannot adjust their scale optionally. In this case, the results reflect green credit efficiency in the current state.
As shown in Table 6, the sample size has been increasing since 2009, which implies that Chinese commercial banks did not start to implement green credit at the same time. Comparing the sample size each year, we found that A implements green credit early, which is about 60% of the total sample. On the other hand, B and C start later. In the early stage of green credit implementation, some commercial banks did not realize its importance and take social responsibilities promptly. With the strict implementation of green credit policies carried out, commercial banks gradually had awareness of the climate change. At the same time, they have begun to gradually implement green credit for the purpose of meeting the needs of the policies.
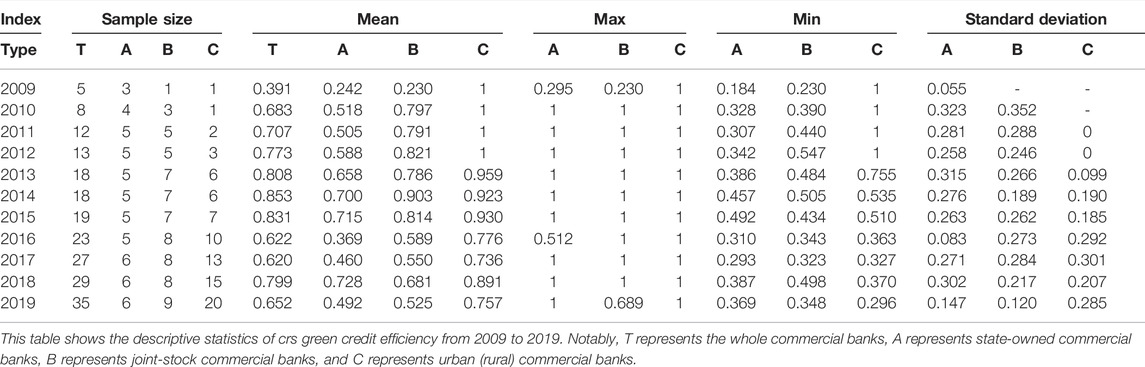
TABLE 6. Descriptive Statistics of crs green credit efficiency from 2009 to 2019.
In terms of the mean of whole sample (T), green credit efficiency gradually increased from 2009 to 2015 but started to decrease after 2015. In 2016, The People’s Bank of China issued the “Guidelines on Building a Green Financial System.” Chinese commercial banks have improved their requirements for a green credit business, resulting in the decline of green credit capital efficiency. We see that the efficiency mean of A is lower than the overall mean every year, but the efficiency mean of C is the highest. The average efficiency of C is 1 from 2009 to 2012, showing that C reached optimal efficiency. According to Table 6, A invested a large amount of green credit capital. However, that does not point towards the presence of high efficiency. Commercial banks cannot evaluate the implementation of green credit by relying on the scale alone. They should pay more attention to green credit efficiency and avoid “greenwashing.” The standard deviations of three types of commercial banks are all lower than 0.4, which indicates there is intraclass agglomeration in green credit efficiency.
5.1.2 Results of VRS
Assuming that the scale is variable, green credit efficiency reflects the banks’ ability to reduce carbon emissions. Table 7 summarizes the descriptive statistical results of green credit efficiency from 2009 to 2019 in the case of a variable scale.
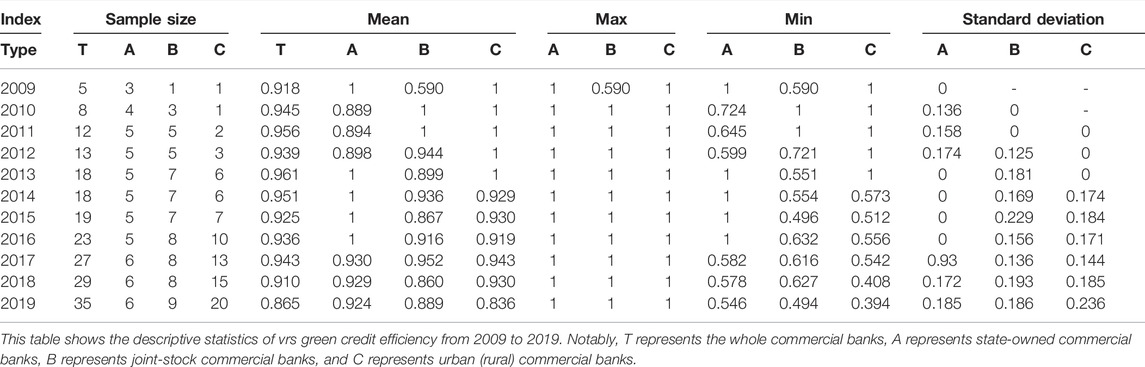
TABLE 7. Descriptive Statistics of vrs green credit efficiency from 2009 to 2019.
In Table 7, compared with Table 6, the mean, maximum, and minimum of three types of commercial banks have increased every year, which shows that all banks have the ability to accurately identify green projects and apply green credit capital for the reduction of carbon emissions. However, the mean of the whole sample is not equal to 1. This indicates Chinese commercial banks need to further improve green credit efficiency. Commercial banks that improved green credit later did not have enough experience in assessing the borrowers’ environmental performance and risks. They are also lack of the abilities to use their green credit capital, resulting in low green credit efficiency. With the sample size expanding, the new entrants lower the average efficiency. The standard deviation of three types of commercial banks is small every year, which is all lower than 0.3. The only exception to this is that A reached 0.97 in 2017. Therefore, the interclass difference is small in green credit efficiency.
5.2 Empirical Results on Influencing Factors of Green Credit Efficiency
According to Eq. 4, Table 8 presents the empirical results of the influencing factors of green credit efficiency in Chinese commercial banks.
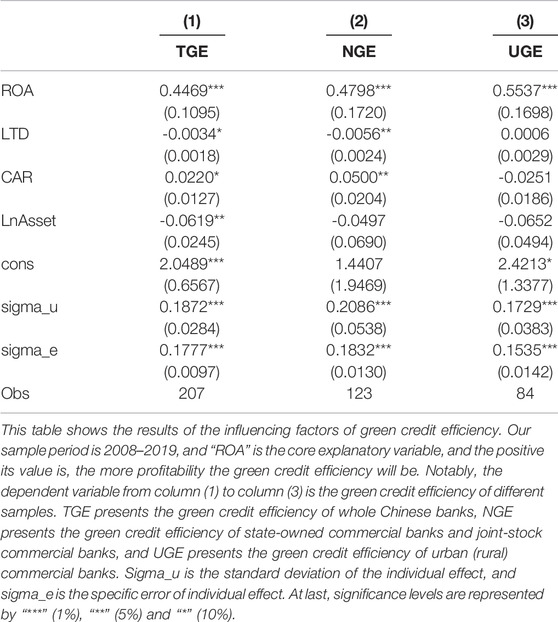
TABLE 8. Influencing factors of green credit efficiency in Chinese commercial banks.
Columns 1–3 of Table 8 shows that the coefficients of ROA are significantly positive at the 1% level. This implies that the profitability of Chinese commercial banks has a significant positive effect on green credit efficiency. The improvement of profitability improves commercial banks’ operating capacity. Commercial banks with higher profitability have sufficient capitals and the capacities to establish a more complete green credit review mechanisms, which makes it easier for them to invest limited green credit capital in the area of high carbon intensity reduction. The increasing of ROA means the increases of income earned by commercial banks per unit of assets. Higher capital operation efficiency of commercial banks will promote the improvement of green credit capital efficiency.
In Columns 1 and 2, the loan-deposit ratio is significantly negative at the level of at least 10%. This shows that for state-owned banks and joint stock banks, the increase of the loan-deposit ratio inhibits the improvement of green credit efficiency. The higher the current LTD, the commercial banks will invest less in new funds in green areas. As a result, the carbon reduction will be less effective. The LTD will have a negative impact on green credit efficiency. We found that the coefficients of CAR are significantly positive at the level of at least 10%. For state-owned banks and joint stock banks, improving CAR has a significantly positive effect on green credit efficiency.
Commercial banks with high CAR will pay more attention to safety in daily operations and choose green projects more carefully to prevent “greenwashing”, thus improving green credit quality and efficiency. The coefficient of LnAsset is significantly negative at the 5% level, which shows that total assets have significantly negative effects on the green credit efficiency of commercial banks. Commercial banks with larger total assets cannot quickly observe the transformation of credit capital, resulting in lower green credit efficiency. Compared to Column 1, the results in Columns 2 and 3 show that the total asset within the group has no statistical impacts on green credit efficiency, which may be caused by the fact that there is no significant difference in the total asset of the sample groups.
Table 9 reports the empirical results. Columns 1 to 3 showed that the coefficient of green credit efficiency is significantly positive at the 1% level. This shows that for the three types of commercial banks in this study, improving green credit efficiency is conducive to improve the profitability of commercial banks. Combined with Table 9, we found that green credit efficiency and banks’ profitability has positively relationship with each other. The positive externality of green capital can help banks effectively to avoid environmental risks and improve profitability. As green development is addressed in Chinese national policies, banks with higher profitability could actively develop the green business, which will improve green credit efficiency. Columns 4–6 show that the above conclusions still hold unchanged after adding control variables.

TABLE 9. Impact of green credit efficiency on profitability in commercial banks.
The results of Tables 8, 9 show that after adding the control variables, there is a mutually reinforcing relationship between the efficiency and profitability of commercial banks’ green credit funds. The improvement of the efficiency in green credit funds by commercial banks will improve the return on assets, and the improvement of the return on assets will largely increase the green credit funds of commercial banks. However, as financial intermediaries, the capital efficiency of the commercial bank is not only related to their own inputs and outputs but also closely related to the borrowers of the funds. The production and operation behaviors of the enterprises will have direct impact on the greenhouse gas emissions, such as carbon dioxide, and generating environmental costs, which will further affect the level of risk faced by enterprises. This will eventually be reflected in the repayment ability of the enterprise. The conclusion only shows that the limited investments of green credit funds by commercial banks will lead to increase the current income. Specifically, the efficiency of the green credit funds of commercial banks can improve the profit level but the efficiency of green credit funds needs to be further measured broadly.
6 Conclusion
This study constructed an evaluation system of green credit efficiency in Chinese commercial banks and comprehensively analyzed the green credit efficiency. Moreover, we analyzed the factors that affected green credit efficiency and the approaches of the green credit efficiency of Chinese commercial banks can be improved.
The results are as follows: First, the Chinese commercial banks present low level of efficiencies in green credits investments. State-owned commercial banks invested a large amount of green credit capital, but the green credit efficiency is the lowest. Blindly expanding the amount of green credit capital is incapable of improving green credit efficiency. Moreover, if the scale is flexbility, the three types of the commcerical banks will improve in the green credit’s efficiency. It all depends on whether the commercial banks can refine their abilities to accurately identify green projects and truly implement green credit capital. Second, there are many factors affecting China’s green credit efficiency. There is a significant mutual positive relationship between green credit efficiency and profitability in Chinese commercial banks. For state-owned banks and joint-stock banks, the CAR has a significantly positive effect on green credit efficiency, while the loan-deposit ratio has a negative effect on efficiency. The total assets has a significantly negative effect on the green credit efficiency in Chinese commercial banks. The limitation of the research is the Undesirable-SBM-DEA model we used involves a static analysis and cannot analyze the changes in the efficiency of the bank itself. This question would entail an interesting and relevant endeavor that we will leave for future research.
Data Availability Statement
Publicly available datasets were analyzed in this study. This data can be found here: Wind database.
Author Contributions
XD: Conceptualization, Data Analysis, Writing—Original draft preparation, Methodology. HH: Data Collection, Data Analysis. MC: Software, Writing—Original draft preparation. XR: Conceptualization, Supervision, Writing—Editing and Writing—Reviewing. LW: Writing—Editing.
Funding
This paper was funded by the National Social Science Foundation of China under grant No. 16ZDA034, the Minister of Education of China New Liberal Art Research and Practice of Reform Project under grant No. 2021100064, the Minister of Education of China Industry-University Cooperative Education Project under grant No. 202102057010, the Fundamental Research Funds for the Central Universities, Zhongnan University of Economics and Law under grant No. 2722021AJ015.
Conflict of Interest
The authors declare that the research was conducted in the absence of any commercial or financial relationships that could be construed as a potential conflict of interest.
Publisher’s Note
All claims expressed in this article are solely those of the authors and do not necessarily represent those of their affiliated organizations, or those of the publisher, the editors and the reviewers. Any product that may be evaluated in this article, or claim that may be made by its manufacturer, is not guaranteed or endorsed by the publisher.
Footnotes
1Source: “Statistical Report on Loan Investment of Financial Institutions in 2021” released by the People’s Bank of China
2NGFS denotes for Network for Greening the Financial System.
3Notably,
4The two high industries refer to resource-intensive industries with high pollution and high energy consumption, and the one surplus refer to industries with overcapacity. It mainly includes steel, paper, electrolytic aluminum, flat glass, wind power and photovoltaic industries. The specific classification can be found in the “Green Credit Guidelines”.
5These banks Include: PingAn Bank; Zhongyuan Bank; Guangzhou Rural Commercial Bank; Tianjin City Commercial Bank; Jiangxi Bank; Bank of Ningbo; Bank of Zhengzhou; Bank of Qingdao; Bank of Suzhou; HuiShang Bank; Harbin Bank; Bank of Jiujiang; Shanghai Pudong Development Bank; Huaxia Bank; China Minsheng Bank; China Merchants Bank; Wuxi Rural Commercial Bank; Bank of Jiangsu; Bank Of Hangzhou; Bank of Xi’an; Bank of Nanjing; Chongqing Rural Commercial Bank; Industrial Bank; Bank of Shanghai; Agricultural Bank of China; Bank of Communications; Industrial and Commercial Bank of China; Bank of Changsha; Postal Savings Bank of China; China everbright bank; China zheshang bank; China Construction Bank; Bank of China; Bank of Guiyang; China CITIC Bank.
References
Bian, Y., He, P., and Xu, H. (2013). Estimation of Potential Energy Saving and Carbon Dioxide Emission Reduction in China Based on an Extended Non-Radial DEA Approach. Energy Policy 63, 962–971. doi:10.1016/j.enpol.2013.08.051
Bian, Y., and Yang, F. (2010). Resource and Environment Efficiency Analysis of Provinces in China: A DEA Approach Based on Shannon's Entropy. Energy Policy 38 (4), 1909–1917. doi:10.1016/j.enpol.2009.11.071
Campiglio, E., Dafermos, Y., Monnin, P., Ryan-Collins, J., Schotten, G., and Tanaka, M. (2018). Climate Change Challenges for Central Banks and Financial Regulators. Nat. Clim. Change 8 (6), 462–468. doi:10.1038/s41558-018-0175-0
Charnes, A., Cooper, W. W., and Rhodes, E. (1978). Measuring the Efficiency of Decision Making Units. Eur. J. Oper. Res. 2 (6), 429–444. doi:10.1016/0377-2217(78)90138-8
Chen, L., and Jia, G. (2017). Environmental Efficiency Analysis of China's Regional Industry: A Data Envelopment Analysis (DEA) Based Approach. J. Clean. Prod. 142, 846–853. doi:10.1016/j.jclepro.2016.01.045
Chenet, H., Ryan-Collins, J., and van Lerven, F. (2021). Finance, Climate-Change and Radical Uncertainty: Towards a Precautionary Approach to Financial Policy. Ecol. Econ. 183, 106957. doi:10.1016/j.ecolecon.2021.106957
Cilliers, E. J., Diemont, E., Stobbelaar, D. J., and Timmermans, W. (2011). Sustainable Green Urban Planning: the Workbench Spatial Quality Method. J. Place Manag. Dev. 4, 214–224. doi:10.1108/17538331111153197
Deng, X., Huang, B., Zheng, Q., and Ren, X. (2022b). Can Environmental Governance and Corporate Performance Be Balanced in the Context of Carbon Neutrality? A Quasi-Natural Experiment of Central Environmental Inspections. Front. Energy Res. 10, 852286. doi:10.3389/fenrg.2022.852286
Deng, X., Wu, Y. L., Wang, J., and Wang, P. (2022a). Construction and Measurement of Green Finance Development Index System of Commercial Banks. Statistics Decis. 9, 138–142. doi:10.13546/j.cnki.tjyjc.2022.09.027
Dietz, S., Bowen, A., Dixon, C., and Gradwell, P. (2016). 'Climate Value at Risk' of Global Financial Assets. Nat. Clim. Change 6 (7), 676–679. doi:10.1038/nclimate2972
Dikau, S., and Volz, U. (2021). Central Bank Mandates, Sustainability Objectives and the Promotion of Green Finance. Ecol. Econ. 184, 107022. doi:10.1016/j.ecolecon.2021.107022
Dong, K., Dong, X., and Ren, X. (2020). Can Expanding Natural Gas Infrastructure Mitigate CO2 Emissions? Analysis of Heterogeneous and Mediation Effects for China. Energy Econ. 90, 104830. doi:10.1016/j.eneco.2020.104830
Dong, K., Ren, X., and Zhao, J. (2021). How Does Low-Carbon Energy Transition Alleviate Energy Poverty in China? A Nonparametric Panel Causality Analysis. Energy Econ. 103, 105620. doi:10.1016/j.eneco.2021.105620
Dong, K., Wang, B., Zhao, J., and Taghizadeh-Hesary, F. (2022). Mitigating Carbon Emissions by Accelerating Green Growth in China. Econ. Analysis Policy 75, 226–243. doi:10.1016/j.eap.2022.05.011
Dou, Y., Li, Y., Dong, K., and Ren, X. (2022). Dynamic Linkages between Economic Policy Uncertainty and the Carbon Futures Market: Does Covid-19 Pandemic Matter? Resour. Policy 75, 102455. doi:10.1016/j.resourpol.2021.102455
Duan, K., Ren, X., Shi, Y., Mishra, T., and Yan, C. (2021). The Marginal Impacts of Energy Prices on Carbon Price Variations: Evidence from a Quantile-On-Quantile Approach. Energy Econ. 95, 105131. doi:10.1016/j.eneco.2021.105131
Han, Y., Geng, Z., Zhu, Q., and Qu, Y. (2015). Energy Efficiency Analysis Method Based on Fuzzy DEA Cross-Model for Ethylene Production Systems in Chemical Industry. Energy 83, 685–695. doi:10.1016/j.energy.2015.02.078
He, L., Zhang, L., Zhong, Z., Wang, D., and Wang, F. (2019). Green Credit, Renewable Energy Investment and Green Economy Development: Empirical Analysis Based on 150 Listed Companies of China. J. Clean. Prod. 208, 363–372. doi:10.1016/j.jclepro.2018.10.119
Honma, S., and Hu, J.-L. (2008). Total-Factor Energy Efficiency of Regions in Japan. Energy Policy 36 (2), 821–833. doi:10.1016/j.enpol.2007.10.026
Jatana, R., and Jain, H. (2020). Green Banking and Profitability: An Empirical Study of Indian Commercial Banks. Sumedha J. Manag. 9 (2), 14–27. doi:10.46454/sumedha/9.2.2020.2
Krueger, P., Sautner, Z., and Starks, L. T. (2020). The Importance of Climate Risks for Institutional Investors. Rev. Financial Stud. 33 (3), 1067–1111. doi:10.1093/rfs/hhz137
Li, D., and Zeng, T. (2020). Are China's Intensive Pollution Industries Greening? An Analysis Based on Green Innovation Efficiency. J. Clean. Prod. 259, 120901. doi:10.1016/j.jclepro.2020.120901
Luo, S., Yu, S., and Zhou, G. (2021). Does Green Credit Improve the Core Competence of Commercial Banks? Based on Quasi-Natural Experiments in China. Energy Econ. 100, 105335. doi:10.1016/j.eneco.2021.105335
Lv, C., Shao, C., and Lee, C.-C. (2021). Green Technology Innovation and Financial Development: Do Environmental Regulation and Innovation Output Matter? Energy Econ. 98, 105237. doi:10.1016/j.eneco.2021.105237
NGFS (Network for Greening the Financial System) (2019). Macroeconomic and Financial Stability: Implications of Climate Change. Technical Supplement to the First Comprehensive Report.
Puig, D., Olhoff, A., Bee, S., Dickson, B., and Alverson, K. (2016). The Adaptation Finance Gap Report. United Nations Avenue, Gigiri Nairobi, Kenya: United Nations Environment Programme.
Ren, X., Duan, K., Tao, L., Shi, Y., and Yan, C. (2022a). Carbon Prices Forecasting in Quantiles. Energy Econ. 108, 105862. doi:10.1016/j.eneco.2022.105862
Ren, X., Li, Y., Shahbaz, M., Dong, K., and Lu, Z. (2022b). Climate Risk and Corporate Environmental Performance: Empirical Evidence from China. Sustain. Prod. Consum. 30, 467–477. doi:10.1016/j.spc.2021.12.023
Ren, X., Li, Y., yan, C., Wen, F., and Lu, Z. (2022c). The Interrelationship between the Carbon Market and the Green Bonds Market: Evidence from Wavelet Quantile-On-Quantile Method. Technol. Forecast. Soc. Change 179, 121611. doi:10.1016/j.techfore.2022.121611
Rudebusch, G. D. (2021). Climate Change is a Source of Financial Risk. FRBSF Econ. Lett. 2021 (03), 01–06.
Semieniuk, G., Campiglio, E., Mercure, J. F., Volz, U., and Edwards, N. R. (2021). Low-Carbon Transition Risks for Finance. Wiley Interdiscip. Rev. Clim. Change 12 (1), e678. doi:10.1002/wcc.678
Shuai, S., and Fan, Z. (2020). Modeling the Role of Environmental Regulations in Regional Green Economy Efficiency of China: Empirical Evidence from Super Efficiency DEA-Tobit Model. J. Environ. Manag. 261, 110227. doi:10.1016/j.jenvman.2020.110227
Song, M., Xie, Q., and Shen, Z. (2021). Impact of Green Credit on High-Efficiency Utilization of Energy in China Considering Environmental Constraints. Energy Policy 153, 112267. doi:10.1016/j.enpol.2021.112267
Stroebel, J., and Wurgler, J. (2021). What Do You Think about Climate Finance? J. Financial Econ. 142 (2), 487–498. doi:10.1016/j.jfineco.2021.08.004
Sueyoshi, T., Yuan, Y., and Goto, M. (2017). A Literature Study for DEA Applied to Energy and Environment. Energy Econ. 62, 104–124. doi:10.1016/j.eneco.2016.11.006
Tian, C., Li, X., Xiao, L., and Zhu, B. (2022). Exploring the Impact of Green Credit Policy on Green Transformation of Heavy Polluting Industries. J. Clean. Prod. 335, 130257. doi:10.1016/j.jclepro.2021.130257
Thompson, P., and Cowton, C. J. (2004). Bringing the Environment Into Bank Lending: Implications for Environmental Reporting. Br. Account. Rev. 36 (2), 197–218.
Tone, K. (2004). Dealing with Undesirable Outputs in DEA: A Slacks-Based Measure (SBM) Approach. Toronto: Presentation At NAPW III, 44–45.
Wang, R., Wang, Q., and Yao, S. (2021). Evaluation and Difference Analysis of Regional Energy Efficiency in China under the Carbon Neutrality Targets: Insights from DEA and Theil Models. J. Environ. Manag. 293, 112958. doi:10.1016/j.jenvman.2021.112958
Wang, X., Wang, X., Ren, X., and Wen, F. (2022). Can Digital Financial Inclusion Affect CO2 Emissions of China at the Prefecture Level? Evidence from a Spatial Econometric Approach. Energy Econ. 109, 105966. doi:10.1016/j.eneco.2022.105966
Wen, F., Tong, X., and Ren, X. (2022). Gold or Bitcoin, Which is the Safe Haven during the COVID-19 Pandemic? Int. Rev. Financial Analysis 81, 102121. doi:10.1016/j.irfa.2022.102121
Wen, H., Lee, C.-C., and Zhou, F. (2021). Green Credit Policy, Credit Allocation Efficiency and Upgrade of Energy-Intensive Enterprises. Energy Econ. 94, 105099. doi:10.1016/j.eneco.2021.105099
Wright, C., and Rwabizambuga, A. (2006). Institutional Pressures, Corporate Reputation, and Voluntary Codes of Conduct: An Examination of the Equator Principles. Bus. Soc. Rev. 111 (1), 89–117. doi:10.1111/j.1467-8594.2006.00263.x
Wu, D., Wang, Y., and Qian, W. (2020a). Efficiency Evaluation and Dynamic Evolution of China's Regional Green Economy: A Method Based on the Super-PEBM Model and DEA Window Analysis. J. Clean. Prod. 264, 121630. doi:10.1016/j.jclepro.2020.121630
Wu, H., Hao, Y., and Ren, S. (2020b). How Do Environmental Regulation and Environmental Decentralization Affect Green Total Factor Energy Efficiency: Evidence from China. Energy Econ. 91, 104880. doi:10.1016/j.eneco.2020.104880
Yao, S., Pan, Y., Sensoy, A., Uddin, G. S., and Cheng, F. (2021). Green Credit Policy and Firm Performance: What We Learn from China. Energy Econ. 101, 105415. doi:10.1016/j.eneco.2021.105415
Yin, W., Zhu, Z., Kirkulak-Uludag, B., and Zhu, Y. (2021). The Determinants of Green Credit and its Impact on the Performance of Chinese Banks. J. Clean. Prod. 286, 124991. doi:10.1016/j.jclepro.2020.124991
Zhang, B., Yang, Y., and Bi, J. (2011a). Tracking the Implementation of Green Credit Policy in China: Top-Down Perspective and Bottom-Up Reform. J. Environ. Manag. 92 (4), 1321–1327. doi:10.1016/j.jenvman.2010.12.019
Zhang, C., Liu, H., Bressers, H. T. A., and Buchanan, K. S. (2011b). Productivity Growth and Environmental Regulations - Accounting for Undesirable Outputs: Analysis of China's Thirty Provincial Regions Using the Malmquist-Luenberger Index. Ecol. Econ. 70 (12), 2369–2379. doi:10.1016/j.ecolecon.2011.07.019
Zhang, K., Li, Y., Qi, Y., and Shao, S. (2021). Can Green Credit Policy Improve Environmental Quality? Evidence from China. J. Environ. Manag. 298, 113445. doi:10.1016/j.jenvman.2021.113445
Zhou, A., and Li, J. (2021a). Investigate the Impact of Market Reforms on the Improvement of Manufacturing Energy Efficiency under China's Provincial-Level Data. Energy 228, 120562. doi:10.1016/j.energy.2021.120562
Zhou, G., Sun, Y., Luo, S., and Liao, J. (2021b). Corporate Social Responsibility and Bank Financial Performance in China: The Moderating Role of Green Credit. Energy Econ. 97, 105190. doi:10.1016/j.eneco.2021.105190
Zhou, P., Ang, B. W., and Poh, K. L. (2006). Slacks-Based Efficiency Measures for Modeling Environmental Performance. Ecol. Econ. 60 (1), 111–118. doi:10.1016/j.ecolecon.2005.12.001
Keywords: green credit, capital efficiency, environmental performance, commercial banks, China
Citation: Deng X, Hao H, Chang M, Ren X and Wang L (2022) Influencing Factors of Green Credit Efficiency in Chinese Commercial Banks. Front. Environ. Sci. 10:941053. doi: 10.3389/fenvs.2022.941053
Received: 11 May 2022; Accepted: 16 June 2022;
Published: 08 July 2022.
Edited by:
Kangyin Dong, University of International Business and Economics, ChinaCopyright © 2022 Deng, Hao, Chang, Ren and Wang. This is an open-access article distributed under the terms of the Creative Commons Attribution License (CC BY). The use, distribution or reproduction in other forums is permitted, provided the original author(s) and the copyright owner(s) are credited and that the original publication in this journal is cited, in accordance with accepted academic practice. No use, distribution or reproduction is permitted which does not comply with these terms.
*Correspondence: Xiaohang Ren, domrxh@outlook.com